Article

Development of Pistachio Shell-Based Bioadsorbents Through Pyrolysis for CO2 Capture and H2S Removal

by
Alejandro Márquez Negro
1,2,*,
Verónica Martí
1,
José María Sánchez-Hervás
1 and
Isabel Ortiz
1
1
Unit for Sustainable Thermochemical Valorization, Energy Department, CIEMAT, 28040 Madrid, Spain
2
Department of Chemical Engineering and Materials, Faculty of Chemistry, Complutense University of Madrid (UCM), 28040 Madrid, Spain
*
Author to whom correspondence should be addressed.
Molecules 2025, 30(7), 1501; https://doi.org/10.3390/molecules30071501
Submission received: 16 January 2025 / Revised: 24 March 2025 / Accepted: 26 March 2025 / Published: 27 March 2025
(This article belongs to the Special Issue Design and Synthesis of Novel Adsorbents for Pollutant Removal)

Abstract

:
The development of sustainable waste management for environmental remediation has highlighted the potential of biochar produced from agricultural wastes as an effective adsorbent for gas pollutant capture. This work focuses on the production and activation of biochar derived from pistachio shells for CO2 and H2S adsorption. Adsorbents were obtained by pyrolysis and subsequently activated through two methods: chemical activation with KOH and physical activation with CO2. Adsorption studies were conducted to evaluate the influence of these activation methods on textural properties and adsorption capacities. Chemical activation enhanced microporosity and increased the specific surface area (531 m2/g), resulting in a better performance, obtaining adsorption capacities of 87 mgCO2/gadsorbent and 9.6 mgH2S/gadsorbent. Non-linear kinetic models were identified as the most suitable for fitting CO2 adsorption data, with the Avrami model presenting the best fit results. Dynamic H2S adsorption tests revealed the influence of moisture present in the adsorbent, favoring H2S dissociation and thus improving capture processes, especially when chemical activation biochar is employed. This enhancement is attributed to the greater development of active centers on its surface, including micropores and heterogeneous atoms introduced though impregnation.

Graphical Abstract

1. Introduction

Pyrolysis is a thermochemical process that could valorize several residues from diverse nature, including lignocellulosic biomass, plastics, textiles, etc. [1]. During the process, the feedstock is decomposed in the absence of oxygen, generally in an inert atmosphere (N2), at moderate temperatures between 300 and 900 °C. As a result, three main products are obtained: a solid material or biochar, the liquid fraction or bio-oil, and non-condensable gases. Product distribution depends on several operational parameters, including residence time, heating rate, pyrolysis temperature, and feedstock nature. If biochar is the objective product, slow heating rates and long residence times are required [2]. As a result, a carbon-rich solid with high surface area and porosity is obtained. However, its physicochemical properties are highly influenced by process conditions. Biochar can be further treated, through physical or chemical activation, to improve its adsorption properties.
In physical activation, biochar is subjected to a thermal treatment at high temperatures, but, in this case, under an oxidizing atmosphere, usually of CO2 or steam [3]. This process favors oxidation reactions that enhance pore formation, develop the porous structure, and increase its surface area [3]. On the other hand, chemical activation requires a chemical agent, which can be acid or alkali and is impregnated into the biochar. Afterwards, it is thermally treated at lower temperatures, compared to physical activation, between 500 and 700 °C in an inert atmosphere. During this step, the chemical agent penetrates into the carbon matrix, promoting further degradation of the volatile matter through dehydration reactions [4]. As a result, the increase in biochar’s porosity is achieved, particularly enhancing its microporous structure and incorporating functional groups and heteroatoms on its surface [5].
Many authors, instead of performing a two-stage activation process—first pyrolysis and then activation—carry out the activation directly on the sample and then pyrolyze it, which simplifies the process [4]. However, the main drawback, often overlooked, is that during pyrolysis, not only biochar is produced, but so are bio-oil and non-condensable gases. Bio-oil can be upgraded and used as an alternative fuel or as a platform for value-added chemicals [6]. However, when an activating agent is added, the resulting bio-oil may contain traces of the activating agent or derivatives, leading to bio-oil contamination and reducing the overall efficiency of the process.
Agricultural wastes have received significant attention as feedstock for biochar production due to their abundance and low cost. Pistachio was one of the fastest growing crops across the last decade in Spain. In 2022, the cultivated area of this crop exceeded 70,000 ha, representing a 3000% increase over the past decade [7]. This exponential growth is driven by high international and domestic demand, combined with favorable continental climates in certain regions of the country. The main residue generated in pistachio cultivation is the shell. This residue presents high carbon content, along with its high availability and low cost, which make it an ideal feedstock for biochar production [8].
In recent years, the use of biochar derived from biomass waste as a sorbent for aqueous pollutant removal has gained scientific interest. Kurunogly and Demi [9] investigated the potential of using biochar from pistachio shell (PS), providing a review of the developments made regarding adsorbing metals [10], dyes [11], and antibiotics [11] in aqueous solutions. However, few studies have focused on its application for the removal of atmospheric contaminants, especially H2S, which is present in numerous industrial processes. For instance, in anaerobic digestion, biogas must undergo an upgrading process prior in order to be suitable for its application. The use of bioadsorbents produced from waste would not only result in cost reductions but would also promote a circular economy, as the waste from one process serves as a raw material for another. In addition, biochar presents an alkaline nature, which can also enhance the capturing of acidic gases like CO2 and H2S [12]. Villardon et al. synthesized activated carbons from pistachio shell using single-step physical activation with steam as the activating agent and measured the CO2 adsorption capacity, achieving 2.81 mmolCO2/gadsorbent at 10 bar [13]. However, these high-pressure conditions are not optimal for CO2 capture from biogas, as this stream is typically at atmospheric pressure. Despite the extensive studies on CO2 capture via biomass-derived biochar adsorption, there is a limited number of studies that examine both CO2 and H2S adsorption capacities, and, to our knowledge, no studies have investigated the use of pistachio shell biochar (PSB) for this purpose.
Therefore, the aim of this study is to develop bioadsorbents from pistachio shell for CO2 and H2S capture, combining environmental and waste management benefits. The novelty of this study lies in the exploration of adsorption capacities for CO2 and H2S using bioadsorbents prepared by two different activation methods from biochar. Adsorbents were prepared through two activation methods: chemical activation with KOH solution and physical activation using CO2 as the activating agent. CO2 adsorption capacity was studied through static adsorption tests, where linear and non-linear kinetic models were employed to determine the adsorption kinetics parameters. For H2S capture, dynamic adsorption experiments were conducted, investigating the influence of moisture present in the adsorbents. The findings of this research will offer significant insights into the adsorption processes of CO2 and H2S on activated biochars.

2. Results and Discussion

2.1. Adsorbents Characterization

2.1.1. Elemental Analysis

Table 1 presents the elemental analysis of the different adsorbents studied. The results demonstrate that pyrolysis leads to an increase in the carbon content, from 46% in PS to 88% in PSB, reducing the oxygen content and also the hydrogen content. The activation methods also influence the carbon content of the adsorbent. While the chemical activation of pistachio shell biochar (PSB-CA) results in a decrease to 78%, physical activation (PSB-PA) leads to an increase in carbon, reaching up to 95% carbon in the adsorbent.
As temperature increases, the aromatization and hydrophobicity of the biochar also increase. Due to the removal of the polar functional groups from the surface through dehydration and decarboxylation reactions, a reduction in the O/C ratio is observed in the case of PSB-PA [14,15]. However, in PSB-CA, a slight increase in the O/C ratio is observed due to impregnation with KOH, which introduces oxygenated groups onto the surface.
All biochar-based adsorbents exhibit alkalinity, which could enhance their interaction with acid molecules such as CO2 or H2S. Regarding the yields, the char yield from PSB is 23%, with bio-oil forming a predominant fraction of the pyrolysis process. In addition, activation processes do not significantly reduce the overall solid yield, as they only result in a decrease of 3% for physical activation and 0.5% for chemical activation.

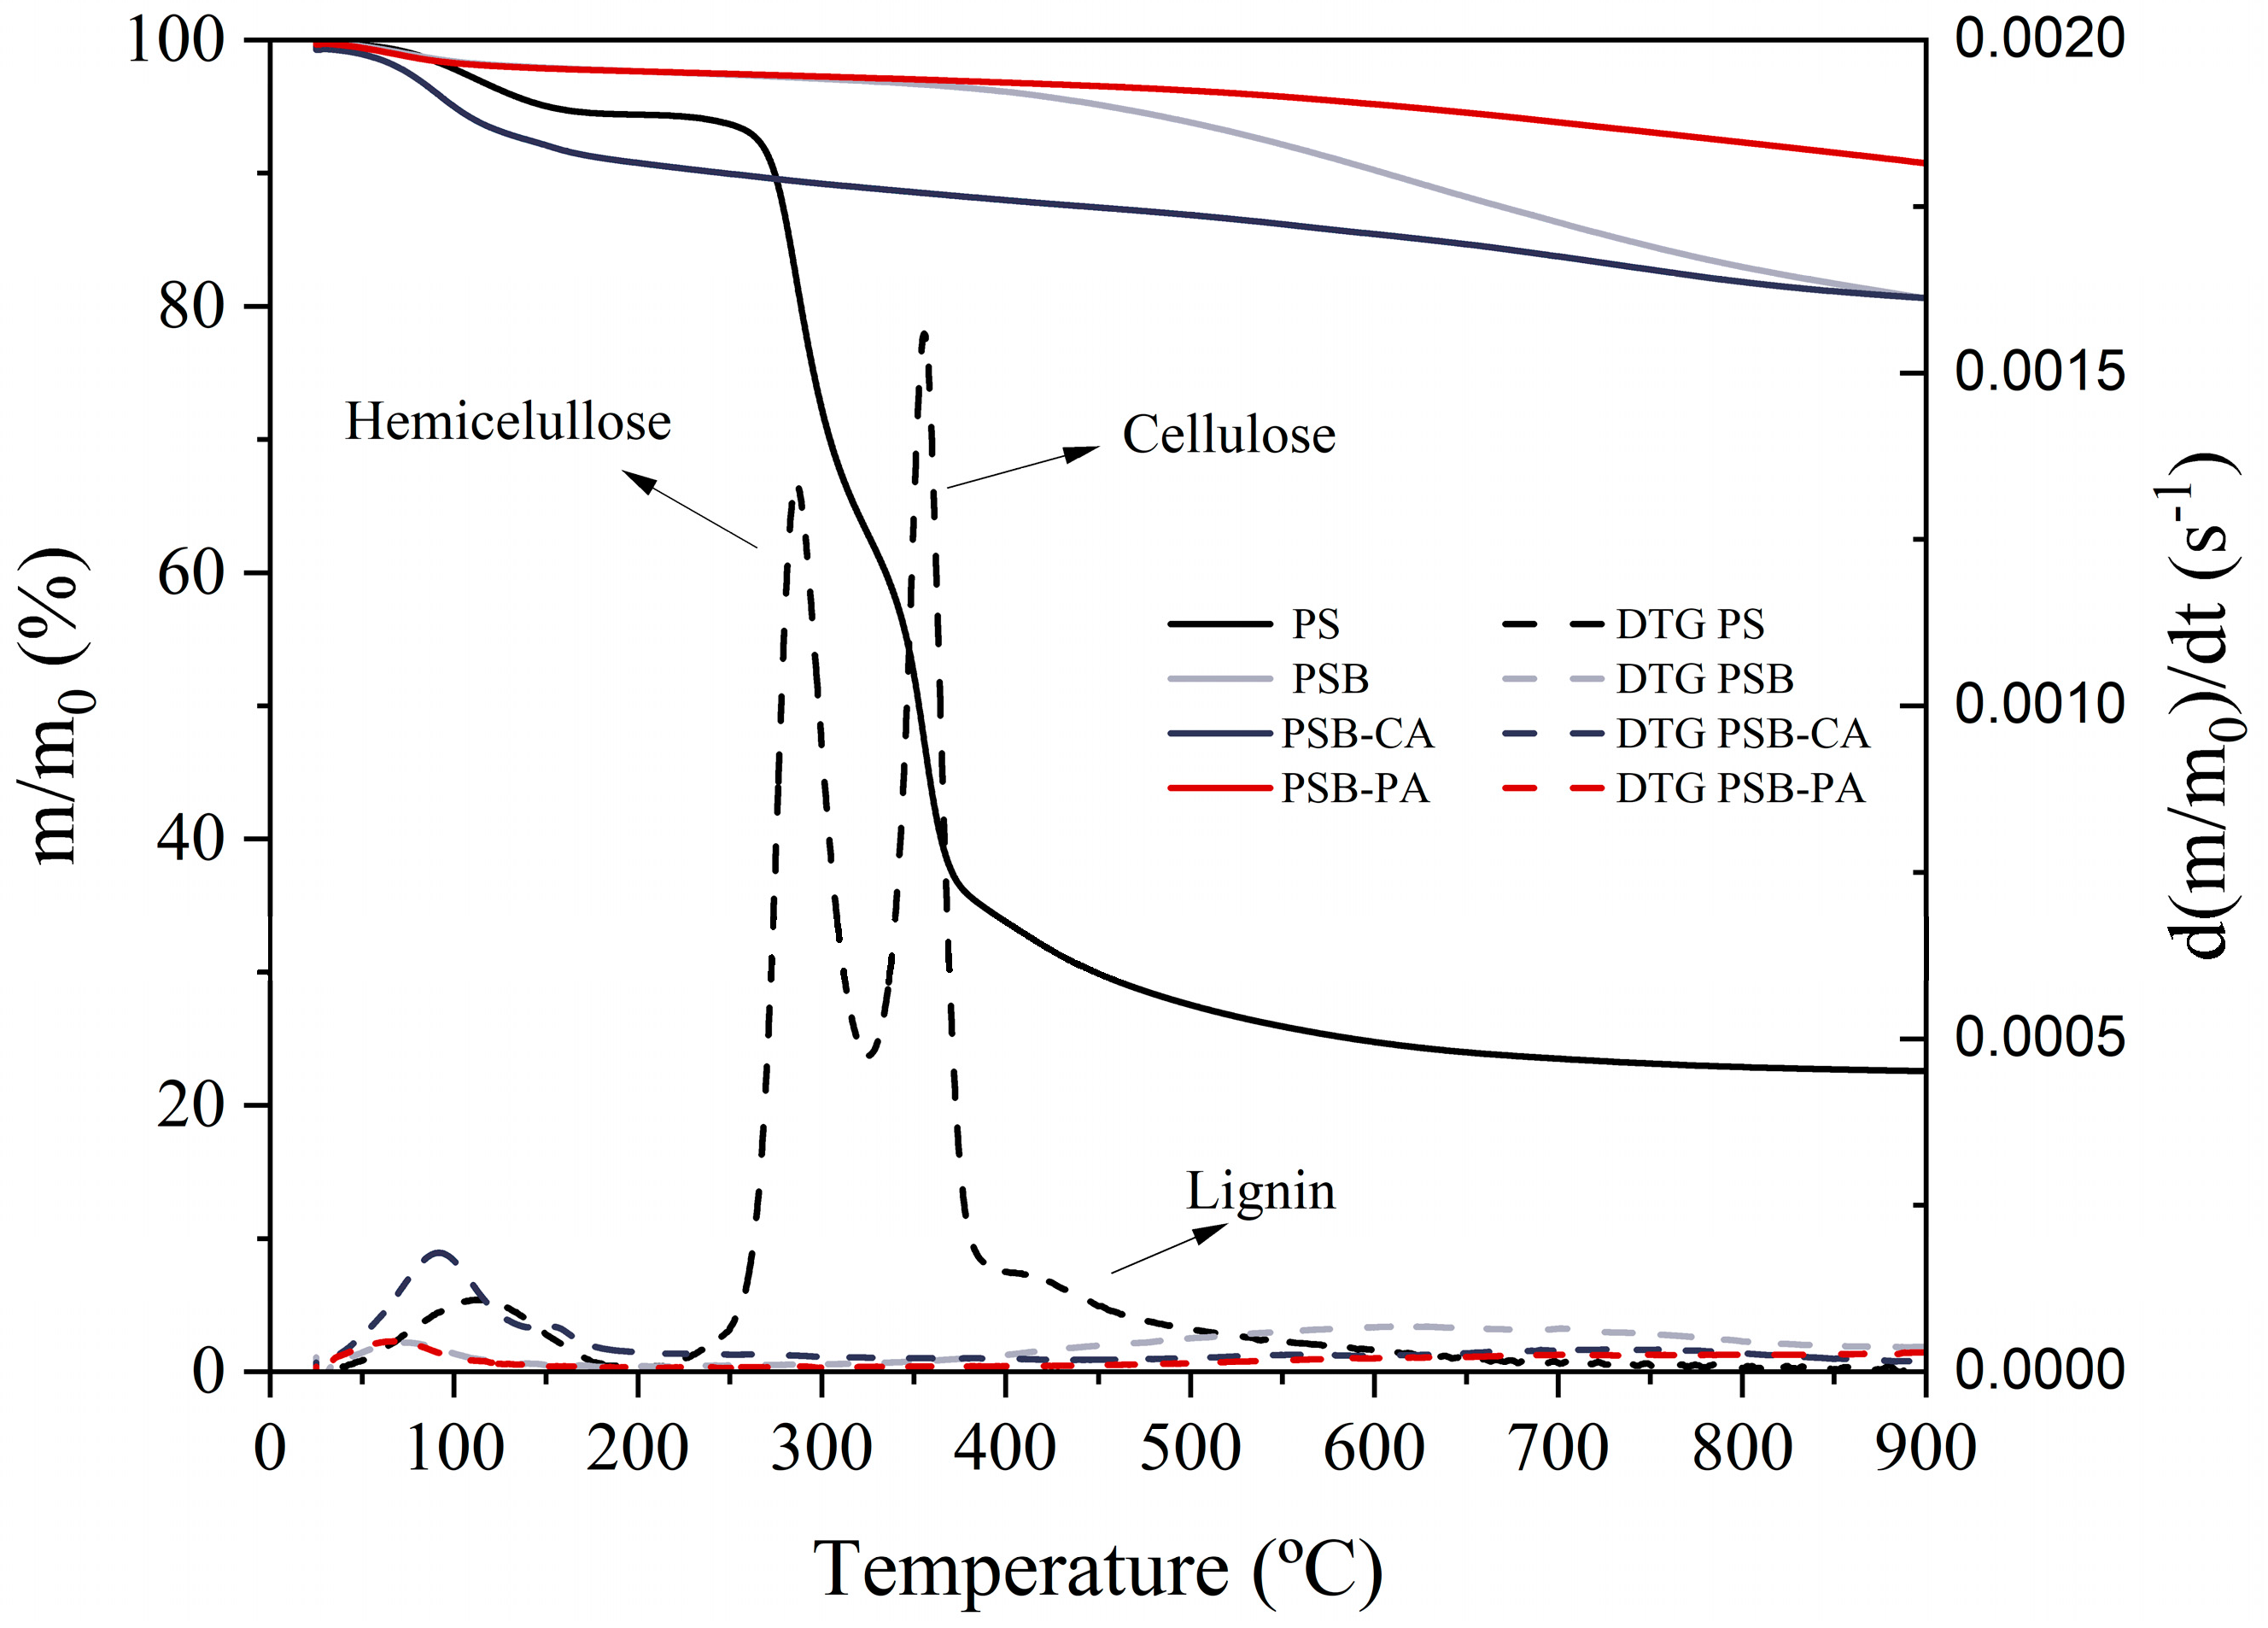
2.1.2. Thermal Stability
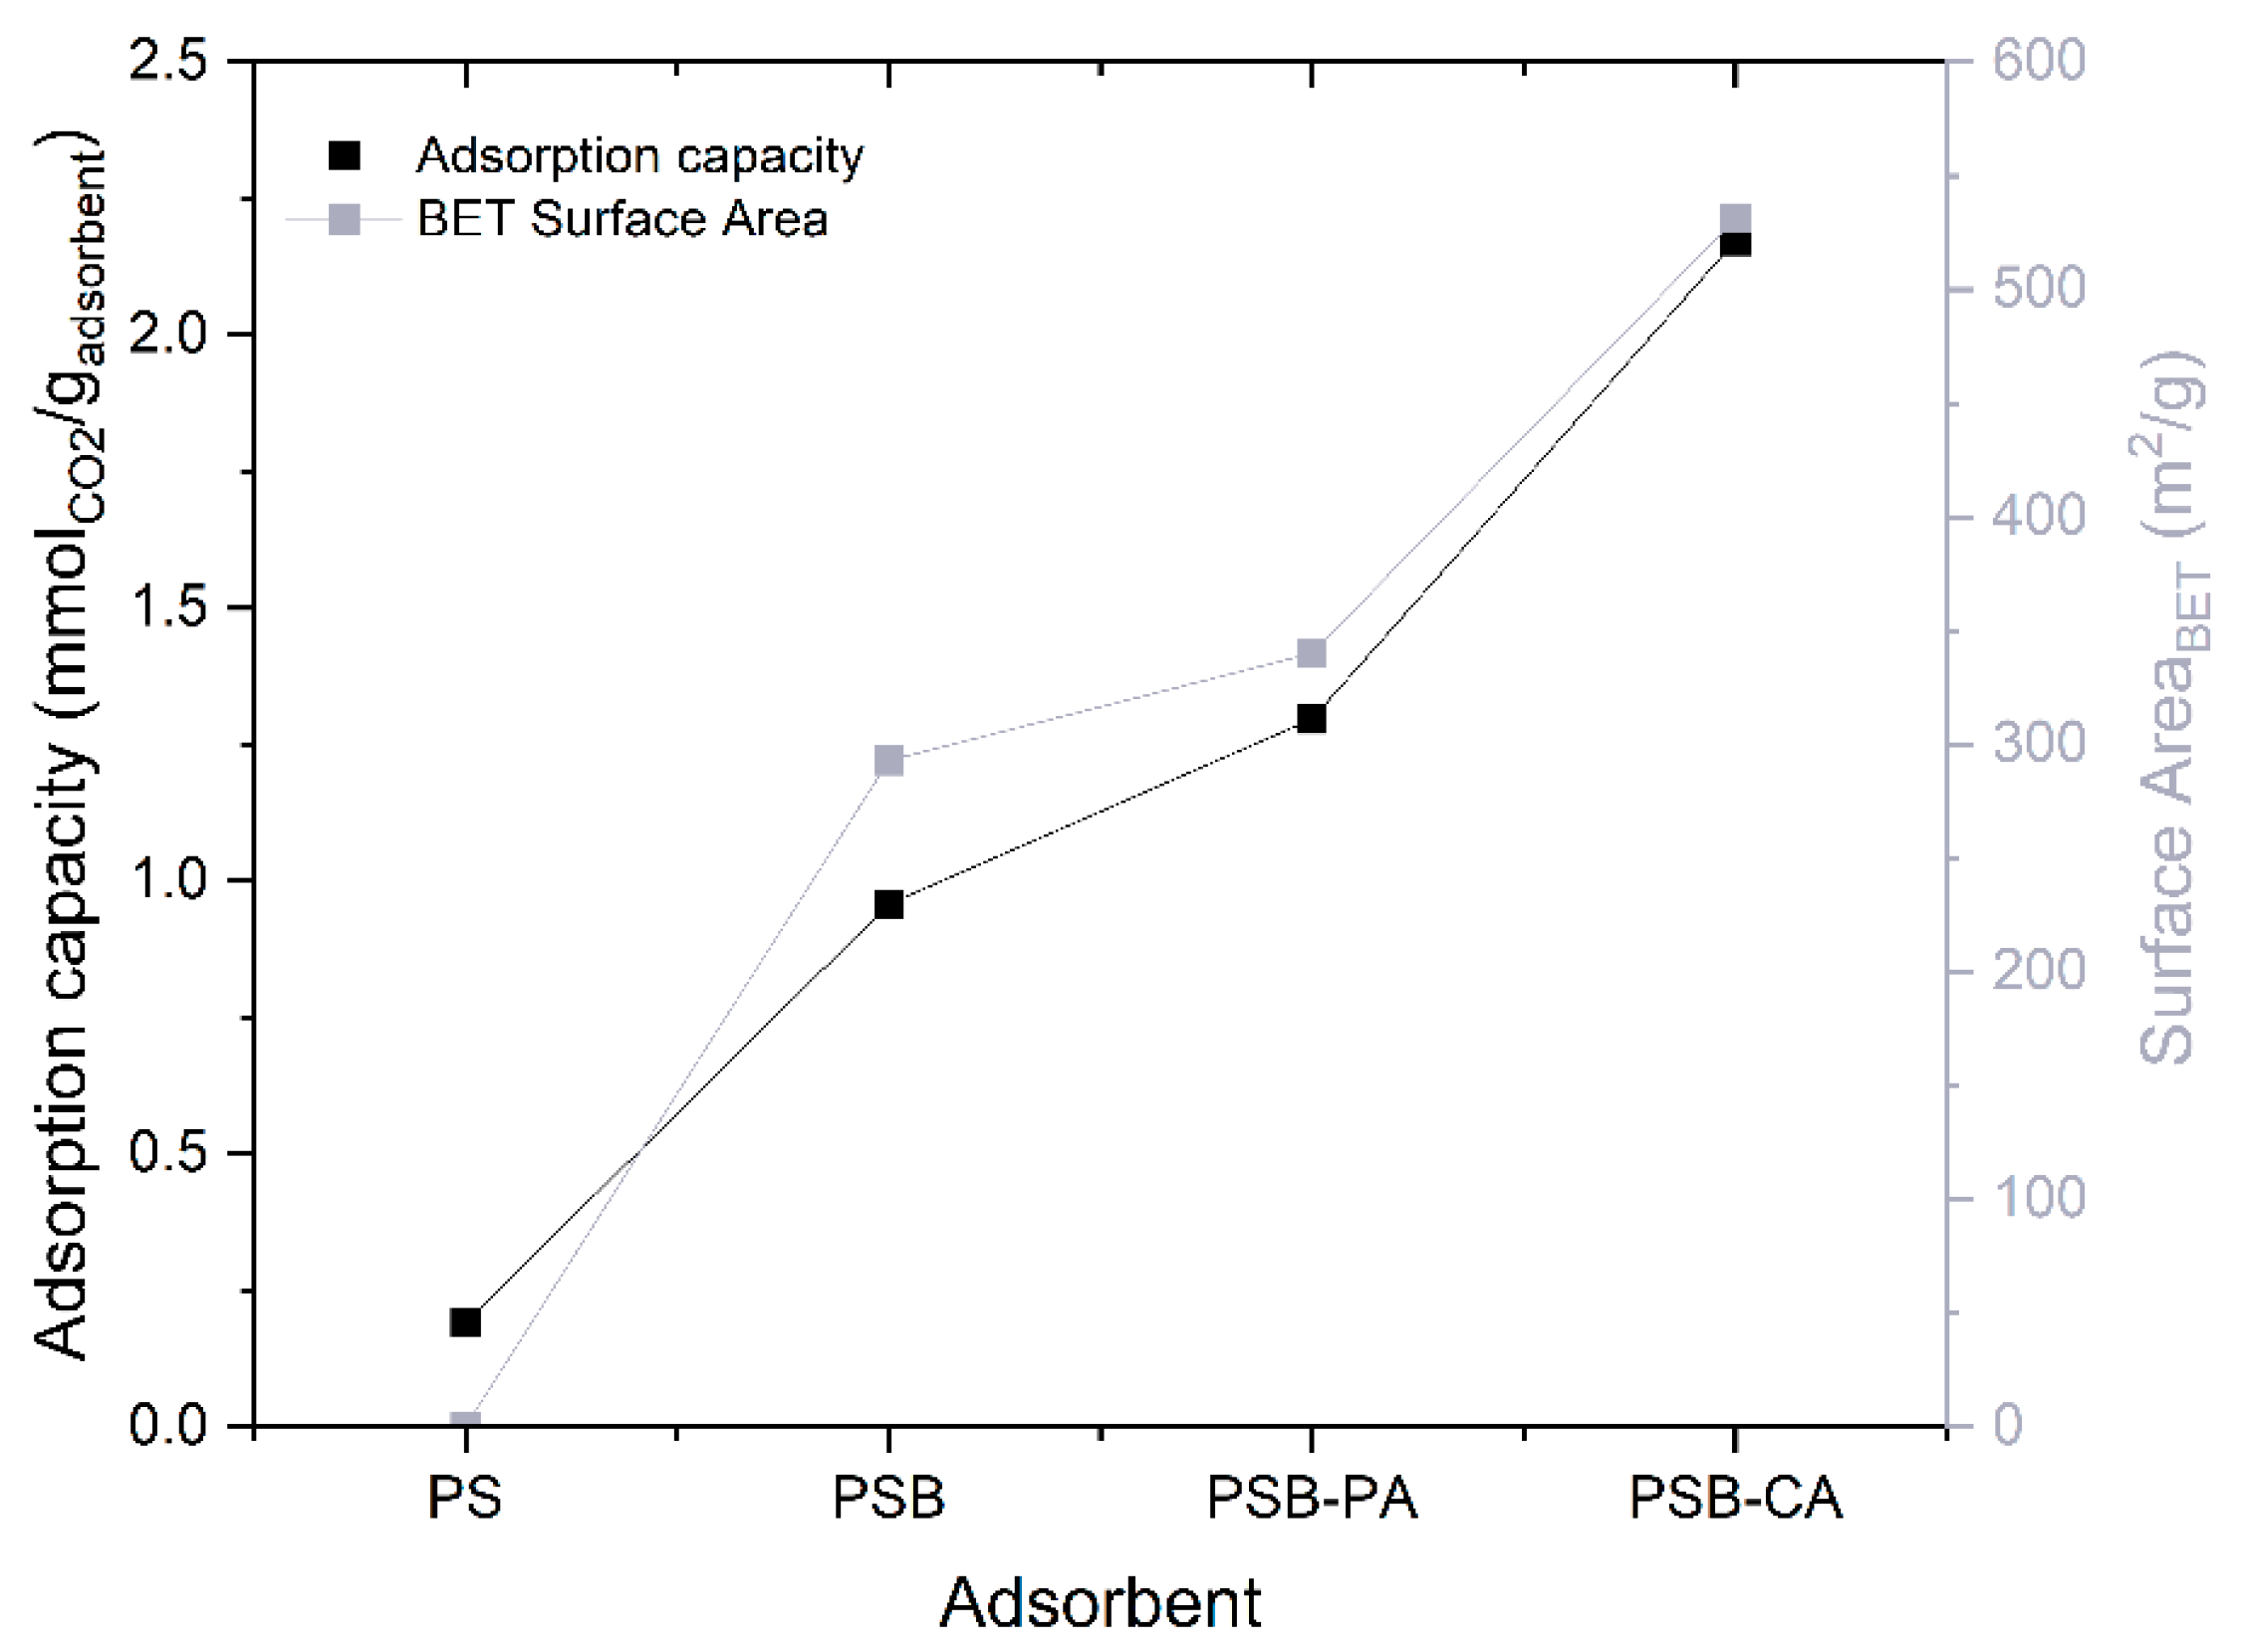
Figure 1 depicts the thermal stability of the adsorbents produced. The solid line shows the weight loss as a function of temperature (TG), while the DTG curve (dotted lines) represents the decomposition rate, which allows for the identification of the different degradation stages. In PS pyrolysis, four decomposition stages are revealed. First, the moisture loss occurs between 80 and 150 °C, with a weight loss of 5.5%. Subsequently, at 250 °C, the decomposition of hemicellulose begins, with the highest decomposition rate at 290 °C. This is followed by the degradation of cellulose (300–400 °C), reaching a maximum decomposition rate at 355 °C [16]. Finally, the decomposition of lignin is observed, with a small shoulder around 400 °C. However, lignin degradation occurs over a wide temperature range (250–550 °C), indicating that lignin degradation also takes place during the decomposition of cellulose and hemicellulose [17]. The adsorbents produced from PS exhibit high thermal stability. All samples present an initial stage of moisture and physisorbed compound loss at 80–120 °C, with the most significant mass loss observed for PSB-CA (≈8%). This result aligns with the findings of Fu et al., who attributed this phenomenon to the hygroscopic property of alkali potassium [18]. A second step follows, characterized by the volatilization of the char. The PSB sample shows a marked loss beginning at 450 °C, as this was the final pyrolysis temperature, and thus, the sample has not been exposed to higher temperatures.

2.1.3. Surface Area

Table 2 presents the results of the surface characterization of the adsorbents synthesized. PS presents a minimal porous structure, without any pore volume or micropores. The pyrolysis of the PS enhances its porosity and increases the Brunauer–Emmett–Teller (BET) surface area to 293 m2/g. A significant development of microporosity (Vp micro) is observed, reaching 0.14 cm3/g. Both activation methods further increase the BET surface area compared to PSB. PSB-CA presents the highest BET surface area (531 m2/g) and the greatest microporosity, with a micropore volume of 0.21 cm3/g (90% of the total volume). On the other hand, PSB-PA presents a slight increase in mesopore volume, with 53% of the pores, demonstrating the capacity of CO2 to enhance the mesoporosity of the adsorbents in physical activation [19]. The mesopore volume increment could be attributed to higher activation temperature, which promotes volatilization reactions, leading to micropore collapse and the formation of mesopores, thus following the same tendency reported by Hong et al. [20].
Additionally, N2 adsorption–desorption isotherms of the adsorbents are presented in Figure 2. According to the IUPAC classification, the N2 adsorption–desorption isotherm of the PS could be classified as Type III, where there is a lack of adsorption due to the weak adsorbate–adsorbent interaction. In contrast, the isotherms for PSB, PSB-CA, and PSB-PA can be classified as Type I-b with an H4 hysteresis loop [21]. It has been observed that none of the adsorption isotherms close with the desorption isotherms at low pressures. This phenomenon, known as low-pressure hysteresis, is attributed to the strong presence of micropores [22].

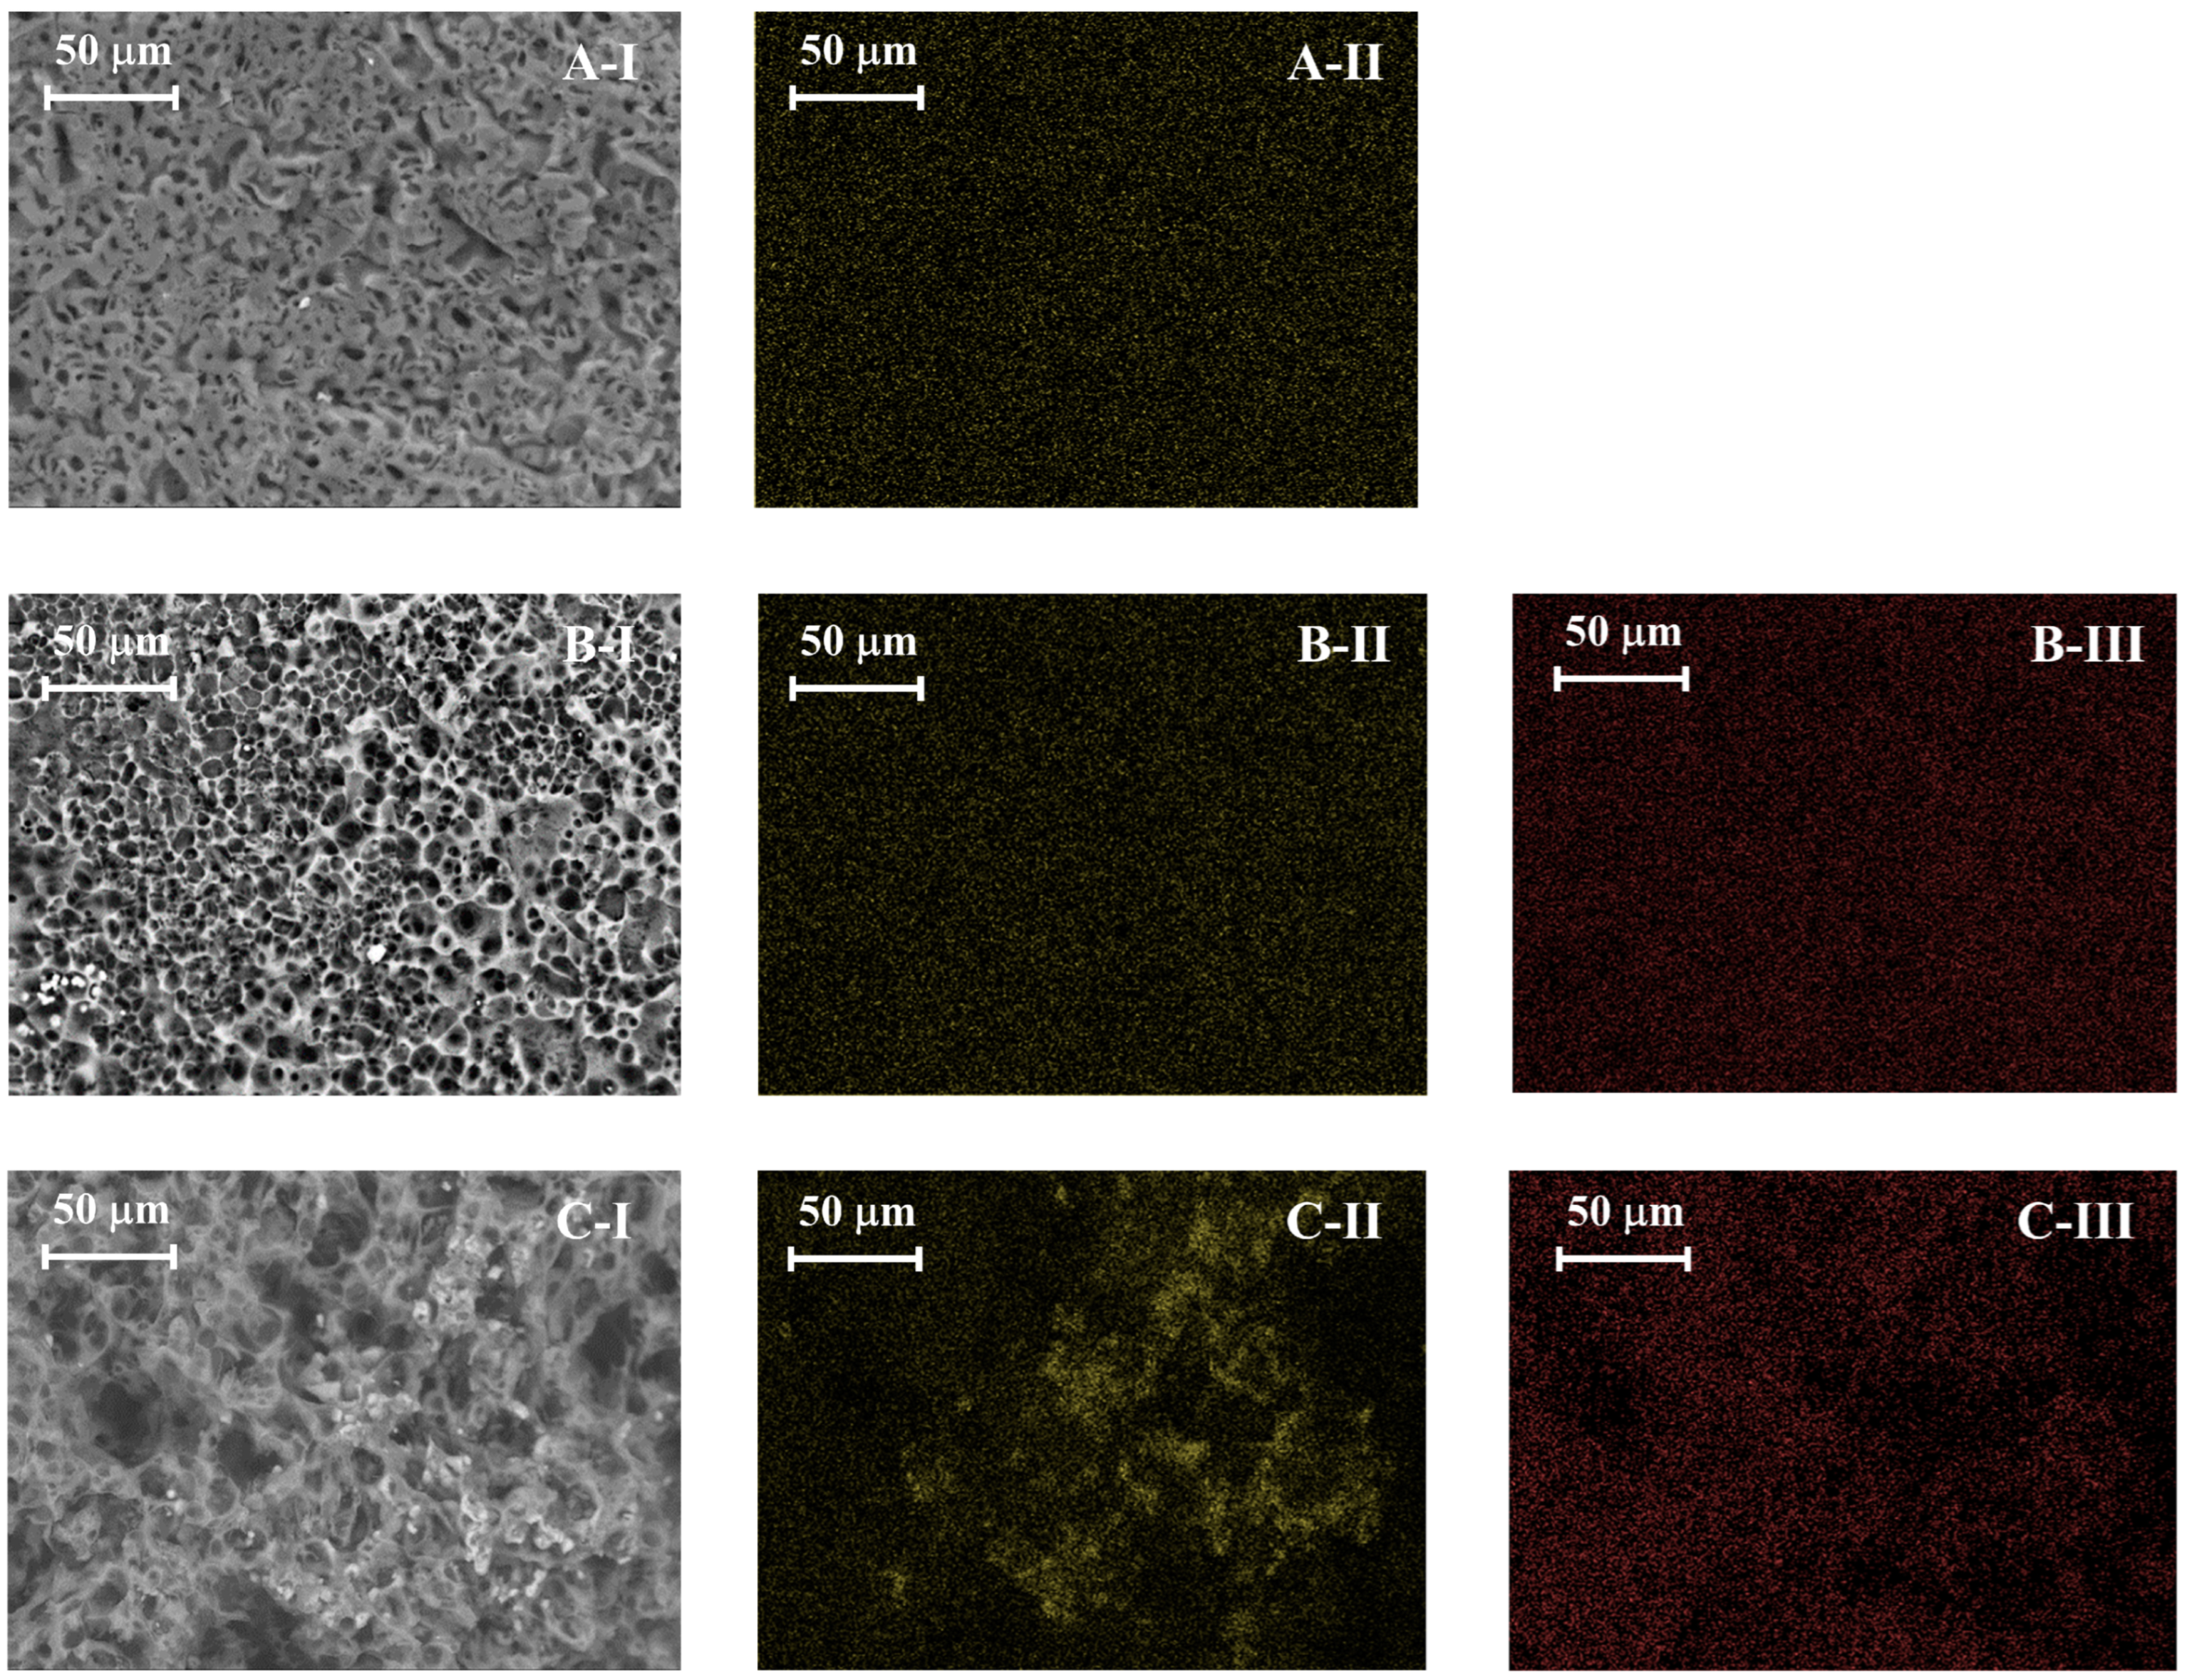
2.1.4. Morphology and EDS Surface Analysis

The effects of pyrolysis and activation processes on the adsorbent structure and porosity are observed through morphological and structural analysis using SEM-EDS (Figure 3). PS shows almost no porosity, presenting a smooth surface. After pyrolysis (PSB), the sample develops a more heterogeneous surface with grooves and channels. Physical activation further enhances the development of these grooves; however, it does not fully develop micropores, as evidenced in Table 2. This is achieved with chemical activation, where the development of a honeycomb-like structure with more pronounced pores is observed. Regarding the EDS analysis, it shows that pyrolysis reduces the oxygen content of the sample, increasing the carbon matrix. On the other hand, chemical activation with KOH (PSB-CA) introduces potassium onto the surface, as seen in the EDS spectrum (see Figure S1 in the Supplementary Materials). In addition, the adsorbents exhibit small crystals on the surface corresponding to calcifications (CaCO3) related with the main element present in PS ashes [23].

2.2. CO2 Adsorption Studies

PSB-CA exhibits the highest CO2 capture rate (2.17 mmolCO2/gadsorbent), indicating that KOH activation significantly enhances the adsorption capacity of the biochar. It is followed by PSB-PA, PSB, and PS with 1.30, 0.96, and 0.19 mmolCO2/gadsorbent, respectively. PS exhibits almost no adsorption capacity and therefore slower adsorption kinetic. Figure 4 illustrates the relationship between the specific surface area and the capture capacity of the adsorbents, clearly demonstrating that a higher surface area correlates with greater adsorption capacity. Surface area and microporosity play a significant role in physisorption, which is the primary mechanism contributing to the CO2 capture capacity of the biochar-based adsorbents [24]. In addition, the alkalinity of the adsorbent plays a major role in CO2 uptake. The presence of basic elements, such as K in the case of PSB-CA, enhances CO2 capture through chemical sorption by forming salts like K2CO3, as demonstrated by Xu et al. [25]. The adsorption results of PSB-CA are highly competitive compared to other adsorbents (0.7 to 5.4 mmolCO2/gadsorbent), such as metal–organic frameworks (MOFs), zeolites, activated carbons, or porous silica [26,27]. This competitiveness is not only due to its adsorption capacity falling within the expected range, but also because its synthesis follows a waste-to-resource strategy, contributing to environmental sustainability [28].
Table 3 compares the results of CO2 uptake obtained in this study with previous biomass-based sorbents derived from studies similar to this one. The CO2 adsorption capacity of biomass-derived activated carbon is closely related to its precursors and activating method. From Table 3, it is observed that the chemical activation of biochar generally presents better CO2 capture performance than physical activation, which aligns with the result obtained in this study. This is to be attributed to the development of the microporous surface through KOH activation, enhancing CO2 adsorption through Van der Walls forces, suggesting that the process primarily relies on physical adsorption [29]. Bamboo sawdust and wood pellets exhibited lower CO2 adsorption capacities, but this can be explained by the fact that those experiments were conducted under a 15% CO2 flow instead of pure CO2, as employed for the other studies.
On the other hand, chicken manure-activated biochar showed low SSA (22 m2/g) but a surprisingly high adsorption capacity with the other adsorbents. This phenomenon could be attributed to the presence of nitrogen functional groups on the biochar surface, which facilitates CO2 chemisorption, as reported by Jung et al. [4]. The ammoxidation of biochar introduces active adsorption sites, especially pyrrolic nitrogen, which reacts with the CO2, leading to the highest adsorption capacity [30]. This effect is evident in spent coffee ground biochar activated via ammoxidation and KOH, where nitrogen functional groups are first doped on the adsorbent surface, followed by the development of porosity through KOH activation.
Table 3. CO2 adsorption capacities of various biomass-derived biochar reported in the literature to be determined through TGA.
FeedstockPyrolysis
Temperature (°C)
Activation MethodSSA
(m2 g−1)
Adsorption
Conditions
CO2
Adsorption
Capacity
(mmol g−1)
REF
Pistachio shell450None29330 °C and 1 bar0.96This work
Almond shell600None2125 °C and 1 bar1.59[31]
Sawdust500None2225 °C and 1 bar0.98[32]
Coconut shell1000None125025 °C and 1 bar0.53[33]
Pistachio shell450CO2 (700 °C for 1 h)34030 °C and 1 bar1.3This work
Wood pellet1000CO2 (550 °C for 1 h)28725 °C and 1 bar0.26[33]
Almond shell600CO2 (750 °C for 2 h)109025 °C and 1 bar2.7[34]
Pistachio shell450KOH (600 °C for 1 h)53130 °C and 1 bar2.17This work
Bamboo Sawdust1200KOH (550 ° for 1 h)52625 °C and 1 bar0.69[33]
Chicken manure400KOH (700 °C for 1 h)2225 °C and 1 bar1.95[35]
Coffee grounds400Ammoxidation and KOH (600 °C for 1 h)99035 °C and 1 bar2.67[30]

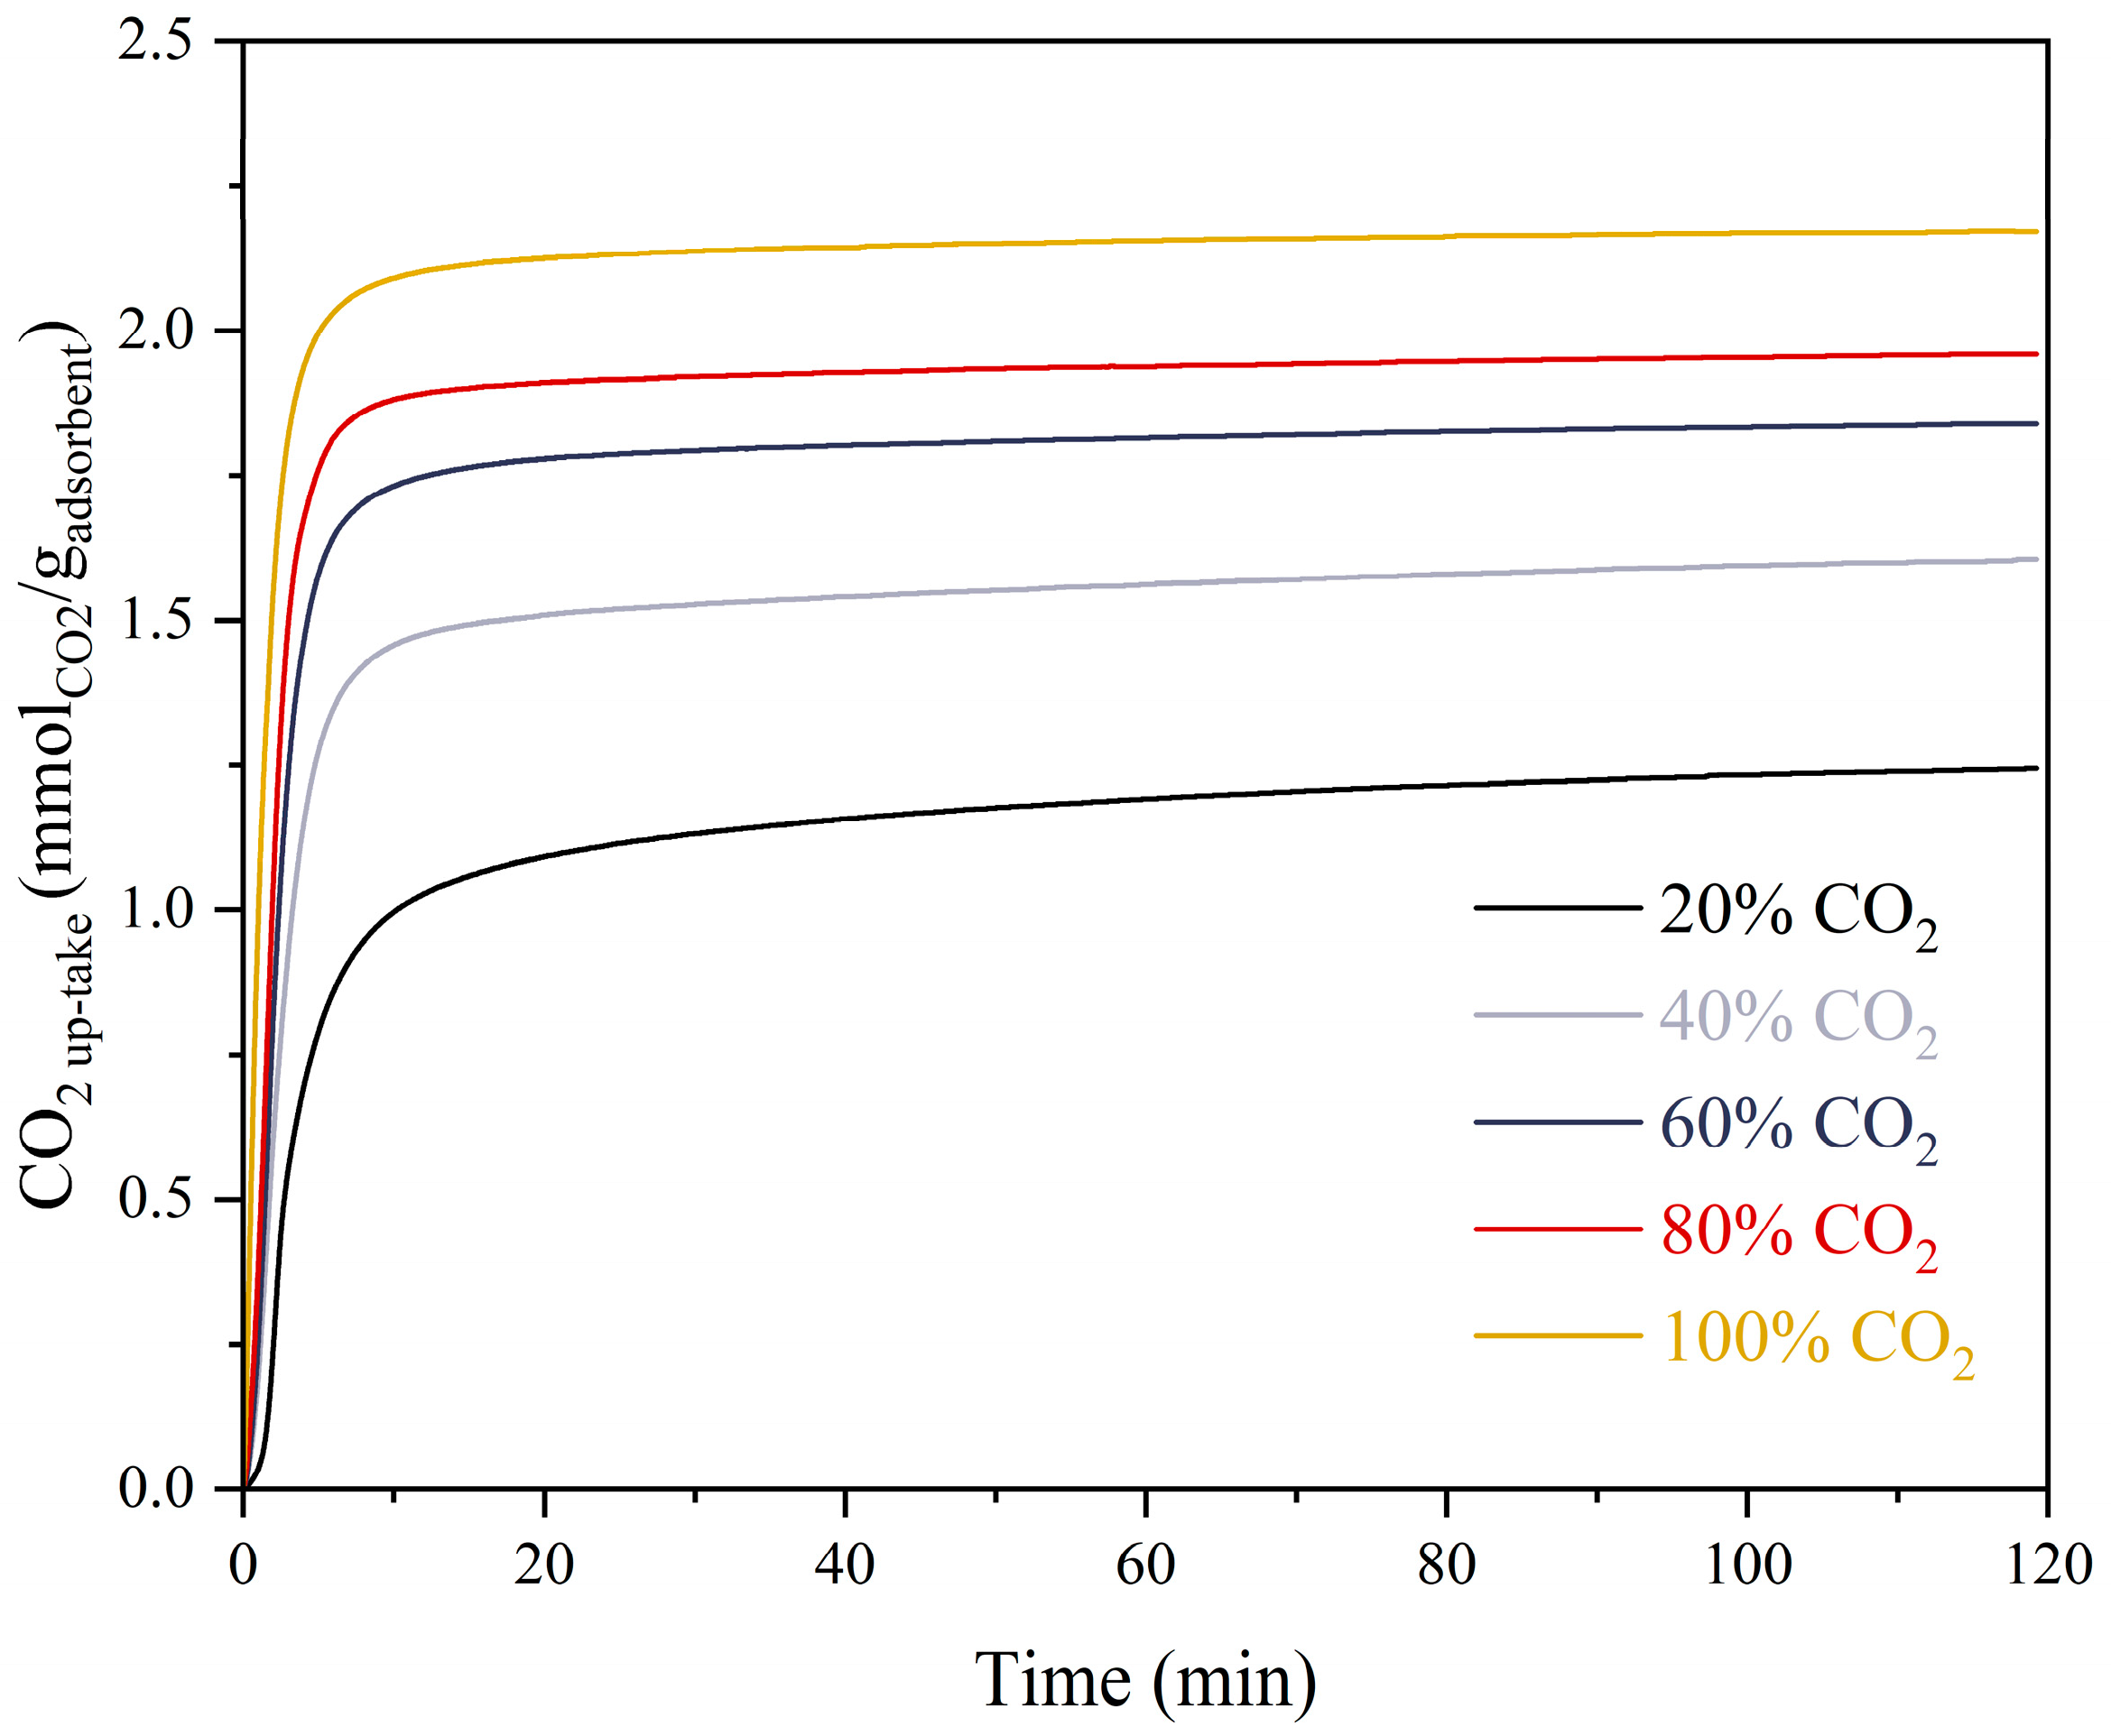
2.2.1. Effect of CO2 Concentration

PSB-CA was exposed to varying CO2 concentrations in the feed flow, while maintaining a total flow rate of 50 mL/min. CO2 adsorption curves and the adsorption capacity were studied for CO2 concentrations of 20%, 40%, 60%, 80%, and 100% (v/v CO2/N2). The adsorption capacities at 30 °C and 1 atm are depicted in Figure 5. It can be observed that the adsorption capacity increases with higher CO2 concentrations. The adsorption capacity of PSB-CA at 20% v/v CO2 was 1.24 mmol CO2/gadsorbent, which increased to 1.6, 1.83, 1.96, and 2.17 mmolCO2/gadsorbent for CO2 concentrations of 40%, 60%, 80%, and 100% v/v, respectively. This increase is attributed to the higher availability of adsorbates, which interact with the active sites. Additionally, at higher concentrations, multilayer adsorption effects occur, increasing the CO2 capacity of the adsorbent. In addition, when CO2 concentration increases, a decrease in the time required to reach equilibrium can be observed. At 20% CO2 v/v, equilibrium was reached after 15 min, whereas at 100% CO2 v/v, it was achieved in 6 min.

2.2.2. Regeneration Performance

In industry, not only the adsorption capacity and selectivity of the sorbent are important, but also is its regeneration capacity in cyclic adsorption–desorption processes [36]. Therefore, four adsorption–desorption cycles were performed to determine the regeneration capability PSB-CA using a temperature swing adsorption process. The adsorption and desorption temperatures were set at 30 °C and 120 °C, respectively. During adsorption, the flow was CO2, while in the desorption stage, it was switched to N2. The results of this study are presented in Figure 6, which shows that after four cycles, the adsorption capacity remains stable at 2.2 mmolCO2/gadsorbent. Thus, its repeated use did not affect CO2 sorption performance, indicating its high stability as CO2 bioadsorbent.

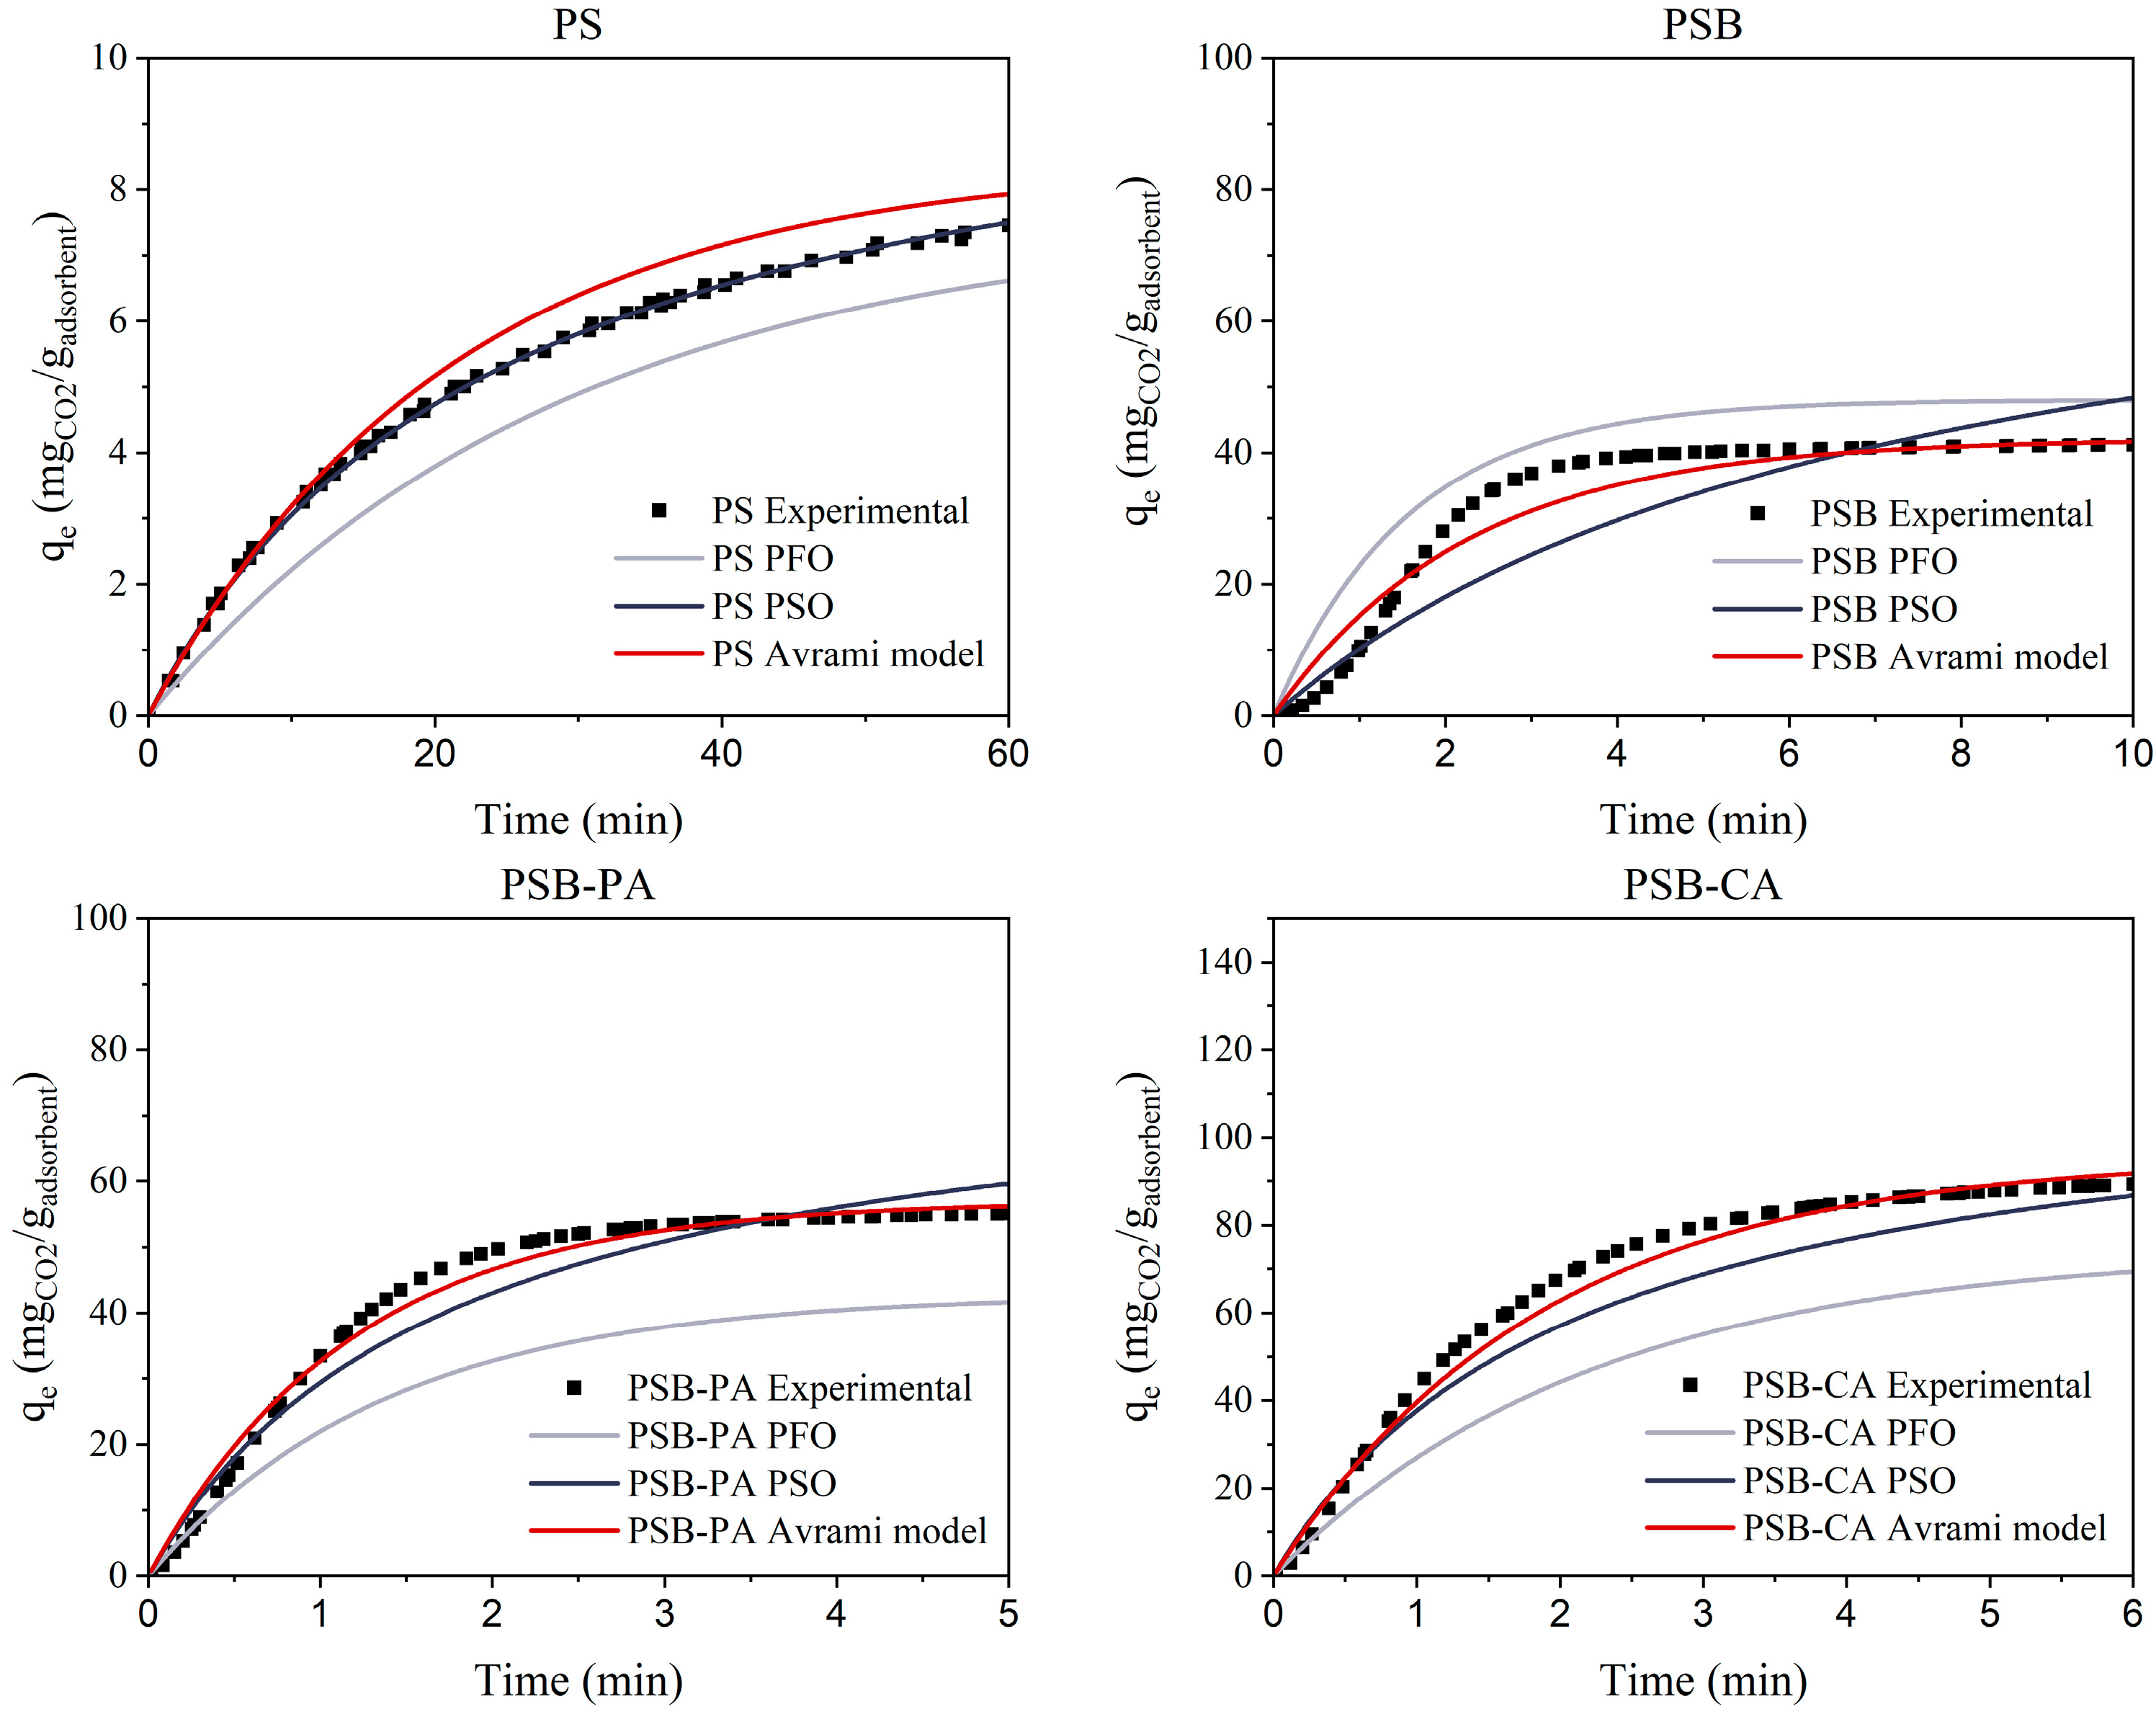
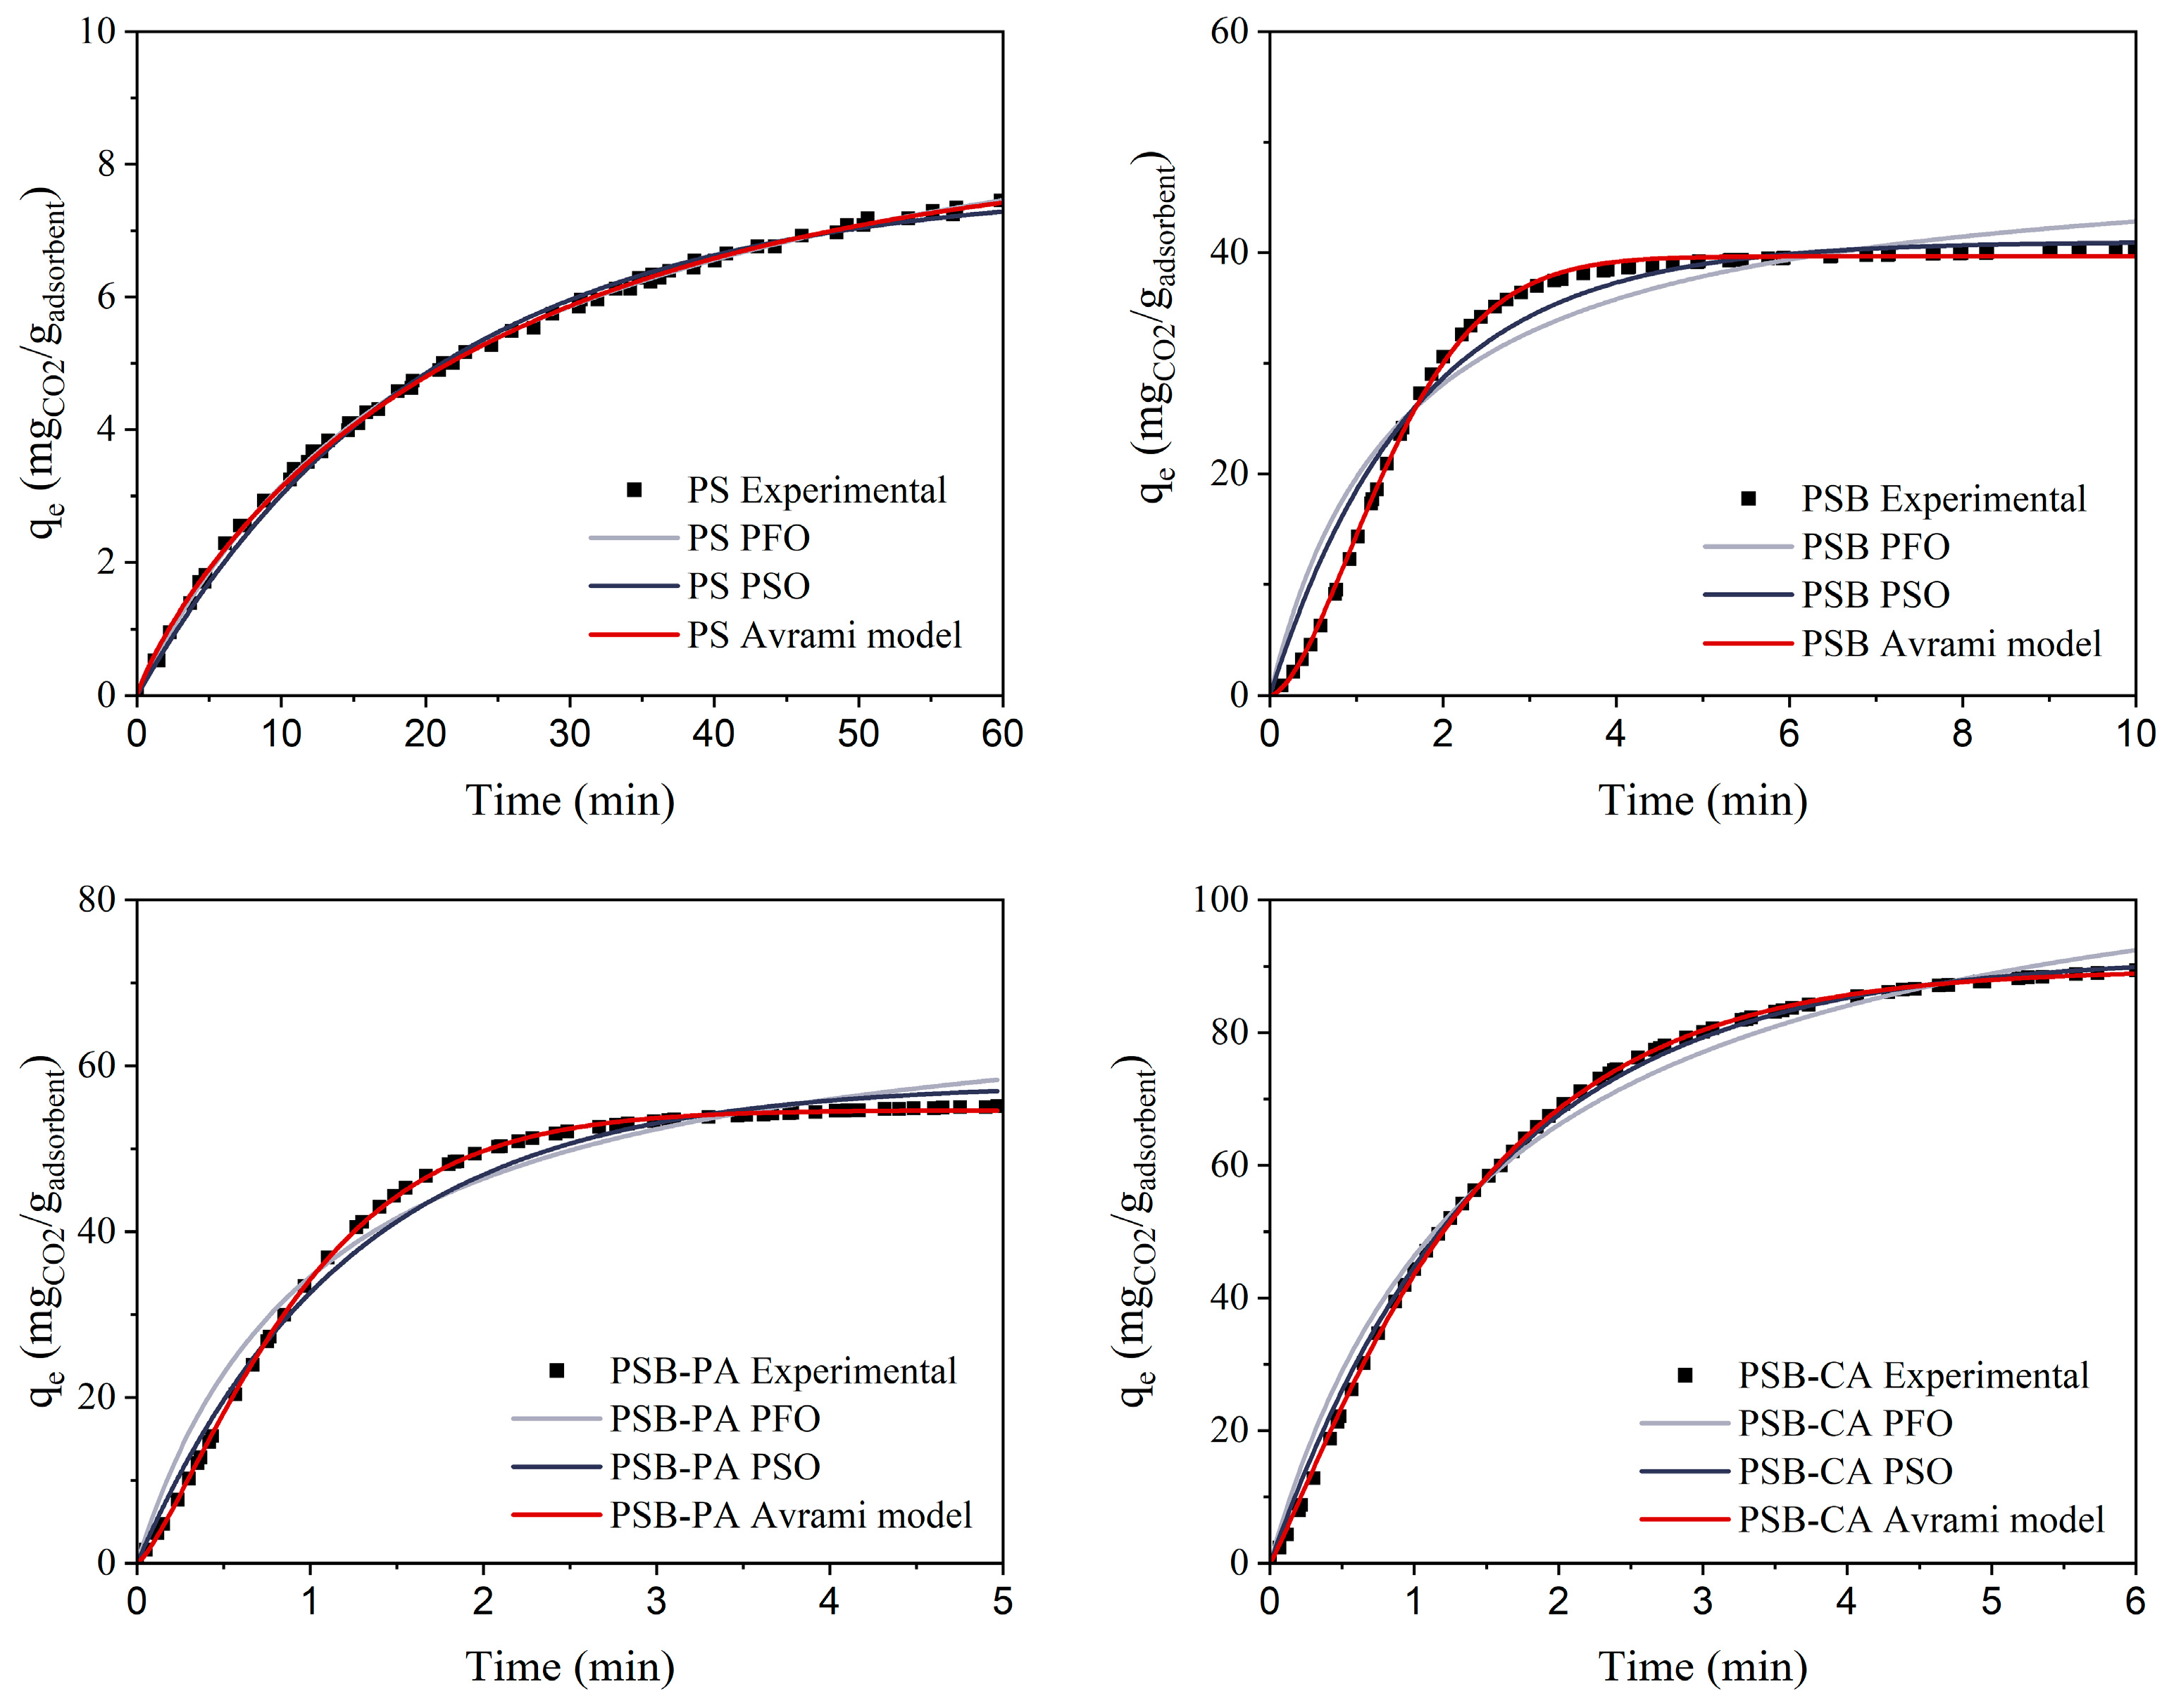
2.2.3. CO2 Adsorption Kinetics

Adsorption kinetics helps to determine the time needed to reach equilibrium, enabling more efficient process design [37]. It also helps to identify whether physical or chemical adsorption dominates the process, which is crucial for enhancing material performance [38]. Traditionally, kinetic parameter determination has been performed through the linearization of kinetic models. The linearization methods are based on approximations, which can lead to uncertainty, ultimately resulting in inaccuracies [39]. However, recent advancements in software development enable the adjustment of experimental values using non-linear fitting. Despite these advancements, most studies are still focused on linear fitting. Therefore, in this study, we compare both approaches using three kinetic models: the pseudo-first order (PFO), pseudo-second order (PSO), and Avrami model. The equations for each model are presented in the Materials and Methods Section: Equations (2)–(4) correspond to the PFO, PSO, and Avrami models, respectively.
Figure 7 depicts the linear fit of each adsorbent (PSB, PSB-PA, and PSB-CA) to the three kinetic models described previously. Table 4 presents the kinetic parameters calculated for each adsorbent and linear fitting kinetic model. Additionally, Figure 8 and Table 5 display the kinetic model curves for non-linear fitting and its adsorption kinetic parameters. In linear fitting models, important discrepancies are observed between kinetic models and experimental data. The PFO and Avrami models show a greater R2 than 0.9, indicating that CO2 adsorption on the pistachio shell-derived biochars could follow these models. On the other hand, PSO significantly deviates from the experimental values, resulting in low R2 values. Another approach to assess if a model fits the experimental data is comparing the maximum adsorption capacity. In this case, the PSO model overestimates the adsorption capacity of each adsorbent by up to 50%, as shown in the PSB results. Meanwhile, for the PFO model, the largest deviation in qe occurs with PSB-CA, where the theoretical value is 62 mgCO2/gadsorbent, compared to the experimental value of 87 mgCO2/gadsorbent.
On the other hand, non-linear fitting provides greater accuracy, demonstrating that this technique is much more reliable and offers a deeper knowledge of the adsorption phenomena, as seen in Table 5 and Figure 8. R2 values greater than 0.9 are obtained for all the models, with qe values closer to experimental values. Among the models, it is concluded that the Avrami model most accurately represents the experimental CO2 capture values. The parameters obtained from the Avrami equation provide valuable insights into the interaction of CO2 and the adsorbent’s surface and pore structure [40]. For PS, the nAv value is significantly less than 1, indicating a slow adsorption process, mainly due to the limited number of available adsorption sites on the material. After pyrolysis, the number of adsorption sites increases, as reflected in a higher nAv value for the PSB. In physical and chemical activation, the nAv values decrease to slightly above 1, suggesting a more complex CO2 capture mechanism in these adsorbents. This suggests the formation of multiple layers of adsorbed CO2, leading to progressive adsorption within the pores, primarily due to the microporous structure of the adsorbents, especially for PSB-CA [41,42].
However, determining only the R2 value is not enough to determine if a model explains the experimental data [39]. Figure S2 in the Supplementary Material depicts normal probability plots of the adsorbents for the non-linear models studied, and Table S2 presents the RSME of the models. The results of this analysis allow us to determine if the model follows a normal distribution. It can be observed that the data obtained through the Avrami model align along the corresponding straight line, approximating to a normal distribution. In contrast, the PFO and PSO models deviate from the line, showing a fluctuating pattern. This trend occurs when there is a positive correlation between the error term and time; thus, these models must be excluded. In addition, RMSE analysis shows that non-linear fitting models match better with the experimental values. Among them, the Avrami model provides the best results for the studied adsorbents. Although the Avrami model was identified as the best fit for the kinetic curves, additional insights into the governing sorption mechanism of CO2 on biochar using adsorption isotherms could further enhance the understanding of the adsorption process.

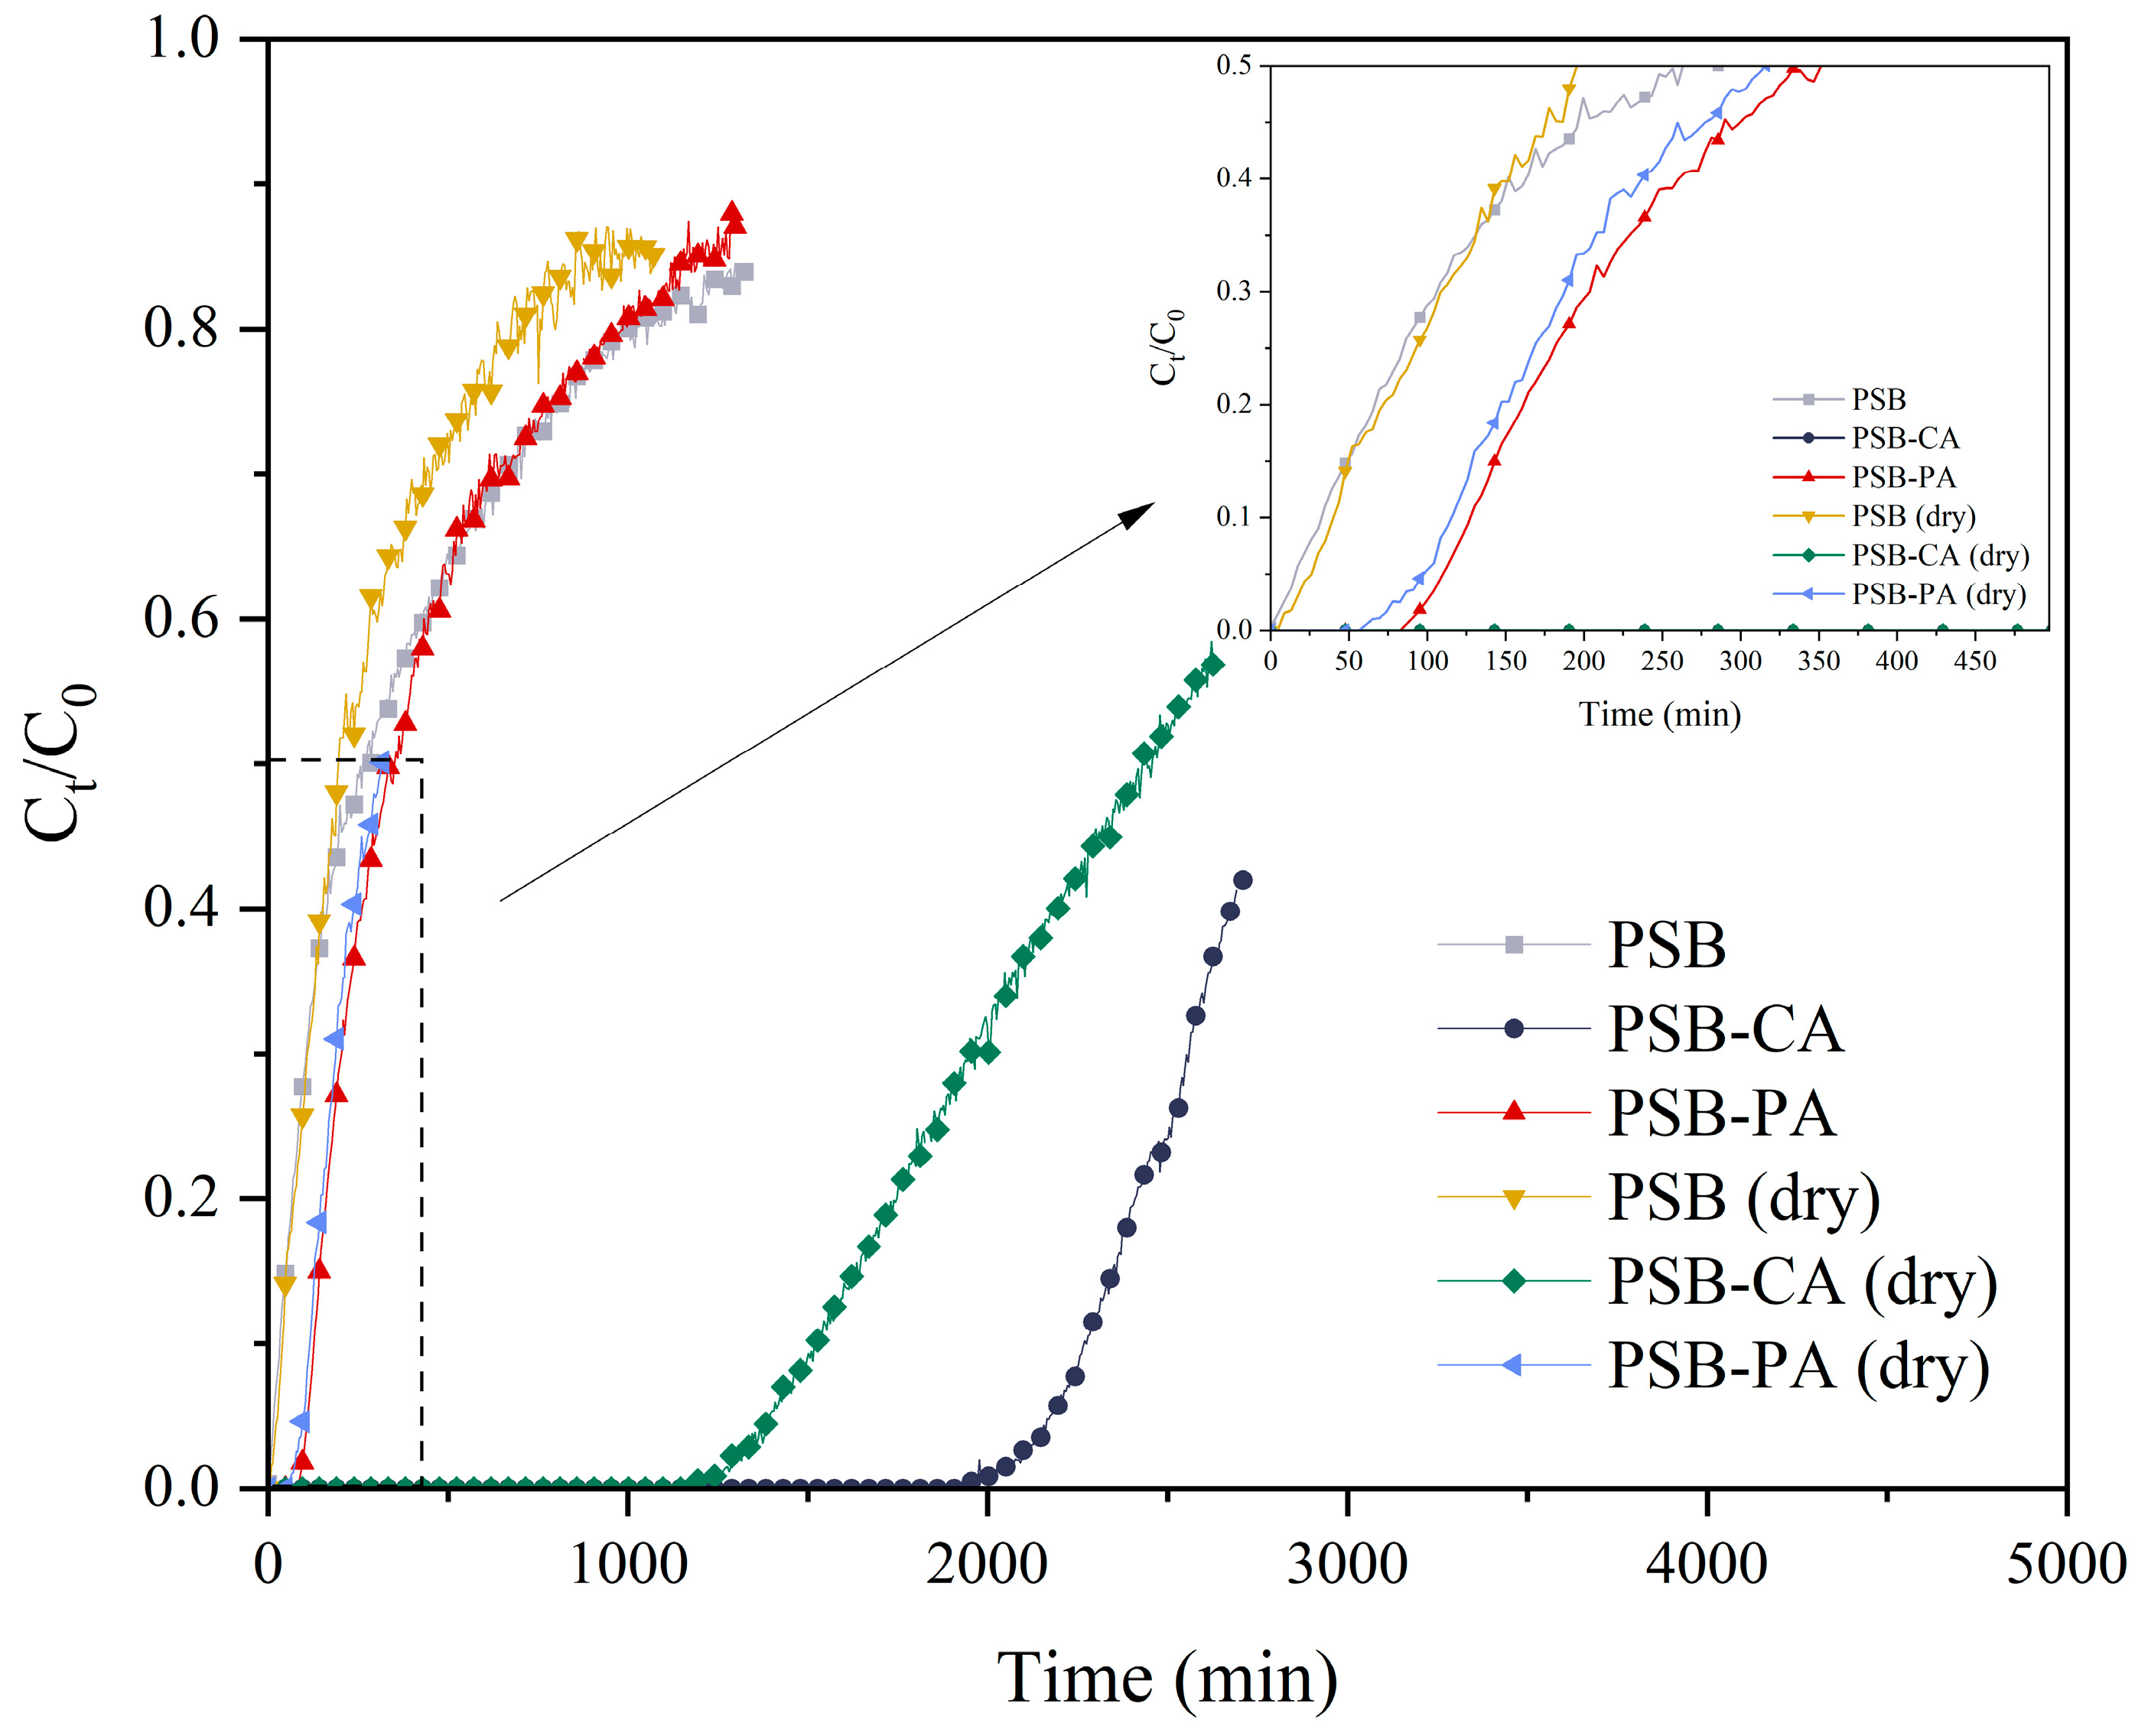
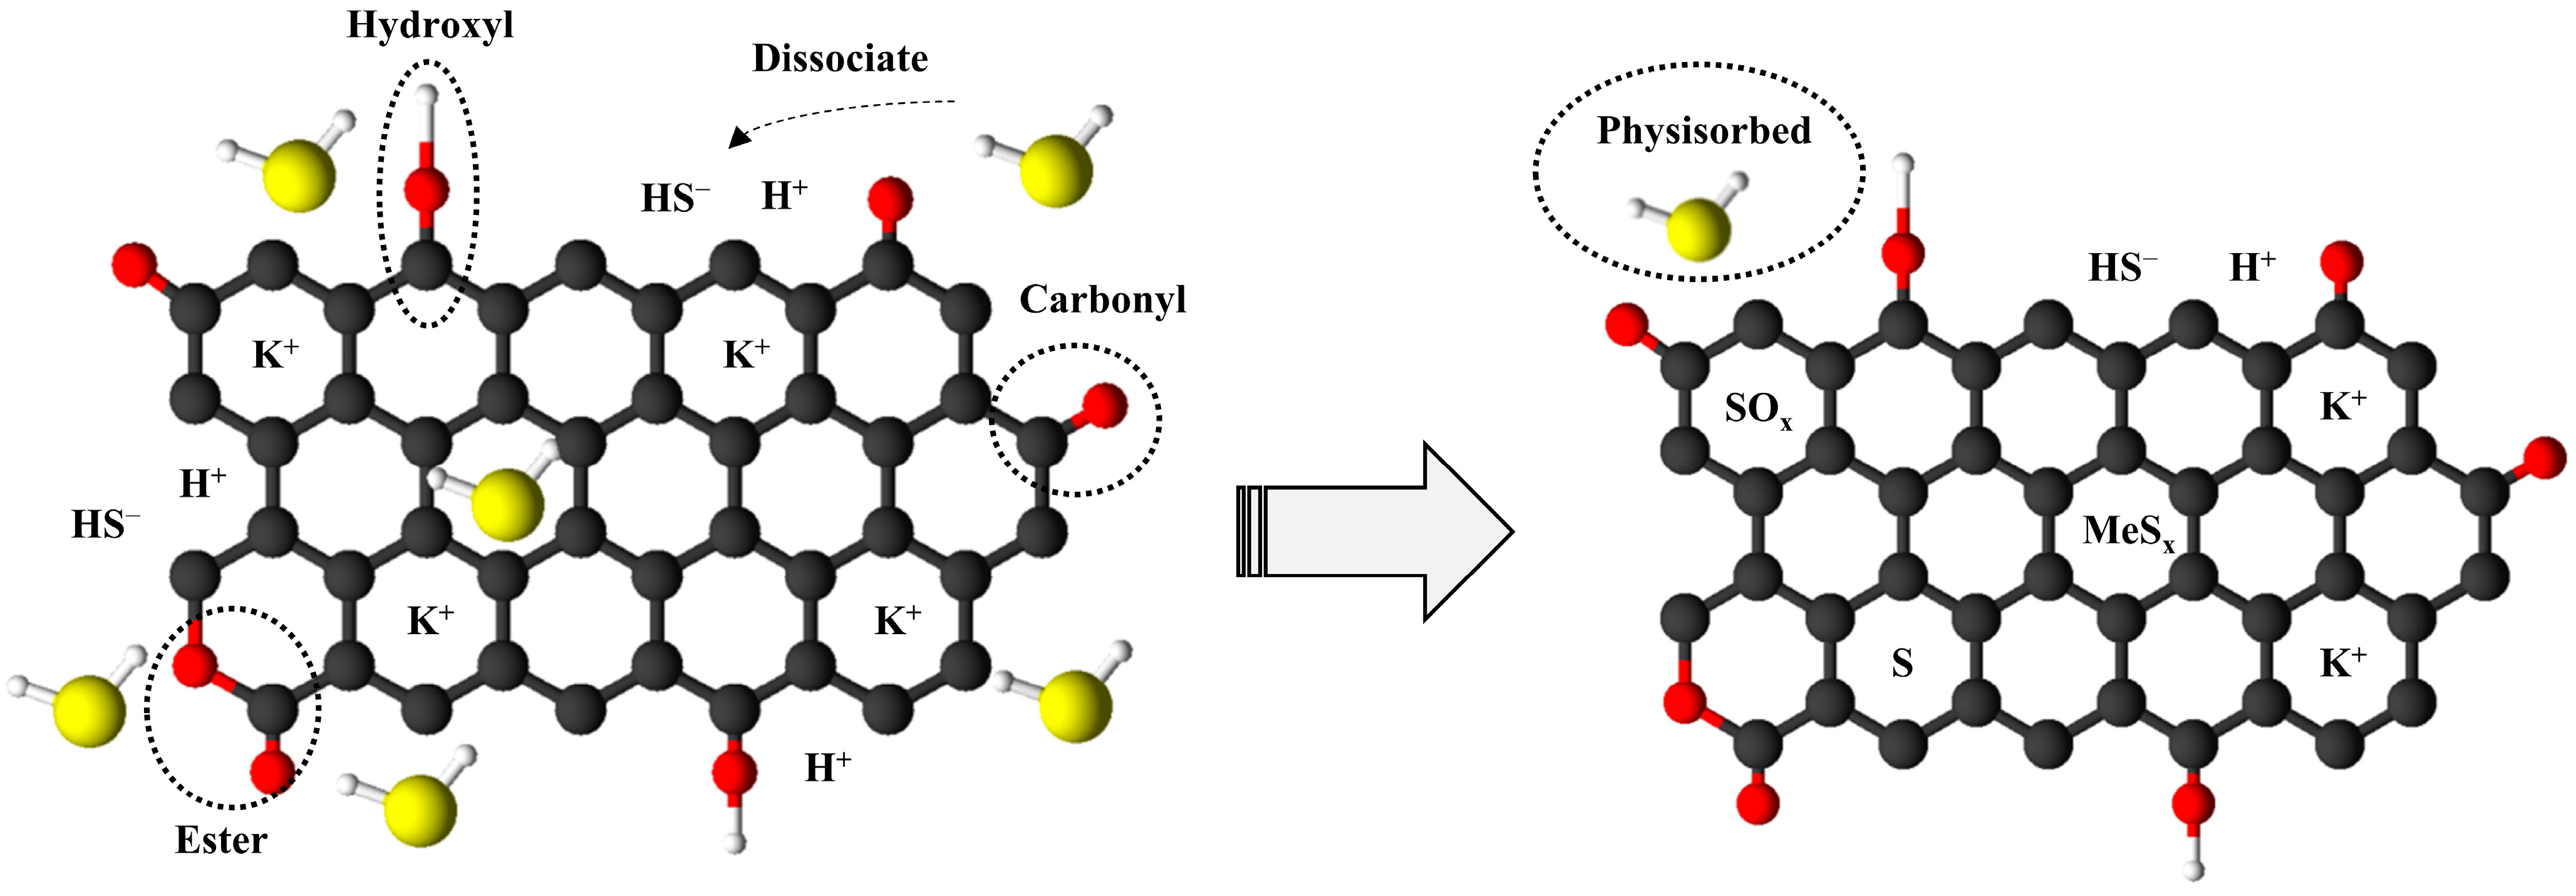
2.3. Dynamic H2S Adsorption

Dynamic H2S capture experiments were conducted for the adsorbents derived from PS, with the exception of PS, which showed minimal CO2 adsorption capacity and was assumed to have zero H2S adsorption. In this work, we studied the moisture content effect of the biochar. For this purpose, tests were performed using the adsorbent with its original moisture content and after a drying pretreatment. The adsorbent’s breakthrough capacity was defined as the time when the H2S concentration reached 10 ppmv. Figure 9 presents the breakthrough curves for H2S capture. Similarly to CO2 capture results, chemically activated biochar (PSB-CA) demonstrated the best performance, with an adsorption capacity of 9.6 mgH2S/gadsorbent and a breakthrough time of 2260 min. PSB-CA effectively removes H2S, leaving no detectable levels (<1 ppm) in the outlet gas before breakthrough occurred. In contrast, PSB and PSB-PA have significant lower H2S adsorption capacities, with values of 0.14 mgH2S/gadsorbent and 0.58 mgH2S/gadsorbent, respectively. Some authors attribute H2S capture capacity fundamentally to the adsorbent’s higher surface area. However, this hypothesis may not fully explain the observed differences between the sorbents, as the variation in adsorption capacity is significantly higher than the difference in surface area. Furthermore, the adsorption capacity would be improved if the sorbent was subjected to a previous drying process, where moisture and physisorbed molecules would be removed, allowing H2S adsorption in the active sites. The results show that the surface area trend in adsorption capacity is consistent. However, in this case, their adsorption capacity decreases when the adsorbent undergoes dry pretreatment. PSB-CA shows a 33% capacity reduction, achieving an adsorption capacity of 6.4 mgH2S/gadsorbent, whereas PSB-PA present a capacity decrease to 0.52 mgH2S/gadsorbent, representing a 10% loss in H2S adsorption capacity.
The presence of moisture has a significant impact on H2S removal at low temperatures [43]. The TGA results show that PS and PSB-PA adsorbents exhibit very low moisture content, with only a 2% mass loss between 80 and 120 °C. The biochar surface from biomass is hydrophobic due to the aromatization of carbon chains during pyrolysis, which limits interactions with water [43]. Physical activation with CO2 does not enhance this interaction, as it does not add surface functional groups that increase the affinity for water [44]. In contrast, PSB-CA presents a more pronounced mass loss of 8% within the same temperature range, resulting in a higher moisture content and higher H2S adsorption capacity.
Choudhury and Lansing studied the effect of Fe-impregnation on different biochars derived from biomass. They reported H2S adsorption capacities of 0.5 mgH2S/gadsorbent for corn stover biochar and 2 mgH2S/gadsorbent for maple biochar; after Fe impregnation, the capacities increased to 1.5 and 15.2 mgH2S/gadsorbent, respectively [45]. Adib et al. concluded that a higher pH of H2S than pKa (7.2) is necessary to allow for the dissociation of H2S on the water film, but the presence of metal oxides increases the process efficiency due to the catalytic oxidation reaction which produces elemental sulfur or sulfate [46]. The results of our study underscore the importance of enhancing the biochar-specific surface area and hydrophilic properties without reducing its pH. Therefore, PSB-CA biochar could be further employed as support for metal doping to improve desulfuration adsorption efficiency.
In Figure 10, results from the SEM-EDS analysis for PSB-CA before and after H2S adsorption are presented. The surface morphology remains the same, as the adsorbents have not been subjected to a thermal process. EDS mapping demonstrates the presence of sulfur adhered to the adsorbent surface (highlighted in red). Sulfur adsorption occurs homogenously on the surface and does not directly take place on the potassium clusters. The concentration of sulfur present on the surface of the adsorbent obtained in SEM-EDS analysis is presented in Table S1. In addition, the SEM-EDS mapping distribution results of the other adsorbents (PSB and PSB-PA) are presented in Figures S3 and S4 in the Supplementary Materials, respectively. The detection of sulfur elements in SEM-EDS analysis confirms that the H2S adsorption of the activated biochar involves a chemisorption process, where sulfur is effectively fixed onto the carbon structure, as, if the process involved only physisorption, H2S would be desorbed under vacuum conditions.
Several authors have reported that H2S adsorption on char involves a complex mechanism that significantly depends on the chemical properties of the char and the adsorption conditions [47]. Most of the studies conduct adsorption in the presence of oxygen at low concentrations, which promotes the oxidation of H2S. However, H2S gas streams do not always contain O2, as is the case with biogas streams and in this study. Yan et al. demonstrated the influence of a thin water layer in the microporous structure on H2S oxidation [43]. Figure 11 presents a schematic diagram of the proposed mechanism. The mechanism begins with H2S diffusion into the biochar, where they interact with the water layer, leading to the dissociation of H2S into HS-.
Thereafter, and according to Hervy et al., two reaction pathways could occur: (1) The direct reaction of HS- with the metal oxides present in the adsorbent produces metal sulfides, which can afterwards be oxidized by the organic species present in the biochar, resulting in sulfates production [48]. (2) The present of oxygen-containing functional groups provided by the chemical activation could react with the H2S through a substitution reaction [49]. Furthermore, some H2S could also be physisorbed in the micropores and mesopores or dissociated in the water layer.
These results demonstrate the potential of the developed biochar for CO2 and H2S capture, unlike most previous studies that focus on only one of these gases. Using pistachio shell, a widely available and low-cost residue, the proposed valorization process helps to reduce waste and promotes environmental sustainability, making it a promising alternative for gas purification. However, further in situ operational studies are needed to better understand the adsorption mechanisms of CO2 and H2S in the activated biochars. To conclude, although PSB-CA yields higher adsorption capacity for both CO2 and H2S, the activation process requires higher chemical and energy cost, difficulties in chemical recovery, potential environmental risks, and the corrosion of the reactor and piping due to the strong alkali solution [5]. Therefore, a life cycle analysis to identify the environmental impact of each step and a techno-economic analysis to evaluate its economic feasibility could provide valuable insights for its optimization and implementation.

3. Materials and Methods

3.1. Materials

The feedstock studied for biochar-based adsorbent synthesis was Sirora pistachio shell (Pistacia vera), obtained from a plantation in the community of Madrid, Spain. The pistachio shells (PSs) were washed to remove any remaining ash or soil residue. After washing, the PSs were dried in an oven for 24 h at 100 °C. Once dry, the solid was grounded in a laboratory mill (Retsch SM2000, Düsseldorf, Germany) and sieved to a particle size of 0.5 to 2 mm.

3.2. Preparation of the Biochar-Based Adsorbents

The PSs are placed in a fixed-bed reactor and pyrolyzed at 450 °C for 15 min at a heating rate of 20 °C/min. N2 is used as the carrier gas at a flow rate of 100 mL/min. The pyrolysis takes place in a fixed-bed reactor with a diameter of 2.18 cm and a height of 38.5 cm made of stainless steel 316. This reactor is placed in a vertical furnace with a maximum temperature of 1200 °C. The reactor temperature is controlled using two thermocouples, one placed on the reactor wall and the other in contact with the sample. The condensate gases produced during pyrolysis are collected in two impingers placed in a cooling bath at 5 °C.
Afterwards, the pistachio shell biochar (PSB) obtained is activated using two different methods. The first method is a physical activation, where the PSB is placed into the same fixed-bed reactor described before, heated at a rate of 20 °C/min to 700 °C, and maintained for 1 h. The reaction atmosphere consists of an equal flow of N2 and CO2 at 50 mL/min. The activated biochar is collected after cooling with a 100 mL/min N2 flow. On the other hand, chemical activation involves impregnating PSB with KOH at a mass ratio 2:1. The impregnation ratio was calculated as the ratio of the weight of the biochar to the weight of KOH in a 1 M solution. To ensure the complete reaction occurred between PSB and KOH, the mixture was stirred constantly at 700 rpm at room temperature for 1 h. Then, the sample is dried at 100 °C overnight, activated at 600 °C in a fixed-bed reactor under N2 flow (100 mL/min) at a heating rate of 20 °C/min, and held for 1 h. Subsequently, the activated biochar is washed with deionized water until the pH is constant and then dried at 110 °C for 24 h. Physical- and chemical-activated biochars are referred to as PSB-PA and PSB-CA, respectively.

3.3. Adsorbents Characterization

Biochar-based adsorbents were characterized by elemental analysis following the UNE-EN standards (EN 15104, EN 15289, EN 15407, and EN 15408). The thermal stability of all the adsorbents was determined in a TGA2 system (Mettler Toledo Corporation, Greifensee, Switzerland). In a typical thermogravimetric analysis (TGA), 10 mg of each adsorbent were heated under flowing N2 (50 mL/min) from 30 to 900 °C at a heating rate of 10 °C/min. The biosorbent surface area was obtained after applying the Brunauer–Emmet–Teller (BET) model results obtained from N2 adsorption–desorption isotherms at 77 K in a Micromeritics ASAP 2020 device. On the other hand, the micropore volume (Vp micro) and mesopore volume (Vp meso) were calculated using the t-plot method; the total pore volume (VT) was determined considering the N2 volume adsorbed at P/P0 = 0.95; Dav was calculated using the Barrett–Joyner–Halenda method (BJH); and the porosity and the total intrusion volume were determined using mercury intrusion porosity in a Micromeritics AutoPore Series IV 9500. The surface morphology of the adsorbents was examined using a Scanning Electron Microscope (SEM) Zeiss EVO LS15, equipped with Energy Dispersive Spectroscopy (EDS) analysis (Oxford Inca Energy 350). Finally, pH was determined in a pH-meter (GLP 21, Crison), mixing the biochar-based adsorbent with deionized water in 10:1 water–biochar (mL:g) ratio for 1 h.

3.4. Adsorption Procedures

3.4.1. CO2 Adsorbent Procedure

CO2 adsorption studies were performed using thermogravimetric analysis (Mettler Toledo TGA2 system). First, samples (10–20 mg) were degassed at 125 °C with a N2 flow of 50 mL/min for 2 h to remove moisture and physisorbed molecules. Subsequently, the samples were cooled to 30 °C under the same N2 flow. The CO2 adsorption capacity of the adsorbents was measured by changing the inlet gas to CO2 (50 mL/min) for 2 h or until a constant mass was observed. The increase in mass observed for the dried sample allowed for the determination of the CO2 adsorption capacity of the adsorbent, as seen in Equation (1).
q e = m f m i MW CO 2 m i · 1000
In this study, the kinetics of CO2 adsorption onto the adsorbents were analyzed using the pseudo-first order model (PFO), pseudo-second order model (PSO), and the Avrami model, using linear and non-linear fitting. PFO, also known as the Lagergren model, is based on the assumption that the rate of occupation of adsorption sites is proportional to the number of unoccupied sites [39]. The model is expressed as
dq t dt = k 1 q e -   q t Integrating ln q e - q t = ln q e - k 1 t
where qt is the amount of adsorbate adsorbed at time t (mg/g), qe is the equilibrium adsorption capacity (mg/g), and k1 is the pseudo-first order rate constant (min−1). A linear plot of ln(qe − qt) versus t allows for the determination k1 and qe.
The PSO model assumes that the adsorption process is controlled by chemisorption involving valence force sharing or exchanges of electrons between the adsorbent and adsorbate. The model is given by [50]
dq t dt =   k 1 q e q t 2   Integrating   t q t = 1 k 2 q e 2 + t q e
where k2 is the pseudo-second order rate constant (g·mg−1·min−1). A linear plot of t/qt versus t allows for the determination of k2 and qe.
The Avrami equation, originally developed for phase transformation in material science, has been adapted to model adsorption kinetics. This equation helps to understand the kinetics of adsorption processes by describing the fraction of adsorbate uptake over time, accounting for the nucleation and growth of adsorption sites [51]. The equation is described as
dq t dt = k A n A t n A - 1 q e - q t Linearized ln ln q e q e - q t = n A ln k A + n A ln t
where kA is the Avrami kinetic constant (s−1) and nA is the Avrami exponent, which indicates the adsorption mechanism. A linear plot of t/qt versus t allows for the determination of k2 and qe. By fitting experimental data to these models, researchers can determine the kinetic parameters and better understand the adsorption process [52]. Only points from the adsorption phase are taken into account during the modeling process, as adding extra points from the equilibrium could lead to inaccuracies in the results [39].
An adjusted coefficient of determination was calculated according to the equation described below:
R 2 = 1 ( n - 1 n - p )   SSE SST
where SSE is the sum of squared error, SSR is the sum of squared regression, SST is the sum of squared total, n is the number of data, and p is the number of regression coefficients.

3.4.2. H2S Removal at Low Temperature

Dynamic H2S capture studies were performed in a Microactivity Pro unit, as illustrated in Figure 12. The adsorbents are introduced into a Hastelloy C tubular reactor to prevent corrosion and issues arising from the presence of sulfur compounds. The reactor, with a diameter of 1.02 cm and a height of 380 cm, is placed in a cylindrical furnace to control the temperature. The entire system is enclosed in an electrically heated box, which can preheat the inlet gases. Gases are injected and mixed using mass flow controllers (MFCs). TIC (temperature indicator controller) and PIC (pressure indicator controller) devices regulate the system’s temperature and pressure. The maximum gas flow rate is 4.5 NL/min, and the system allows for reactions to be studied at temperatures up to 600 °C and pressures up to 30 bar. Further details are provided in previous works published by the authors and research group members [53,54].
Inlet and outlet gas streams were analyzed with a Varian 490 microGC (Palo Alto, California, USA) dual channel. The H2S concentration was determined using 10 m PPQ column.
Hydrogen sulfide was fed with bottled gas (100 ppmv H2S, nitrogen balance), and an inert atmosphere for system cleaning was provided using pure N2 (99.999%). A computerized system managed and controlled the different process stages. A full experiment involved the following steps: (1) system cleaning through inert gas flow (N2) and (2) desulfurization under process conditions at atmospheric pressure (1 bar) and 30 °C, with a weight hourly space velocity (WHSV) set at 1000 h−1. The tests were stopped at the breakthrough concentration of 10 ppmv. The capacities of each sorbent were calculated by the integration of the area above the breakthrough curves. To determine the effect of moisture present on the bioadsorbent, experiments were conducted in which the adsorbents were dried at 120 °C for 2 h under a N2 flow prior to adsorption.

4. Conclusions

This study demonstrates the potential of producing adsorbents for gaseous pollutant capture from pistachio shells through pyrolysis followed by biochar activation. Chemical activation with KOH significantly improves pore development, obtaining the highest adsorption capacity among the other adsorbents, with PSB-CA reaching an adsorption capacity of 2.17 mmolCO2/gadsorbent. Non-linear kinetic models are the most appropriate methods to describe CO2 adsorption data, with the Avrami model providing the best fit for PS-based activate biochar. For H2S capture, the tests showed that chemical activation yielded better results compared to physical activation. This is attributed to the higher number of active sites on the adsorbent surface, which facilitate H2S dissociation. PSB-CA demonstrated better performance, achieving an adsorption capacity of 9.6 mgH2S/gadsorbent compared to 0.58 mgH2S/gadsorbent of PSB-PA. Additionally, the water presence in the adsorbent, while it might appear to limit the pore accessibility, is required for H2S dissociation, thereby increasing its adsorption capacity. The hydrophilic properties of PSB-CA contribute significantly to the better results obtained in this study.

Supplementary Materials

The following supporting information can be downloaded at https://www.mdpi.com/article/10.3390/molecules30071501/s1, Figure S1: EDS spectrum for fresh PS (A), PSB (B), PSB-CA (C) and PSB-PA (D); Figure S2: Normal probability plots of the adsorbents for the non-linear models studied; Table S1: Elemental analysis of the surface based on SEM-EDS analysis of the adsorbents for H2S capture; Figure S3: SEM and EDS mapping of the PSB fresh (A), PSB after H2S adsorption (B) and after adsorption under dry condition. Sulfur content is represented in B-II and C-II in color red; Figure S4: SEM and EDS mapping of the PSB-PA fresh (A), PSB-PA after H2S adsorption (B) and after adsorption under dry condition. Sulfur content is represented in B-II and C-II in color red.

Author Contributions

Conceptualization, A.M.N. and I.O.; methodology, A.M.N. and I.O.; formal analysis, A.M.N.; investigation, A.M.N. and V.M.; writing—original draft preparation, A.M.N.; writing—review and editing, I.O. and J.M.S.-H.; visualization, A.M.N.; supervision, I.O. and J.M.S.-H.; project administration, J.M.S.-H.; funding acquisition, J.M.S.-H. All authors have read and agreed to the published version of the manuscript.

Funding

This research was funded by the Spanish Ministry of Science and Innovation, Programe DESCARTES “Development of water and biogas purification materials from waste pyrolysis” TED2021-130147B-C22 and CAST-V project “Circular Advanced Sorbents for Thermochemical Valorization” PID2023-148889NA-I00.

Informed Consent Statement

Not applicable.

Data Availability Statement

Data available on request from the authors.

Conflicts of Interest

The authors declare no conflicts of interest.

Abbreviations

The following abbreviation are used in this manuscript:
BETBrunauer–Emmett–Teller
BJHBarrett–Joyner–Halenda
DTGDerivative thermogravimetry
IUPACInternational Union of Pure and Applied Chemistry
MFCsMass flow controllers
PFOPseudo first order
PICPressure indicator controller
PSPistachio shell
PSBPistachio shell biochar
PSB-CAPistachio shell biochar chemically activated
PSB-PAPistachio shell biochar physically activated
PSOPseudo second order
SSASpecific surface area
TGAThermogravimetric analysis
TICTemperature indicator controller
WHSVWeight hourly space velocity

References

  1. Chen, W.-H.; Naveen, C.; Ghodke, P.K.; Sharma, A.K.; Bobde, P. Co-pyrolysis of lignocellulosic biomass with other carbonaceous materials: A review on advance technologies, synergistic effect, and future prospectus. Fuel 2023, 345, 128177. [Google Scholar] [CrossRef]
  2. Ronsse, F.; van Hecke, S.; Dickinson, D.; Prins, W. Production and characterization of slow pyrolysis biochar: Influence of feedstock type and pyrolysis conditions. GCB Bioenergy 2013, 5, 104–115. [Google Scholar] [CrossRef]
  3. Sajjadi, B.; Chen, W.-Y.; Egiebor, N.O. A comprehensive review on physical activation of biochar for energy and environmental applications. Rev. Chem. Eng. 2019, 35, 735–776. [Google Scholar] [CrossRef]
  4. Jung, S.; Park, Y.-K.; Kwon, E.E. Strategic use of biochar for CO2 capture and sequestration. J. CO2 Util. 2019, 32, 128–139. [Google Scholar] [CrossRef]
  5. Sajjadi, B.; Zubatiuk, T.; Leszczynska, D.; Leszczynski, J.; Chen, W.Y. Chemical activation of biochar for energy and environmental applications: A comprehensive review. Rev. Chem. Eng. 2019, 35, 777–815. [Google Scholar] [CrossRef]
  6. Hoang, A.T.; Varbanov, P.S.; Nižetić, S.; Sirohi, R.; Pandey, A.; Luque, R.; Ng, K.H.; Pham, V.V. Perspective review on Municipal Solid Waste-to-energy route: Characteristics, management strategy, and role in circular economy. J. Clean. Prod. 2022, 359, 131897. [Google Scholar] [CrossRef]
  7. Análisis de la Realidad Productiva y Cultivo Ecológico de Frutos Secos; Subdirección General de Frutas y Hortalizas y Viticultura: Madrid, Spain, 2022.
  8. Tonbul, Y. Pyrolysis of pistachio shell as a biomass. J. Therm. Anal. Calorim. 2008, 91, 641–647. [Google Scholar] [CrossRef]
  9. Kursunoglu, S.; Demir, I. The potential of pistachio shell-based activated carbons for metal removal from aqueous solutions: A review. Energy Sources Part A Recovery Util. Environ. Eff. 2022, 44, 8572–8590. [Google Scholar] [CrossRef]
  10. Komnitsas, K.; Zaharaki, D.; Pyliotis, I.; Vamvuka, D.; Bartzas, G. Assessment of Pistachio Shell Biochar Quality and Its Potential for Adsorption of Heavy Metals. Waste Biomass Valorization 2015, 6, 805–816. [Google Scholar] [CrossRef]
  11. Saghir, S.; Pu, C.; Fu, E.; Wang, Y.; Xiao, Z. Synthesis of high surface area porous biochar obtained from pistachio shells for the efficient adsorption of organic dyes from polluted water. Surf. Interfaces 2022, 34, 102357. [Google Scholar] [CrossRef]
  12. Wen, C.; Liu, T.; Wang, D.; Wang, Y.; Chen, H.; Luo, G.; Zhou, Z.; Li, C.; Xu, M. Biochar as the effective adsorbent to combustion gaseous pollutants: Preparation, activation, functionalization and the adsorption mechanisms. Prog. Energy Combust. Sci. 2023, 99, 101098. [Google Scholar] [CrossRef]
  13. Villardon, A.; Alcazar-Ruiz, A.; Dorado, F.; Sanchez- Silva, L. Enhancing carbon dioxide uptake in biochar derived from husk biomasses: Optimizing biomass particle size and steam activation conditions. J. Environ. Chem. Eng. 2024, 12, 113352. [Google Scholar] [CrossRef]
  14. Li, X.; Shen, Q.; Zhang, D.; Mei, X.; Ran, W.; Xu, Y.; Yu, G. Functional Groups Determine Biochar Properties (pH and EC) as Studied by Two-Dimensional 13C NMR Correlation Spectroscopy. PLoS ONE 2013, 8, e65949. [Google Scholar] [CrossRef]
  15. Pathomrotsakun, J.; Nakason, K.; Kraithong, W.; Khemthong, P.; Panyapinyopol, B.; Pavasant, P. Fuel properties of biochar from torrefaction of ground coffee residue: Effect of process temperature, time, and sweeping gas. Biomass Convers. Biorefinery 2020, 10, 743–753. [Google Scholar] [CrossRef]
  16. Salazar-Cruz, B.A.; Chávez-Cinco, M.Y.; Morales-Cepeda, A.B.; Ramos-Galván, C.E.; Rivera-Armenta, J.L. Evaluation of Thermal Properties of Composites Prepared from Pistachio Shell Particles Treated Chemically and Polypropylene. Molecules 2022, 27, 426. [Google Scholar] [CrossRef]
  17. Açıkalın, K. Pyrolytic characteristics and kinetics of pistachio shell by thermogravimetric analysis. J. Therm. Anal. Calorim. 2012, 109, 227–235. [Google Scholar] [CrossRef]
  18. Fu, Y.; Shen, Y.; Zhang, Z.; Ge, X.; Chen, M. Activated bio-chars derived from rice husk via one- and two-step KOH-catalyzed pyrolysis for phenol adsorption. Sci. Total Environ. 2019, 646, 1567–1577. [Google Scholar] [CrossRef]
  19. Ma, M.; Ying, H.; Cao, F.; Wang, Q.; Ai, N. Adsorption of congo red on mesoporous activated carbon prepared by CO2 physical activation. Chin. J. Chem. Eng. 2020, 28, 1069–1076. [Google Scholar] [CrossRef]
  20. Hong, S.-M.; Choi, S.W.; Kim, S.H.; Lee, K.B. Porous carbon based on polyvinylidene fluoride: Enhancement of CO2 adsorption by physical activation. Carbon 2016, 99, 354–360. [Google Scholar] [CrossRef]
  21. Sing, K.S.W. Reporting physisorption data for gas/solid systems with special reference to the determination of surface area and porosity (Recommendations 1984). Pure Appl. Chem. 1985, 57, 603–619. [Google Scholar] [CrossRef]
  22. Martín-Martínez, J.M. Adsorción Física de Gases y Vapores por Carbones; Universidad de Alicante, Secretariado de Publicaciones: Alicante, Spain, 1990. [Google Scholar]
  23. Alhassan, M.; Andresen, J. Effect of Bone during Fixed Bed Pyrolysis of Pistachio Nut Shell. Int. J. Sci. Eng. Investig. 2013, 2, 37–48. [Google Scholar]
  24. Shafawi, A.N.; Mohamed, A.R.; Lahijani, P.; Mohammadi, M. Recent advances in developing engineered biochar for CO2 capture: An insight into the biochar modification approaches. J. Environ. Chem. Eng. 2021, 9, 106869. [Google Scholar] [CrossRef]
  25. Xu, X.; Kan, Y.; Zhao, L.; Cao, X. Chemical transformation of CO2 during its capture by waste biomass derived biochars. Environ. Pollut. 2016, 213, 533–540. [Google Scholar] [CrossRef] [PubMed]
  26. Oschatz, M.; Antonietti, M. A search for selectivity to enable CO2 capture with porous adsorbents. Energy Environ. Sci. 2018, 11, 57–70. [Google Scholar] [CrossRef]
  27. D’Alessandro, D.M.; Smit, B.; Long, J.R. Carbon Dioxide Capture: Prospects for New Materials. Angew. Chem. Int. Ed. 2010, 49, 6058–6082. [Google Scholar] [CrossRef]
  28. Yuan, X.; Wang, J.; Deng, S.; Dissanayake, P.D.; Wang, S.; You, S.; Yip, A.C.K.; Li, S.; Jeong, Y.; Tsang, D.C.W.; et al. Sustainable Food Waste Management: Synthesizing Engineered Biochar for CO2 Capture. ACS Sustain. Chem. Eng. 2022, 10, 13026–13036. [Google Scholar] [CrossRef]
  29. Tang, Z.; Gao, J.; Zhang, Y.; Du, Q.; Feng, D.; Dong, H.; Peng, Y.; Zhang, T.; Xie, M. Ultra-microporous biochar-based carbon adsorbents by a facile chemical activation strategy for high-performance CO2 adsorption. Fuel Process. Technol. 2023, 241, 107613. [Google Scholar] [CrossRef]
  30. Liu, S.-H.; Huang, Y.-Y. Valorization of coffee grounds to biochar-derived adsorbents for CO2 adsorption. J. Clean. Prod. 2018, 175, 354–360. [Google Scholar] [CrossRef]
  31. Plaza, M.G.; Pevida, C.; Martín, C.F.; Fermoso, J.; Pis, J.J.; Rubiera, F. Developing almond shell-derived activated carbons as CO2 adsorbents. Sep. Purif. Technol. 2010, 71, 102–106. [Google Scholar] [CrossRef]
  32. Liu, J.; Liu, G.; Zhang, W.; Li, Z.; Jin, H.; Xing, F. A new approach to CO2 capture and sequestration: A novel carbon capture artificial aggregates made from biochar and municipal waste incineration bottom ash. Constr. Build. Mater. 2023, 398, 132472. [Google Scholar] [CrossRef]
  33. Zhang, C.; Ji, Y.; Li, C.; Zhang, Y.; Sun, S.; Xu, Y.; Jiang, L.; Wu, C. The Application of Biochar for CO2 Capture: Influence of Biochar Preparation and CO2 Capture Reactors. Ind. Eng. Chem. Res. 2023, 62, 17168–17181. [Google Scholar] [CrossRef] [PubMed]
  34. González, A.S.; Plaza, M.G.; Rubiera, F.; Pevida, C. Sustainable biomass-based carbon adsorbents for post-combustion CO2 capture. Chem. Eng. J. 2013, 230, 456–465. [Google Scholar] [CrossRef]
  35. Yıldız, Z.; Kaya, N.; Topcu, Y.; Uzun, H. Pyrolysis and optimization of chicken manure wastes in fluidized bed reactor: CO2 capture in activated bio-chars. Process Saf. Environ. Prot. 2019, 130, 297–305. [Google Scholar] [CrossRef]
  36. Kumar, A.; Singh, E.; Mishra, R.; Lo, S.-L.; Kumar, S. A green approach towards sorption of CO2 on waste derived biochar. Environ. Res. 2022, 214, 113954. [Google Scholar] [CrossRef]
  37. Monazam, E.R.; Shadle, L.J.; Miller, D.C.; Pennline, H.W.; Fauth, D.J.; Hoffman, J.S.; Gray, M.L. Equilibrium and kinetics analysis of carbon dioxide capture using immobilized amine on a mesoporous silica. AIChE J. 2013, 59, 923–935. [Google Scholar] [CrossRef]
  38. Wang, J.; Guo, X. Adsorption kinetic models: Physical meanings, applications, and solving methods. J. Hazard. Mater. 2020, 390, 122156. [Google Scholar] [CrossRef]
  39. Revellame, E.D.; Fortela, D.L.; Sharp, W.; Hernandez, R.; Zappi, M.E. Adsorption kinetic modeling using pseudo-first order and pseudo-second order rate laws: A review. Clean. Eng. Technol. 2020, 1, 100032. [Google Scholar] [CrossRef]
  40. Liu, Q.; Shi, J.; Zheng, S.; Tao, M.; He, Y.; Shi, Y. Kinetics Studies of CO2 Adsorption/Desorption on Amine-Functionalized Multiwalled Carbon Nanotubes. Ind. Eng. Chem. Res. 2014, 53, 11677–11683. [Google Scholar] [CrossRef]
  41. Liu, F.; Chen, S.; Gao, Y. Synthesis of porous polymer based solid amine adsorbent: Effect of pore size and amine loading on CO2 adsorption. J. Colloid Interface Sci. 2017, 506, 236–244. [Google Scholar] [CrossRef]
  42. Wei, M.; Yu, Q.; Duan, W.; Hou, L.; Liu, K.; Qin, Q.; Liu, S.; Dai, J. Equilibrium and Kinetics Analysis of CO2 Adsorption on Waste Ion-exchange Resin-based Activated Carbon. J. Taiwan Inst. Chem. Eng. 2017, 77, 161–167. [Google Scholar] [CrossRef]
  43. Yang, C.; Wang, Y.; Liang, M.; Su, Z.; Liu, X.; Fan, H.; Bandosz, T.J. Towards improving H2S catalytic oxidation on porous carbon materials at room temperature: A review of governing and influencing factors, recent advances, mechanisms and perspectives. Appl. Catal. B Environ. 2023, 323, 122133. [Google Scholar] [CrossRef]
  44. Panwar, N.L.; Pawar, A. Influence of activation conditions on the physicochemical properties of activated biochar: A review. Biomass Convers. Biorefinery 2022, 12, 925–947. [Google Scholar] [CrossRef]
  45. Choudhury, A.; Lansing, S. Adsorption of hydrogen sulfide in biogas using a novel iron-impregnated biochar scrubbing system. J. Environ. Chem. Eng. 2021, 9, 104837. [Google Scholar] [CrossRef]
  46. Adib, F.; Bagreev, A.; Bandosz, T.J. Adsorption/Oxidation of Hydrogen Sulfide on Nitrogen-Containing Activated Carbons. Langmuir 2000, 16, 1980–1986. [Google Scholar] [CrossRef]
  47. Huang, D.; Wang, N.; Bai, X.; Chen, Y.; Xu, Q. The influencing mechanism of O2, H2O, and CO2 on the H2S removal of food waste digestate-derived biochar with abundant minerals. Biochar 2022, 4, 71. [Google Scholar] [CrossRef]
  48. Hervy, M.; Pham Minh, D.; Gérente, C.; Weiss-Hortala, E.; Nzihou, A.; Villot, A.; Le Coq, L. H2S removal from syngas using wastes pyrolysis chars. Chem. Eng. J. 2018, 334, 2179–2189. [Google Scholar] [CrossRef]
  49. Vuppaladadiyam, A.K.; Jena, M.K.; Hakeem, I.G.; Patel, S.; Veluswamy, G.; Thulasiraman, A.V.; Surapaneni, A.; Shah, K. A critical review of biochar versus hydrochar and their application for H2S removal from biogas. Rev. Environ. Sci. Bio/Technol. 2024, 23, 699–737. [Google Scholar] [CrossRef]
  50. Ho, Y.S.; McKay, G. Pseudo-second order model for sorption processes. Process Biochem. 1999, 34, 451–465. [Google Scholar] [CrossRef]
  51. Shafeeyan, M.S.; Daud, W.M.A.W.; Shamiri, A.; Aghamohammadi, N. Modeling of Carbon Dioxide Adsorption onto Ammonia-Modified Activated Carbon: Kinetic Analysis and Breakthrough Behavior. Energy Fuels 2015, 29, 6565–6577. [Google Scholar] [CrossRef]
  52. Serna-Guerrero, R.; Sayari, A. Modeling adsorption of CO2 on amine-functionalized mesoporous silica. 2: Kinetics and breakthrough curves. Chem. Eng. J. 2010, 161, 182–190. [Google Scholar] [CrossRef]
  53. Fernández-Martínez, R.; Ortiz, I.; Gómez-Mancebo, M.B.; Alcaraz, L.; Fernández, M.; López, F.A.; Rucandio, I.; Sánchez-Hervás, J.M. Transformation of Graphite Recovered from Batteries into Functionalized Graphene-Based Sorbents and Application to Gas Desulfurization. Molecules 2024, 29, 3577. [Google Scholar] [CrossRef] [PubMed]
  54. Sánchez, J.M.; Ruiz, E.; Otero, J. Selective Removal of Hydrogen Sulfide from Gaseous Streams Using a Zinc-Based Sorbent. Ind. Eng. Chem. Res. 2005, 44, 241–249. [Google Scholar] [CrossRef]
Figure 1. Thermogravimetric analysis of the adsorbents at a heating rate of 10 °C/min under pyrolysis conditions; TG (solid line) and DTG (dotted line).
Molecules 30 01501 g001
Figure 2. N2 adsorption–desorption isotherms of the synthesized adsorbents.
Molecules 30 01501 g002
Figure 3. SEM images of PS (A), PSB (B), PSB-CA (C), and PSB-PA (D).
Molecules 30 01501 g003
Figure 4. Correlation between CO2 adsorption capacity and BET surface area for the adsorbents.
Molecules 30 01501 g004
Figure 5. PSB-CA adsorption curves for different concentrations of CO2 (20, 40, 60, 80, and 100% v/v).
Molecules 30 01501 g005
Figure 6. CO2 adsorption capacity of PSB-CA during cyclic adsorption–desorption.
Molecules 30 01501 g006
Figure 7. Adsorption curves of kinetic models fitted by linear fitting.
Molecules 30 01501 g007
Figure 8. Adsorption curves of kinetic models fitted by non-linear fitting.
Molecules 30 01501 g008
Figure 9. H2S breakthrough results for the biosorbents studied, with intrinsic moisture and dry conditions. (Adsorption: 30 °C, 100 ppm H2S, balance N2, GHSV = 1000 h−1, 1 bar).
Molecules 30 01501 g009
Figure 10. SEM and EDS mapping of fresh PSB-CA (A-1), PSB-CA after H2S adsorption (B-1), and PSB-CA after adsorption under dry conditions (C-1). The potassium distribution is color yellow (A-II, B-II, and C-II), while the sulfur content is in red (B-II,C-III).
Molecules 30 01501 g010
Figure 11. H2S adsorption mechanism on the activated biochar.
Molecules 30 01501 g011
Figure 12. Microactivity Pro unit diagram used for the H2S adsorption.
Molecules 30 01501 g012
Table 1. Ultimate analysis (data in percentage of the total on a dry matter basis) and properties of the adsorbents.
AdsorbentC% (d.b)H%
(d.b)
N%
(d.b)
S%
(d.b)
O% 1
(d.b)
H/CO/CAsh%pHρ (g/mL)Production Yield (%)
PS45.56.80.10<0.1047.71.80.79<0.106.870.579-
PSB88.43.60.33<0.107.420.490.060.259.110.40723.3
PSB-CA77.72.50.28<0.1015.720.390.153.89.40.47922.8
PSB-PA95.31.60.42<0.102.360.200.020.328.840.44920.2
d.b: Dry matter basis, 1 obtained by subtracting the sum of the CHNS and ash contents.
Table 2. Adsorbent surface area characterization and porosimetry values.
AdsorbentBET Area(m2/g)Area
Micro
(m2/g)
Area
External
(m2/g)
VT (cm3/g)Vp micro (cm3/g)Vp meso (cm3/g)DAvg (nm)Total
Intrusion Volume (cm3/g)
Total Pore Area (m2/g)Porosity (%)
PS0.20.00040.220.001-0.0016.120.164.317
PSB293238550.140.110.0311.920.589.647
PSB-CA531448820.230.210.0241.900.738.747
PSB-PA3401651740.160.070.081.820.677.245
Table 4. Adsorption kinetic parameters obtained by the linear fitting of CO2 on biochar derived from pistachio shell at 30 °C.
ModelParameterPSPSBPSB-PAPSB-CA
PFOqe (mg g−1)7.6484362
k1 (min−1)0.0350.640.720.46
R20.99670.96430.94350.9413
PSOqe (mg g−1)118380115
k2 (min−1)0.00380.00170.00720.0043
R20.99500.29790.84580.8505
Avramiqe (mg g−1)8.7405796
nAv0.320.621.131.04
kAv (min−1)0.0522.200.750.56
R20.99530.97940.96920.9580
Experimentalqe exp (mg g−1)8.4425787
Table 5. Adsorption kinetic parameters obtained by the non-linear fitting of CO2 on biochar derived from pistachio shell at 30 °C.
ModelParameterPSPSBPSB-PAPSB-CA
PFOqe (mg g−1)7.7415892
k1 (min−1)0.0500.600.990.67
R20.99700.96670.99970.9976
PSOqe (mg g−1)104971115
k2 (min−1)0.00430.00130.0140.0058
R20.99970.92860.96920.98629
Avramiqe8.3405589
NAv0.861.641.291.12
kAv (min−1)0.0520.620.990.70
R20.99950.99860.99970.9996
Experimentalqe exp (mg g−1)8.4425787
Disclaimer/Publisher’s Note: The statements, opinions and data contained in all publications are solely those of the individual author(s) and contributor(s) and not of MDPI and/or the editor(s). MDPI and/or the editor(s) disclaim responsibility for any injury to people or property resulting from any ideas, methods, instructions or products referred to in the content.

