
Enhanced Extraction of Polyphenols, Physicochemical Properties, and Microbial Control in Vitis vinifera L. Juice Using Ultrasound-Assisted Maceration

 ,
,  ,
,  , and
, and
Abstract

1. Introduction
2. Results
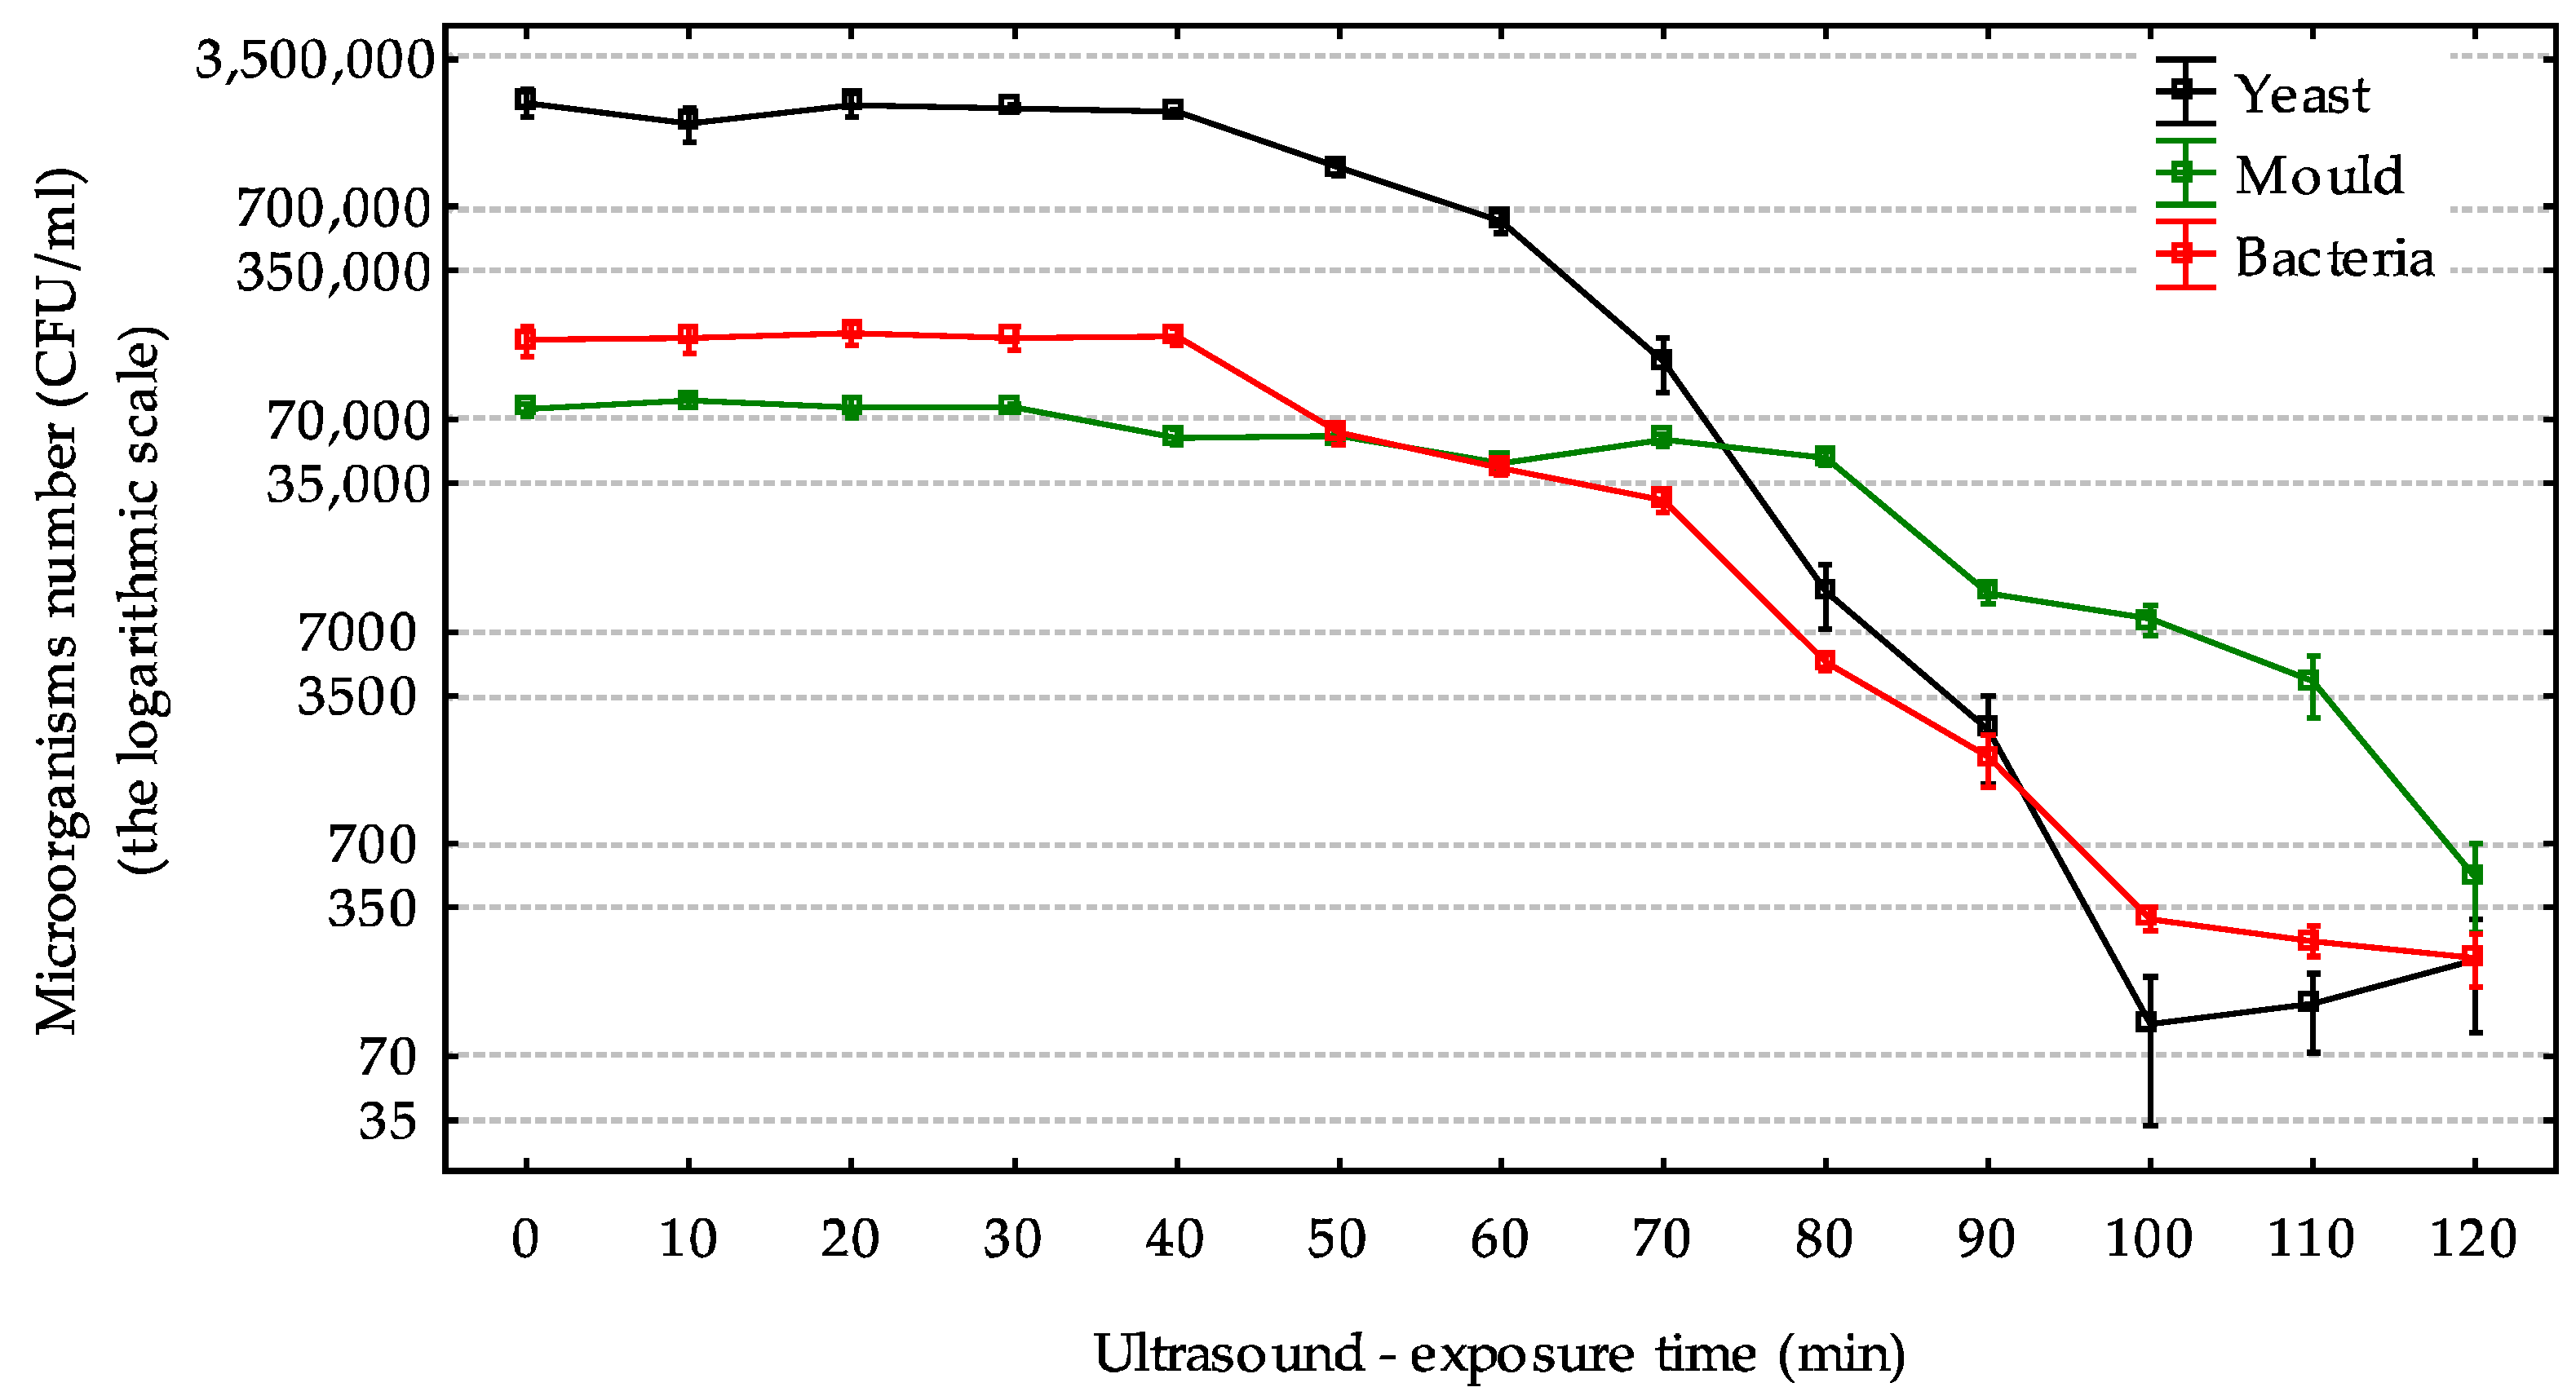
2.1. The Effect of Ultrasound on the Bacteria, Yeast, and Mold
2.2. Influence of Ultrasound on the Physical Characteristics of Musts
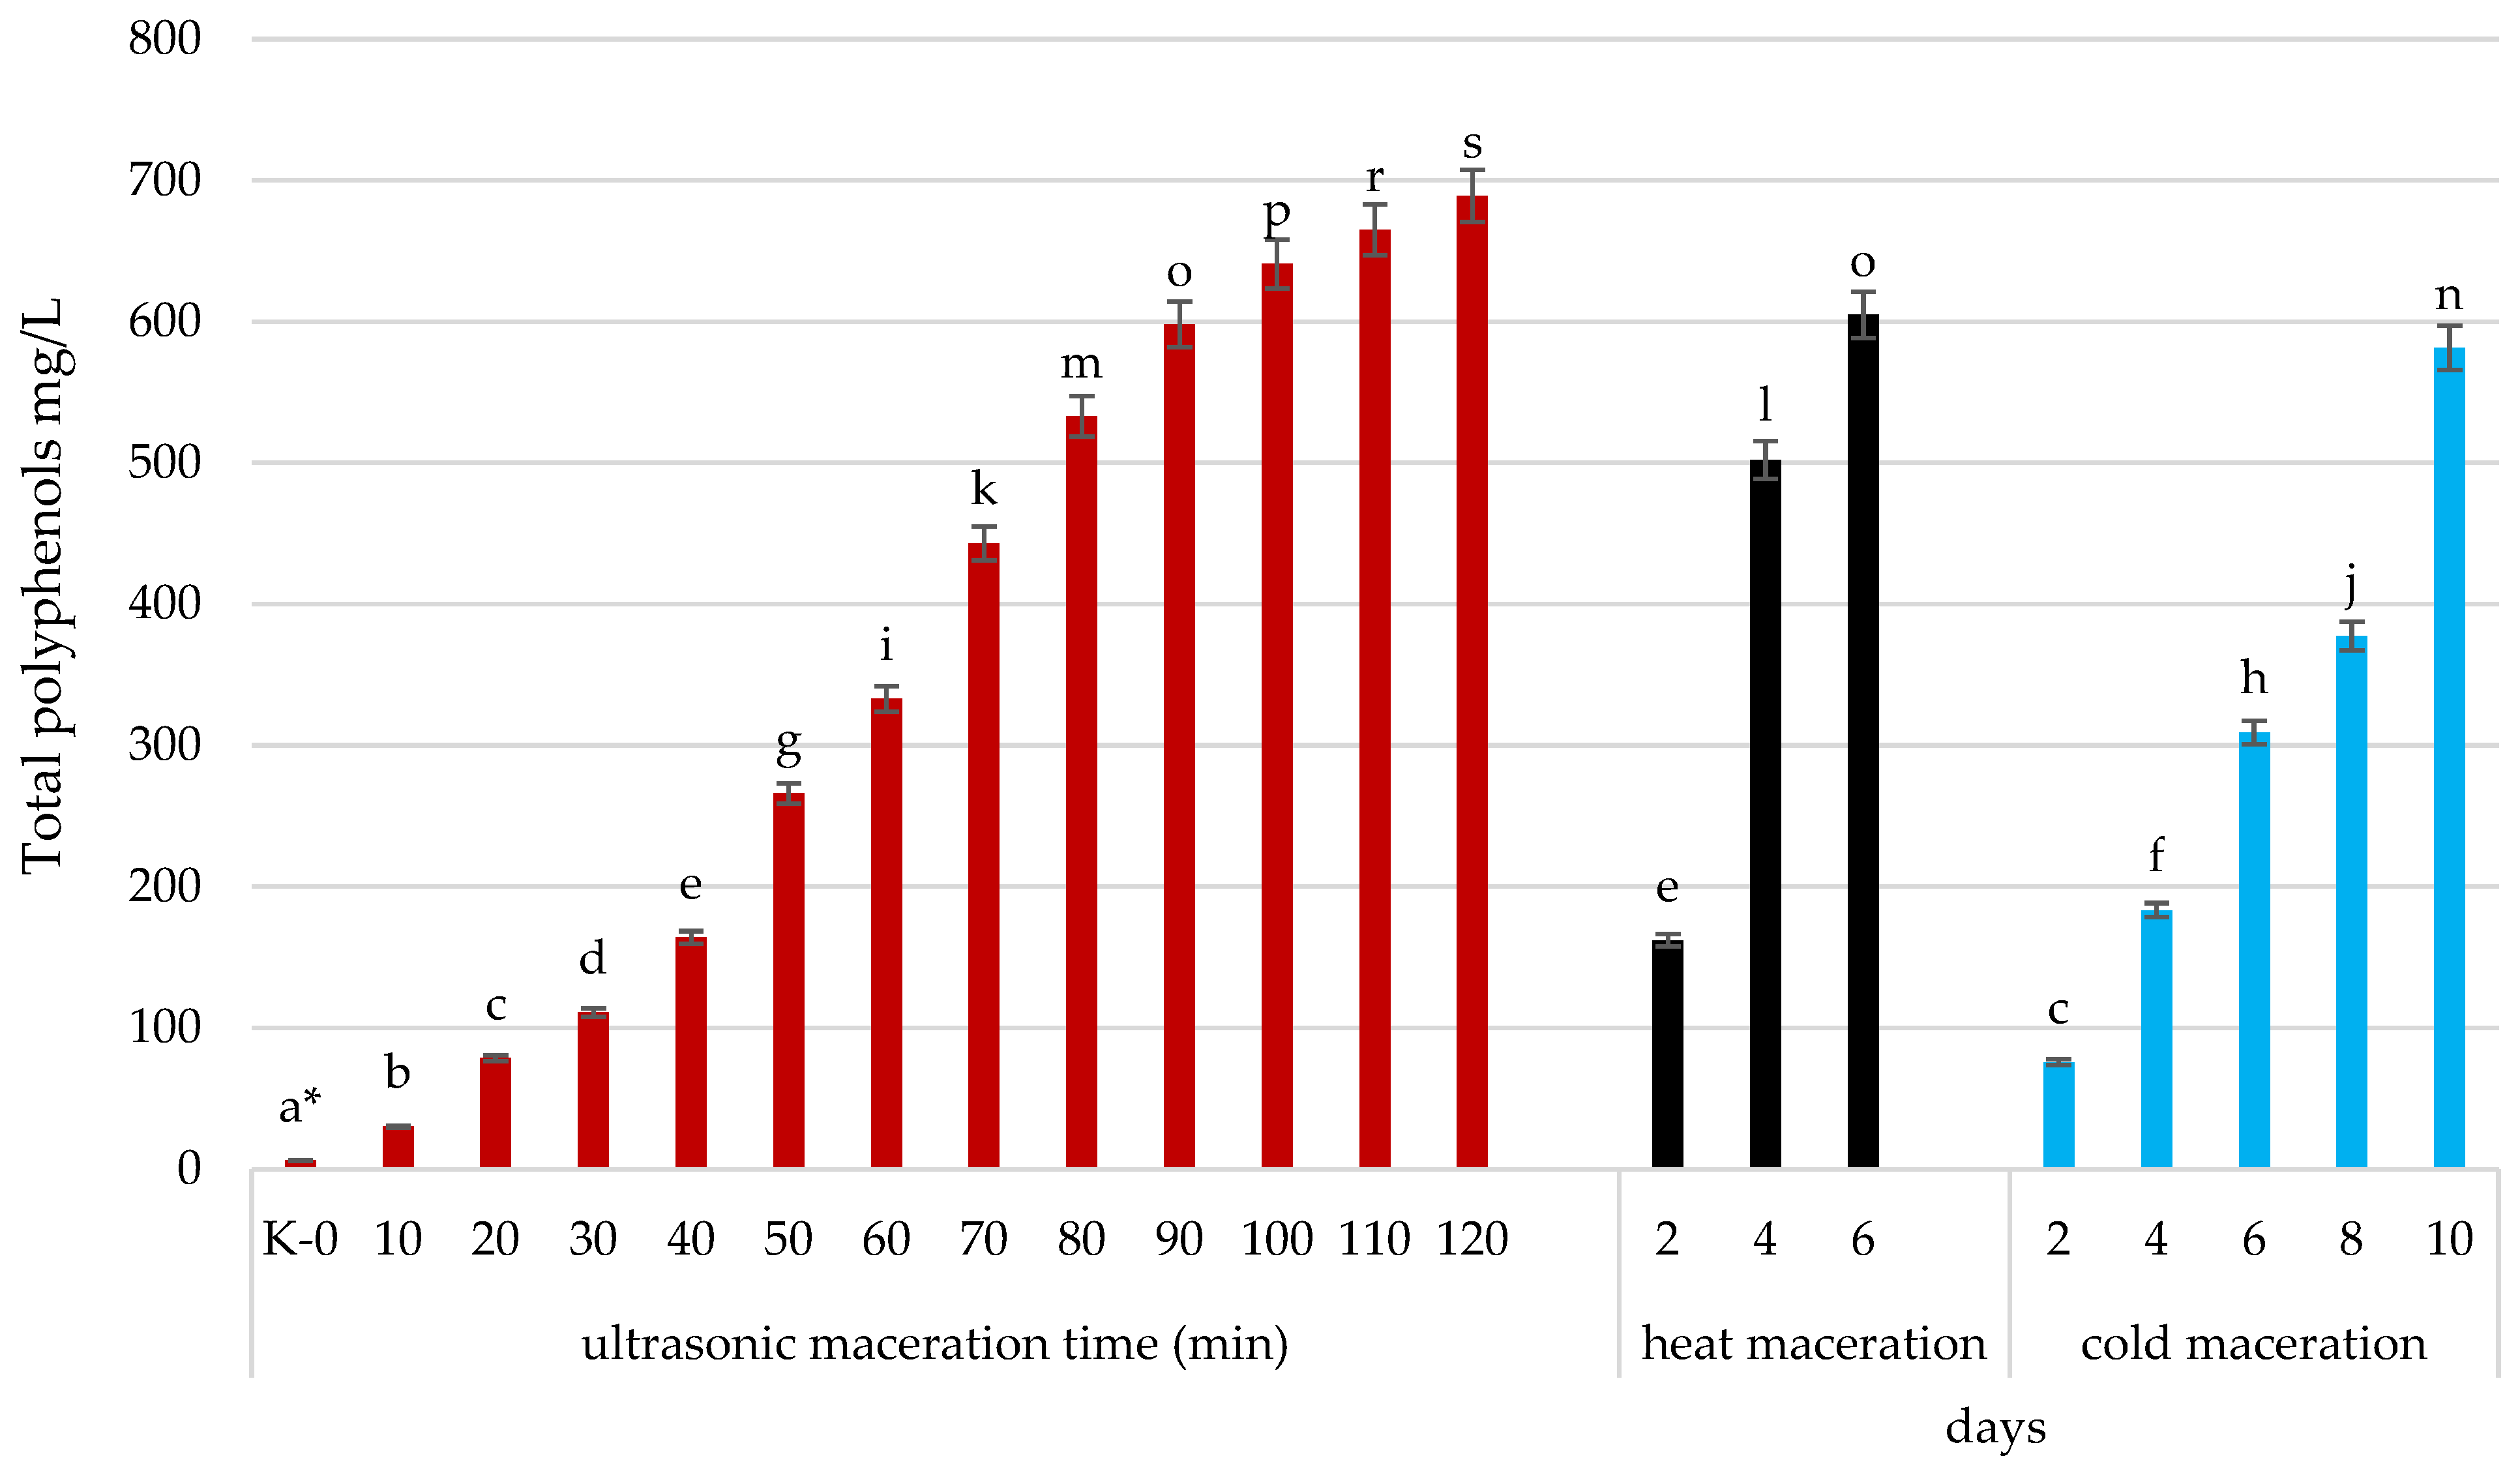
2.3. Influence of Ultrasound on the Chemical Constituents of Musts
3. Discussion
4. Materials and Methods
4.1. Material
4.2. Ultrasonic Reactor and Process Parameters
4.3. Bacteria, Yeast, Mold
4.4. Polyphenolic Compounds
4.5. Juice Quality
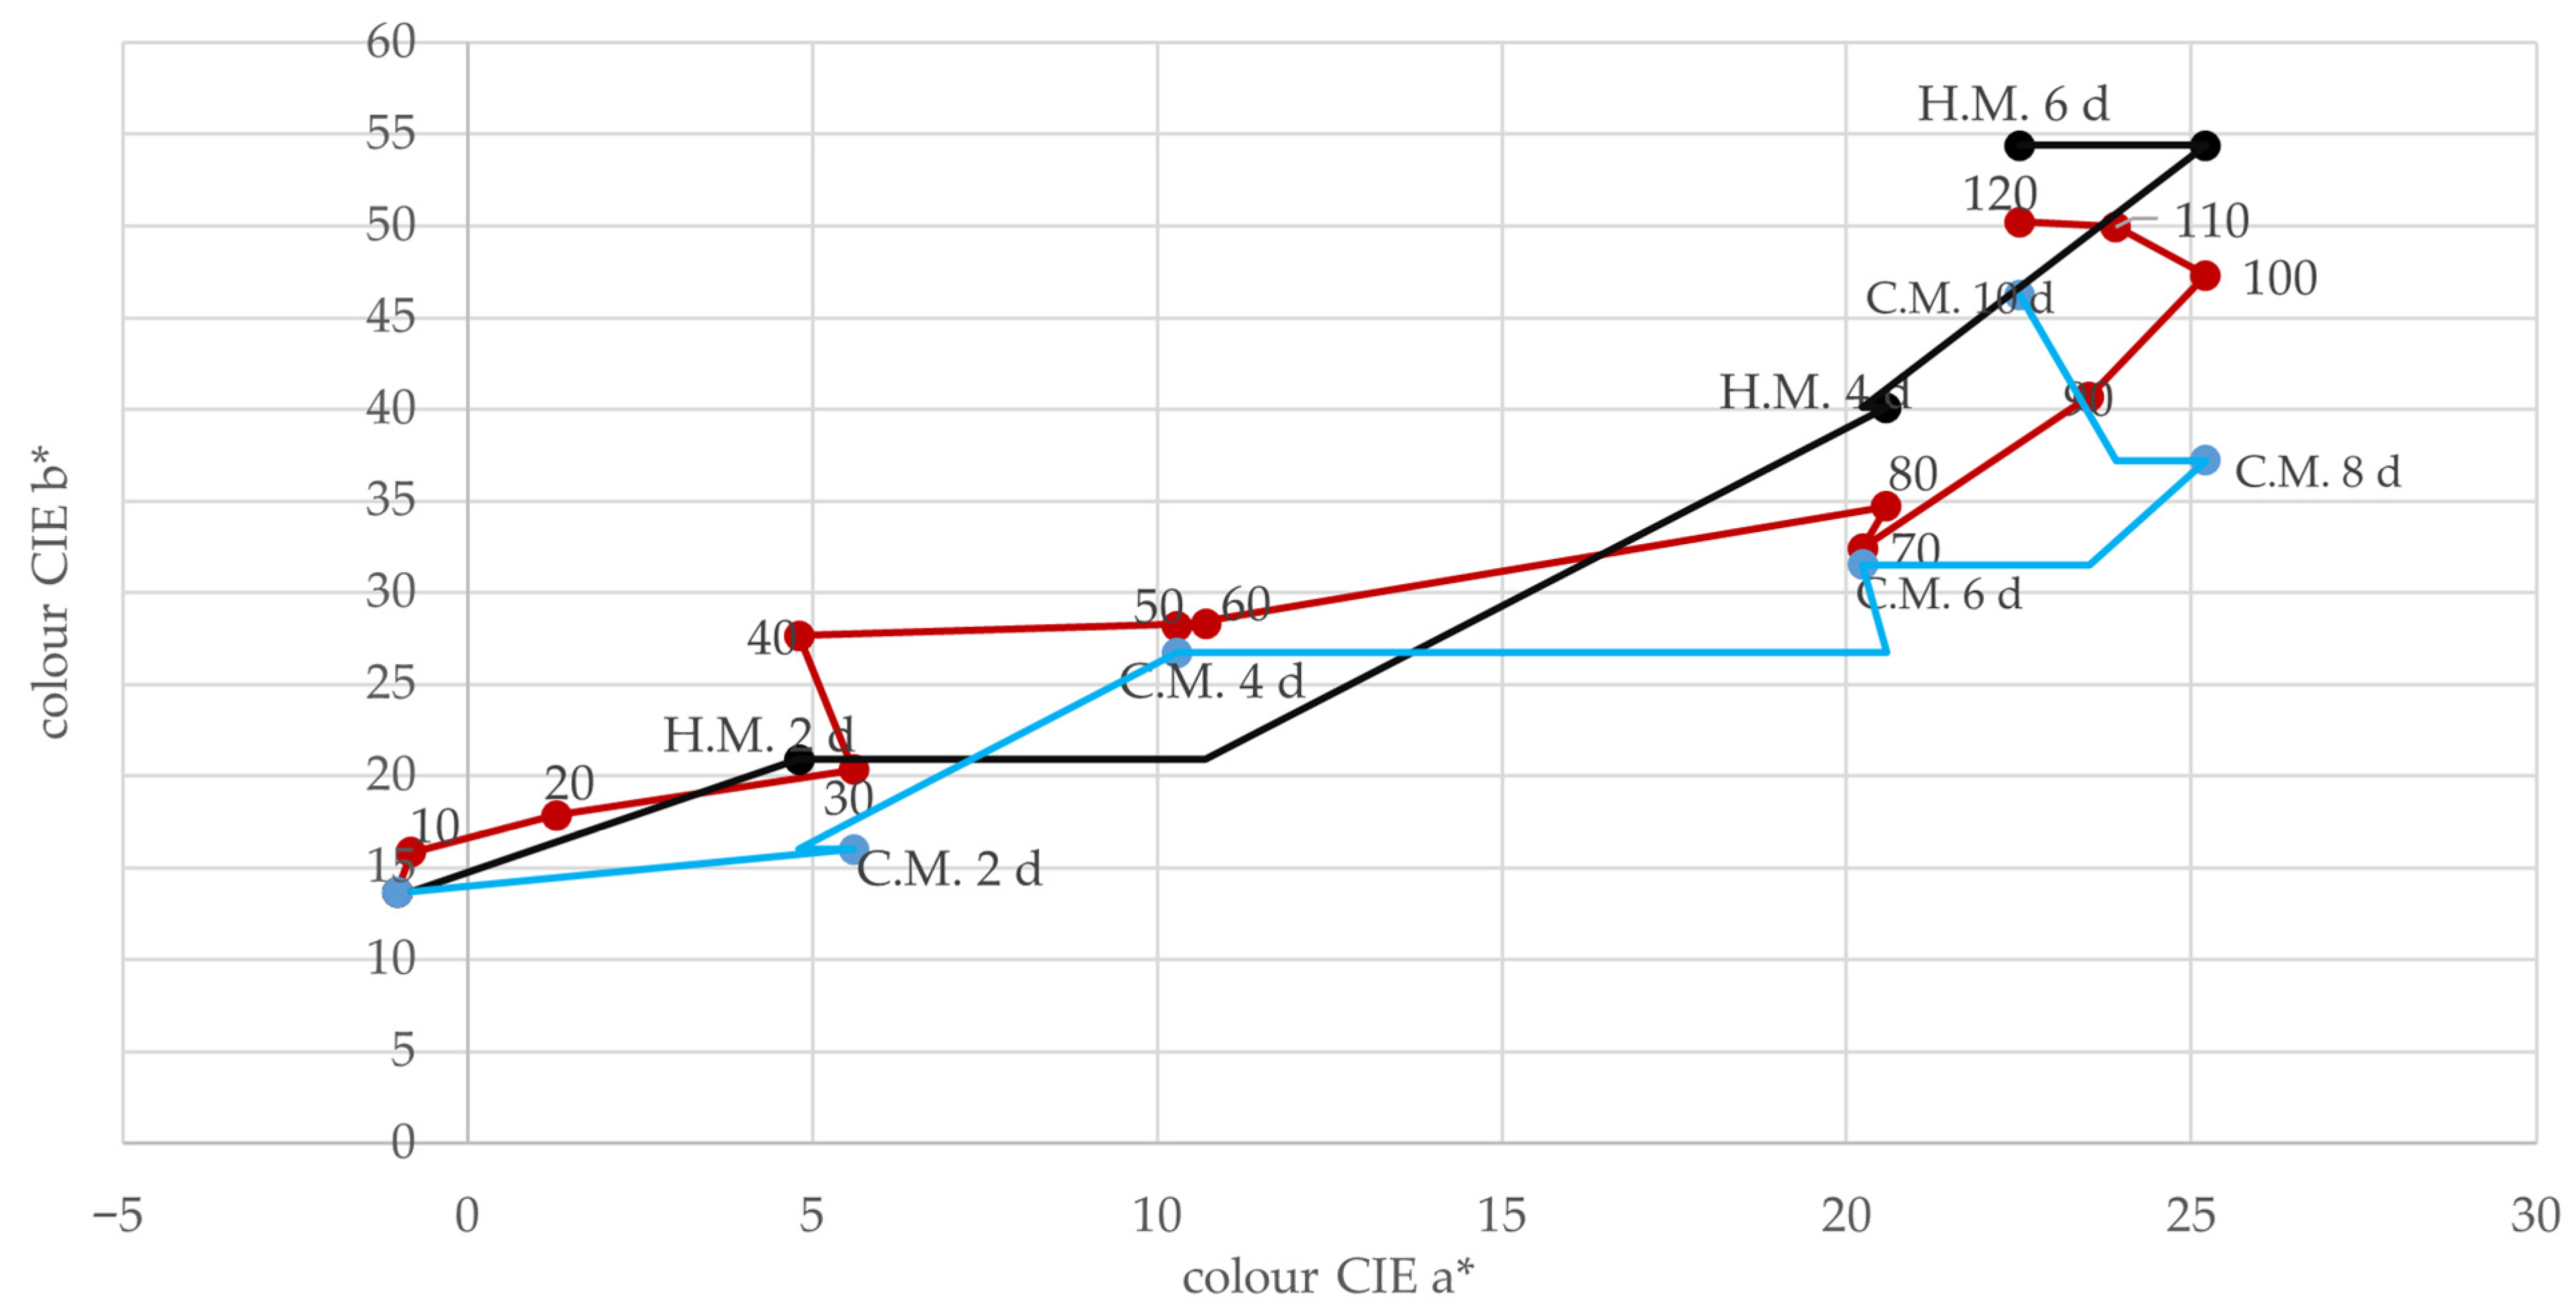
4.6. Color
4.7. Statistical Analysis
5. Conclusions
Author Contributions
Funding
Institutional Review Board Statement
Informed Consent Statement
Data Availability Statement
Conflicts of Interest
References
- Grogan, K.A. The value of added sulphur dioxide in French organic wine. Agric. Econ. 2015, 3, 19. [Google Scholar] [CrossRef]
- Ochmian, I.; Malinowski, R. Effect of Multi-Year Protection of Grapevines with Copper Pesticides on the Content of Heavy Metals in Soil, Leaves, and Fruit. Agronomy 2024, 14, 1677. [Google Scholar] [CrossRef]
- Błaszak, M.; Nowak, A.; Lachowicz, S.; Migdał, W.; Ochmian, I. E-Beam irradiation and ozonation as an alternative to the sulphuric method of wine preservation. Molecules 2019, 24, 3406. [Google Scholar] [CrossRef]
- Błaszak, M.; Jakubowska, B.; Lachowicz-Wiśniewska, S.; Migdał, W.; Gryczka, U.; Ochmian, I. Effectiveness of E-Beam radiation against Saccharomyces cerevisiae, Brettanomyces bruxellensis, and wild yeast and their influence on wine quality. Molecules 2023, 28, 4867. [Google Scholar] [CrossRef] [PubMed]
- Pachnowska, K.; Kochel-Karakulska, J.; Augustyniak, A.; Obradović, V.; Ochmian, I.; Lachowicz-Wiśniewska, S.; Kapusta, I.; Maślana, K.; Mijowska, E.; Cendrowski, K. UV-C and Nanomaterial-Based Approaches for Sulfite-Free Wine Preservation: Effects on Polyphenol Profile and Microbiological Quality. Molecules 2025, 30, 221. [Google Scholar] [CrossRef] [PubMed]
- Kazakis, N.A.; Betsou, C. Detection of baby food sterilized with ionizing radiation using thermoluminescence. Eur. Phys. J. Spec. Top. 2023, 232, 1531–1542. [Google Scholar] [CrossRef]
- Zupanc, M.; Pandur, Ž.; Stepišnik Perdih, T.; Stopar, D.; Petkovšek, M.; Dular, M. Effects of cavitation on different microorganisms: The current understanding of the mechanisms taking place behind the phenomenon. Ultrason. Sonochem. 2019, 57, 147–165. [Google Scholar] [CrossRef]
- Piyasena, P.; Mohareb, E.; McKellar, R.C. Inactivation of microbes using ultrasound: A review. Int. J. Food Microbiol. 2003, 87, 207–216. [Google Scholar] [CrossRef] [PubMed]
- Chemat, F.; Khan, M.K. Applications of ultrasound in food technology: Processing, preservation and extraction. Ultrason. Sonochem. 2011, 18, 813–835. [Google Scholar] [CrossRef] [PubMed]
- Reisz, P.; Berdahl, D.; Christman, C.L. Free radical generation by ultrasound in aqueous and nonaqueous solutions. Environ. Health Perspect. 1985, 64, 233–252. [Google Scholar] [CrossRef]
- Yusof, N.S.M.; Babgi, B.; Alghamdi, Y.; Aksu, M.; Madhavan, J.; Ashokkumar, M. Physical and chemical effects of acoustic cavitation in selected ultrasonic cleaning applications. Ultrason. Sonochem. 2016, 29, 568–576. [Google Scholar] [CrossRef] [PubMed]
- Lauteri, C.; Ferri, G.; Piccinini, A.; Pennisi, L.; Vergara, A. Ultrasound Technology as Inactivation Method for Foodborne Pathogens: A Review. Foods 2023, 12, 1212. [Google Scholar] [CrossRef] [PubMed]
- Soro, A.B.; Oliveira, M.; O’Donnell, C.P.; Tiwari, B.K. Ultrasound assisted modulation of yeast growth and inactivation kinetics. Ultrason. Sonochem. 2021, 80, 105819. [Google Scholar] [CrossRef]
- Costa, E.; da Silva, J.F.; Cosme, F.; Jordão, A.M. Adaptability of some French red grape varieties cultivated at two different Portuguese terroirs: Comparative analysis with two Portuguese red grape varieties using physicochemical and phenolic parameters. Int. Food Res. J. 2015, 78, 302–312. [Google Scholar] [CrossRef]
- Du Toit, W.J.; Oberholser, A. Processing and impact on antioxidants in beverages. In Processing and Impact on Antioxidants in Beverages; Preedy, V.R., Ed.; Elsevier Inc.: Amsterdam, The Netherlands, 2014; pp. 59–67. Available online: https://shop.elsevier.com/books/processing-and-impact-on-antioxidants-in-beverages/preedy/978-0-12-404738-9 (accessed on 11 October 2024).
- Pateraki, C.; Paramithiotis, S.; Doulgeraki, A.I.; Kallithraka, S.; Kotseridis, Y.; Drosinos, E.H. Effect of sulfur dioxide addition in wild yeast population dynamics and polyphenolic composition during spontaneous red wine fermentation from Vitis vinifera cultivar Agiorgitiko. Eur. Food Res. Technol. 2014, 239, 1067–1075. [Google Scholar] [CrossRef]
- Francesca, N.; Sannino, C.; Settanni, L.; Corona, O.; Barone, E.; Moschetti, G. Microbiological and chemical monitoring of Marsala base wine obtained by spontaneous fermentation during large-scale production. Ann. Microbiol. 2014, 64, 1643–1657. [Google Scholar] [CrossRef]
- Luo, H.; Schmid, F.; Grbin, P.R.; Jiranek, V. Viability of common wine spoilage organisms after exposure to high power ultrasonics. Ultrason. Sonochem. 2012, 19, 415–420. [Google Scholar] [CrossRef] [PubMed]
- Gracin, L.; Jambrak, A.R.; Juretić, H.; Dobrović, S.; Barukčić, I.; Grozdanović, M.; Smoljanić, G. Influence of high power ultrasound on Brettanomyces and lactic acid bacteria in wine in continuous flow treatment. Appl. Acoust. 2016, 103, 143–147. [Google Scholar] [CrossRef]
- Novodvorska, M.; Stratford, M.; Blythe, M.J.; Wilson, R.; Beniston, R.G.; Archer, D.B. Metabolic activity in dormant conidia of Aspergillus niger and developmental changes during conidial outgrowth. Fungal Genet. Biol. 2016, 94, 23–31. [Google Scholar] [CrossRef] [PubMed]
- Efara, E.; Marquis, F.; Tremblay, A. Scaling Up Biotechnological Chemical Processes: A Better Alternative to the Traditional Develop-Then-Scale Model. Ind. Biotechnol. 2019, 15, 157–161. [Google Scholar] [CrossRef]
- Oszmiański, J.; Lachowicz, S. Effect of the production of dried fruits and juice from chokeberry (Aronia melanocarpa L.) on the content and antioxidative activity of bioactive compounds. Molecules 2016, 21, 1098. [Google Scholar] [CrossRef]
- Setford, P.C.; Jeffery, D.W.; Grbin, P.R.; Muhlack, R.A. Factors affecting extraction and evolution of phenolic compounds during red wine maceration and the role of process modeling. Trends Food Sci. Technol. 2017, 69, 106–117. [Google Scholar] [CrossRef]
- Guler, A. Effects of different maceration techniques on the colour, polyphenols, and antioxidant capacity of grape juice. Food Chem. 2023, 404, 134603. [Google Scholar] [CrossRef]
- Kapusta, I.; Cebulak, T.; Oszmiański, J. Characterization of Polish wines produced from the interspecific hybrid grapes grown in south-east Poland. Eur. Food Res. Technol. 2018, 244, 441–455. [Google Scholar] [CrossRef]
- Ochmian, I.; Przemieniecki, S.W.; Błaszak, M.; Twarużek, M.; Lachowicz-Wiśniewska, S. Antioxidant, Nutritional Properties, Microbiological, and Health Safety of Juice from Organic and Conventional Solaris Wine (Vitis vinifera L.) Farming. Antioxidants 2024, 13, 1214. [Google Scholar] [CrossRef]
- Lieu, L.N.; Le, V.V.M. Application of ultrasound in grape mash treatment in juice processing. Ultrason. Sonochem. 2010, 17, 273–279. [Google Scholar] [CrossRef] [PubMed]
- Lachowicz, S.; Wojdyło, A.; Chmielewska, J.; Oszmiański, J. The influence of yeast type and storage temperature on content of phenolic compounds, antioxidant activity, colour and sensory attributes of chokeberry wine. Eur. Food Res. Technol. 2017, 243, 2199–2209. [Google Scholar] [CrossRef]
- Aleixandre-Tudo, J.L.; Buica, A.; Nieuwoudt, H.; Aleixandre, J.L.; du Toit, W. Spectrophotometric analysis of phenolic compounds in grapes and wines. J. Agric. Food Chem. 2017, 65, 4009–4026. [Google Scholar] [CrossRef] [PubMed]
- Sánchez-Córdoba, C.; Durán-Guerrero, E.; Castro, R. Olfactometric and sensory evaluation of red wines subjected to ultrasound or microwaves during their maceration or ageing stages. LWT 2021, 144, 111228. [Google Scholar] [CrossRef]
- Labrador Fernández, L.; Pérez-Porras, P.; Díaz-Maroto, M.C.; Gómez-Plaza, E.; Pérez-Coello, M.S.; Bautista-Ortín, A.B. The technology of high-power ultrasound and its effect on the color and aroma of rosé wines. J. Sci. Food Agric. 2023, 103, 6616–6624. [Google Scholar] [CrossRef] [PubMed]
- Dos Santos Lima, M.; Dutra, M.D.C.; Toaldo, I.M.; Corrêa, L.C.; Pereira, G.E.; de Oliveira, D.; Ninow, J.L. Phenolic compounds, organic acids and antioxidant activity of grape juices produced in industrial scale by different processes of maceration. Food Chem. 2015, 188, 384–392. [Google Scholar] [CrossRef] [PubMed]
- Tiwari, B.K.; Patras, A.; Brunton, N.; Cullen, P.J.; O’Donnell, C.P. Effect of ultrasound processing on anthocyanins and color of red grape juice. Ultrason. Sonochem. 2010, 17, 598–604. [Google Scholar] [CrossRef] [PubMed]
- Hasan, M.M.; Yun, H.K.; Kwak, E.J.; Baek, K.H. Preparation of resveratrol-enriched grape juice from ultrasonication treated grape fruits. Ultrason. Sonochem. 2014, 21, 729–734. [Google Scholar] [CrossRef] [PubMed]
- Tao, Y.; Wu, D.; Zhang, Q.A.; Sun, D.W. Ultrasound-assisted extraction of phenolics from wine lees: Modeling, optimization and stability of extracts during storage. Ultrason. Sonochem. 2014, 21, 706–715. [Google Scholar] [CrossRef]
- Bautista-Ortín, A.B.; Jiménez-Martínez, M.D.; Jurado, R.; Iniesta, J.A.; Terrades, S.; Andrés, A.; Gómez-Plaza, E. Application of high-power ultrasounds during red wine vinification. Int. J. Food Sci. Technol. 2017, 52, 1314–1323. [Google Scholar] [CrossRef]
- Celotti, E.; Stante, S.; Ferraretto, P.; Román, T.; Nicolini, G.; Natolino, A. High power ultrasound treatments of red young wines: Effect on anthocyanins and phenolic stability indices. Foods 2020, 9, 1344. [Google Scholar] [CrossRef]
- Morera, J.; Bartoli, E.; Combalia, F.; Castell, J.; Sorolla, S. Study of the application of ultrasound in vegetable tannage. J. Am. Leather Chem. Assoc. 2010, 105, 369–375. [Google Scholar]
- Zhang, Q.A.; Shen, Y.; Fan, X.H.; Garcia Martin, J.F. Preliminary study of the effect of ultrasound on physicochemical properties of red wine. CyTA J. Food 2016, 14, 55–64. [Google Scholar] [CrossRef]
- Puzovic, A.; Mikulic-Petkovsek, M. Comparative Evaluation of Conventional and Emerging Maceration Techniques for Enhancing Bioactive Compounds in Aronia Juice. Foods 2024, 13, 3255. [Google Scholar] [CrossRef]
- Santhirasegaram, V.; Razali, Z.; Somasundram, C. Effects of thermal treatment and sonication on quality attributes of Chokanan mango (Mangifera indica L.) juice. Ultrason. Sonochem. 2013, 20, 1276–1282. [Google Scholar] [CrossRef]
- Zhao, W.; Hua, J.; Wang, R.; Li, S.; Shi, J.; Zhang, Z. Effects of different pectinase maceration pre-treatments on physicochemical properties of raspberry juice and wine. Czech J. Food Sci. 2022, 40, 249–257. [Google Scholar] [CrossRef]
- Demirdöven, A.; Baysal, T. The use of ultrasound and combined technologies in food preservation. Food Rev. Int. 2008, 25, 1–11. [Google Scholar] [CrossRef]
- Beltran, G.; Rozes, N.; Mas, A.; Guillamon, J.M. Effect of low-temperature fermentation on yeast nitrogen metabolism. World J. Microbiol. Biotechnol. 2007, 23, 809–815. [Google Scholar] [CrossRef]
- Rakonczás, N.; Andrási, D.; Murányi, Z. Maceration affects mineral composition and pH of wines. Int. J. Hortic. Sci. 2015, 21, 25–29. [Google Scholar] [CrossRef]
- Figiel-Kroczyńska, M.; Ochmian, I.; Lachowicz, S.; Krupa-Małkiewicz, M.; Wróbel, J.; Gamrat, R. Actinidia (mini kiwi) fruit quality in relation to summer cutting. Agronomy 2021, 11, 964. [Google Scholar] [CrossRef]
- Speranza, B.; Campaniello, D.; Petruzzi, L.; Sinigaglia, M.; Corbo, M.R.; Bevilacqua, A. Preliminary Characterization of Yeasts from Bombino Bianco, a Grape Variety of Apulian Region, and Selection of an Isolate as a Potential Starter. Fermentation 2019, 5, 102. [Google Scholar] [CrossRef]
- Ottow, J.C.G. Rose Bengal as a Selective Aid in the Isolation of Fungi and Actinomycetes from Natural Sources. Mycologia 1972, 64, 304–315. [Google Scholar] [CrossRef] [PubMed]
- McCaig, A.E.; Grayston, S.J.; Prosser, J.I.; Glover, L.A. Impact of cultivation on characterization of species composition of soil bacterial communities. FEMS Microbiol. Ecol. 2001, 35, 37–48. [Google Scholar] [CrossRef] [PubMed]
- Lachowicz-Wiśniewska, S.; Kapusta, I.; Stinco, C.M.; Meléndez-Martínez, A.J.; Bieniek, A.; Ochmian, I.; Gil, Z. Distribution of polyphenolic and isoprenoid compounds and biological activity differences between in the fruit skin + pulp, seeds, and leaves of new biotypes of Elaeagnus multiflora Thunb. Antioxidants 2021, 10, 849. [Google Scholar] [CrossRef] [PubMed]
- Chełpiński, P.; Ochmian, I.; Forczmański, P. Sweet cherry skin colour measurement as a non-destructive indicator of fruit maturity. Acta Univ. Cibiniensis. Ser. E Food Technol. 2019, 23, 157–166. [Google Scholar] [CrossRef]


| Maceration Time (min) | |||||||||||||
|---|---|---|---|---|---|---|---|---|---|---|---|---|---|
| K -0 | 10 | 20 | 30 | 40 | 50 | 60 | 70 | 80 | 90 | 100 | 110 | 120 | |
| Phenolic acids | 0.2 ± 0.0 a * | 2.5 ± 0.03 b | 4.4 ± 0.05 c | 7.8 ± 0.08 d | 12.7 ± 0.16 e | 18.4 ± 0.22 f | 24.8 ± 0.26 g | 30.1 ± 0.33 h | 37.4 ± 0.44 i | 38.2 ± 0.43 i | 41.2 ± 0.48 j | 43.3 ± 0.49 k | 47.1 l ± 0.56 |
| Anthocyanins | 1.8 ± 0.02 a | 23.8 ± 0.26 b | 51.7 ± 0.56 c | 78.2 ± 1.02 d | 112.9 ± 1.27 e | 195.6 ± 2.31 f | 249.9 ± 2.91 g | 335.1 ± 3.90 h | 407.4 ± 4.75 i | 466.2 ± 5.22 j | 498.0 ± 5.84 k | 510.4 ± 5.93 kl | 528.0 ± 5.95 l |
| Flavonols | 0.0 ± 0.00 a | 0.6 ± 0.01 b | 1.0 ± 0.01 c | 1.1 ± 0.01 cd | 1.2 ± 0.0 cd | 1.2 ± 0.01 de | 1.3 ± 0.01 de | 1.3 ± 0.01 def | 1.3 ± 0.01 ef | 1.4 ± 0.02 f | 1.5 ± 0.02 f | 1.7 ± 0.02 g | 1.8 ± 0.02 g |
| Flavan-3-ols | 1.0 ± 0.01 a | 1.5 ± 0.02 a | 19.3 ± 0.24 b | 21.1 ± 0.24 b | 29.5 ± 0.32 c | 39.6 ± 0.43 d | 45.0 ± 0.55 d | 63.7 ± 0.70 e | 69.9 ± 0.83 ef | 75.2 ± 0.1 fg | 81.3 ± 0.88 g | 89.4 ± 1.00 h | 91.2 ± 1.01 h |
| Stilbenes | 0.2 ± 0.00 a | 1.7 ± 0.03 b | 2.3 ± 0.03 c | 3.5 ± 0.04 d | 8.3 ± 0.11 e | 11.3 ± 0.15 f | 12.4 ± 0.15 fg | 13.3 ± 0.14 g | 16.8 ± 0.16 h | 17.3 ± 0.17 h | 19 ± 0.17 i | 20.1 ± 0.26 j | 21.2 ± 0.26 k |
| TOTAL (mg/L) | 3.2 a | 30.1 b | 78.7 c | 111.7 d | 164.5 e | 266.1 f | 333.4 g | 443.5 h | 532.8 i | 598.3 j | 641 k | 664.9 l | 689.3 m |
| SSA (% Brix) | 21.20 ± 0.19 a | 21.33 ± 0.18 ab | 21.46 ± 0.20 abc | 21.59 ± 0.20 abc | 21.72 ± 0.19 bc | 21.85 ± 0.20 cd | 21.98 ± 0.18 cde | 22.11 ± 0.21 cde | 22.24 ± 0.23 cde | 22.37 ± 0.22 de | 22.50 ± 0.21 e | 22.50 ± 0.22 e | 22.53 ± 0.23 e |
| Acidity (g/L) | 8.41 ± 0.09 a | 8.45 ± 0.10 a | 8.42 ± 0.08 a | 8.44 ± 0.09 a | 8.45 ± 0.10 a | 8.54 ± 0.10 a | 8.52 ± 0.11 a | 8.55 ± 0.09 a | 8.54 ± 0.10 a | 8.52 ± 0.11 a | 8.56 ± 0.10 a | 8.55 ± 0.11 a | 8.56 ± 0.11 a |
| NTU | 24 ± 0.31 a | 67 ± 0.85 b | 189 ± 2.35 c | 366 ± 4.65 d | 489 ± 6.40 e | 573 ± 7.09 f | 645 ± 8.32 g | 786 ± 9.87 h | 854 ± 10.92 i | 953 ± 12.15 j | 970 ± 12.33 j | 972 ± 12.28 j | 974 ± 12.39 j |
| pH | 3.21 ± 0.04 a | 3.23 ± 0.04 a | 3.20 ± 0.04 a | 3.22 ± 0.04 a | 3.25 ± 0.04 a | 3.19 ± 0.04 a | 3.19 ± 0.04 a | 3.20 ± 0.04 a | 3.18 ± 0.04 a | 3.15 ± 0.04 a | 3.15 ± 0.04 a | 3.16 ± 0.04 a | 3.14 ± 0.04 a |
| YAN = FAN + NH4+ (mg/L) | 135 ± 3.17 a | 146 ± 3.22 a | 167 ± 3.55 b | 169 ± 3.71 b | 170 ± 3.90 b | 169 ± 3.83 b | 172 ± 3.81 b | 175 ± 3.90 b | 173 ± 3.91 b | 175 ± 4.02 b | 176 ± 3.85 b | 176 ± 3.90 b | 175 ± 4.04 b |
| FAN | 90.11 | 97.82 | 111.89 | 113.23 | 113.9 | 113.23 | 115.24 | 117.25 | 115.91 | 117.25 | 117.92 | 117.92 | 117.25 |
| NH4+ | 44.89 | 48.18 | 55.11 | 55.77 | 56.1 | 55.77 | 56.76 | 57.75 | 57.09 | 57.75 | 58.08 | 58.08 | 57.75 |
| Warm Maceration Days | Cold Maceration Days | |||||||||
|---|---|---|---|---|---|---|---|---|---|---|
| K -0 | 2 | 4 | 6 | K -0 | 2 | 4 | 6 | 8 | 10 | |
| Phenolic acids | 0.2 ± 0.0 a * | 17.5 ± 0.18 b | 36.7 ± 0.39 c | 43.5 ± 0.50 d | 0.2 ± 0.0 A* | 2.4 ± 0.03 B | 4.0 ± 0.05 B | 12.9 ± 0.14 C | 25.6 ± 0.25 D | 28.8 ± 0.31 E |
| Anthocyanins | 1.8 ± 0.02 a | 134.0 ± 1.50 b | 392 ± 4.50 c | 468 ± 5.32 d | 1.8 ± 0.02 A | 68 ± 0.75 B | 166 ± 1.84 C | 261 ± 3.01 D | 305 ± 3.28 E | 495 ± 5.49 F |
| Flavonols | 0.0 ± 0.00 a | 0.5 ± 0.01 b | 1.1 ± 0.01 c | 1.6 ± 0.02 d | 0.0 ± 0.00 A | 0.3 ± 0.00 B | 0.4 ± 0.01 B | 0.5 ± 0.01 C | 1.1 ± 0.02 D | 1.5 ± 0.02 E |
| Flavan-3-ols | 1.0 ± 0.01 a | 8.9 ± 0.09 b | 62.0 ± 0.69 c | 75.2 ± 0.79 d | 1.0 ± 0.01 A | 4.9 ± 0.06 B | 12.3 ± 0.11 C | 29.0 ± 0.31 D | 36.5 ± 0.37 E | 42.8 ± 0.48 F |
| Stilbenes | 0.2 ± 0.00 a | 1.2 ± 0.01 b | 10.3 ± 0.10 c | 16.5 ± 0.19 d | 0.2 ± 0.00 A | 0.2 ± 0.00 A | 0.7 ± 0.01 B | 5.7 ± 0.06 C | 9.3 ± 0.11 D | 13.2 ± 0.16 E |
| TOTAL (mg/L) | 3.2 a | 162.1 b | 502.1 c | 604.8 d | 3.2 A | 75.7 B | 183.4 C | 309.1 D | 377.5 E | 581.3 F |
| SSA (% Brix) | 21.20 ± 0.19 a | 17.31 ± 0.22 b | 11.46 ± 0.15 c | 6.83 ± 0.08 d | 21.20 ± 0.19 A | 19.56 ± 0.23 B | 14.70 ± 0.19 C | 11.98 ± 0.15 D | 9.22 ± 0.12 E | 8.34 ± 0.11 E |
| Acidity (g/L) | 8.41 ± 0.09 a | 8.34 ± 0.10 a | 8.35 ± 0.09 a | 8.27 ± 0.09 a | 8.41 ± 0.09 A | 8.37 ± 0.10 A | 8.35 ± 0.11 A | 8.34 ± 0.10 A | 8.31 ± 0.10 A | 8.29 ± 0.10 A |
| NTU | 24 ± 0.31 a | 762 ± 8.32 b | 1154 ± 12.54 c | 1248 ± 13.99 d | 24 ± 0.31 A | 368 ± 4.23 B | 450 ± 5.07 C | 771 ± 8.50 D | 823 ± 9.32 DE | 846 ± 9.53 E |
| pH | 3.21 ± 0.04 a | 3.23 ± 0.04 a | 3.17 ± 0.04 a | 3.19 ± 0.04 a | 3.21 ± 0.04 A | 3.19 ± 0.04 A | 3.18 ± 0.04 A | 3.22 ± 0.04 A | 3.24 ± 0.04 A | 3.26 ± 0.04 A |
| YAN = FAN + NH4+ (mg/L) | 135 ± 3.17 a | 104 ± 2.62 b | 72 ± 1.72 c | 36 ± 0.93 d | 135 ± 3.17 a | 117 ± 2.99 B | 98 ± 2.61 C | 81 ± 2.11 D | 67 ± 1.79 DE | 58 ± 1.56 E |
| FAN | 90.11 | 65.08 | 39.55 | 27.03 | 90.11 | 79.67 | 71.03 | 58.33 | 45.11 | 35.65 |
| NH4+ | 44.89 | 38.92 | 32.45 | 8.97 | 44.89 | 37.33 | 26.97 | 22.67 | 21.89 | 22.35 |
Disclaimer/Publisher’s Note: The statements, opinions and data contained in all publications are solely those of the individual author(s) and contributor(s) and not of MDPI and/or the editor(s). MDPI and/or the editor(s) disclaim responsibility for any injury to people or property resulting from any ideas, methods, instructions or products referred to in the content. |
© 2025 by the authors. Licensee MDPI, Basel, Switzerland. This article is an open access article distributed under the terms and conditions of the Creative Commons Attribution (CC BY) license (https://creativecommons.org/licenses/by/4.0/).
Share and Cite
Błaszak, M.; Lachowicz-Wiśniewska, S.; Kapusta, I.; Szewczuk, M.; Ochmian, I. Enhanced Extraction of Polyphenols, Physicochemical Properties, and Microbial Control in Vitis vinifera L. Juice Using Ultrasound-Assisted Maceration. Molecules 2025, 30, 587. https://doi.org/10.3390/molecules30030587
Błaszak M, Lachowicz-Wiśniewska S, Kapusta I, Szewczuk M, Ochmian I. Enhanced Extraction of Polyphenols, Physicochemical Properties, and Microbial Control in Vitis vinifera L. Juice Using Ultrasound-Assisted Maceration. Molecules. 2025; 30(3):587. https://doi.org/10.3390/molecules30030587
Chicago/Turabian StyleBłaszak, Magdalena, Sabina Lachowicz-Wiśniewska, Ireneusz Kapusta, Małgorzata Szewczuk, and Ireneusz Ochmian. 2025. "Enhanced Extraction of Polyphenols, Physicochemical Properties, and Microbial Control in Vitis vinifera L. Juice Using Ultrasound-Assisted Maceration" Molecules 30, no. 3: 587. https://doi.org/10.3390/molecules30030587
APA StyleBłaszak, M., Lachowicz-Wiśniewska, S., Kapusta, I., Szewczuk, M., & Ochmian, I. (2025). Enhanced Extraction of Polyphenols, Physicochemical Properties, and Microbial Control in Vitis vinifera L. Juice Using Ultrasound-Assisted Maceration. Molecules, 30(3), 587. https://doi.org/10.3390/molecules30030587