
Peach Peel Extrusion for the Development of Sustainable Gluten-Free Plant-Based Flours

 ,
,  , , and
Abstract
1. Introduction
2. Materials and Methods
2.1. Chemicals
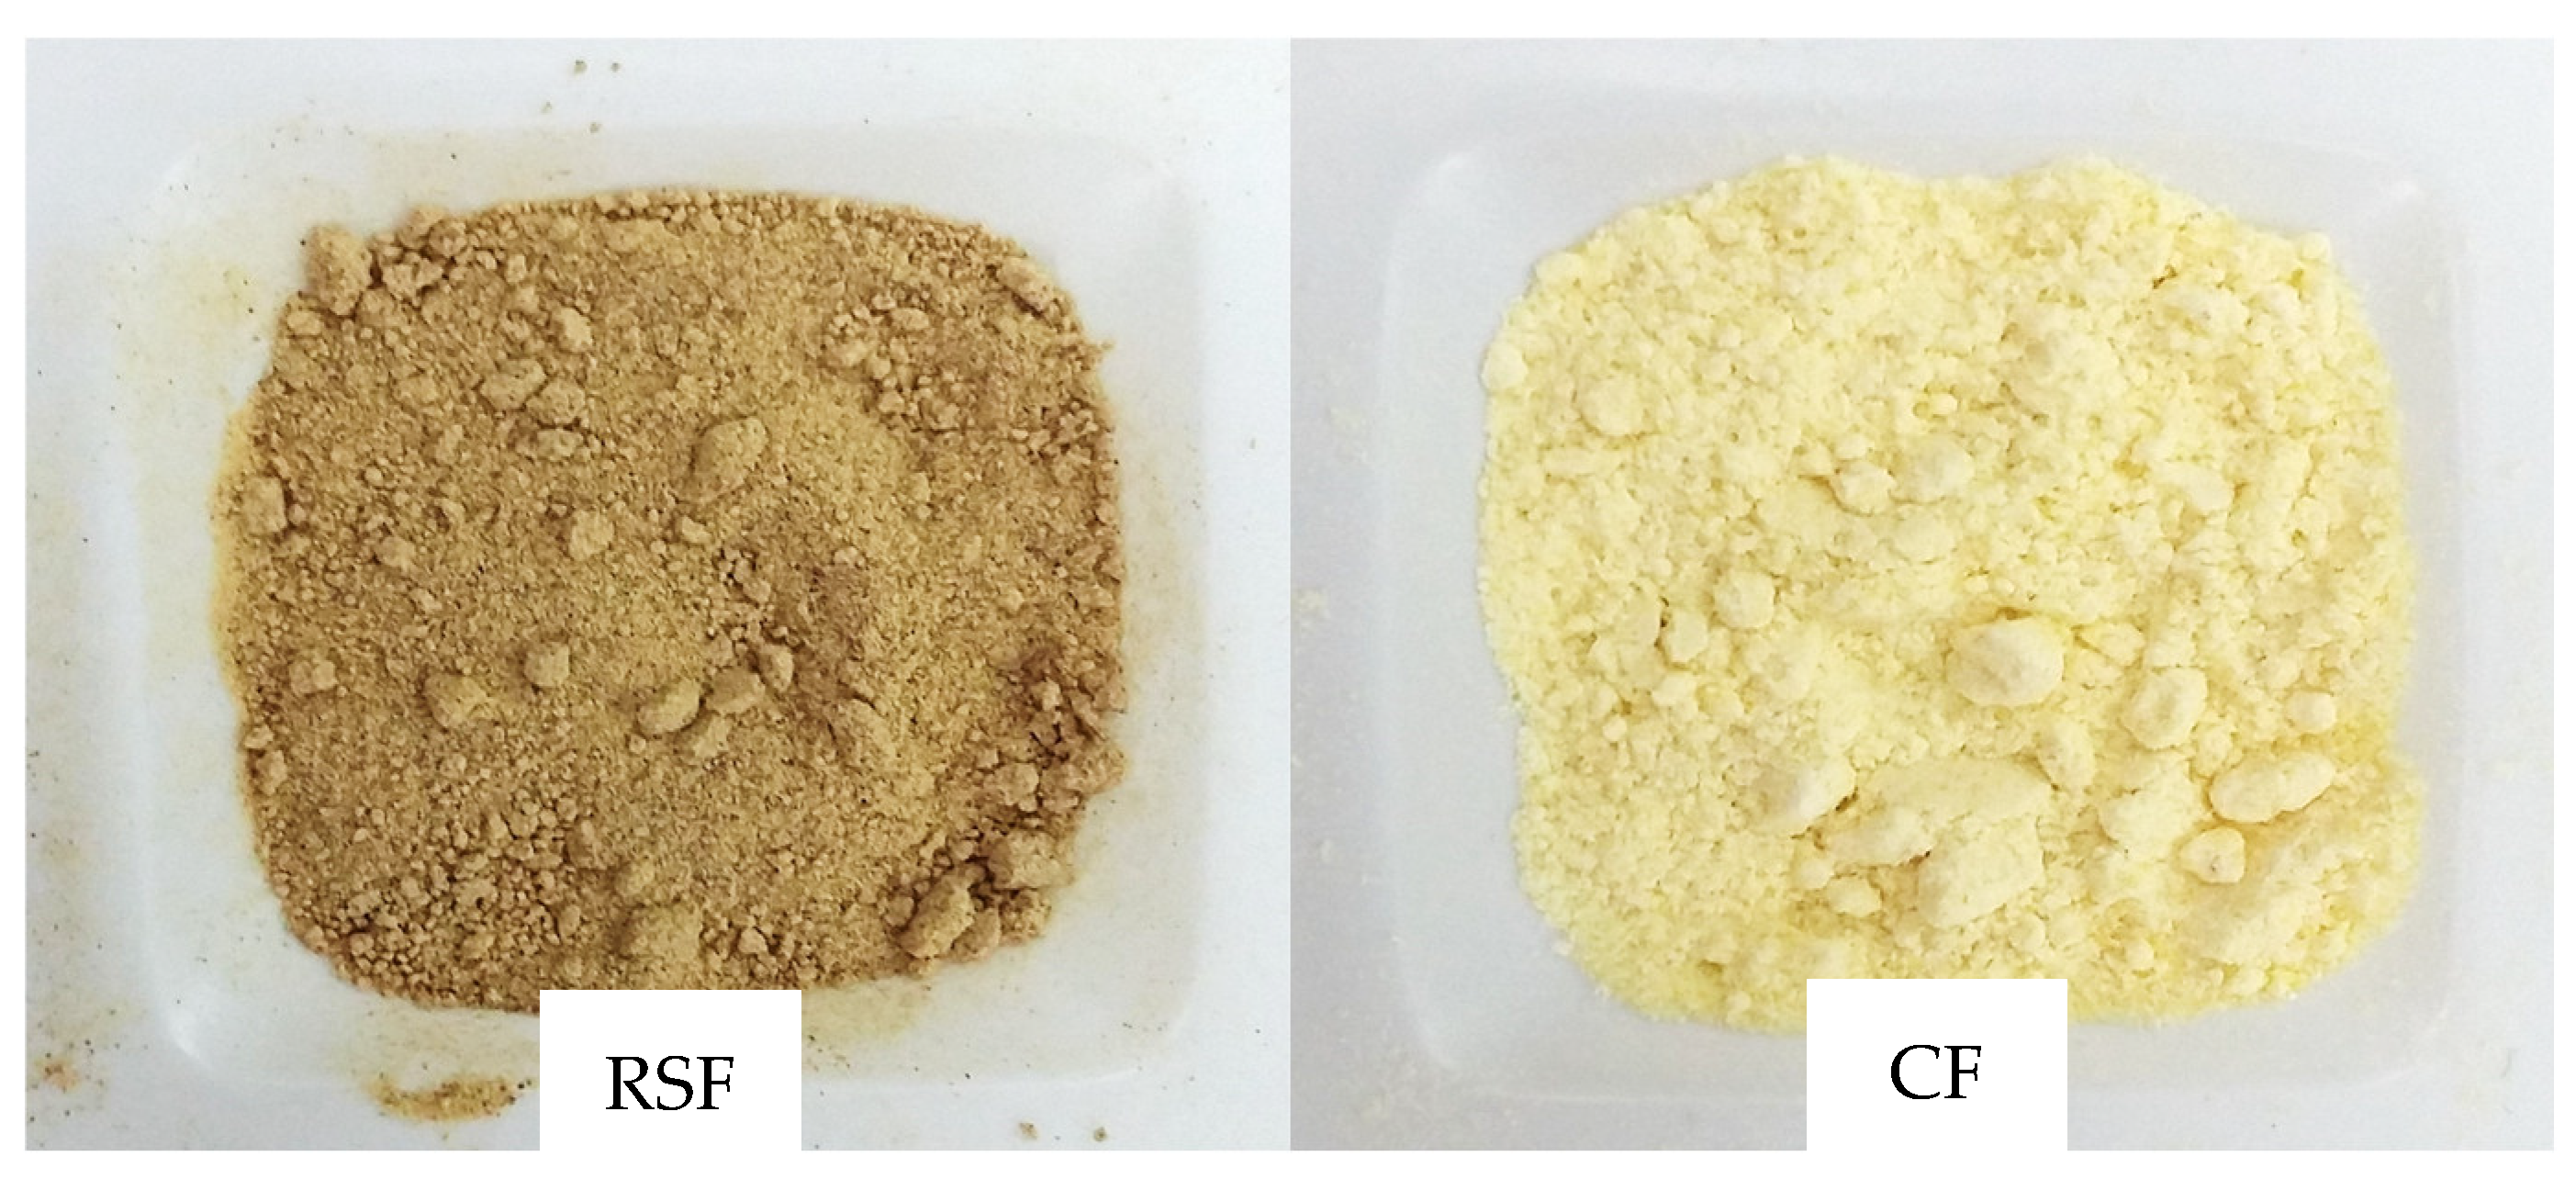
2.2. Raw Materials
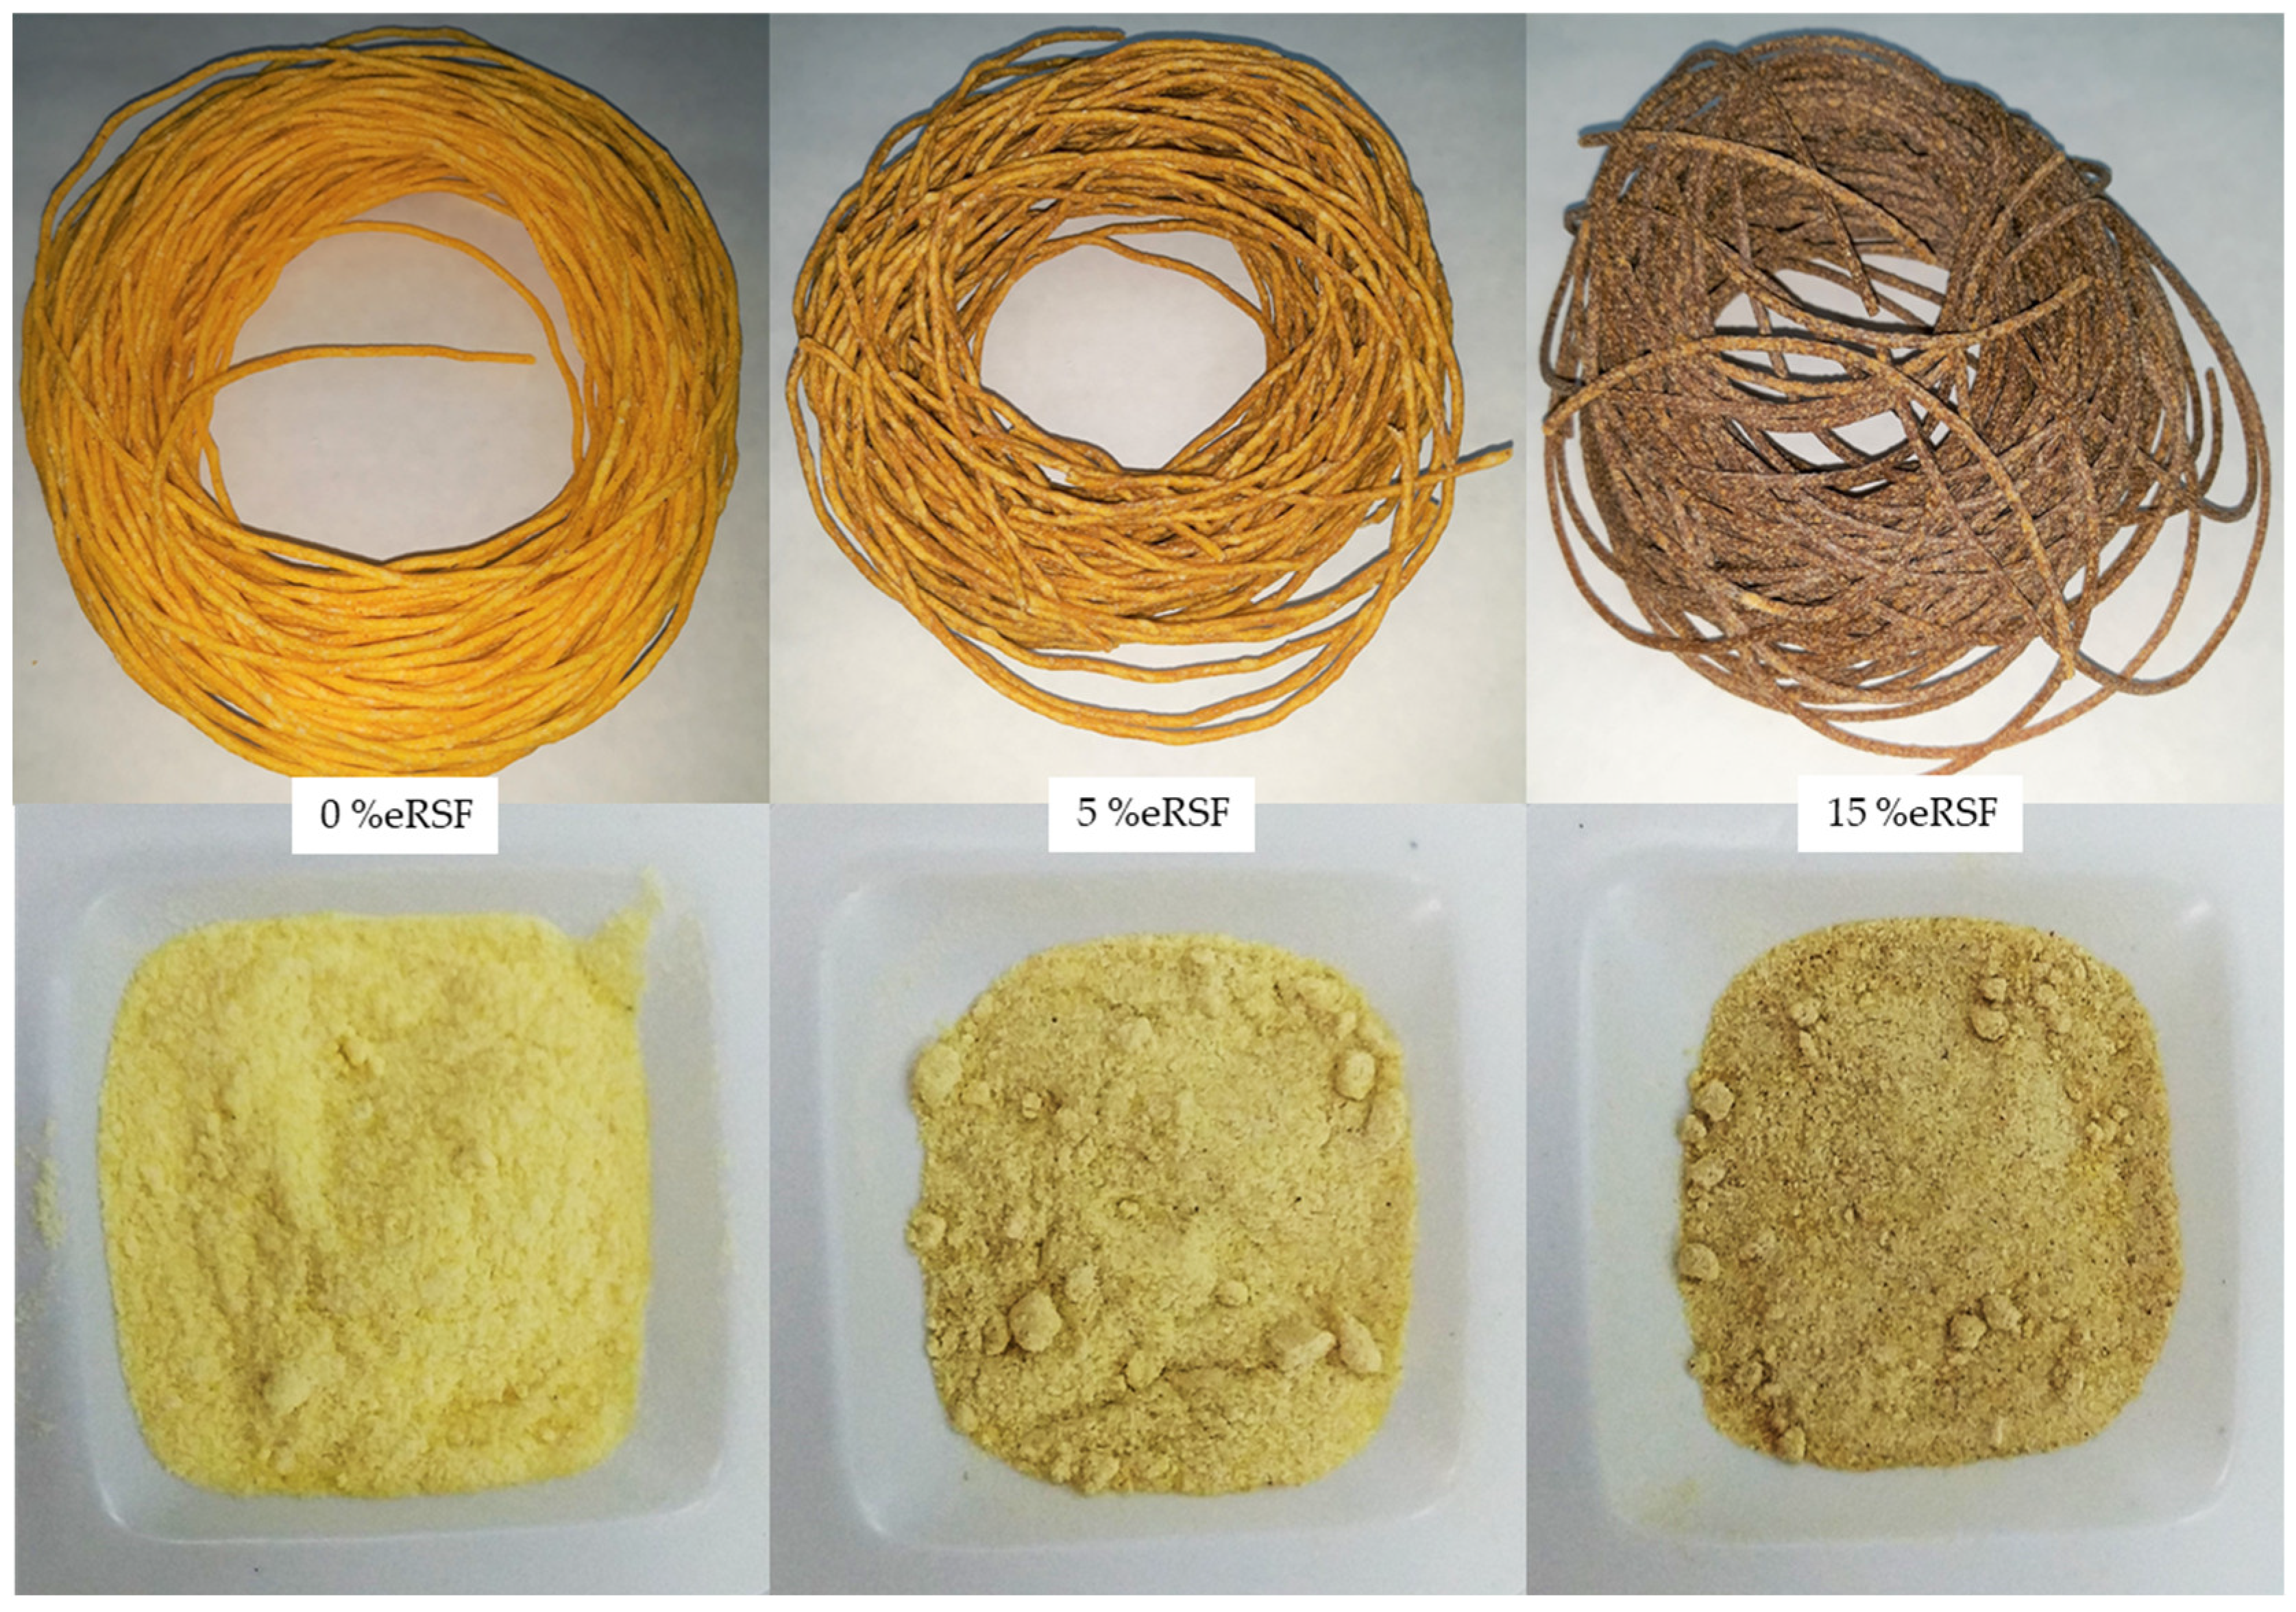
2.3. Extrusion Process
2.4. Proximal Composition
2.5. Colorimetric Analysis
2.6. Extract Preparation
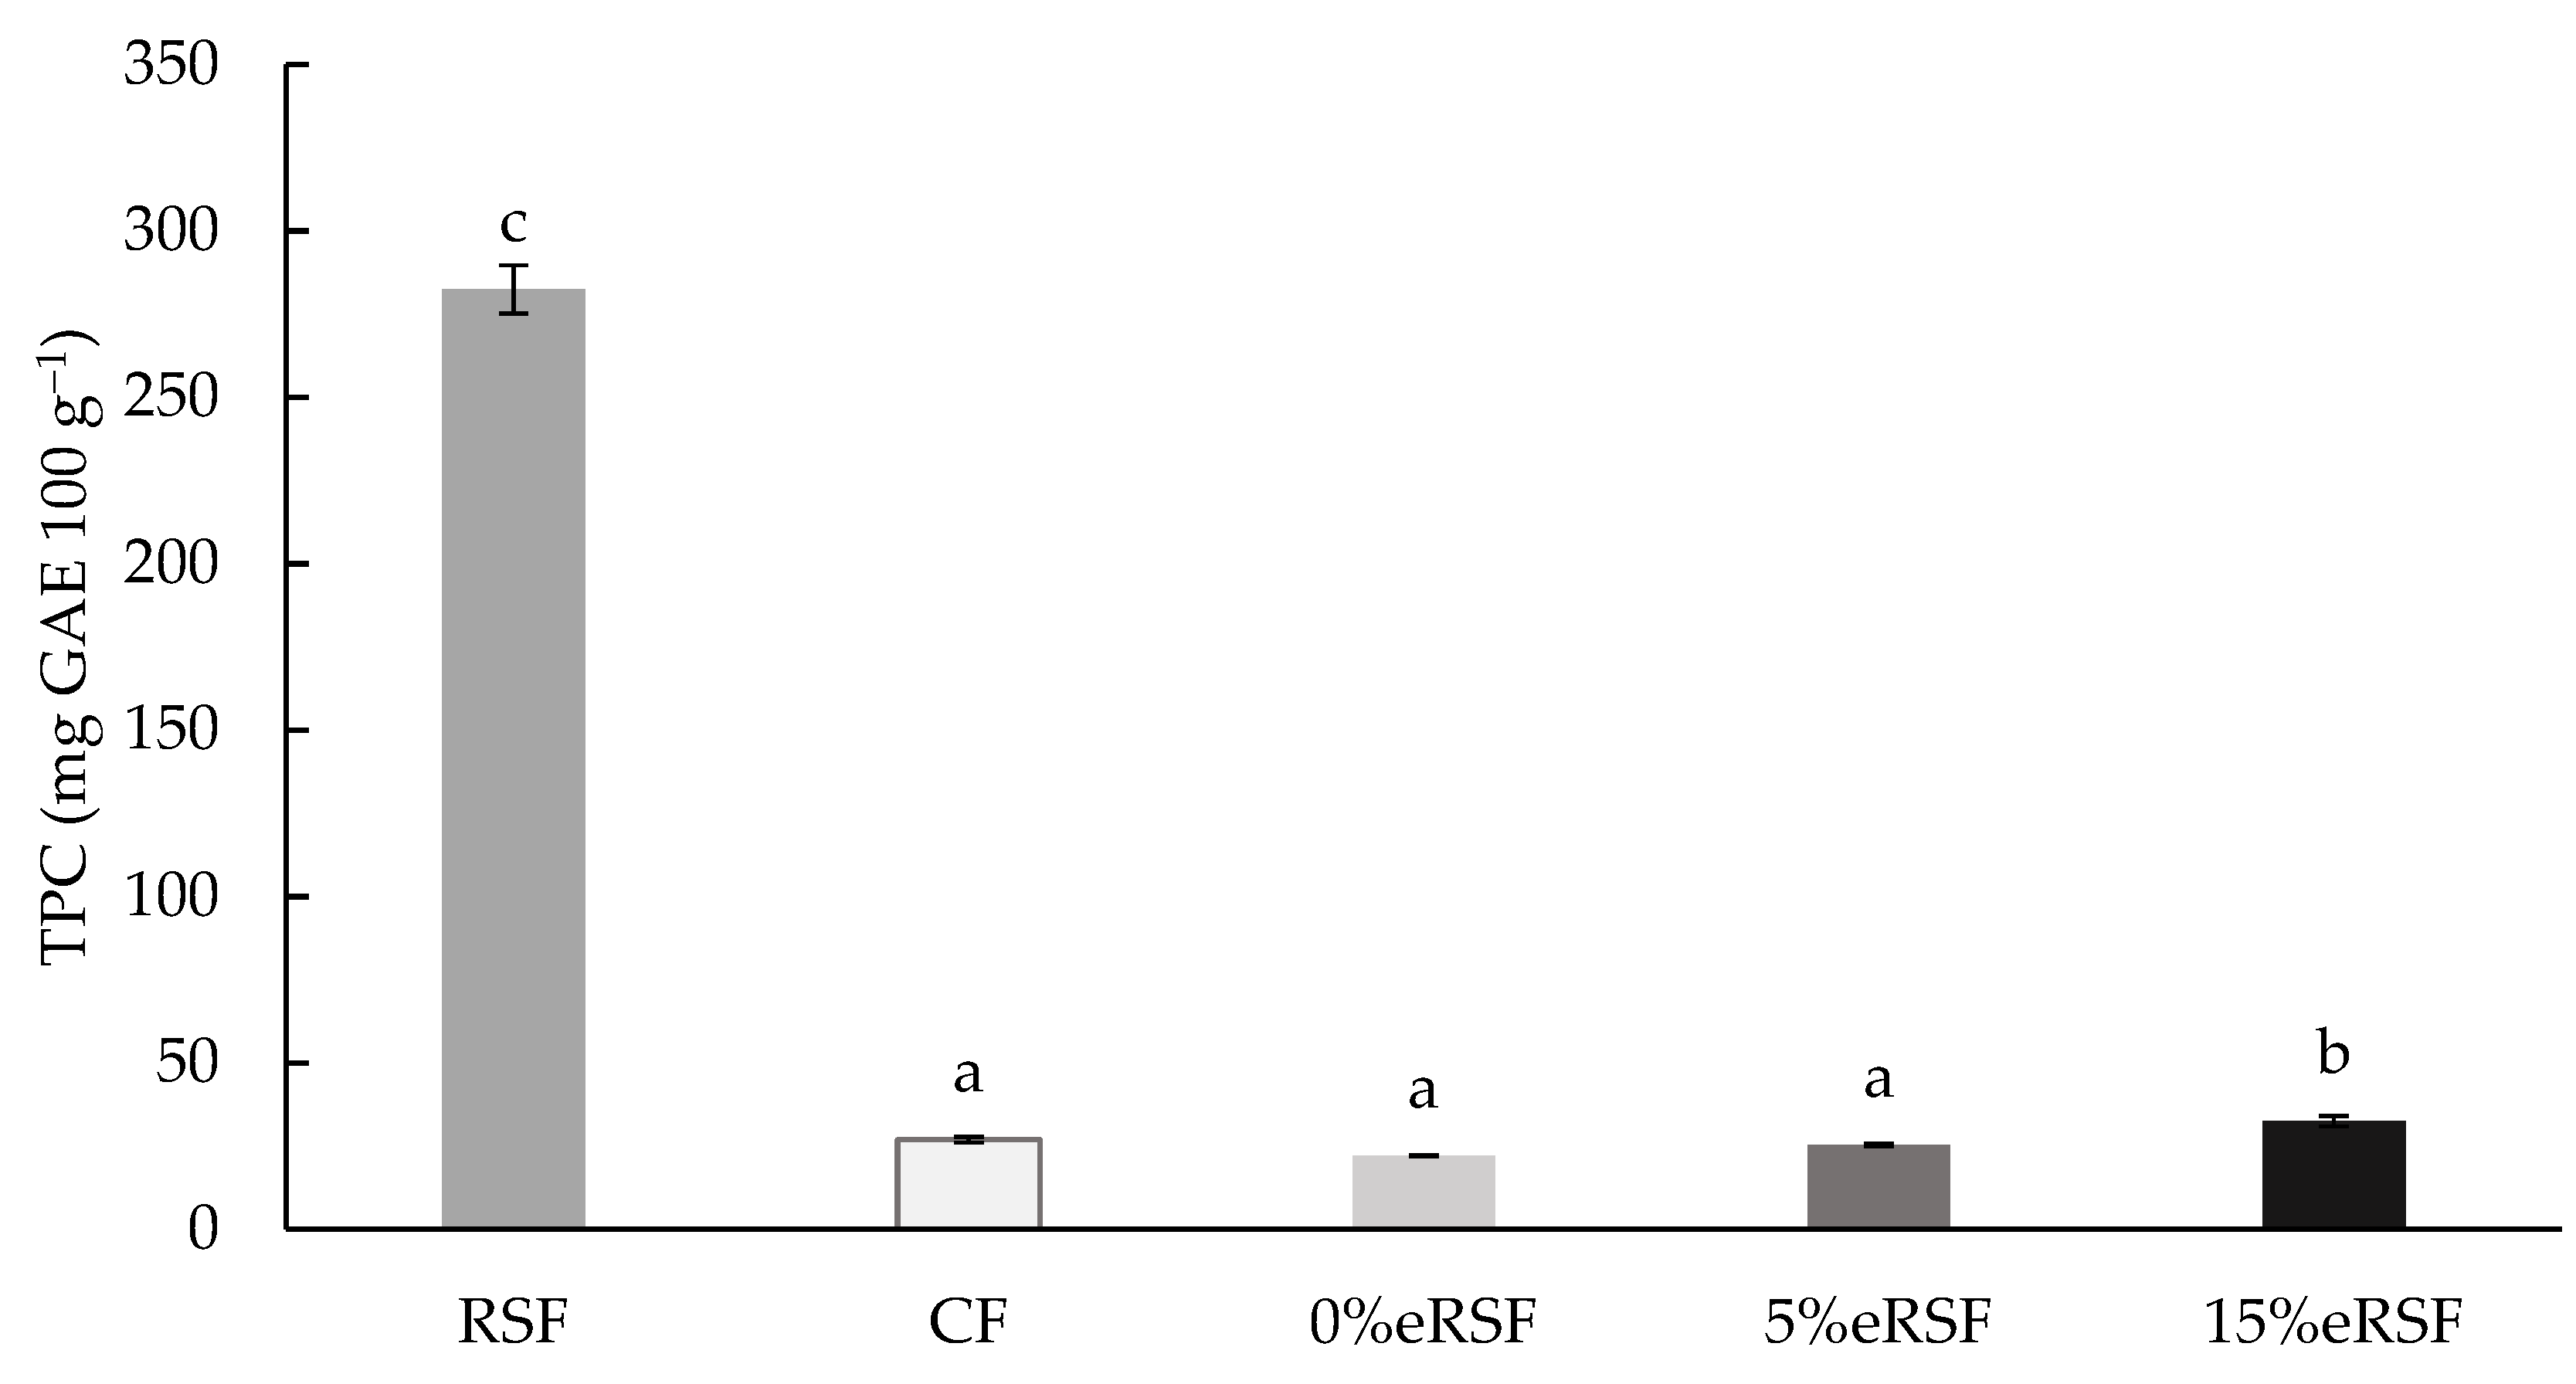
2.7. Total Phenol Content (TPC)
2.8. Characterization of Phenolic Compounds Using High-Performance Liquid Chromatography—Electrospray Ionization–Quadrupole Time-of-Flight Mass Spectrometry (HPLC–ESI–QTOF-MS)
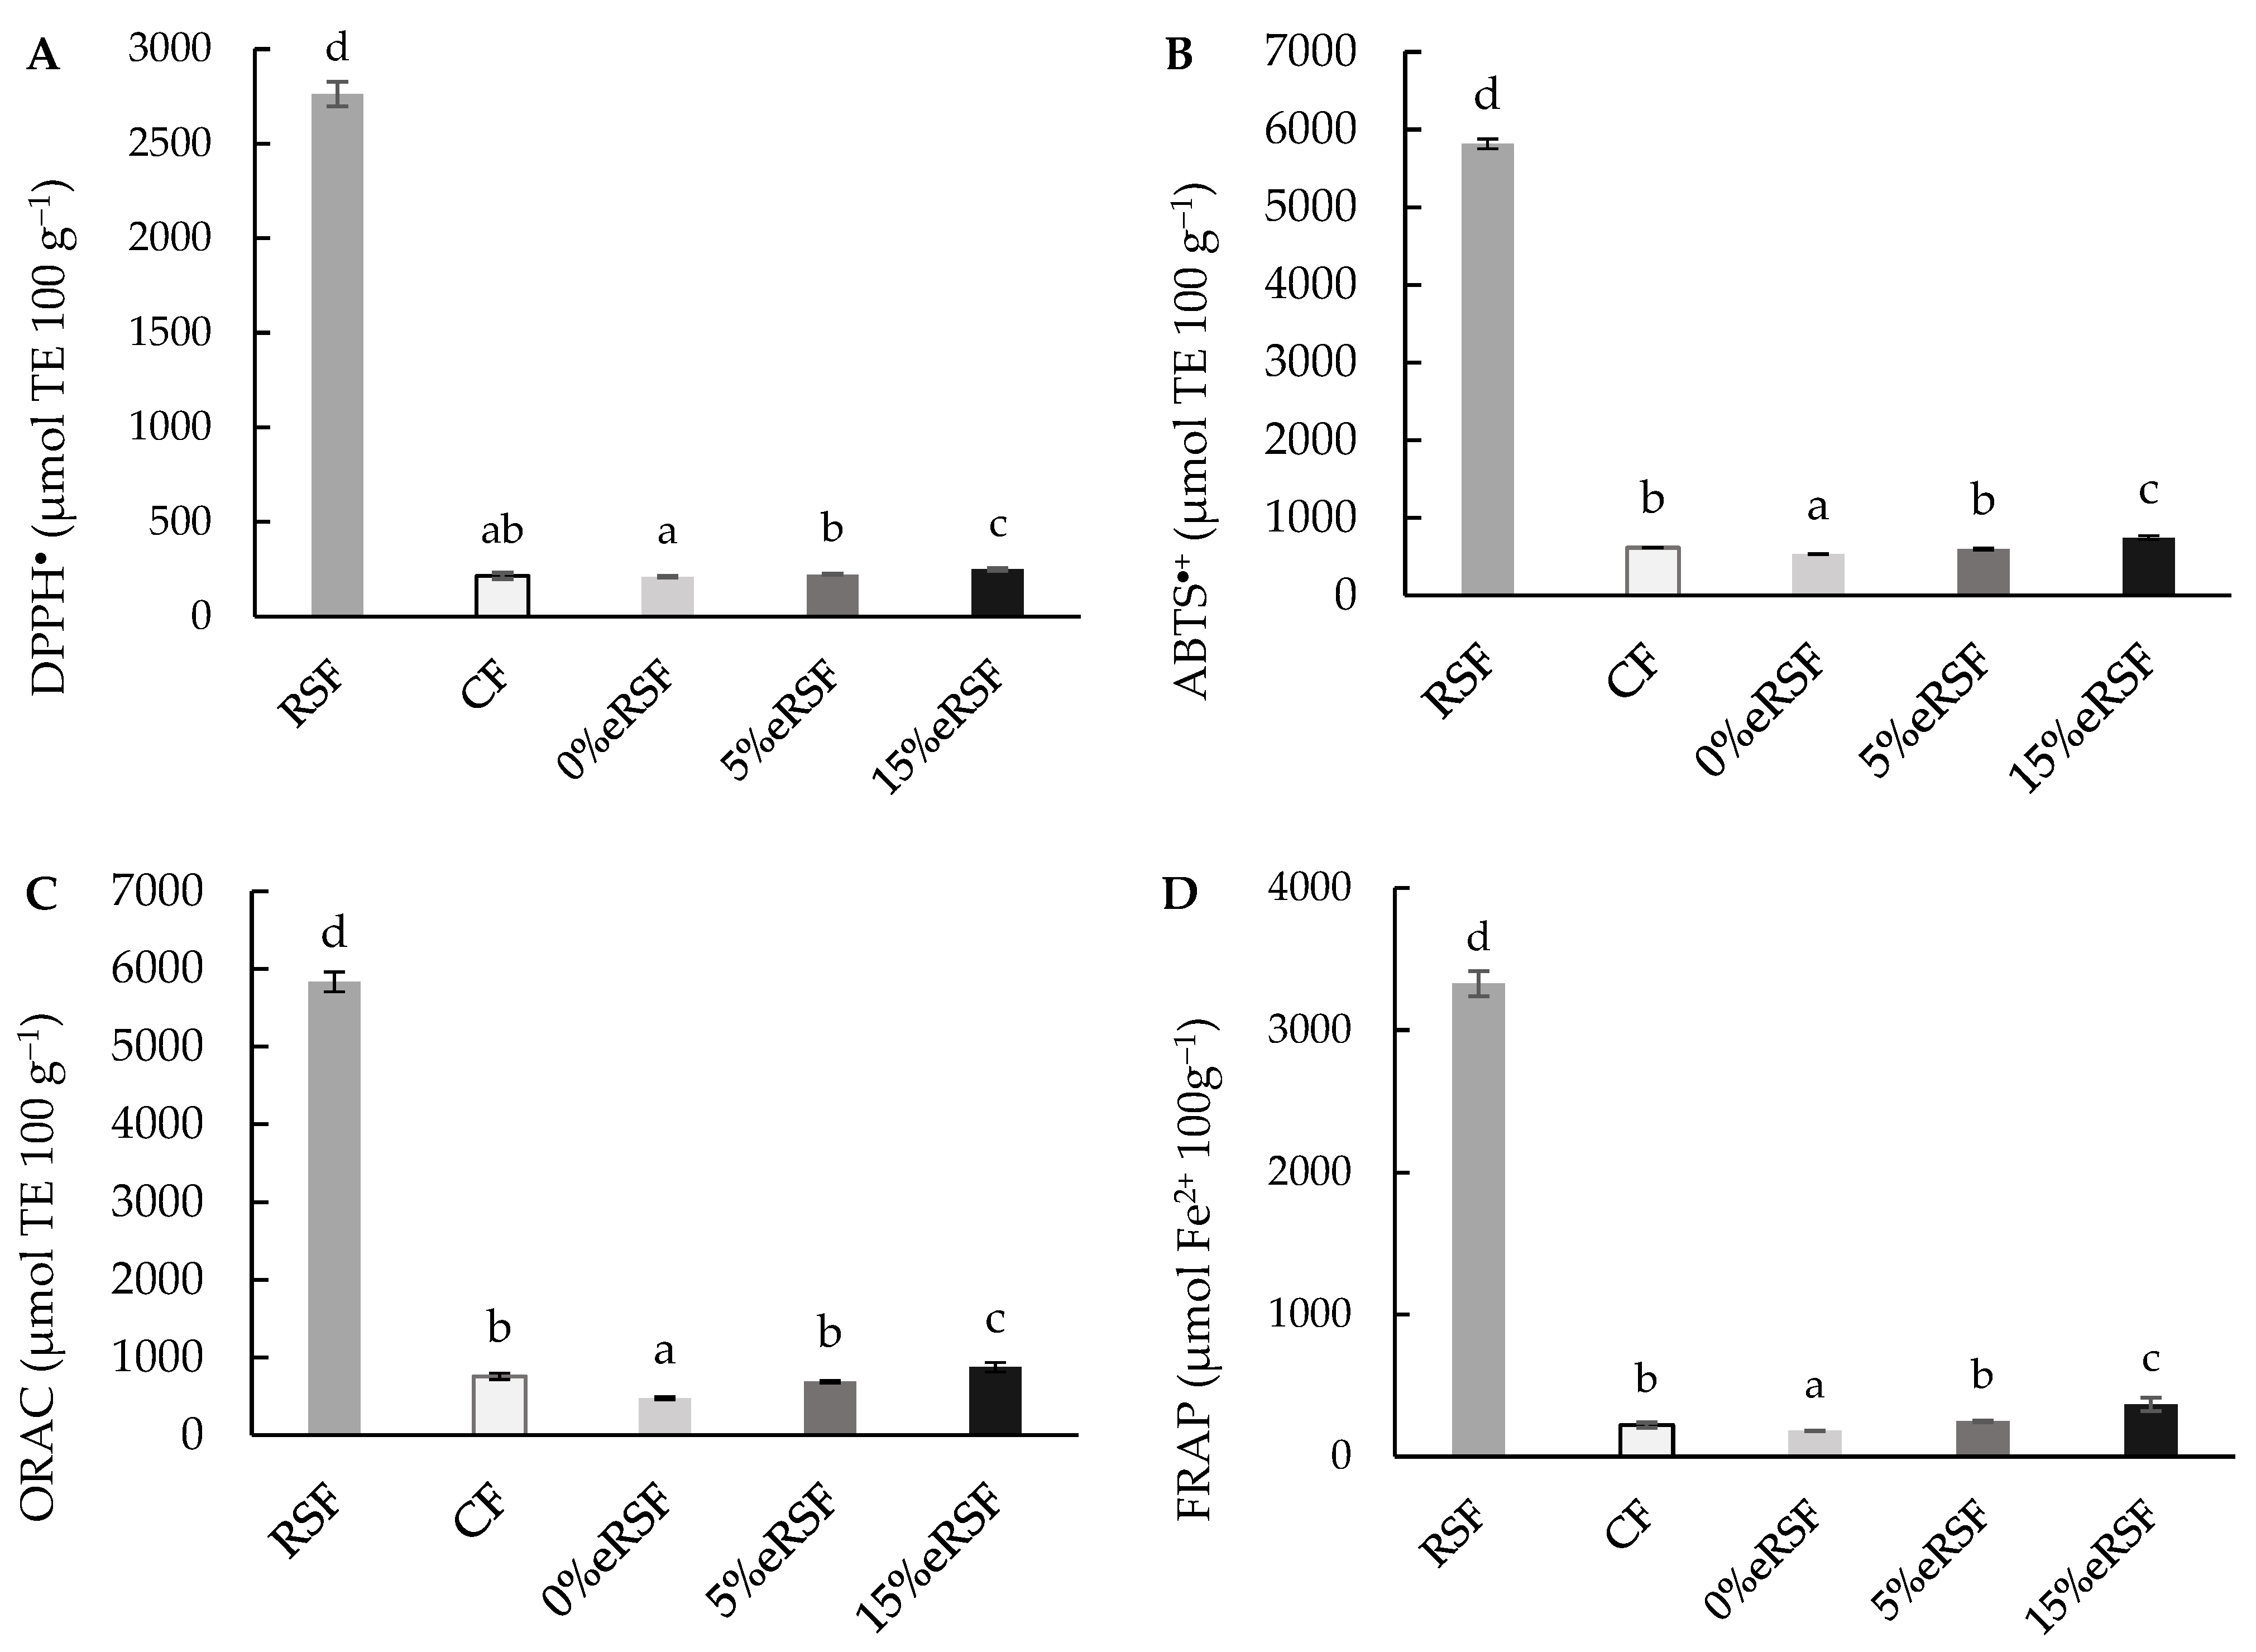
2.9. Total Antioxidant Capacity (TAC)
2.9.1. DPPH• Radical Scavenging Activity (DPPH•)
2.9.2. ABTS•+ Radical Cation Scavenging Activity (ABTS•+)
2.9.3. Oxygen Radical Absorbance Capacity (ORAC)
2.9.4. Ferric-Reducing Antioxidant Power (FRAP)
2.9.5. Q-DPPH• Radical Scavenging Activity and Q-ABTS•+ Radical Cation Scavenging Activity
2.10. Glycemic Index (GI)
2.11. Scanning Electron Microscopy (SEM)
2.12. Functional Properties
2.13. Statistical Analysis
3. Results and Discussion
3.1. Proximal Composition
3.2. Colorimetric Analysis
3.3. Total Phenol Content (TPC)
3.4. HPLC–ESI–QTOF-MS
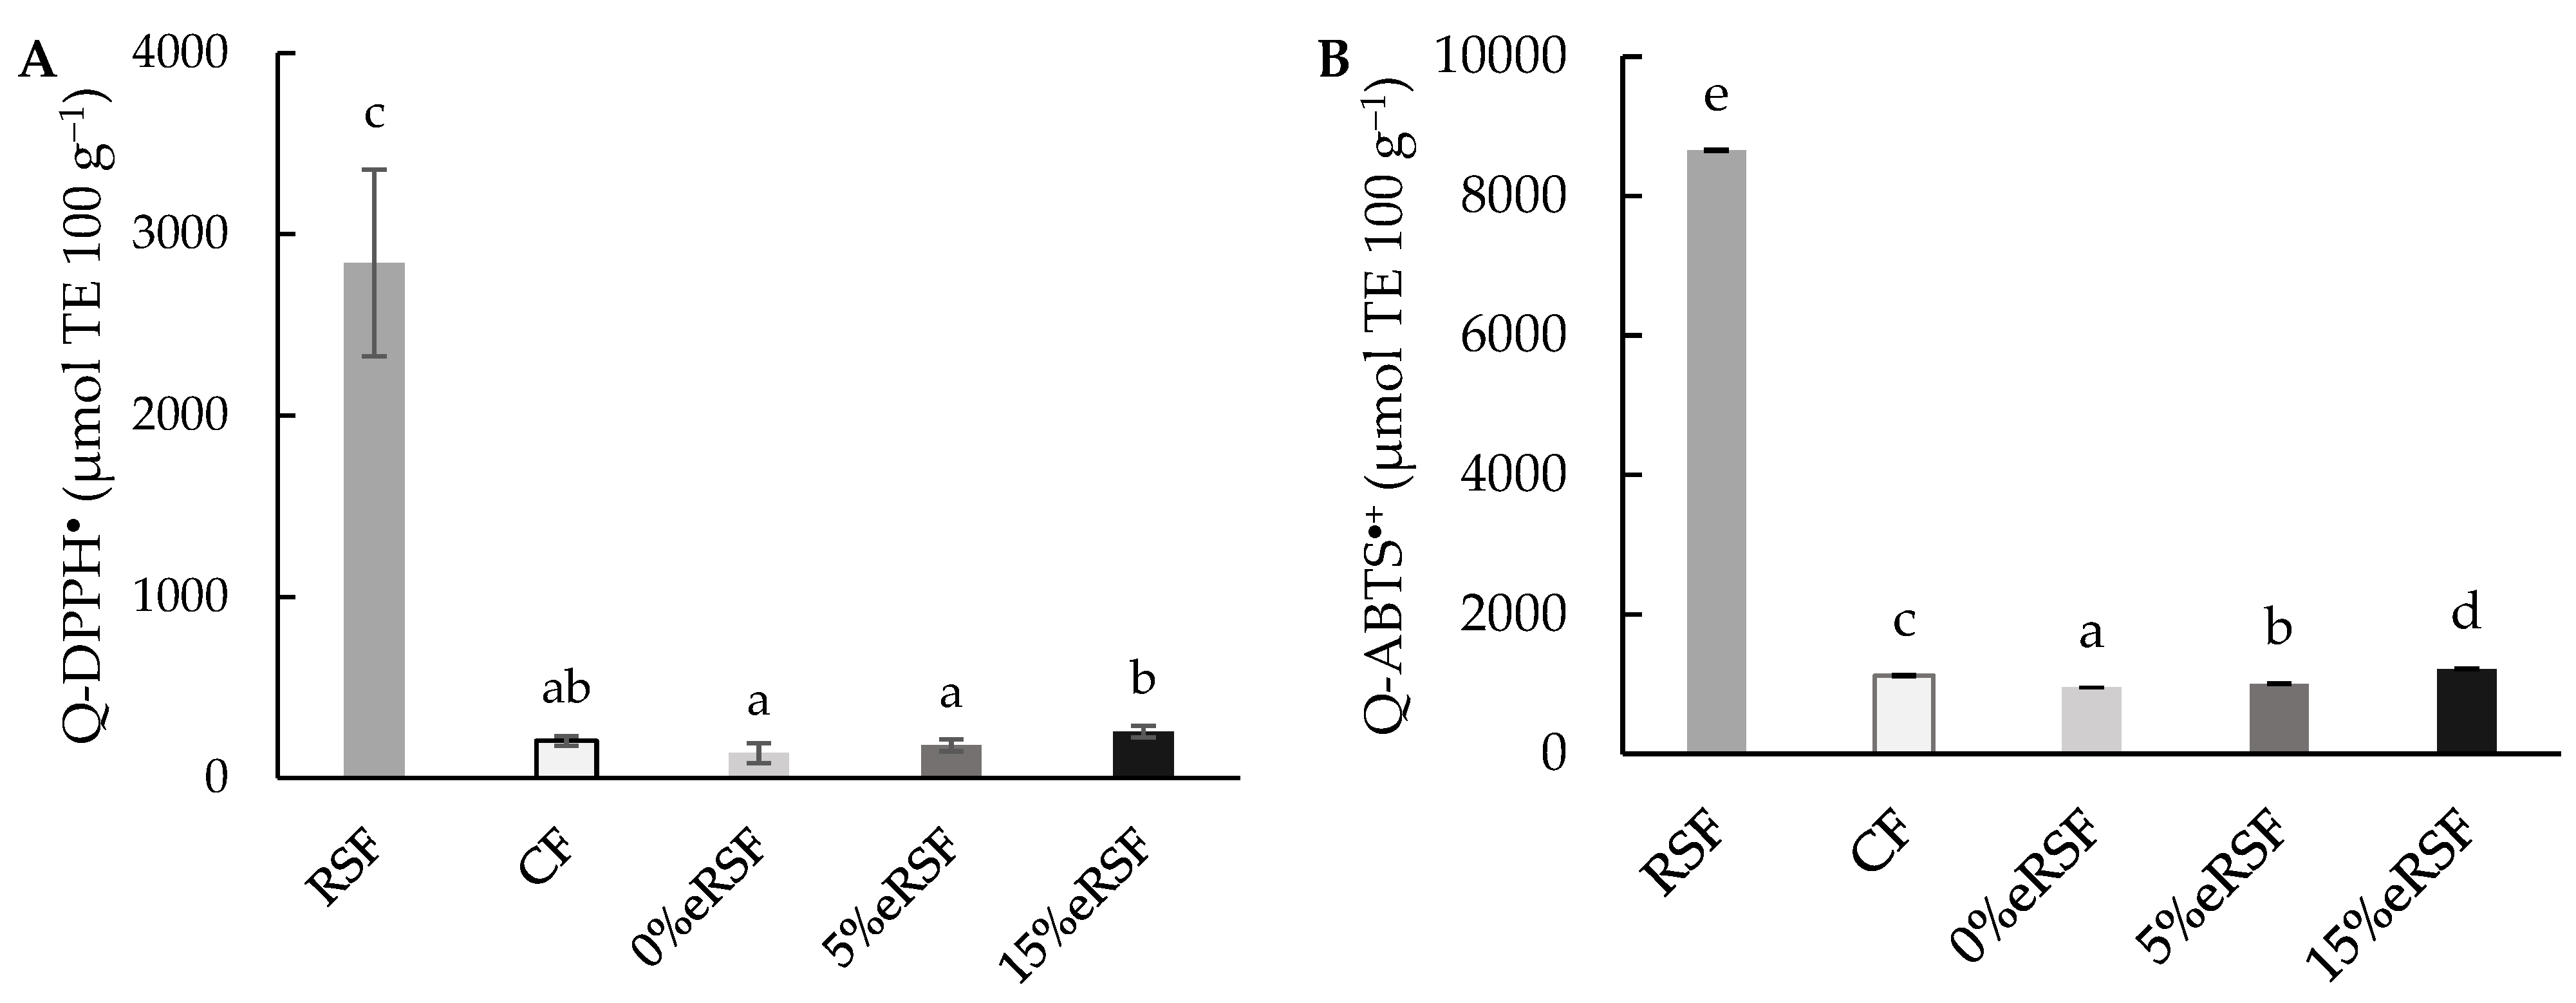
3.5. Total Antioxidant Capacity (TAC)
3.6. Functional Properties
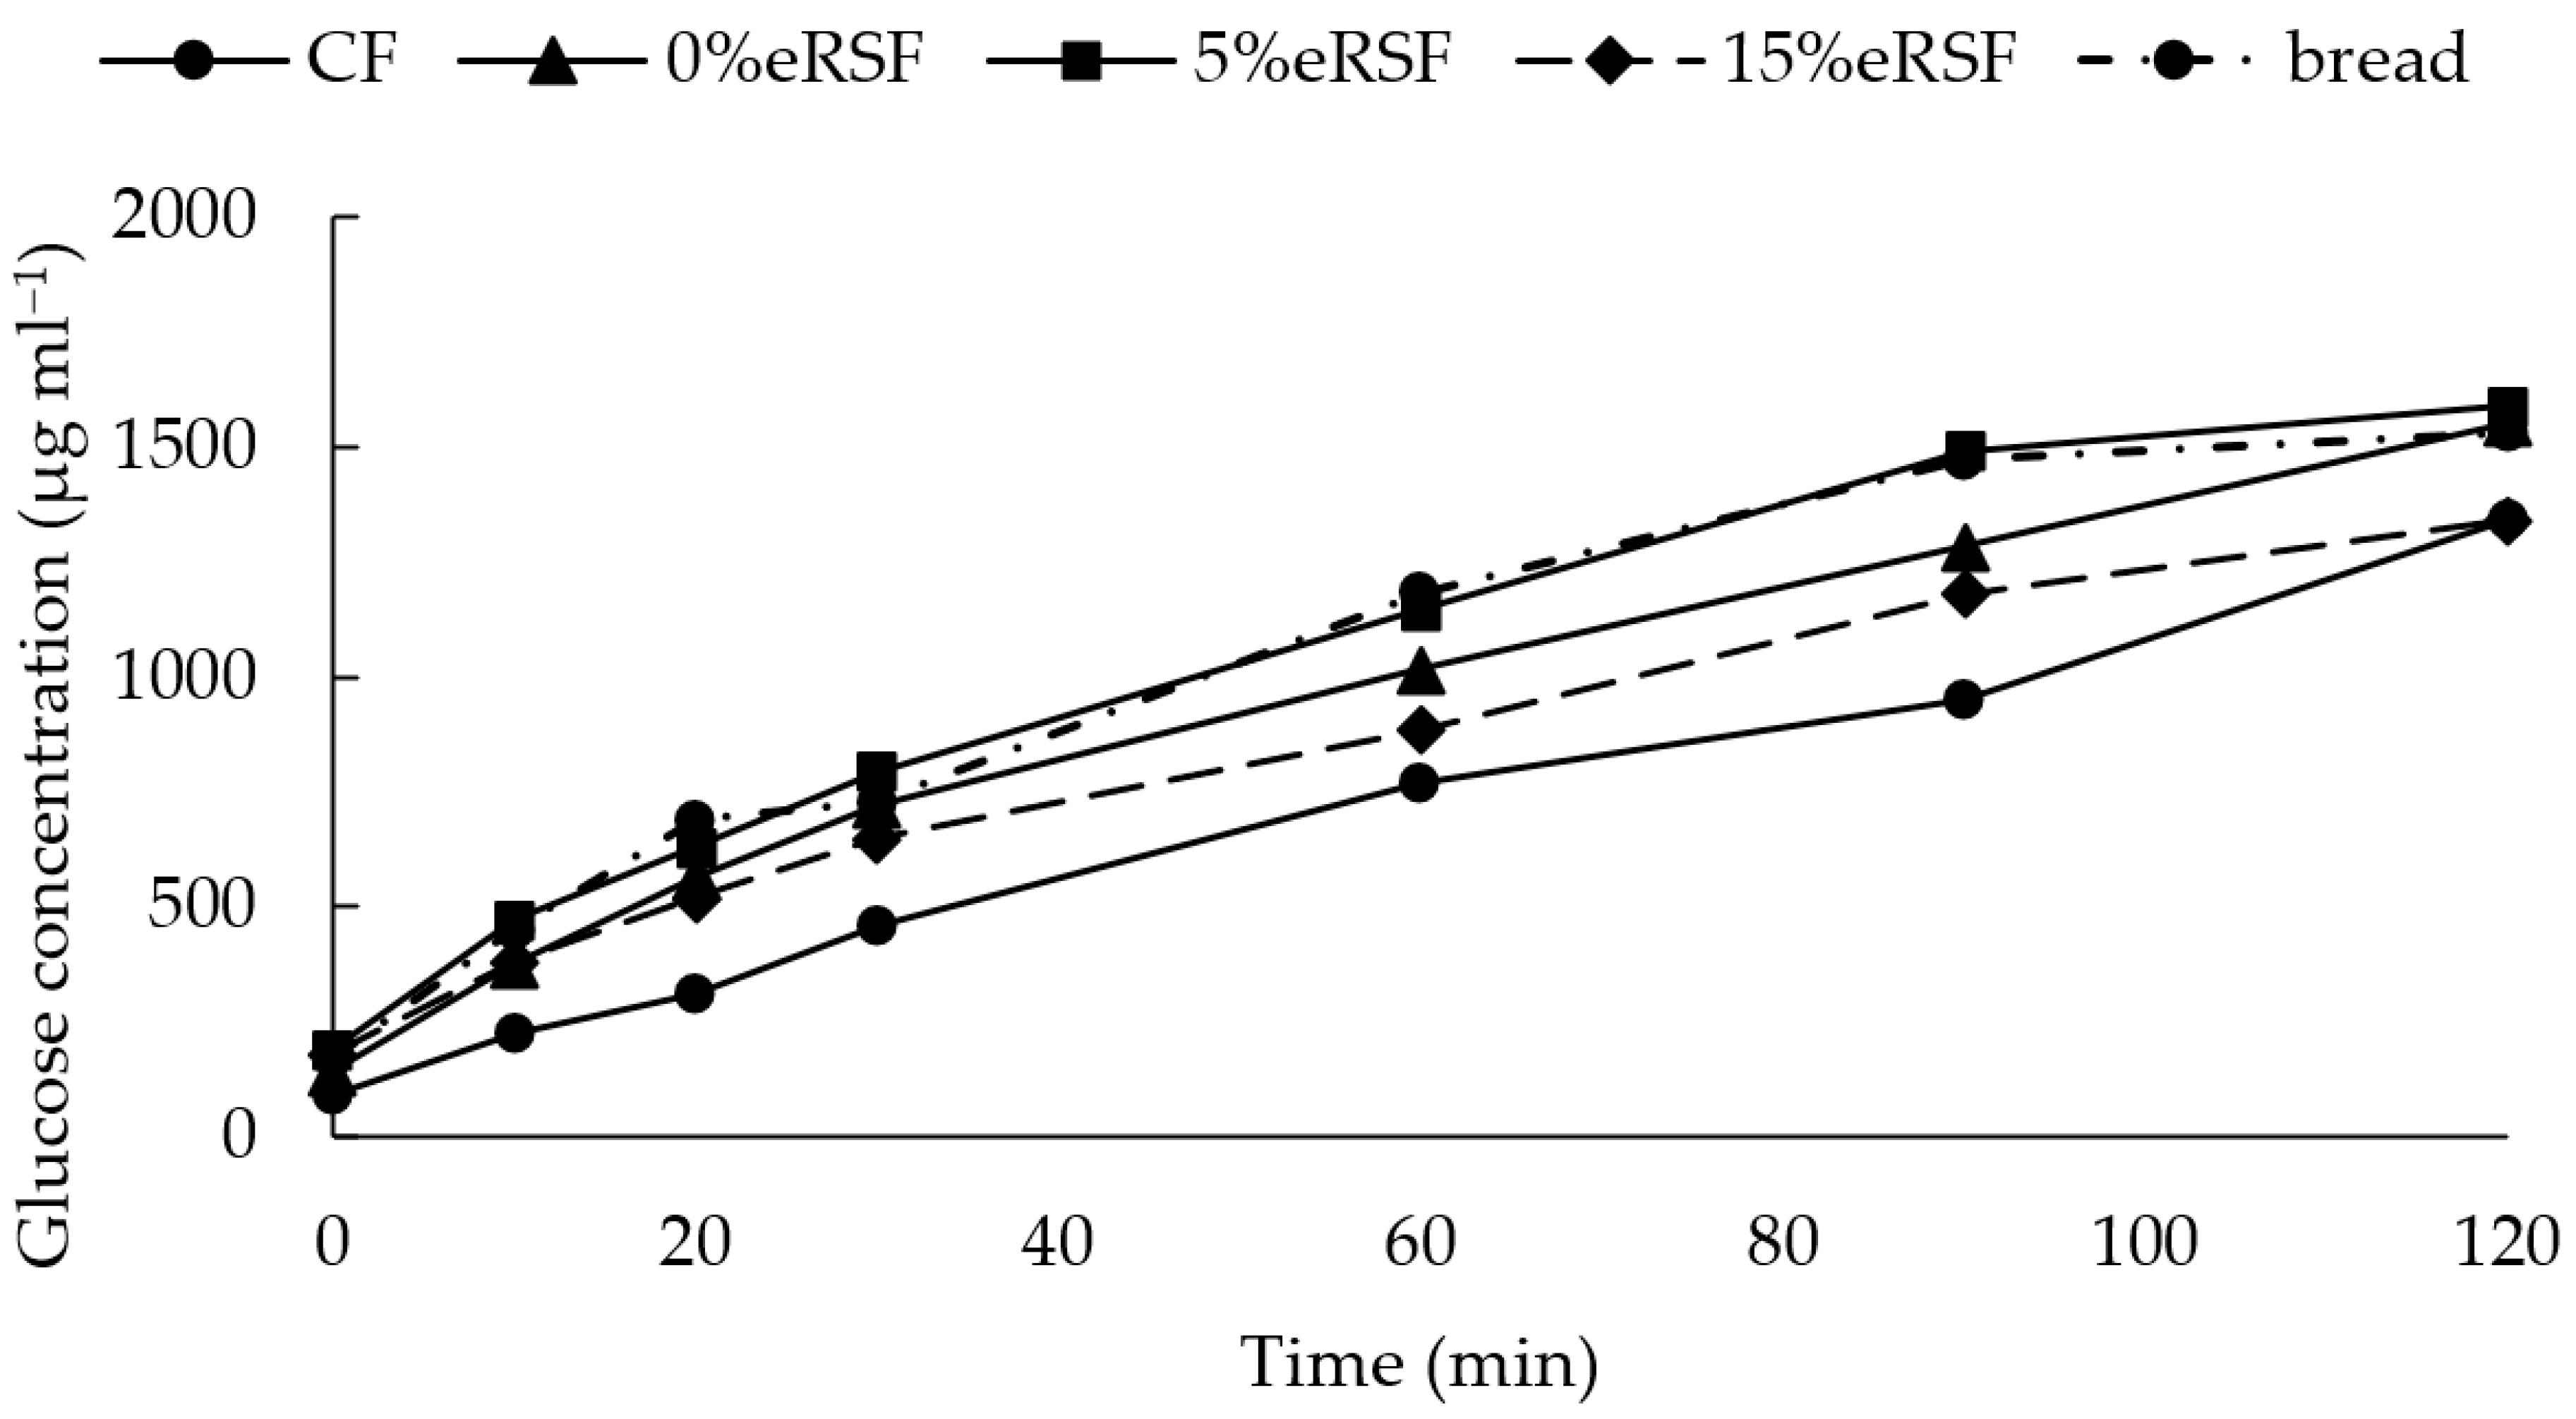
3.7. Glycemic Index
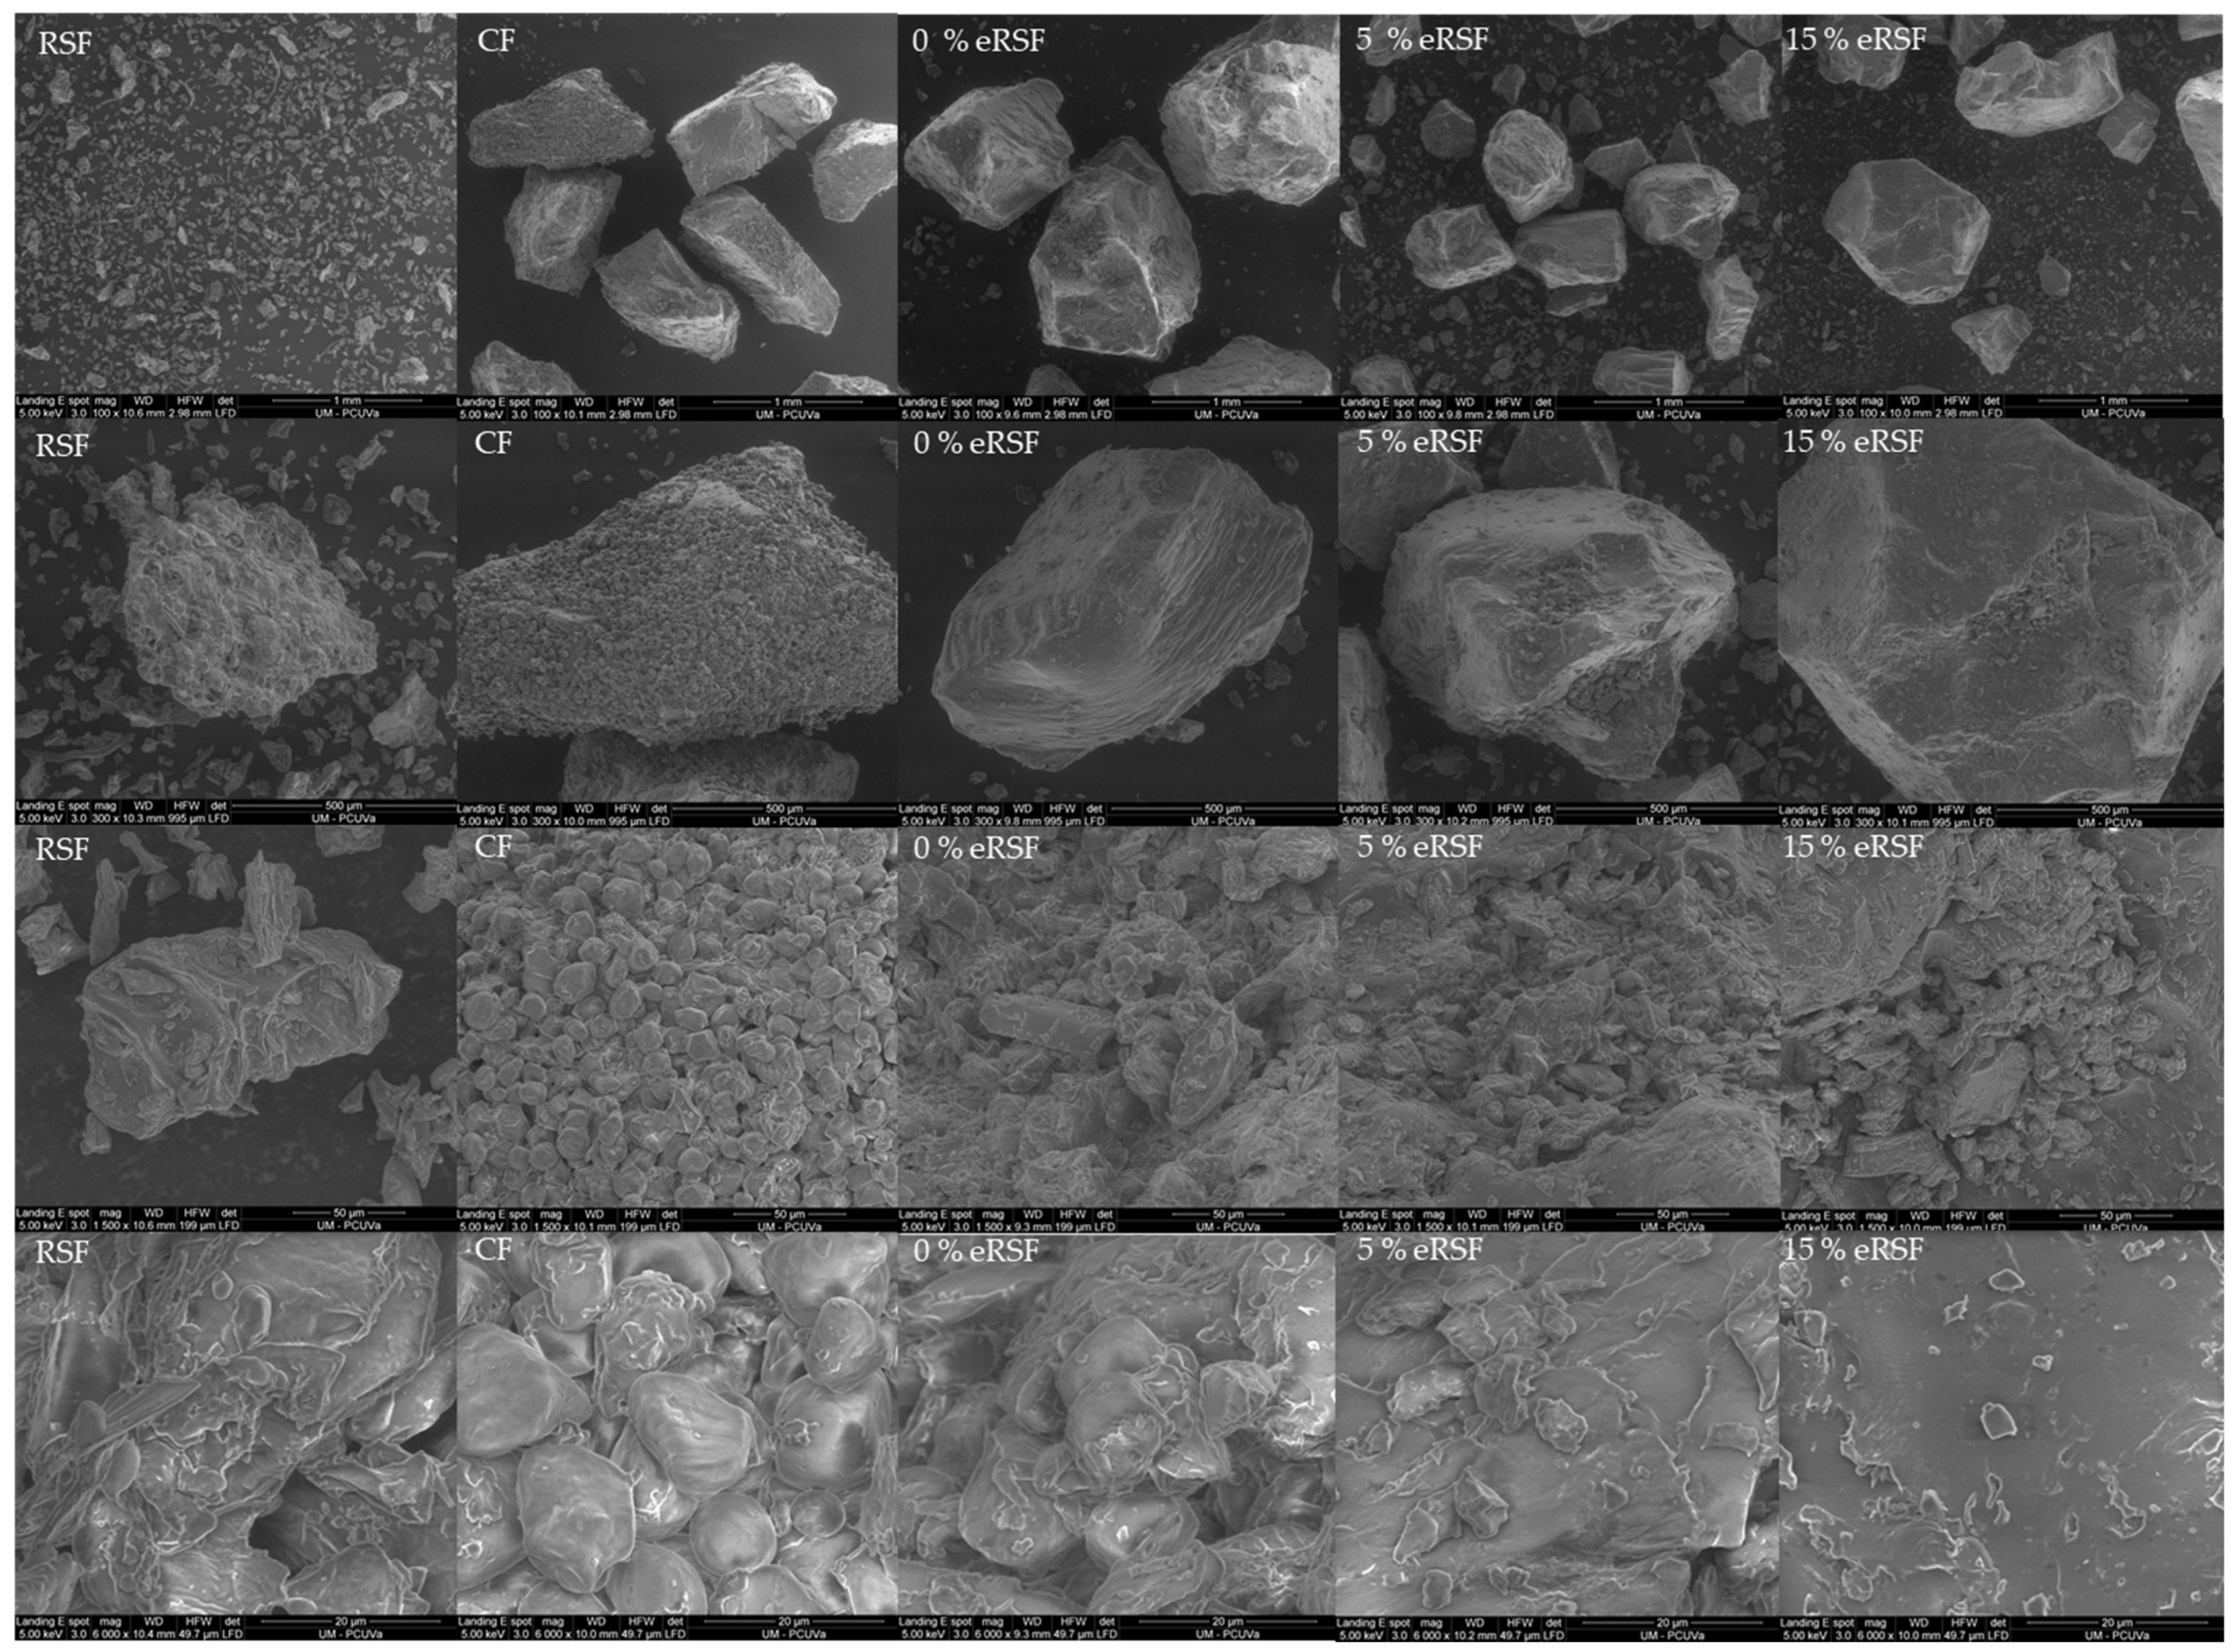
3.8. Scanning Electron Microscopy (SEM)
4. Conclusions
Author Contributions
Funding
Data Availability Statement
Acknowledgments
Conflicts of Interest
References
- Delgado, L.; Schuster, M.; Torero, M. Food Losses in Agrifood Systems: What We Know. Annu. Rev. Resour. Econ. 2023, 15, 41–62. [Google Scholar] [CrossRef]
- Messner, R.; Johnson, H.; Richards, C. From Surplus-to-Waste: A Study of Systemic Overproduction, Surplus and Food Waste in Horticultural Supply Chains. J. Clean. Prod. 2021, 278, 123952. [Google Scholar] [CrossRef]
- Vermeulen, S.J.; Campbell, B.M.; Ingram, J.S.I. Climate Change and Food Systems. Annu. Rev. Environ. Resour. 2012, 37, 195–222. [Google Scholar] [CrossRef]
- FAO—Food and Agriculture Organization of the United Nations. State of Food and Agriculture 2019, Moving Forward on Food Loss and Waste Reduction; FAO: Rome, Italy, 2019; Available online: https://www.fao.org/3/ca6030en/ca6030en.pdf (accessed on 1 October 2024).
- Raak, N.; Symmank, C.; Zahn, S.; Aschemann-Witzel, J.; Rohm, H. Processing- and Product-Related Causes for Food Waste and Implications for the Food Supply Chain. Waste Manag. 2017, 61, 461–472. [Google Scholar] [CrossRef] [PubMed]
- Mirabella, N.; Castellani, V.; Sala, S. Current Options for the Valorization of Food Manufacturing Waste: A Review. J. Clean. Prod. 2014, 65, 28–41. [Google Scholar] [CrossRef]
- Saba, B.; Bharathidasan, A.K.; Ezeji, T.C.; Cornish, K. Characterization and Potential Valorization of Industrial Food Processing Wastes. Sci. Total Environ. 2023, 868, 161550. [Google Scholar] [CrossRef] [PubMed]
- Nirmal, N.P.; Khanashyam, A.C.; Mundanat, A.S.; Shah, K.; Babu, K.S.; Thorakkattu, P.; Al-Asmari, F.; Pandiselvam, R. Valorization of Fruit Waste for Bioactive Compounds and Their Applications in the Food Industry. Foods 2023, 12, 556. [Google Scholar] [CrossRef]
- Tuso, P.J.; Ismail, M.H.; Ha, B.P.; Bartolotto, C. Nutritional Update for Physicians: Plant-Based Diets. Perm. J. 2013, 17, 61–66. [Google Scholar] [CrossRef] [PubMed]
- McMacken, M.; Shah, S. A Plant-Based Diet for the Prevention and Treatment of Type 2 Diabetes. J. Geriatr. Cardiol. 2017, 14, 342–354. [Google Scholar] [CrossRef] [PubMed]
- Poore, J.; Nemecek, T. Reducing Food’s Environmental Impacts through Producers and Consumers. Science 2018, 360, 987–992. [Google Scholar] [CrossRef] [PubMed]
- Springmann, M.; Clark, M.; Mason-D’Croz, D.; Wiebe, K.; Bodirsky, B.L.; Lassaletta, L.; de Vries, W.; Vermeulen, S.J.; Herrero, M.; Carlson, K.M.; et al. Options for Keeping the Food System within Environmental Limits. Nature 2018, 562, 519–525. [Google Scholar] [CrossRef] [PubMed]
- Dimou, C.; Karantonis, H.C.; Skalkos, D.; Koutelidakis, A.E. Valorization of Fruits By-Products to Unconventional Sources of Additives, Oil, Biomolecules and Innovative Functional Foods. Curr. Pharm. Biotechnol. 2019, 20, 776–786. [Google Scholar] [CrossRef] [PubMed]
- Lucarini, M.; Durazzo, A.; Bernini, R.; Campo, M.; Vita, C.; Souto, E.B.; Lombardi-Boccia, G.; Ramadan, M.F.; Santini, A.; Romani, A. Fruit Wastes as a Valuable Source of Value-Added Compounds: A Collaborative Perspective. Molecules 2021, 26, 6338. [Google Scholar] [CrossRef] [PubMed]
- Ali, A.; Rahut, D.B. Healthy Foods as Proxy for Functional Foods: Consumers’ Awareness, Perception, and Demand for Natural Functional Foods in Pakistan. Int. J. Food Sci. 2019, 2019, 6390650. [Google Scholar] [CrossRef]
- Alae-Carew, C.; Green, R.; Stewart, C.; Cook, B.; Dangour, A.D.; Scheelbeek, P.F.D. The Role of Plant-Based Alternative Foods in Sustainable and Healthy Food Systems: Consumption Trends in the UK. Sci. Total Environ. 2022, 807, 151041. [Google Scholar] [CrossRef]
- McClements, D.J.; Grossmann, L. The Rise of Plant-Based Foods. In Next-Generation Plant-Based Foods; Springer International Publishing: Cham, Switzerland, 2022; pp. 1–21. ISBN 9783030967635. [Google Scholar]
- Rini, L.; Bayudan, S.; Faber, I.; Jietse Schouteten, J.; Perez-Cueto, F.J.A.; Bechtold, K.-B.; Gellynck, X.; Bom Frøst, M.; De Steur, H. The Role of Social Media in Driving Beliefs, Attitudes, and Intentions of Meat Reduction towards Plant-Based Meat Behavioral Intentions. Food Qual. Prefer. 2024, 113, 105059. [Google Scholar] [CrossRef]
- FAO. FAOSTAT. 2022. Available online: http://www.fao.org/faostat (accessed on 1 October 2024).
- Bassi, D.; Mignani, I.; Spinardi, A.; Tura, D. Chapter 23—PEACH (Prunus persica (L.) Batsch). In Nutritional Composition of Fruit Cultivars; Simmonds, M.S.J., Preedy, V.R., Eds.; Academic Press: San Diego, CA, USA, 2016; pp. 535–571. ISBN 9780124081178. [Google Scholar]
- Nowicka, P.; Wojdyło, A. Content of Bioactive Compounds in the Peach Kernels and Their Antioxidant, Anti-Hyperglycemic, Anti-Aging Properties. Eur. Food Res. Technol. 2019, 245, 1123–1136. [Google Scholar] [CrossRef]
- Stojanovic, B.T.; Mitic, S.S.; Stojanovic, G.S.; Mitic, M.N.; Kostic, D.A.; Paunovic, D.D.; Arsic, B.B. Phenolic Profile and Antioxidant Activity of Pulp and Peel from Peach and Nectarine Fruits. Not. Bot. Horti Agrobot. Cluj Napoca 2016, 44, 175–182. [Google Scholar] [CrossRef]
- Mihaylova, D.; Popova, A.; Desseva, I.; Petkova, N.; Stoyanova, M.; Vrancheva, R.; Slavov, A.; Slavchev, A.; Lante, A. Comparative Study of Early- and Mid-Ripening Peach (Prunus persica L.) Varieties: Biological Activity, Macro-, and Micro-Nutrient Profile. Foods 2021, 10, 164. [Google Scholar] [CrossRef] [PubMed]
- Barber, T.M.; Kabisch, S.; Pfeiffer, A.F.H.; Weickert, M.O. The Health Benefits of Dietary Fibre. Nutrients 2020, 12, 3209. [Google Scholar] [CrossRef]
- Pasini, A.M.F.; Cominacini, L. Potential Benefits of Antioxidant Phytochemicals on Endogenous Antioxidants Defences in Chronic Diseases. Antioxidants 2023, 12, 890. [Google Scholar] [CrossRef]
- Nishida, C.; Uauy, R.; Kumanyika, S.; Shetty, P. The Joint WHO/FAO Expert Consultation on Diet, Nutrition and the Prevention of Chronic Diseases: Process, Product and Policy Implications. Public Health Nutr. 2004, 7, 245–250. [Google Scholar] [CrossRef] [PubMed]
- EFSA Panel on Dietetic Products, Nutrition, and Allergies (NDA). Scientific Opinion on Dietary Reference Values for Carbohydrates and Dietary Fibre. EFSA J. 2010, 8, 77. [Google Scholar] [CrossRef]
- Kehoe, L.; Walton, J.; Flynn, A. Nutritional Challenges for Older Adults in Europe: Current Status and Future Directions. Proc. Nutr. Soc. 2019, 78, 221–233. [Google Scholar] [CrossRef]
- Culetu, A.; Susman, I.E.; Duta, D.E.; Belc, N. Nutritional and Functional Properties of Gluten-Free Flours. Appl. Sci. 2021, 11, 6283. [Google Scholar] [CrossRef]
- Gabrovská, D.; Hálová, I.; Chrpová, D.; Ouhrabková, J.; Sluková, M.; Vavreinová, S.; Faměra, O.; Kohout, P.; Pánek, J.; Skřivan, P. Cereals in Human Nutrition, (Obiloviny v Lidské Výživě), 1st ed.; Federation of the Food and Drink Industries of the Czech Republic: Prague, Czech Republic, 2015; pp. 44–49. [Google Scholar]
- Martín-Diana, A.B.; Espeso, B.B.; Pulido, I.J.J.; Martínez, P.J.A.; Rico, D. Twin-Screw Extrusion as Hydrothermal Technology for the Development of Gluten-Free Teff Flours: Effect on Antioxidant, Glycaemic Index and Techno-Functional Properties. Foods 2022, 11, 3610. [Google Scholar] [CrossRef]
- Gutiérrez, Á.L.; Rico, D.; Ronda, F.; Martín-Diana, A.B.; Caballero, P.A. Development of a Gluten-Free Whole Grain Flour by Combining Soaking and High Hydrostatic Pressure Treatments for Enhancing Functional, Nutritional and Bioactive Properties. J. Cereal Sci. 2022, 105, 103458. [Google Scholar] [CrossRef]
- Maghaydah, S.; Abu-Ghoush, M.; Hayajneh, W.; Iqbal, S. Development and Characterization of High-Fiber, Gluten-Free Pasta for Celiac Disease Patients. Appl. Sci. 2024, 14, 3779. [Google Scholar] [CrossRef]
- Rico, D.; Cano, A.B.; Martín-Diana, A.B. Pulse-Cereal Blend Extrusion for Improving the Antioxidant Properties of a Gluten-Free Flour. Molecules 2021, 26, 5578. [Google Scholar] [CrossRef]
- Rico, D.; Ronda, F.; Villanueva, M.; Montero, C.P.; Martin-Diana, A.B. Development of Healthy Gluten-Free Crackers from White and Brown Tef (Eragrostis Tef Zucc.) Flours. Heliyon 2019, 5, e02598. [Google Scholar] [CrossRef] [PubMed]
- Detchewa, P.; Prasajak, P.; Phungamngoen, C.; Sriwichai, W.; Naivikul, O.; Moongngarm, A. Substitution of Rice Flour with Rice Protein Improved Quality of Gluten-Free Rice Spaghetti Processed Using Single Screw Extrusion. Lebenson. Wiss. Technol. 2022, 153, 112512. [Google Scholar] [CrossRef]
- Ciudad-Mulero, M.; Fernández-Ruiz, V.; Cuadrado, C.; Arribas, C.; Pedrosa, M.M.; Berrios, J.D.J.; Pan, J.; Morales, P. Novel Gluten-Free Formulations from Lentil Flours and Nutritional Yeast: Evaluation of Extrusion Effect on Phytochemicals and Non-Nutritional Factors. Food Chem. 2020, 315, 126175. [Google Scholar] [CrossRef] [PubMed]
- Delgado-Murillo, S.A.; de Jesús Zazueta-Morales, J.; Quintero-Ramos, A.; Castro-Montoya, Y.A.; Ruiz-Armenta, X.A.; Limón-Valenzuela, V.; Nieblas, C.I.D. Effect of the Extrusion Process on the Physicochemical, Phytochemical, and Cooking Properties of Gluten-Free Pasta Made from Broken Rice and Chickpea Flours. Biotecnia 2024, 26, e2142. [Google Scholar] [CrossRef]
- Caporizzi, R.; Schönlechner, R.; D’amico, S.; Severini, C.; Derossi, A. Novel Gluten-Free Breakfast Cereals Produced by Extrusion Cooking from Rice and Teff: Effects on Microstructural, Physical and Nutritional Properties. Foods 2023, 12, 609. [Google Scholar] [CrossRef] [PubMed]
- Dalbhagat, C.G.; Mahato, D.K.; Mishra, H.N. Effect of Extrusion Processing on Physicochemical, Functional and Nutritional Characteristics of Rice and Rice-Based Products: A Review. Trends Food Sci. Technol. 2019, 85, 226–240. [Google Scholar] [CrossRef]
- Choton, S.; Gupta, N.; Bandral, J.D.; Anjum, N.; Choudary, A. Extrusion Technology and Its Application in Food Processing: A Review. Pharma Innov. 2020, 9, 162–168. [Google Scholar] [CrossRef]
- Mościcki, L.; Wójtowicz, A. Raw Materials in the Production of Extrudates. In Extrusion—Cooking Techniques: Applications, Theory and Sustainability; Mościcki, L., Ed.; Wiley-VCH: Weinheim, Germany, 2011; pp. 45–63. ISBN 9783527328888. [Google Scholar]
- Iuga, M.; Mironeasa, S. A Review of the Hydrothermal Treatments Impact on Starch Based Systems Properties. Crit. Rev. Food Sci. Nutr. 2020, 60, 3890–3915. [Google Scholar] [CrossRef]
- Arora, B.; Yoon, A.; Sriram, M.; Singha, P.; Rizvi, S.S.H. Reactive Extrusion: A Review of the Physicochemical Changes in Food Systems. Innov. Food Sci. Emerg. Technol. 2020, 64, 102429. [Google Scholar] [CrossRef]
- Dilrukshi, H.N.N.; Torrico, D.D.; Brennan, M.A.; Brennan, C.S. Effects of Extrusion Processing on the Bioactive Constituents, in Vitro Digestibility, Amino Acid Composition, and Antioxidant Potential of Novel Gluten-Free Extruded Snacks Fortified with Cowpea and Whey Protein Concentrate. Food Chem. 2022, 389, 133107. [Google Scholar] [CrossRef] [PubMed]
- González-Seligra, P.; Guz, L.; Ochoa-Yepes, O.; Goyanes, S.; Famá, L. Influence of Extrusion Process Conditions on Starch Film Morphology. Lebenson. Wiss. Technol. 2017, 84, 520–528. [Google Scholar] [CrossRef]
- Wang, L.-S.; Duan, Y.-M.; Tong, L.-F.; Yu, X.-S.; Saleh, A.S.M.; Xiao, Z.-G.; Wang, P. Effect of Extrusion Parameters on the Interaction between Rice Starch and Glutelin in the Preparation of Reconstituted Rice. Int. J. Biol. Macromol. 2023, 225, 277–285. [Google Scholar] [CrossRef]
- Patil, S.S.; Kaur, C. Current Trends in Extrusion: Development of Functional Foods and Novel Ingredients. Food Sci. Technol. Res. 2018, 24, 23–34. [Google Scholar] [CrossRef]
- Bayomy, H.M.; Alamri, E.S.; Albalawi, A.N.; Alharbi, R.; Ozaybi, N.A.; Rozan, M.A.; Shamsia, S.M. Production of Extruded Functional Snacks Based on Resistant Starch Using Waste Rice and Whey Milk. Lebenson. Wiss. Technol. 2024, 197, 115871. [Google Scholar] [CrossRef]
- Orozco-Angelino, X.; Espinosa-Ramírez, J.; Serna-Saldívar, S.O. Extrusion as a Tool to Enhance the Nutritional and Bioactive Potential of Cereal and Legume By-Products. Food Res. Int. 2023, 169, 112889. [Google Scholar] [CrossRef]
- Gómez, M.; Martínez, M.M. Changing Flour Functionality through Physical Treatments for the Production of Gluten-Free Baking Goods. J. Cereal Sci. 2016, 67, 68–74. [Google Scholar] [CrossRef]
- Morantes, G.; Ek, P.; Ganjyal, G.M. Food Safety in Extrusion Processing. In Extrusion Cooking; Elsevier: Amsterdam, The Netherlands, 2020; pp. 507–521. ISBN 9780128153604. [Google Scholar]
- Belorio, M.; Sahagún, M.; Gómez, M. Influence of Flour Particle Size Distribution on the Quality of Maize Gluten-Free Cookies. Foods 2019, 8, 83. [Google Scholar] [CrossRef]
- Kim, J.-M.; Shin, M. Effects of Particle Size Distributions of Rice Flour on the Quality of Gluten-Free Rice Cupcakes. Lebenson. Wiss. Technol. 2014, 59, 526–532. [Google Scholar] [CrossRef]
- AOAC. Official Methods of Analysis of AOAC International, 18th ed.; AOAC: Gaithersburg, MD, USA, 2005. [Google Scholar]
- Slinkard, K.; Singleton, V.L. Total Phenol Analysis: Automation and Comparison with Manual Methods. Am. J. Enol. Vitic. 1977, 28, 49–55. [Google Scholar] [CrossRef]
- Brand-Williams, W.; Cuvelier, M.E.; Berset, C. Use of a Free Radical Method to Evaluate Antioxidant Activity. Lebenson. Wiss. Technol. 1995, 28, 25–30. [Google Scholar] [CrossRef]
- Re, R.; Pellegrini, N.; Proteggente, A.; Pannala, A.; Yang, M.; Rice-Evans, C. Antioxidant Activity Applying an Improved ABTS Radical Cation Decolorization Assay. Free Radic. Biol. Med. 1999, 26, 1231–1237. [Google Scholar] [CrossRef] [PubMed]
- Martin-Diana, A.B.; Izquierdo, N.; Albertos, I.; Sanchez, M.S.; Herrero, A.; Sanz, M.A.; Rico, D. Valorization of Carob’s Germ and Seed Peel as Natural Antioxidant Ingredients in Gluten-Free Crackers: Carob Antioxidant by-Products in Gluten-Free Snack. J. Food Process. Preserv. 2017, 41, e12770. [Google Scholar] [CrossRef]
- Ou, B.; Hampsch-Woodill, M.; Prior, R.L. Development and Validation of an Improved Oxygen Radical Absorbance Capacity Assay Using Fluorescein as the Fluorescent Probe. J. Agric. Food Chem. 2001, 49, 4619–4626. [Google Scholar] [CrossRef] [PubMed]
- Benzie, I.F.; Strain, J.J. The Ferric Reducing Ability of Plasma (FRAP) as a Measure of “Antioxidant Power”: The FRAP Assay. Anal. Biochem. 1996, 239, 70–76. [Google Scholar] [CrossRef]
- Serpen, A.; Capuano, E.; Fogliano, V.; Gökmen, V. A New Procedure to Measure the Antioxidant Activity of Insoluble Food Components. J. Agric. Food Chem. 2007, 55, 7676–7681. [Google Scholar] [CrossRef] [PubMed]
- Gularte, M.A.; Rosell, C.M. Physicochemical Properties and Enzymatic Hydrolysis of Different Starches in the Presence of Hydrocolloids. Carbohydr. Polym. 2011, 85, 237–244. [Google Scholar] [CrossRef]
- Granfeldt, Y. Foods Factors Affecting Metabolic Responses to Cereal Products. Ph.D. Thesis, University of Lund, Lund, Sweden, 1994. [Google Scholar]
- Garcia-Vaquero, M.; Lopez-Alonso, M.; Hayes, M. Assessment of the Functional Properties of Protein Extracted from the Brown Seaweed Himanthalia elongata (Linnaeus) S. F. Gray. Food Res. Int. 2017, 99, 971–978. [Google Scholar] [CrossRef]
- Lafarga, T.; Álvarez, C.; Bobo, G.; Aguiló-Aguayo, I. Characterization of Functional Properties of Proteins from Ganxet Beans (Phaseolus vulgaris L. Var. Ganxet) Isolated Using an Ultrasound-Assisted Methodology. Lebenson. Wiss. Technol. 2018, 98, 106–112. [Google Scholar] [CrossRef]
- Sathe, S.K.; Salunkhe, D.K. Isolation, Partial Characterization and Modification of the Great Northern Bean (Phaseolus vulgaris L.) Starch. J. Food Sci. 1981, 46, 617–621. [Google Scholar] [CrossRef]
- Yadav, M.; Mishra, D.K.; Sand, A.; Behari, K. Modification of Alginate through the Grafting of 2-Acrylamidoglycolic Acid and Study of Physicochemical Properties in Terms of Swelling Capacity, Metal Ion Sorption, Flocculation and Biodegradability. Carbohydr. Polym. 2011, 84, 83–89. [Google Scholar] [CrossRef]
- European Union. Regulation (EC) No 1924/2006 of the European Parliament and of the Council of 20 December 2006, on Nutrition and Health Claims Made on Foods. Available online: https://eur-lex.europa.eu/legal-content/EN/TXT/?uri=CELEX%3A02006R1924-20141213 (accessed on 15 October 2024).
- Shahidi, F.; Ambigaipalan, P. Phenolics and Polyphenolics in Foods, Beverages and Spices: Antioxidant Activity and Health Effects—A Review. J. Funct. Foods 2015, 18, 820–897. [Google Scholar] [CrossRef]
- Camire, M.E.; Camire, A.; Krumhar, K. Chemical and Nutritional Changes in Foods during Extrusion. Crit. Rev. Food Sci. Nutr. 1990, 29, 35–57. [Google Scholar] [CrossRef]
- Manach, C.; Scalbert, A.; Morand, C.; Rémésy, C.; Jiménez, L. Polyphenols: Food Sources and Bioavailability. Am. J. Clin. Nutr. 2004, 79, 727–747. [Google Scholar] [CrossRef] [PubMed]
- Meza, S.L.R.; Massaretto, I.L.; Sinnecker, P.; Schmiele, M.; Chang, Y.K.; Noldin, J.A.; Lanfer Marquez, U.M. Impact of Thermoplastic Extrusion Process on Chemical, Nutritional, Technological and Sensory Properties of Gluten-free Breakfast Cereals from Pigmented Rice. Int. J. Food Sci. Technol. 2021, 56, 3218–3226. [Google Scholar] [CrossRef]
- Culețu, A.; Susman, I.E.; Mulțescu, M.; Șerban, E.C.; Belc, N. Corn Extrudates Enriched with Health-Promoting Ingredients: Physicochemical, Nutritional, and Functional Characteristics. Processes 2023, 11, 1108. [Google Scholar] [CrossRef]
- Brennan, C.; Brennan, M.; Derbyshire, E.; Tiwari, B.K. Effects of Extrusion on the Polyphenols, Vitamins and Antioxidant Activity of Foods. Trends Food Sci. Technol. 2011, 22, 570–575. [Google Scholar] [CrossRef]
- Alonso, R.; Aguirre, A.; Marzo, F. Effects of Extrusion and Traditional Processing Methods on Antinutrients and in Vitro Digestibility of Protein and Starch in Faba and Kidney Beans. Food Chem. 2000, 68, 159–165. [Google Scholar] [CrossRef]
- Miller, N.J.; Rice-Evans, C.; Davies, M.J.; Gopinathan, V.; Milner, A. A Novel Method for Measuring Antioxidant Capacity and Its Application to Monitoring the Antioxidant Status in Premature Neonates. Clin. Sci. 1993, 84, 407–412. [Google Scholar] [CrossRef]
- Dillard, C.J.; German, J.B. Phytochemicals: Nutraceuticals and Human Health. J. Sci. Food Agric. 2000, 80, 1744–1756. [Google Scholar] [CrossRef]
- Xu, B.; Chang, S.K.C. Total Phenolic, Phenolic Acid, Anthocyanin, Flavan-3-Ol, and Flavonol Profiles and Antioxidant Properties of Pinto and Black Beans (Phaseolus vulgaris L.) as Affected by Thermal Processing. J. Agric. Food Chem. 2009, 57, 4754–4764. [Google Scholar] [CrossRef] [PubMed]
- Huang, X.; Liu, H.; Ma, Y.; Mai, S.; Li, C. Effects of Extrusion on Starch Molecular Degradation, Order-Disorder Structural Transition and Digestibility—A Review. Foods 2022, 11, 2538. [Google Scholar] [CrossRef]
- Zhang, Z.; Zhu, M.; Xing, B.; Liang, Y.; Zou, L.; Li, M.; Fan, X.; Ren, G.; Zhang, L.; Qin, P. Effects of Extrusion on Structural Properties, Physicochemical Properties and in Vitro Starch Digestibility of Tartary Buckwheat Flour. Food Hydrocoll. 2023, 135, 108197. [Google Scholar] [CrossRef]
- Enobong, O.U.; Madu, O.I. Influence of Extrusion Process Conditions on Bulk Density, Water Absorption Capacity and Oil Absorption Capacity of Extruded Aerial Yam-Soybean Flour Mixture. Afr. J. Food Sci. 2023, 17, 111–121. [Google Scholar] [CrossRef]
- Arribas, C.; Cabellos, B.; Sánchez, C.; Cuadrado, C.; Guillamón, E.; Pedrosa, M.M. The Impact of Extrusion on the Nutritional Composition, Dietary Fiber and in Vitro Digestibility of Gluten-Free Snacks Based on Rice, Pea and Carob Flour Blends. Food Funct. 2017, 8, 3654–3663. [Google Scholar] [CrossRef] [PubMed]
- Boakye, P.G.; Okyere, A.Y.; Bharathi, R.; Murai, T.; Annor, G.A. Physicochemical and Nutritional Properties of Extruded Products from Cereals of the Triticeae Tribe—A Review. Food Chem. Adv. 2023, 3, 100379. [Google Scholar] [CrossRef]
- Gao, Y.; Sun, Y.; Zhang, Y.; Sun, Y.; Jin, T. Extrusion Modification: Effect of Extrusion on the Functional Properties and Structure of Rice Protein. Processes 2022, 10, 1871. [Google Scholar] [CrossRef]
- Alam, M.S.; Kaur, J.; Khaira, H.; Gupta, K. Extrusion and Extruded Products: Changes in Quality Attributes as Affected by Extrusion Process Parameters: A Review. Crit. Rev. Food Sci. Nutr. 2016, 56, 445–473. [Google Scholar] [CrossRef] [PubMed]
- Huth, M.; Dongowski, G.; Gebhardt, E.; Flamme, W. Functional Properties of Dietary Fibre Enriched Extrudates from Barley. J. Cereal Sci. 2000, 32, 115–128. [Google Scholar] [CrossRef]
- Jalali, M.; Sheikholeslami, Z.; Elhamirad, A.H.; Khodaparast, M.H.H.; Karimi, M. The Effect of the Ultrasound Process and Pre-Gelatinization of the Corn Flour on the Textural, Visual, and Sensory Properties in Gluten-Free Pan Bread. J. Food Sci. Technol. 2020, 57, 993–1002. [Google Scholar] [CrossRef]
- Kaisangsri, N.; Kowalski, R.J.; Wijesekara, I.; Kerdchoechuen, O.; Laohakunjit, N.; Ganjyal, G.M. Carrot Pomace Enhances the Expansion and Nutritional Quality of Corn Starch Extrudates. Lebenson. Wiss. Technol. 2016, 68, 391–399. [Google Scholar] [CrossRef]
- Xu, Y.; Sun, L.; Zhuang, Y.; Gu, Y.; Cheng, G.; Fan, X.; Ding, Y.; Liu, H. Protein-Stabilized Emulsion Gels with Improved Emulsifying and Gelling Properties for the Delivery of Bioactive Ingredients: A Review. Foods 2023, 12, 2703. [Google Scholar] [CrossRef]

| RSF | CF | 0 %eRSF | 5 %eRSF | 15 %eRSF | |
|---|---|---|---|---|---|
| Ash | 3.70 ± 0.06 d | 0.41 ± 0.06 a | 0.43 ± 0.06 a | 0.62 ± 0.06 b | 0.98 ± 0.06 c |
| Fat | 0.47 ± 0.06 a | 0.80 ± 0.06 b | 1.71 ± 0.06 d | 0.77 ± 0.06 b | 0.97 ± 0.06 c |
| Moisture | 5.44 ± 0.03 a | 13.22 ± 0.03 e | 9.01 ± 0.03 c | 8.79 ± 0.03 b | 9.17 ± 0.03 d |
| Protein | 6.88 ± 0.06 b | 6.56 ± 0.06 a | 6.81 ± 0.06 b | 6.81 ± 0.06 b | 6.88 ± 0.06 b |
| Carbohydrates | 83.51 ± 1.22 b | 79.01 ± 1.22 a | 82.04 ± 1.22 ab | 83.02 ± 1.22 b | 82.00 ± 1.22 ab |
| Fiber | 22.50 ± 0.11 e | 4.30 ± 0.11 c | 2.10 ± 0.11 a | 2.50 ± 0.11 b | 5.90 ± 0.11 d |
| Starch | 4.58 ± 0.07 a | 69.55 ± 1.25 c | 77.76 ± 3.00 d | 63.42 ± 1.78 b | 67.40 ± 0.64 c |
| RSF | CF | 0 %eRSF | 5 %eRSF | 15 %eRSF | |
|---|---|---|---|---|---|
| L* | 63.99 ± 0.95 a | 85.65 ± 3.48 d | 84.81 ± 1.69 d | 79.54 ± 1.47 c | 74.48 ± 0.79 b |
| a* | 10.46 ± 0.26 d | 4.09 ± 0.31 c | 3.84 ± 0.26 b | 3.37 ± 0.36 a | 3.92 ± 0.13 bc |
| b* | 14.61 ± 0.51 a | 22.41 ± 1.74 c | 24.86 ± 2.25 d | 20.92 ± 1.67 b | 19.54 ± 0.85 b |
| RSF1 | RSF2 | 15%eRSF | |
|---|---|---|---|
| Cyanidin 3-o-galactoside/Cyanidin 3-o-glucoside/Petunidin 3-o-arabinoside | 64.9 | 36.8 ± 2.4 | 0.6 ± 0.1 |
| Caffeoylquinic acid | n.d. | 3.5 ± 0.1 | n.d. |
| (+)-Catechin | 1.3 | 1.2 ± 0.2 | n.d. |
| (−)-Epicatechin | 1.1 | 3.6 ± 0.02 | n.d. |
| Caffeoylquinic acid | 6.1 | 10.7 ± 0.2 | 0.1 ± 0.002 |
| Procyanidin dimer B | n.d. | 4.5 ± 0.4 | n.d. |
| Procyanidin dimer B | n.d. | 3.3 ± 0.1 | n.d. |
| 3-Feruloylquinic acid | n.d. | n.d. | 0.8 ± 0.02 |
| Quercetin 3-o-rutinoside | 0.2 | 3.0 ± 0.2 | 0.3 ± 0.02 |
| RSF | CF | 0 %eRSF | 5 %eRSF | 15 %eRSF | |
|---|---|---|---|---|---|
| BD (g/mL) | 0.54 ± 0.00 a | 0.83 ± 0.01 c | 0.91 ± 0.01 e | 0.79 ± 0.00 b | 0.88 ± 0.02 d |
| OHC (mL/g) | 3.97 ± 0.02 a | 3.82 ± 1.03 a | 3.49 ± 0.01 a | 3.31 ± 0.59 a | 3.98 ± 0.02 a |
| WHC (mL/g) | 6.44 ± 0.01 d | 2.98 ± 0.00 a | 5.48 ± 0.02 c | 3.82 ± 0.29 b | 3.64 ± 0.25 b |
| SC (mL/g) | 0.00 ± 0.00 a | 0.00 ± 0.00 a | 0.00 ± 0.00 a | 0.00 ± 0.00 a | 2.94 ± 0.05 b |
| EC (%) | 20.99 ± 2.14 e | 7.41 ± 0.00 d | 1.85 ± 0.00 b | 3.70 ± 0.00 c | 0.00 ± 0.00 a |
| FC (%) | 50.00 ± 0.00 b | 50.00 ± 0.00 b | 0.00 ± 0.00 a | 0.00 ± 0.00 a | 0.00 ± 0.00 a |
| LGC (%) | 20.05 ± 0.01 c | 8.05 ± 0.05 a | 8.06 ± 0.02 a | 8.06 ± 0.08 a | 12.12 ± 0.01 b |
| HI (%) | pGI | |
|---|---|---|
| CF | 66.94 ± 1.75 a | 65.90 ± 1.51 a |
| 0%eRSF | 90.30 ± 1.32 c | 86.04 ± 1.13 c |
| 5%eRSF | 101.05 ± 0.40 d | 95.30 ± 0.35 d |
| 15%eRSF | 81.08 ± 1.81 b | 78.09 ± 1.56 b |
| Bread | 100.00 ± 0.00 d | 94.40 ± 0.00 d |
Disclaimer/Publisher’s Note: The statements, opinions and data contained in all publications are solely those of the individual author(s) and contributor(s) and not of MDPI and/or the editor(s). MDPI and/or the editor(s) disclaim responsibility for any injury to people or property resulting from any ideas, methods, instructions or products referred to in the content. |
© 2025 by the authors. Licensee MDPI, Basel, Switzerland. This article is an open access article distributed under the terms and conditions of the Creative Commons Attribution (CC BY) license (https://creativecommons.org/licenses/by/4.0/).
Share and Cite
Martín-Diana, A.B.; Jiménez-Pulido, I.J.; Aguiló-Aguayo, I.; Abadías, M.; Pérez-Jiménez, J.; Rico, D. Peach Peel Extrusion for the Development of Sustainable Gluten-Free Plant-Based Flours. Molecules 2025, 30, 573. https://doi.org/10.3390/molecules30030573
Martín-Diana AB, Jiménez-Pulido IJ, Aguiló-Aguayo I, Abadías M, Pérez-Jiménez J, Rico D. Peach Peel Extrusion for the Development of Sustainable Gluten-Free Plant-Based Flours. Molecules. 2025; 30(3):573. https://doi.org/10.3390/molecules30030573
Chicago/Turabian StyleMartín-Diana, Ana Belen, Iván Jesús Jiménez-Pulido, Ingrid Aguiló-Aguayo, Maribel Abadías, Jara Pérez-Jiménez, and Daniel Rico. 2025. "Peach Peel Extrusion for the Development of Sustainable Gluten-Free Plant-Based Flours" Molecules 30, no. 3: 573. https://doi.org/10.3390/molecules30030573
APA StyleMartín-Diana, A. B., Jiménez-Pulido, I. J., Aguiló-Aguayo, I., Abadías, M., Pérez-Jiménez, J., & Rico, D. (2025). Peach Peel Extrusion for the Development of Sustainable Gluten-Free Plant-Based Flours. Molecules, 30(3), 573. https://doi.org/10.3390/molecules30030573