.jpg)

Insights into the Silver Camphorimine Complexes Interactions with DNA Based on Cyclic Voltammetry and Docking Studies


Abstract
1. Introduction
2. Results
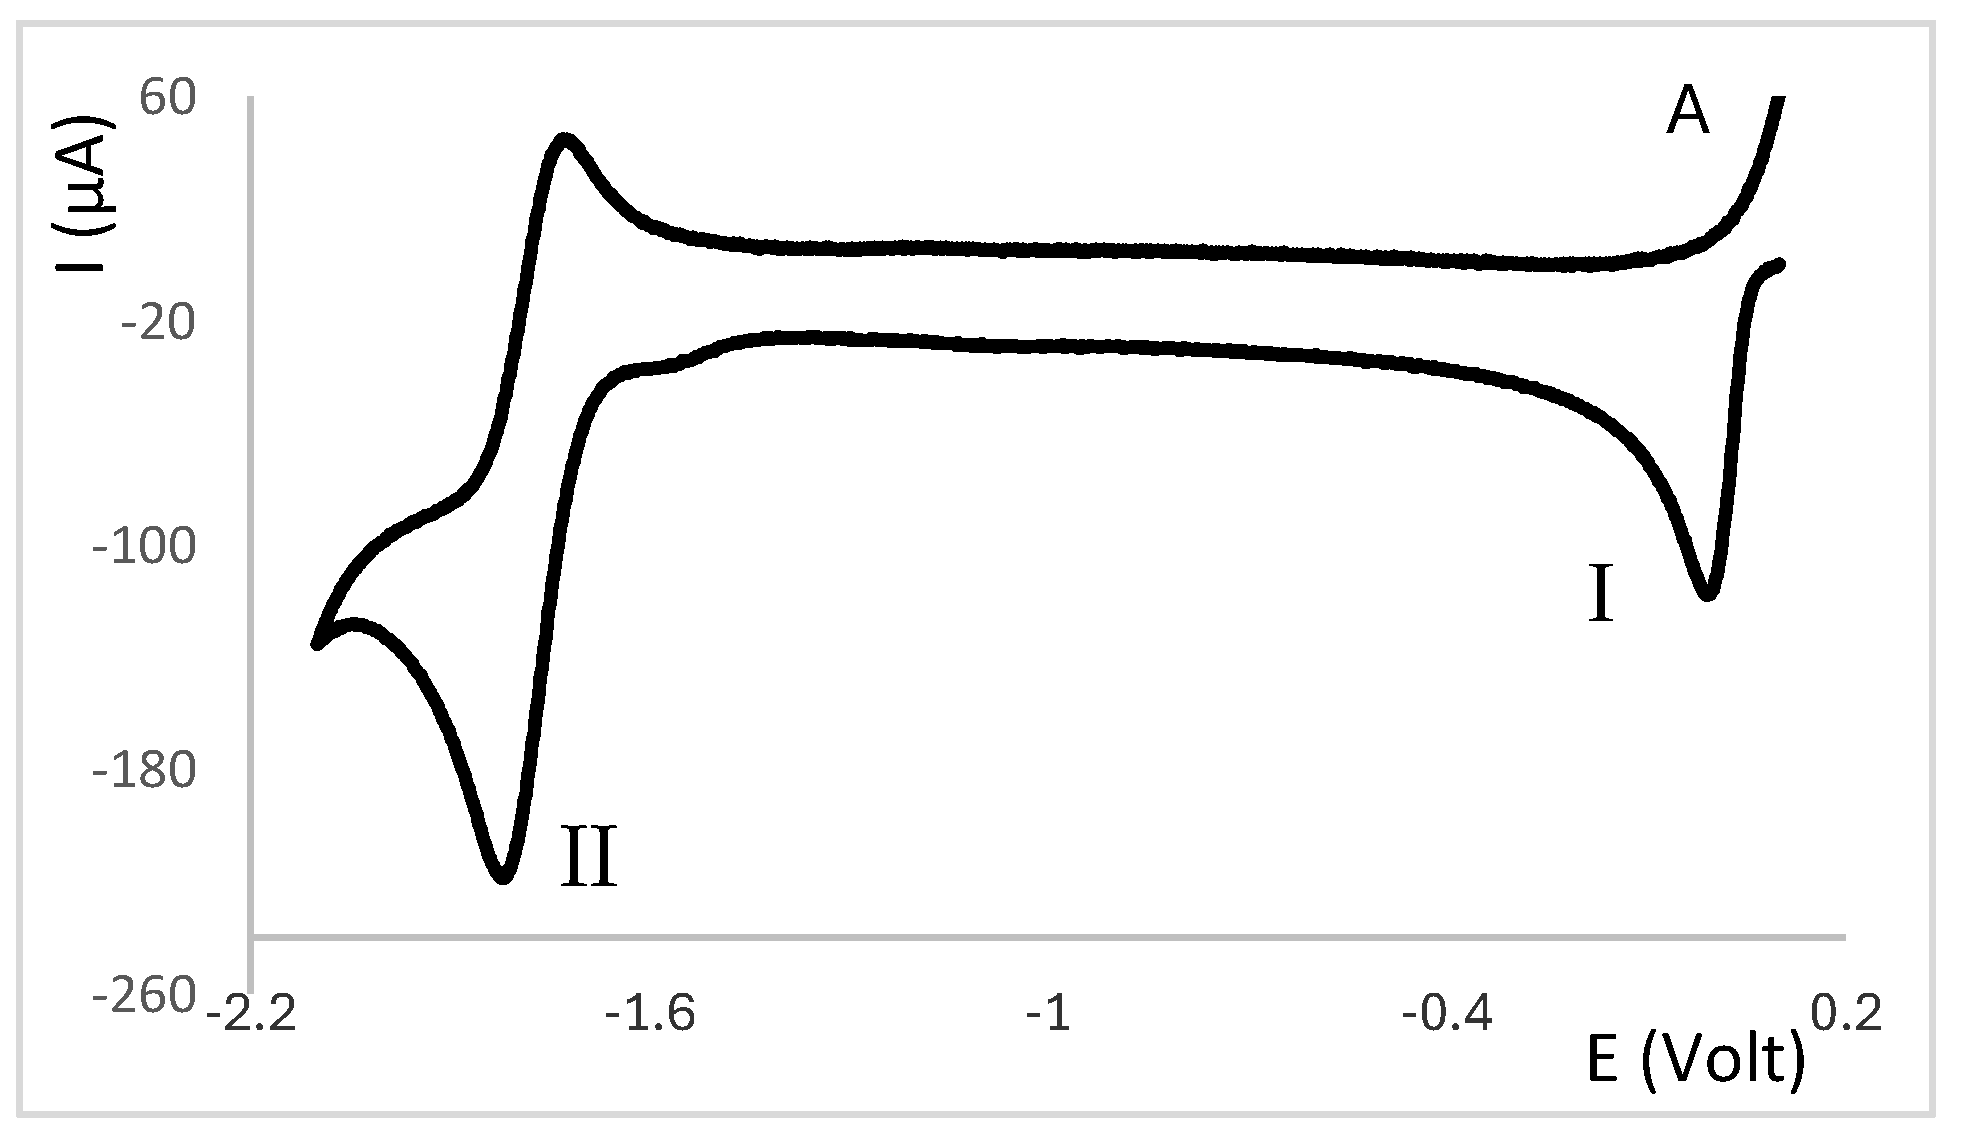
2.1. Redox Properties {Ag(NO3)} Camphor-Derived Complexes

| Complex | AL-Y | Volt | ||
|---|---|---|---|---|
| 1 | 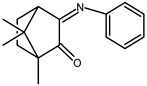 | 0.12 b | −1.62 | 1.63 |
| 1 + DNA | −0.046 | −1.65 c | — | |
| 2 | 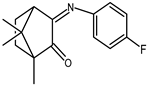 | 0.14 | −1.58 | 1.7 |
| 2 + DNA | 0.065 | −1.45 | — | |
| 3 | 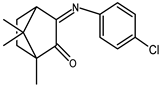 | 0.12 b | −1.27 | 1.58 |
| 3 + DNA | 0.004 | −1.26 | — | |
| 4 | 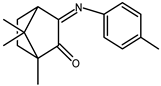 | 0.10 | −1.65 | 1.6 |
| 4 + DNA | −0.058 | −1.50 | 1.61 | |
| 5 | 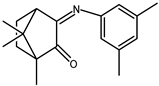 | 0.11 b | −1.60 | 1.49 |
| 5 + DNA | −0.063 | −1.54 | 1.62 | |
| 6 |  | 0.074 b | −1.64 | 0.95 |
| 6 + DNA | −0.076 | −1.67 c | 1.08 | |
| 7 |  | 0.014 | −1.42 c | 1.19 |
| 7 + DNA | −0.16 | −1.29 c | 1.17 | |
| 8 |  | 0.10 b | −1.65 | 1.6 |
| 8 + DNA | 0.040 | −1.85 c | — | |
| 9 |  | 0.12 d | — | 1.75 |
| 9 + DNA | 0.041 | — | — | |
| CL-Z | Volt | |||
|---|---|---|---|---|
| 10 |  | 0.14 | −1.43 | 1.63 |
| 10 + DNA | −0.030 | −1.38 | — | |
| 11 |  | 0.11 | −1.55 | 1.33 |
| 11+ DNA | −0.01 | −1.49 | 1.42 | |
| COMPLEX | BL-Y | Volt | ||
|---|---|---|---|---|
| 12 |  | 0.17 | −1.54 | 1.34 |
| 12 + DNA | 0.11 | −1.36 | — | |
| 13 |  | 0.13 | −1.39 | 1.67 |
| 13 + DNA | 0.036 | −1.55 | 1.54 | |
| 14 |  | 0.13 | −1.13 −1.52 | 1.89 |
| 14 + DNA | 0.010 | −1.14 | — | |
| 15 |  | 0.14 | −1.18 | — |
| 15 + DNA | 0.04 | −1.06 | — | |
| 16 |  | 0.15 | −1.35 −1.85 | 1.28 |
| 16 + DNA | 0.090 | −1.25 | — | |
| 17 |  | 0.080 | −1.13 −1.23 | 1.26 1.57 |
| 17 + DNA | −0.040 | −0.93 −1.25 | — | |
| AgNO3 | — | 0.18 | — | 2.01 |
| AgNO3 + DNA | — | 0.041 | ||
2.2. Redox Properties of {Ag(OH)} and {Ag2(µ-O)} Camphor-Derived Complexes
| COMPLEX | AL-Y | |||
|---|---|---|---|---|
| (Volt) | ||||
| 18 |  | 0.053 | — | 0.41 |
| 18 + DNA | −0.001 | — | — | |
| 19 | 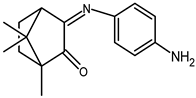 | 0.034 | −1.63 | 0.84 |
| 19 + DNA | 0.020 | −1.51 | — | |
| 20 | 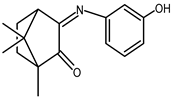 | 0.062 | −1.62 | 1.57 |
| 20 + DNA | 0.036 | −1.42 | — | |
| CL-Z | ||||
| 21 | 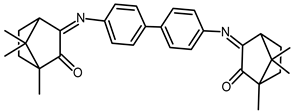 | −0.014 | −1.54 | 1.40 |
| 21 + DNA | −0.044 | −1.46 | 1.15 | |
| COMPLEX | BL-Y | Volt | ||
|---|---|---|---|---|
| 22 | 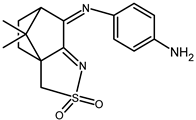 | 0.090 b | −1.33 −1.85 c | 0.82 1.69 |
| 22 + DNA | 0.062 | −1.61 | 0.69 | |
| 23 |  | 0.11 b | −1.19 −1.66 c | 1.69 |
| 23 + DNA | 0.074 | −1.10 | — | |
| COMPLEX | AL-Y | Volt | ||
|---|---|---|---|---|
| 24 |  | −0.021 | −1.63 | 1.70 |
| 24 + DNA | −0.11 | −1.36 | — | |
| 25 |  | 0.024 | −1.54 | — |
| 25 + DNA | −0.014 | −1.30 | — | |
| BL-Y | ||||
| 26 |  | 0.010 V | −1.20 | — |
| 26 + DNA | −0.004 | −1.17 | — | |
| CL-Z | ||||
| 27 | 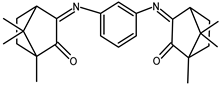 | −0.056 | −1.59 | 1.03 |
| 27 + DNA | −0.106 | −1.33 | 1.2 | |
| Ag(CH3COO) | 0.088 | 1.16 | ||
| Ag(CH3COO) + DNA | 0.084 | 1.13 |
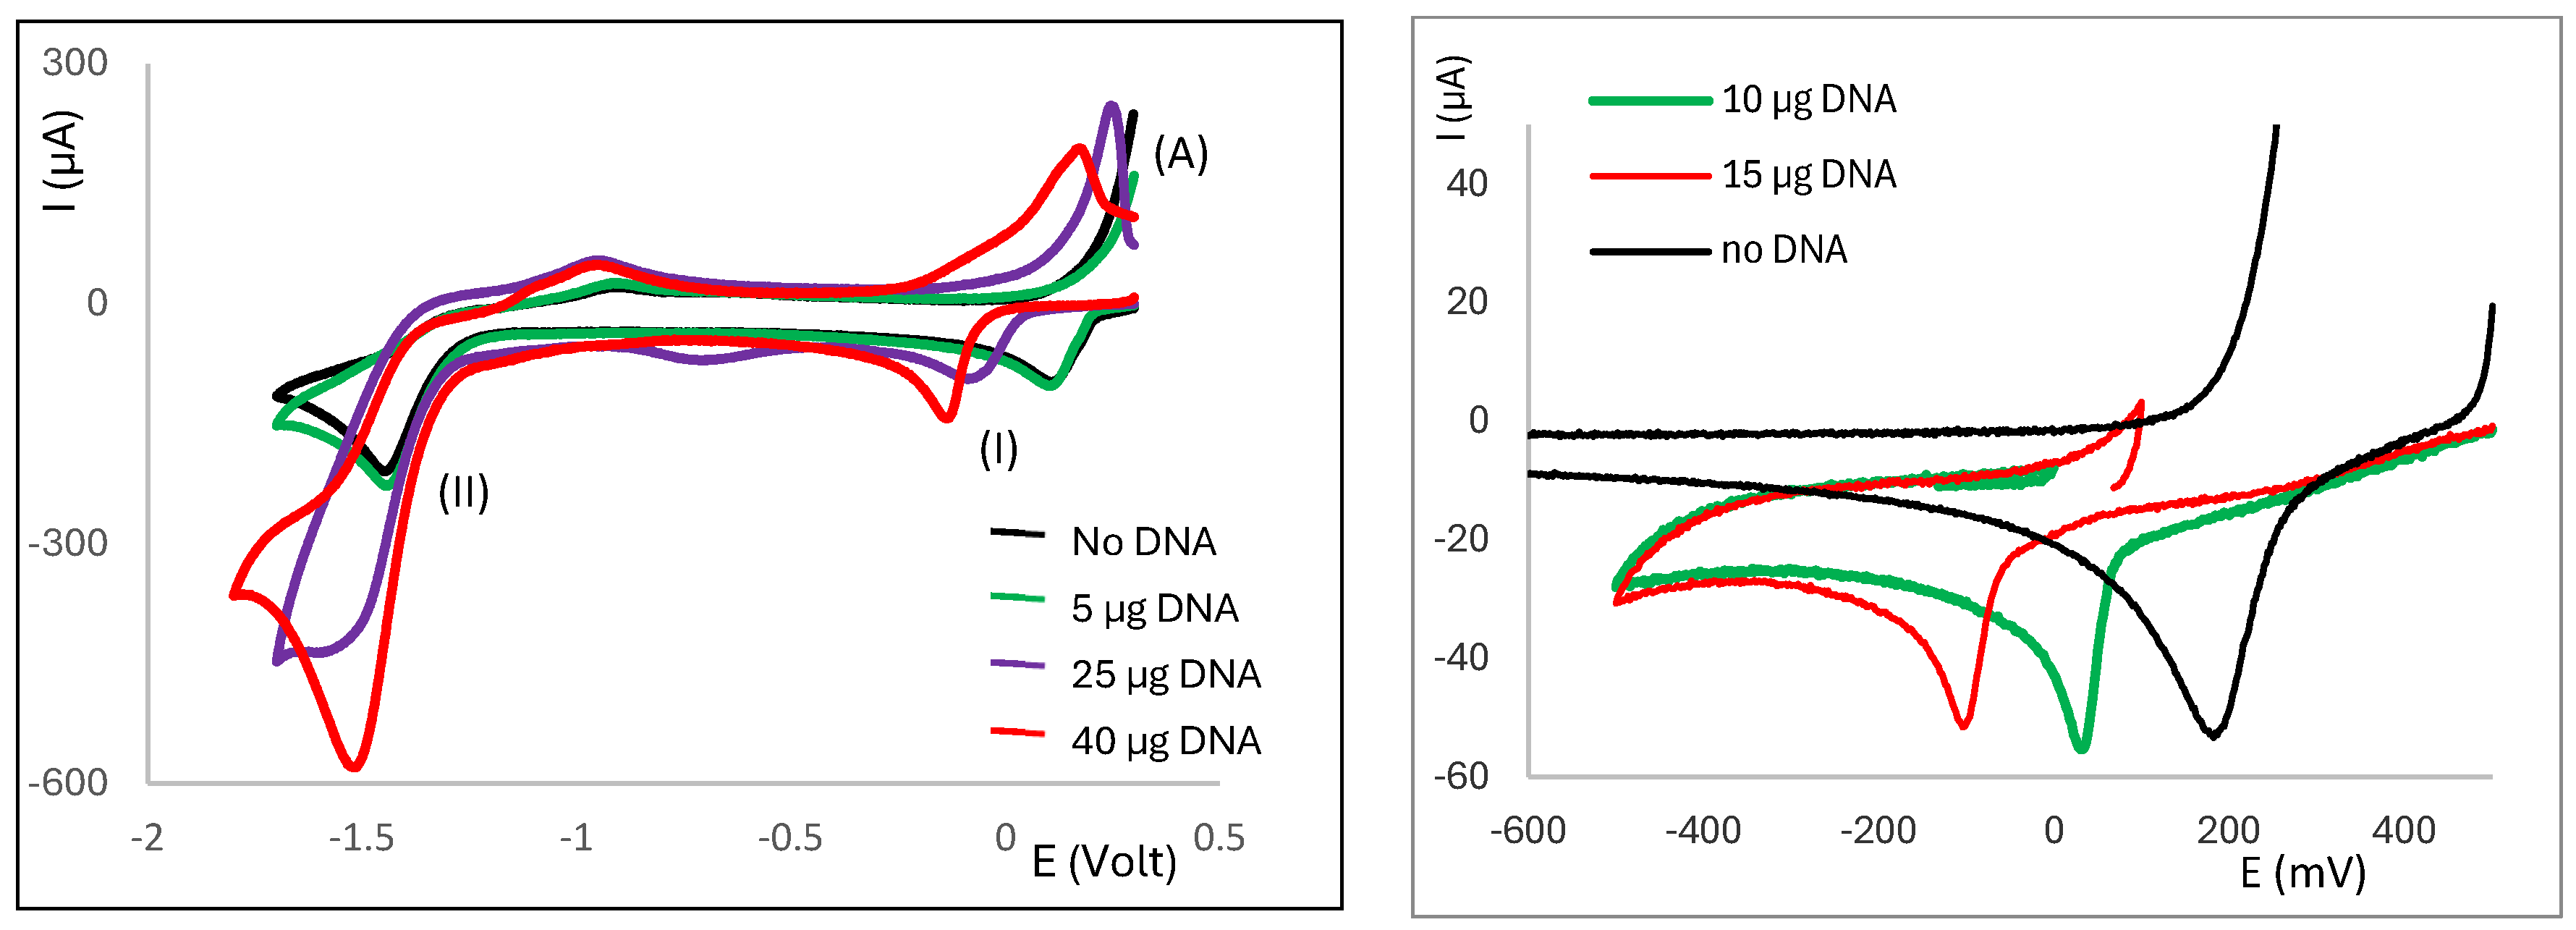
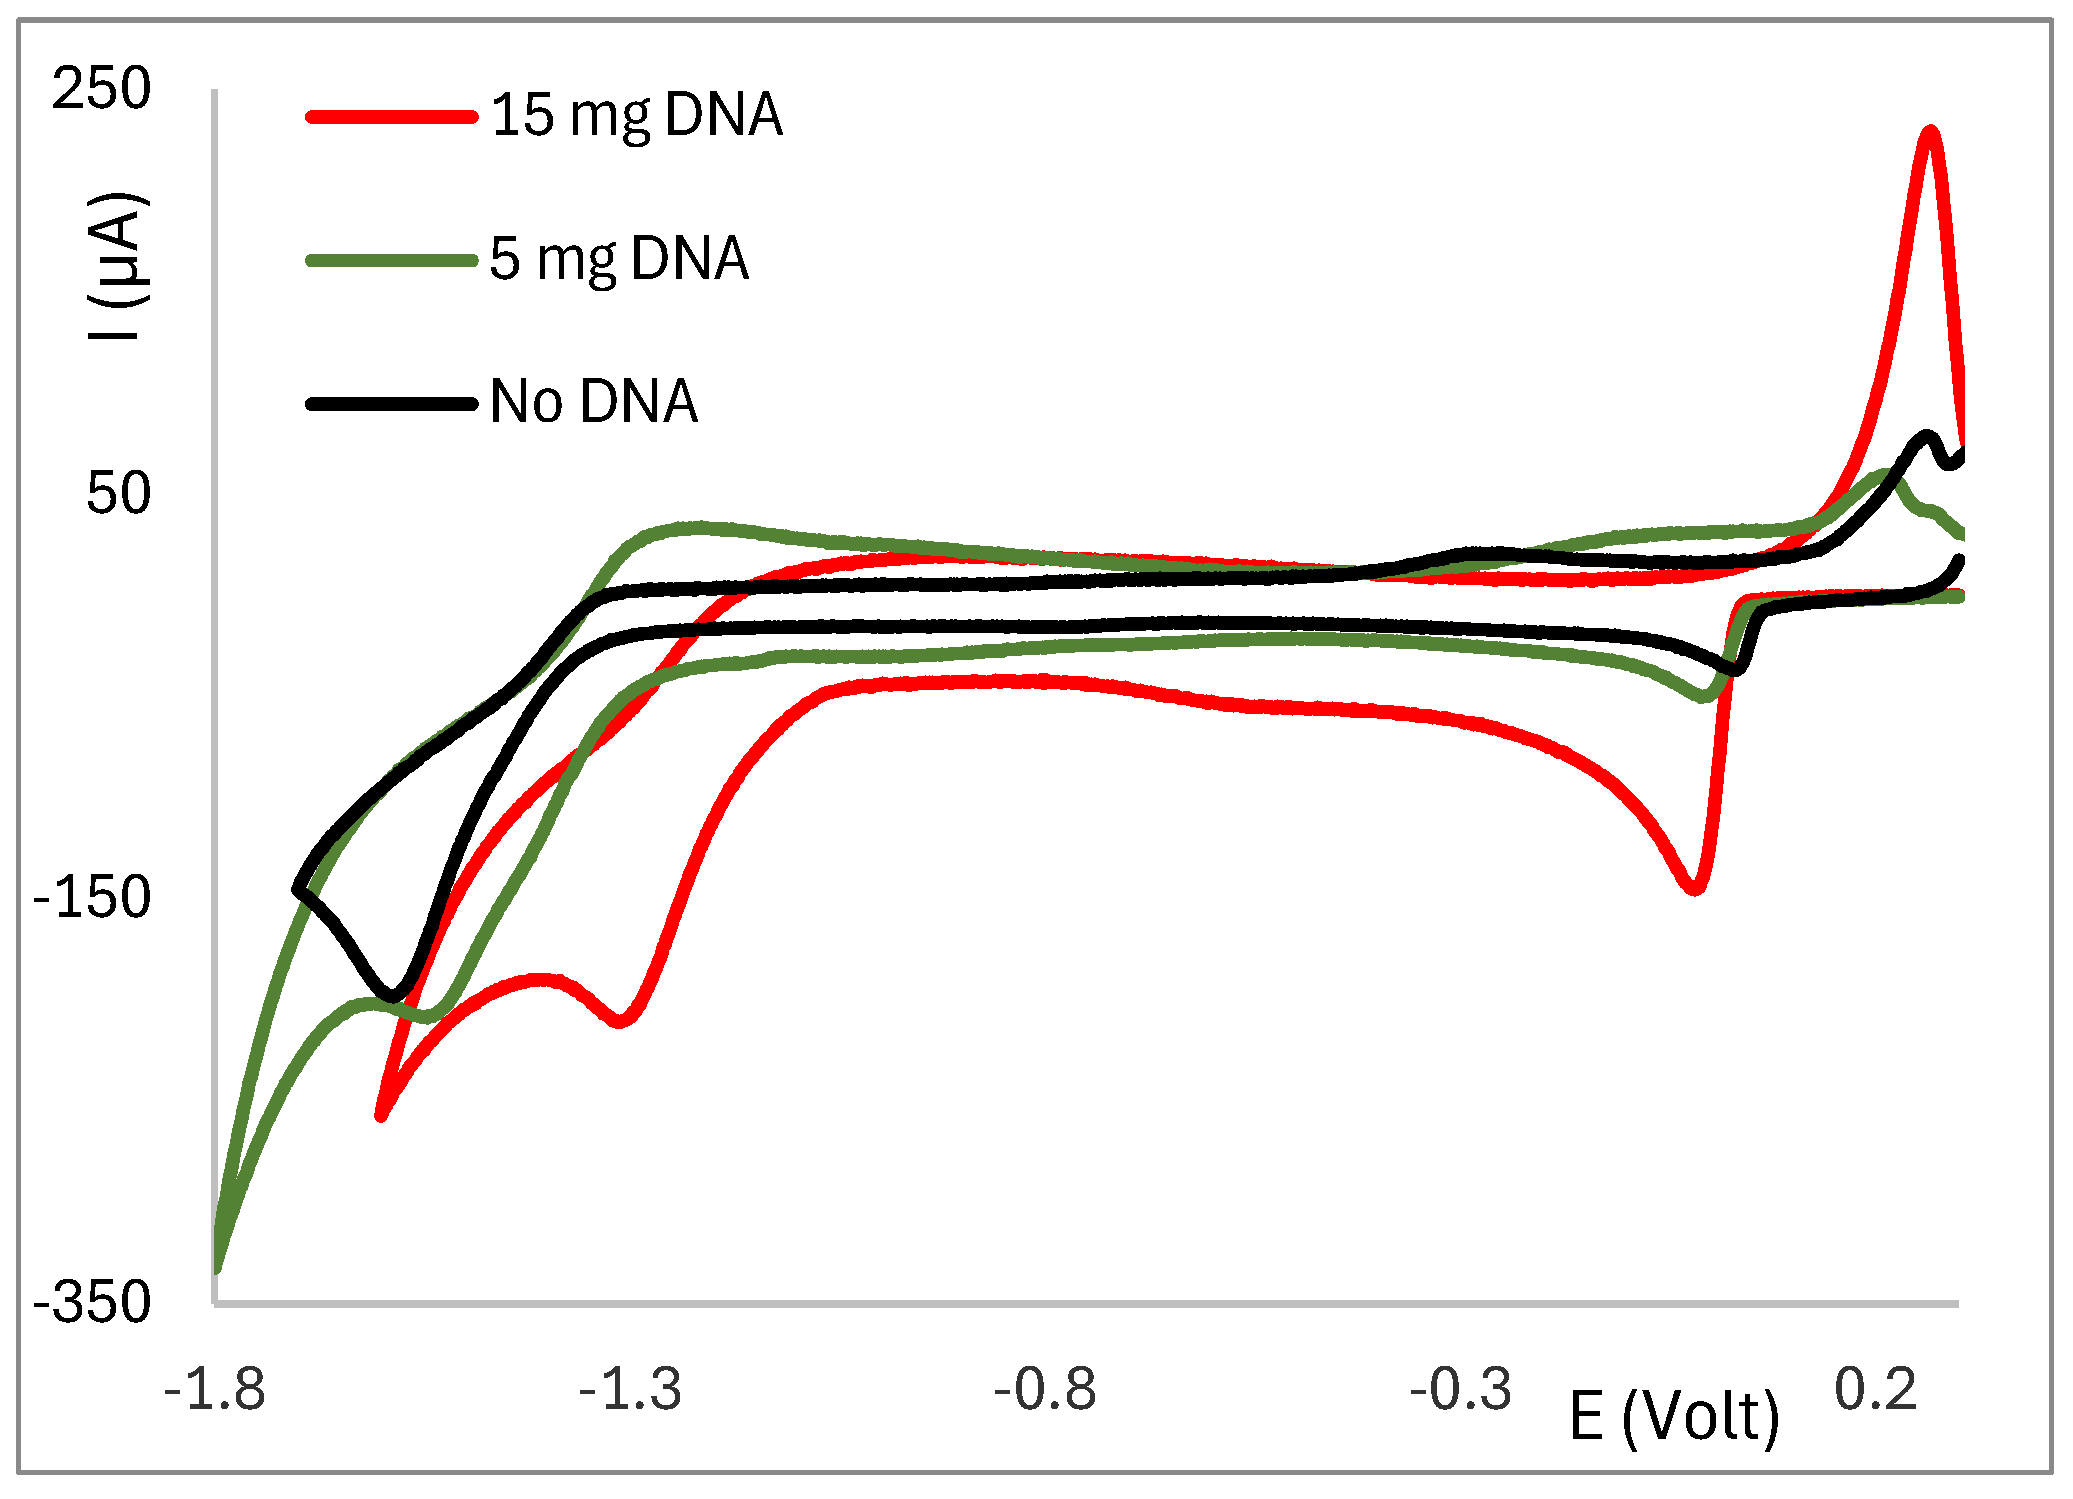
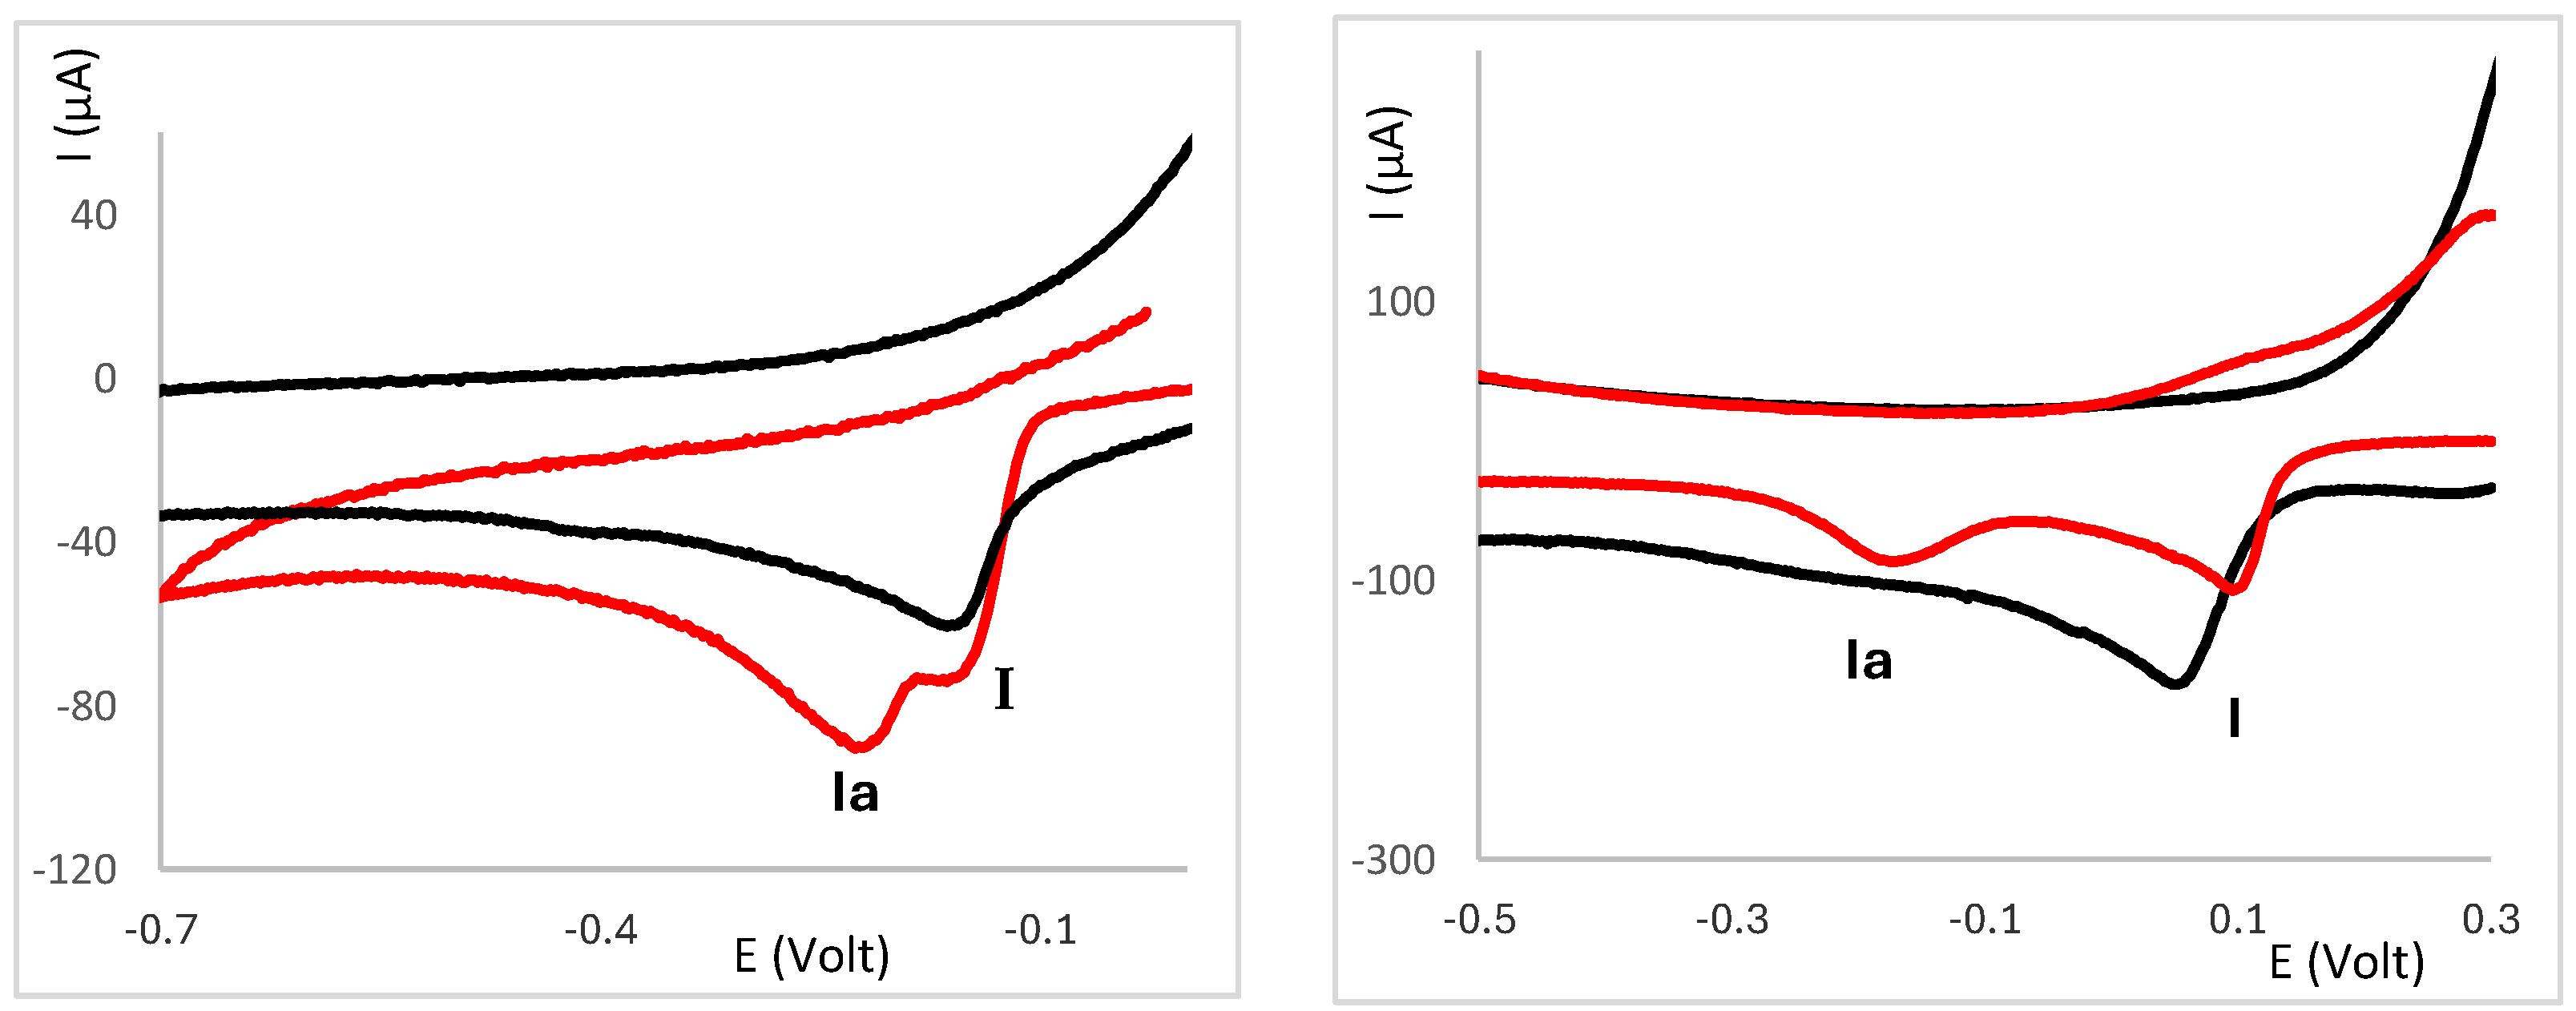
2.3. Electrochemical Behaviour of Ag(I) Camphorimine Complexes in the Presence of CT-DNA Solution
3. Discussion
| Complex | Δ(IEDNA − IE) | Q[Ag]+DNA/Q[Ag] | E a | Complex | Δ(IEDNA − IE) | Q[Ag]+DNA/Q[Ag] | E a |
|---|---|---|---|---|---|---|---|
| mV | kcal/mol | mV | kcal/mol | ||||
| 1 | −166 | 6.4 × 10² | −252.1 | 15 | −100 | 4.9 × 101 | |
| 2 | −75 | 1.9 × 101 | 16 | −60 | 1.0 × 101 | −277.6 | |
| 3 | −116 | 9.2 × 101 | 17 | −120 | 1.1 × 10² | ||
| 4 | −158 | 4.7 × 10² | −246.5 | 18 | −54 | 8.2 | |
| 5 | −173 | 8.5 × 10² | −274.7 | 19 | −14 | 1.7 | −219.8 |
| 6 | −150 | 3.4 × 10² | −280.7 | 20 | −26 | 2.7 | |
| 7 | −174 | 8.8 × 10² | −276.5 | 21 | −30 | 3.2 | −238.6 |
| 8 | −60 | 1.0 × 101 | 22 | −28 | 3.0 | ||
| 9 | −79 | 2.2 × 101 | 23 | −36 | 4.1 | −236.9 | |
| 10 | −143 | 2.6 × 10² | 24 | −89 | 3.2 | ||
| 11 | −116 | 1.1 × 10² | −252.9 | 25 | −38 | 4.4 | |
| 12 | −60 | 1.0 × 101 | −224.8 | 26 | −6 | 1.3 | |
| 13 | −94 | 3.9 × 101 | 27 | −50 | 7.0 | ||
| 14 | −120 | 1.1 × 10² | −241.2 |
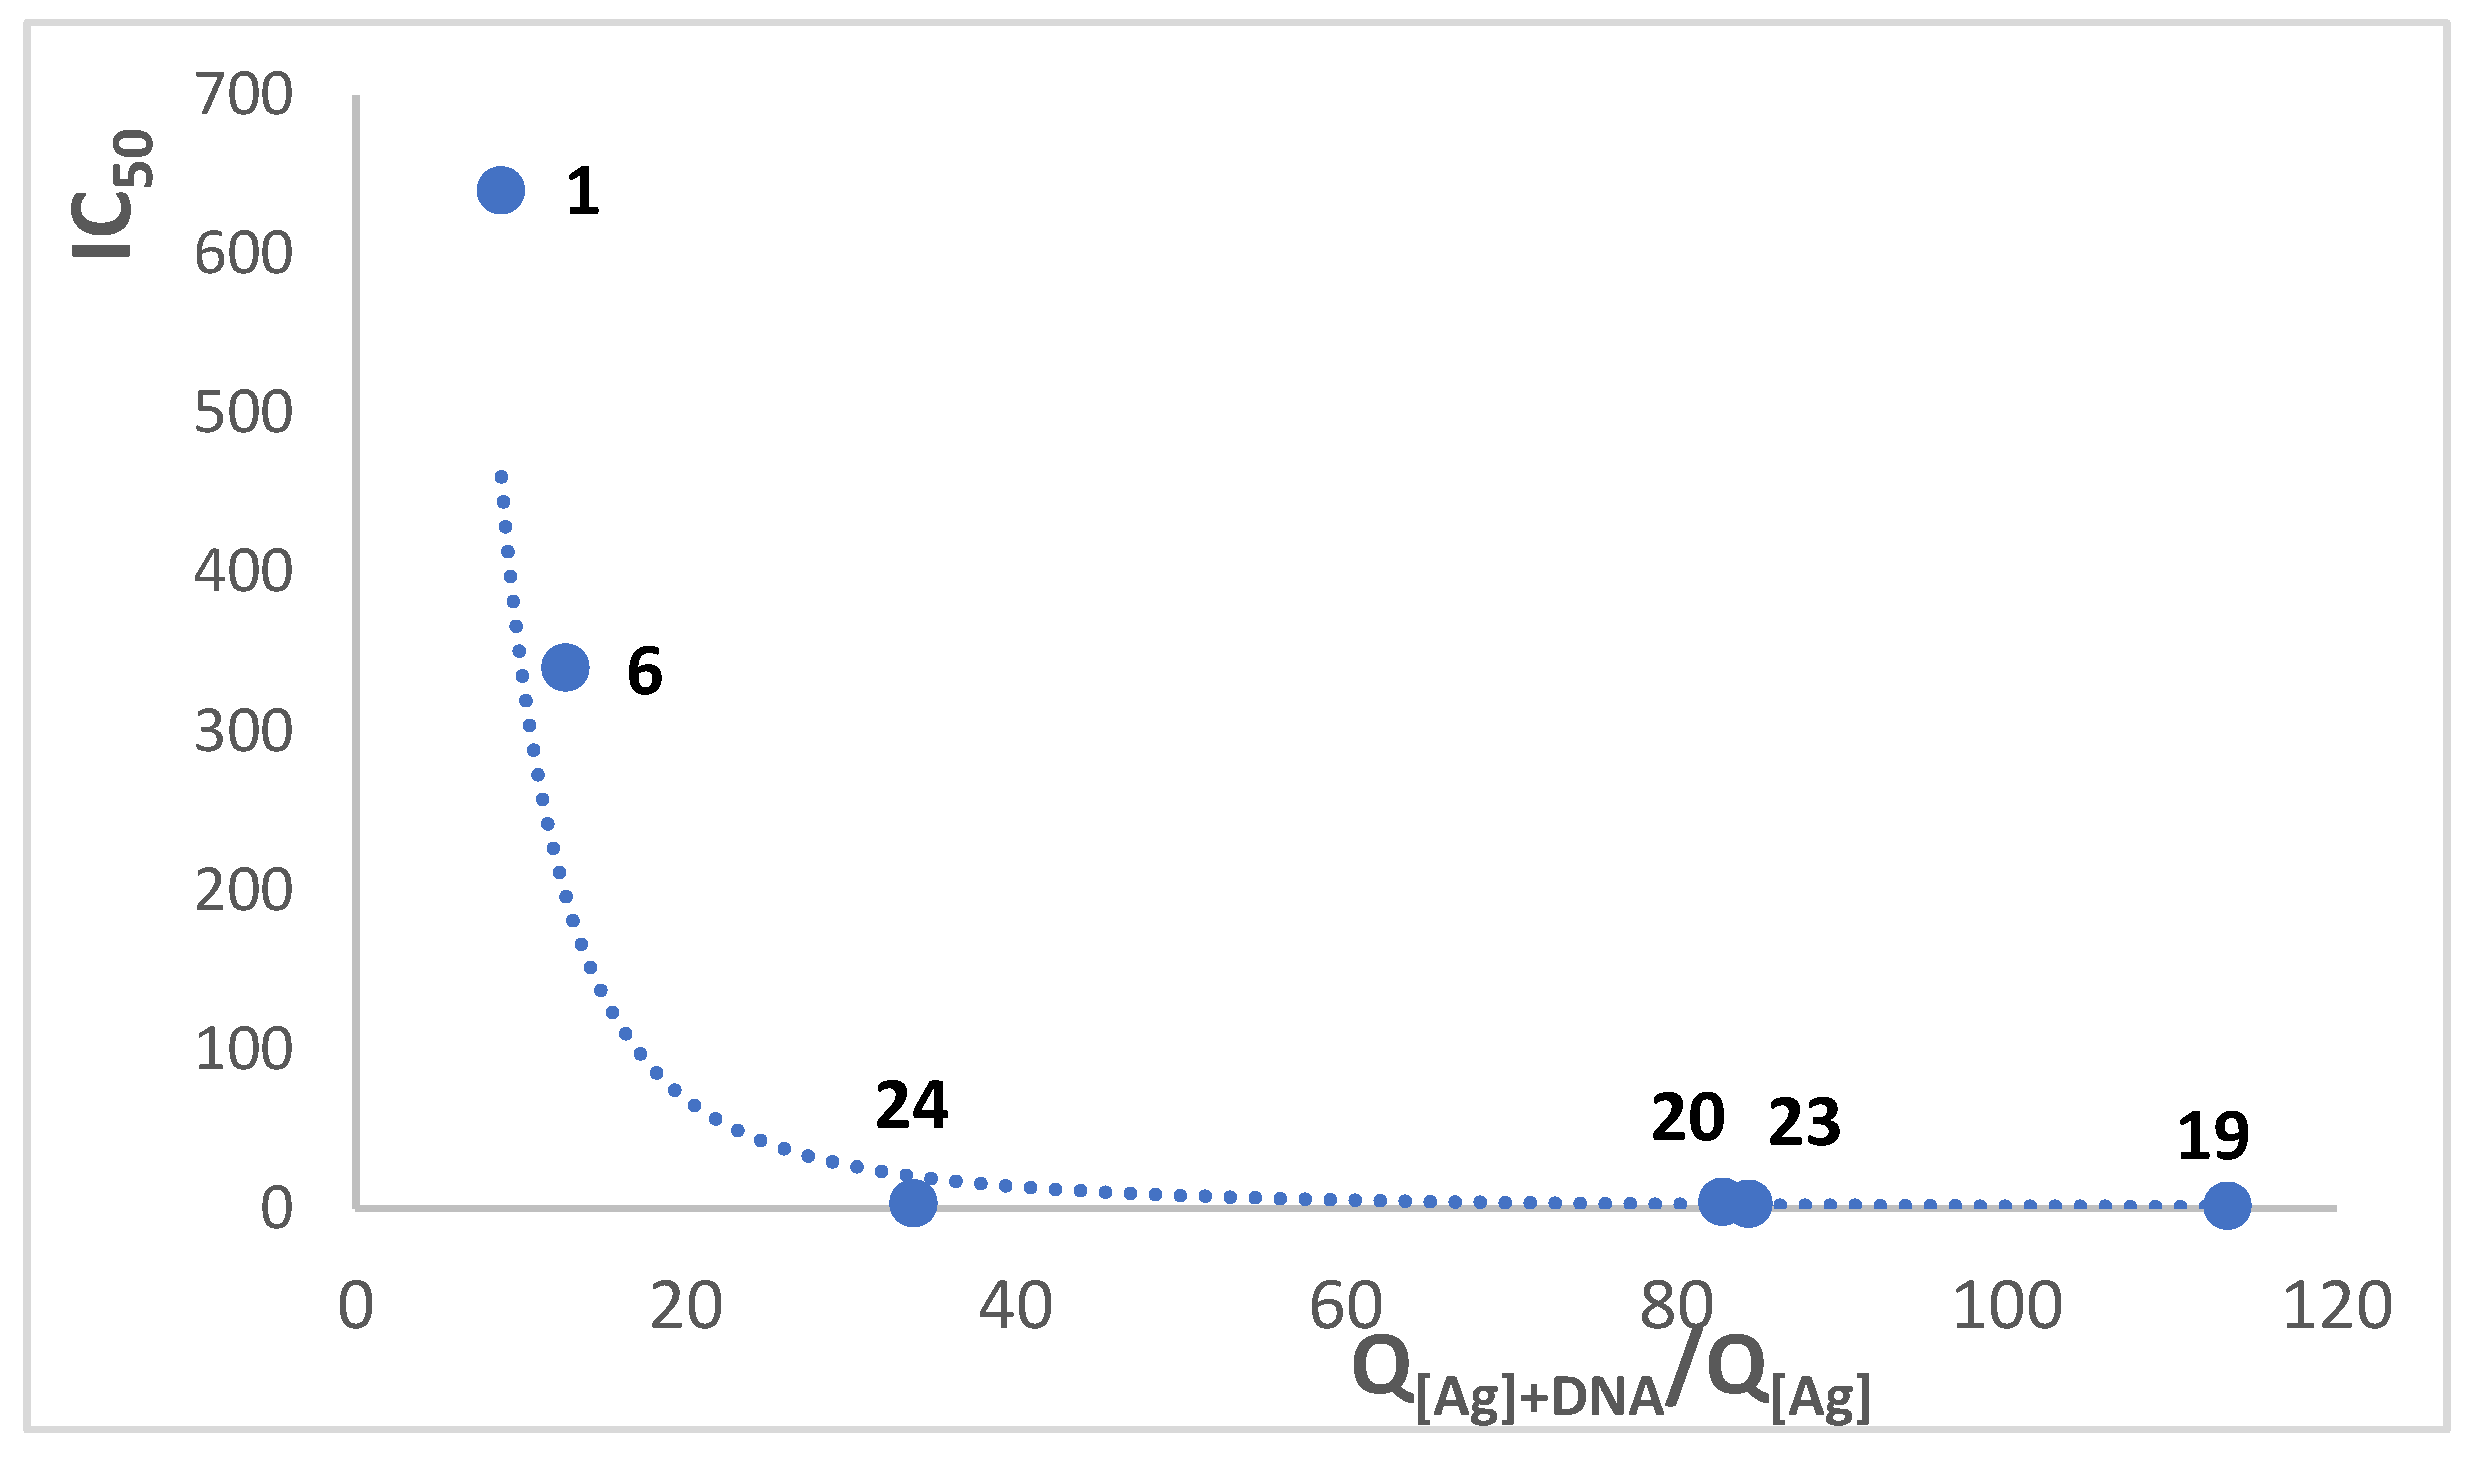
3.1. Correlation Between Potential and Reaction Coefficient
3.2. Docking Studies
3.3. Cytotoxic Activity Versus DNA Binding
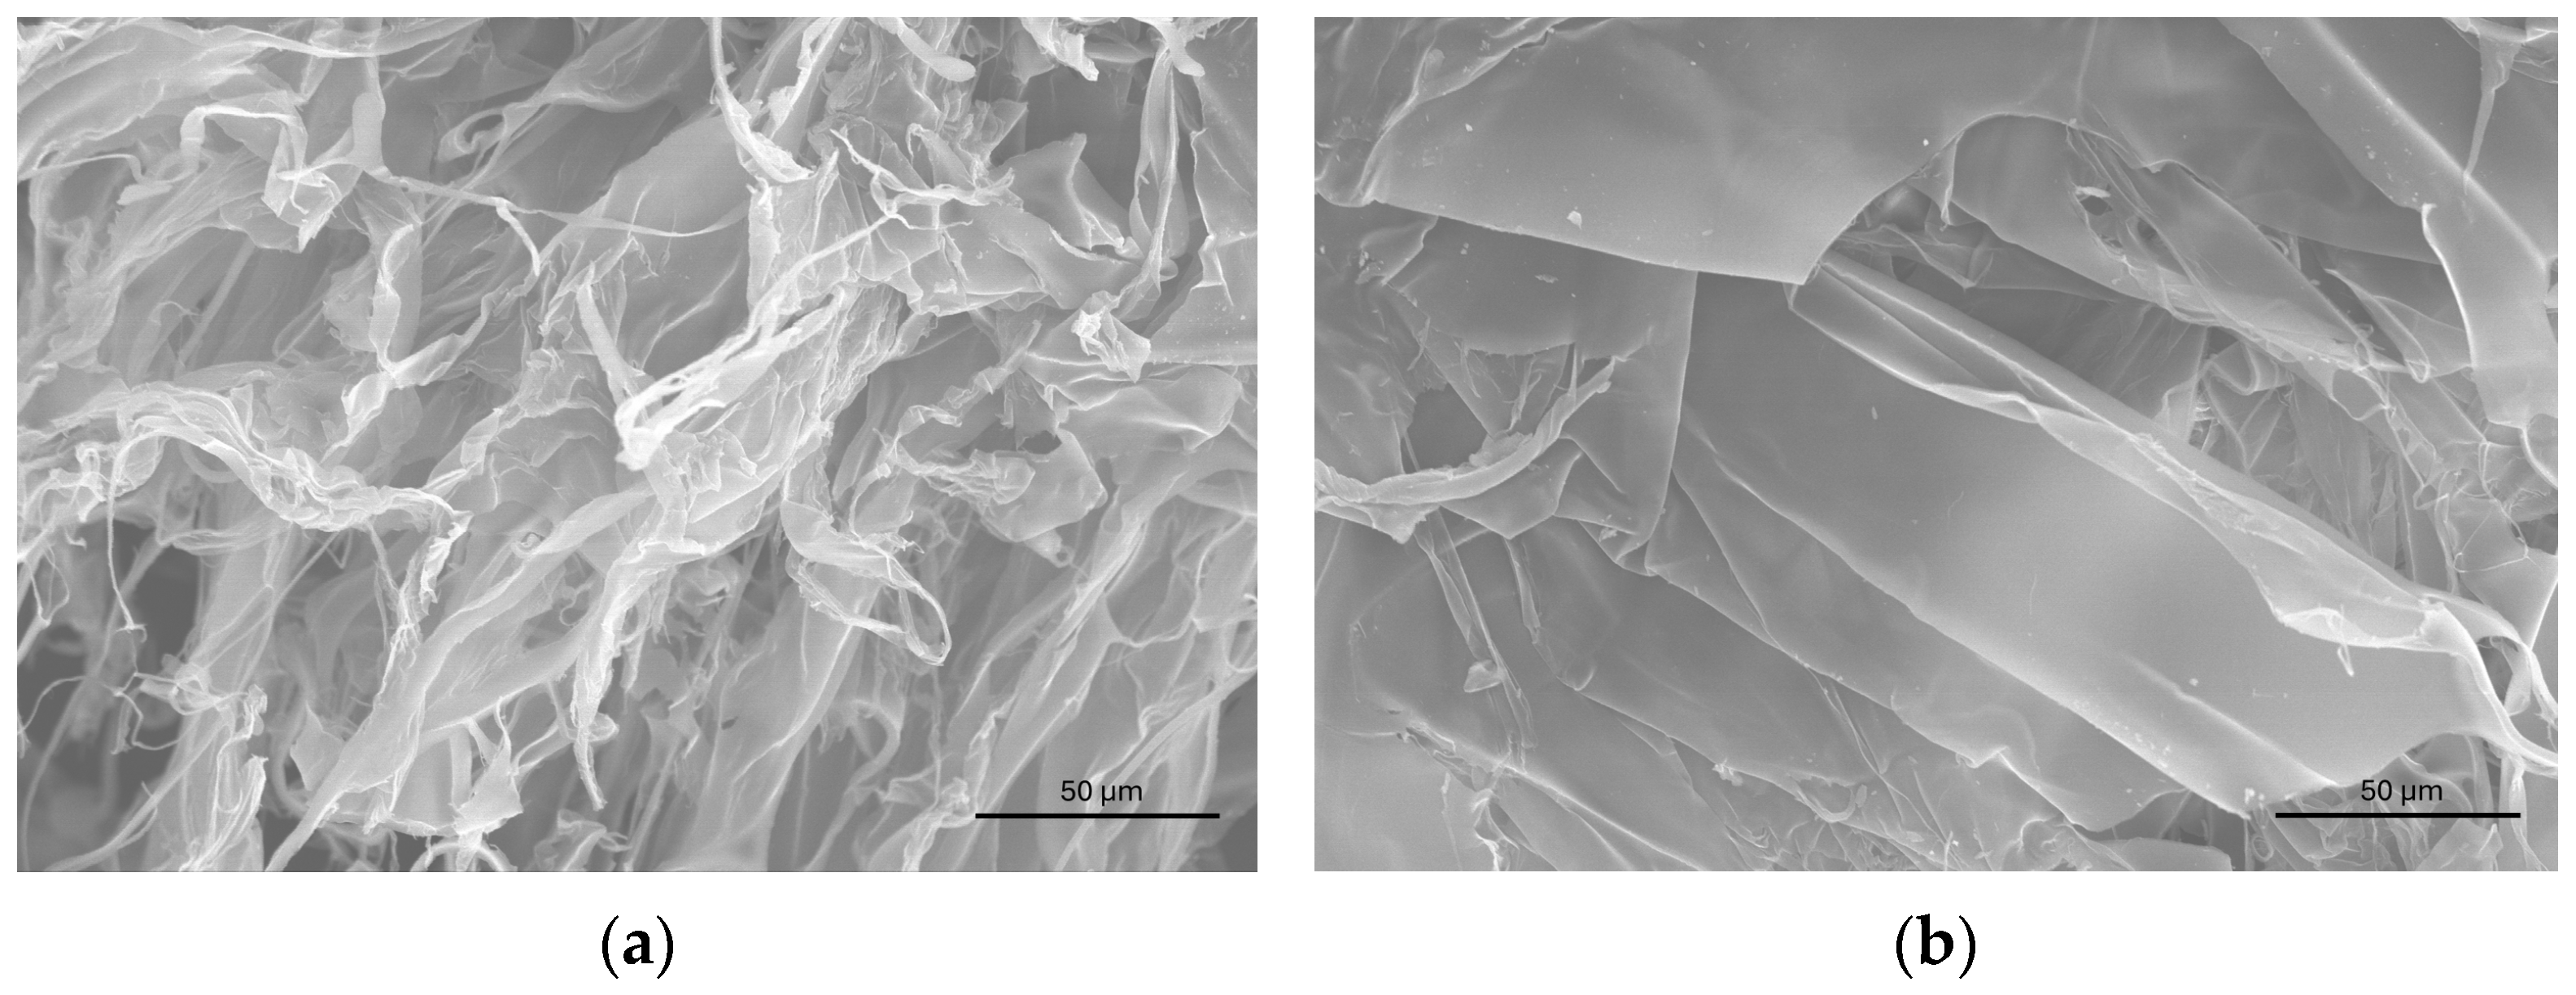
3.4. Morphology and Ag Content of the Products from Interaction with CT-DNA
4. Conclusions
5. Experimental Section
5.1. Synthesis
5.2. Cyclic Voltammetry Experiments
5.3. Cytotoxic Assays
5.4. Docking Calculations
Author Contributions
Funding
Institutional Review Board Statement
Informed Consent Statement
Data Availability Statement
Conflicts of Interest
References
- Huang, R.; Zhou, P.K. DNA damage repair: Historical perspectives, mechanistic pathways and clinical translation for targeted cancer therapy. Signal Transduct. Target. Ther. 2021, 6, 254. [Google Scholar] [CrossRef] [PubMed]
- Khan, H.Y.; Ansari, M.F.; Tabassum, S.; Arjmand, F. A review on the recent advances of interaction studies of anticancer metal-based drugs with therapeutic targets, DNA and RNAs. Drug. Discov. Today 2024, 29, 104055. [Google Scholar] [CrossRef] [PubMed]
- Pages, B.J.; Ang, D.L.; Wright, E.P.; Aldrich-Wright, J.R. Metal complex interactions with DNA. Dalton Trans. 2015, 44, 3505–3526. [Google Scholar] [CrossRef] [PubMed]
- Ndagi, U.; Mhlongo, N.; Soliman, M.E. Metal complexes in cancer therapy—An update from drug design perspective. Drug Des. Dev. Ther. 2017, 11, 599–616. [Google Scholar] [CrossRef]
- Rafique, S.; Idrees, M.; Nasim, A.; Akbar, H.; Athar, A. Transition metal complexes as potential therapeutic agents. Biotechnol. Mol. Biol. Rev. 2010, 5, 38–45. Available online: http://www.academicjournals.org/BMBR (accessed on 23 May 2025).
- Muhammad, N.; Guo, Z. Metal-based anticancer chemotherapeutic agents. Curr. Opin. Chem. Biol. 2014, 19, 144–153. [Google Scholar] [CrossRef]
- Dey, B.; Thukrl, S.; Krishnan, S.; Chakrobarty, M.; Gupta, S.; Manghani, C.; Rani, V. DNA–protein interactions: Methods for detection and analysis. Mol. Cell. Biochem. 2012, 365, 279–299. [Google Scholar] [CrossRef]
- Jungwirth, U.; Kowol, C.R.; Keppler, B.K.; Hartinger, C.G.; Berger, W.; Heffeter, P. Anticancer Activity of Metal Complexes: Involvement of Redox Processes. Antioxid. Redox Signal. 2011, 15, 1085–1127. [Google Scholar] [CrossRef]
- Rauf, S.; Gooding, J.J.; Akhtar, K.; Ghauri, M.A.; Rahman, M.; Anwar, M.A.; Khalid, A.M. Electrochemical approach of anticancer drugs–DNA interaction. J. Pharm. Biomed. Anal. 2005, 37, 205–217. [Google Scholar] [CrossRef]
- Qin, D.; Cai, X.-Q.; Miao, Q.; Wang, Z.-H.; Hu, M.-L. Cyclic Voltammetry and Molecular Docking Study of the Interactions of Two Derivatives of 5-fluorouracil with DNA. Int. J. Electrochem. Sci. 2014, 9, 1608–1620. [Google Scholar] [CrossRef]
- Arshad, N.; Farooqi, S.I. Cyclic Voltammetric DNA Binding Investigations on Some Anticancer Potential Metal Complexes: A Review. Appl. Biochem. Biotechnol. 2018, 186, 1090–1110. [Google Scholar] [CrossRef] [PubMed]
- Chylewska, A.; Biedulska, M.; Makowski, M. Multi-analytical studies about physico-chemical properties of Ni(II)-vitamin B6 coordination compounds and their CT-DNA interactions. J. Mol. Liq. 2017, 243, 771–780. [Google Scholar] [CrossRef]
- Arjmand, F.; Aziz, M.; Tabassum, S. Cyclic Voltammetry-An Electrochemical Approach to Study Metal-based Potential Antitumor Drug-DNA Interaction. Curr. Anal. Chem. 2011, 7, 71–79. [Google Scholar] [CrossRef]
- Carter, M.T.; Rodriguez, M.; Bard, A.J. Voltametric studies of the interaction of metal chelates with DNA. 2. Tris-chelated complexes of cobalt(III) and iron(II) with 1,10-phenanthroline and 2,2′-bipyridine. J. Am. Chem. Soc. 1989, 111, 8901–8911. [Google Scholar] [CrossRef]
- Kumar, A.; Vashistha, V.K.; Tevatia, P.; Singh, R. Electrochemical studies of DNA interaction and antimicrobial activities of MnII, FeIII, CoII and NiII Schiff base tetraazamacrocyclic complexes. Spectrochim. Acta Part A Mol. Biomol. Spectrosc. 2017, 176, 123–133. [Google Scholar] [CrossRef]
- Ramotowska, S.; Ciesielska, A.; Makowski, M. What Can Electrochemical Methods Offer in Determining DNA–Drug Interactions? Molecules 2021, 26, 3478. [Google Scholar] [CrossRef]
- García-Ramos, J.C.; Galindo-Murillo, R.; Cortés-Guzmán, F.; Ruiz-Azuara, L. Metal-Based Drug-DNA Interactions. J. Mex. Chem. Soc. 2013, 57, 245–259. [Google Scholar] [CrossRef]
- Liu, H.-K.; Sadler, P.J. Metal complexes as DNA intercalators. Acc. Chem. Res. 2011, 44, 349–359. [Google Scholar] [CrossRef]
- Costa, J.P.; Pinheiro, T.; Martins, M.S.; Carvalho, M.F.N.N.; Feliciano, J.R.; Leitão, J.H.; Silva, R.A.L.; Guerreiro, J.F.; Alves, L.M.C.; Custódio, I.; et al. Tuning the Biological Activity of Camphorimine Complexes through Metal Selection. Antibiotics 2022, 11, 1010. [Google Scholar] [CrossRef]
- Carvalho, M.F.N.N.; Leite, S.; Costa, J.P.; Galvão, A.M.; Leitão, J.H. Ag(I) camphor complexes: Antimicrobial activity by design. J. Inorg. Biochem. 2019, 199, 110791. [Google Scholar] [CrossRef]
- Costa, J.P.; Sousa, S.A.; Galvão, A.M.; Mata, J.M.; Leitão, J.H.; Carvalho, M.F.N.N. Key Parameters on the Antibacterial Activity of Silver Camphor Complexes. Antibiotics 2021, 10, 135. [Google Scholar] [CrossRef] [PubMed]
- Li, Z.; Zilberman, Y.; Lu, Q.B.; Tang, X.S. Electrochemical Methods for Probing DNA Damage Mechanisms and Designing Cisplatin-Based Combination Chemotherapy. BioTechniques 2019, 66, 135–142. [Google Scholar] [CrossRef] [PubMed]
- Liu, J.; Zhang, T.; Lu, T.; Qu, L.; Zhou, H.; Zhang, Q.; Li, L. DNA-binding and cleavage studies of macrocyclic copper(II) complexes. J. Inorg. Biochem. 2002, 91, 269–276. [Google Scholar] [CrossRef]
- Kurbanoglu, S.; Dogan-Topala, B.; Hlavata, L.; Labuda, J.; Ozkana, S.A.; Uslu, B. Electrochemical investigation of an interaction of the antidepressant drug aripiprazole with original and damaged calf thymus dsDNA. Electrochim. Acta 2015, 169, 233–240. [Google Scholar] [CrossRef]
- Białobrzeska, W.; Niedziałkowski, P.; Malinowska, N.; Cebula, Z.; Ossowski, T. Analysis of interactions between calf thymus DNA and 1,5-di(piperazin 1-yl)anthracene-9,10-dione using spectroscopic and electrochemical methods. J. Mol. Liq. 2019, 289, 111080. [Google Scholar] [CrossRef]
- Helen, M.B.; Westbrook, J.; Feng, Z.; Gilliland, G.; Bhat, T.N.; Weissig, H.; Shindyalov, I.N.; Bourne, E. The Protein Data Bank. Nucleic Acids Res. 2000, 28, 235–242. [Google Scholar]
- Ritchie, D. High-order analytic translation matrix elements for real-space six-dimensional polar Fourier correlations. J. Appl. Crystallogr. 2005, 38, 808–818. [Google Scholar] [CrossRef]
- Mustard, D.; Ritchie, D.W. Docking essential dynamics eigenstructures. Proteins 2005, 60, 269–274. [Google Scholar] [CrossRef]
- Cardoso, J.M.S.; Correia, I.; Galvão, A.M.; Marques, F.; Carvalho, M.F.N.N. Synthesis of Ag(I) camphor sulphonylimine complexes and assessment of their cytotoxic properties against cisplatin-resistant A2780cisR and A2780 cell lines. J. Inorg. Biochem. 2017, 166, 55–63. [Google Scholar] [CrossRef]
- Costa, J.P.; Pinheiro, M.J.F.; Sousa, S.A.; Rego, A.M.B.; Marques, F.; Oliveira, M.C.; Leitão, J.H.; Mira, N.P.; Carvalho, M.F.N.N. Antimicrobial Activity of Silver Camphorimine Complexes against Candida Strains. Antibiotics 2019, 8, 144. [Google Scholar] [CrossRef]
- Costa, J.P.; Carvalho, M.F.N.N.; Galvão, A.M. Camphor Sulfonimine Compounds: Bottom-up Design of MOFs from Organic Frameworks Based on X-rays and DFT-D3. Crystals 2023, 13, 1499. [Google Scholar] [CrossRef]
- Halgren, T.A. MMFF VI. MMFF94s option for energy minimization studies. J. Comput. Chem. 1999, 20, 720–729. [Google Scholar] [CrossRef]
- Halgren, T.A. Merck molecular force field. I. Basis, form, scope, parameterization, and performance of MMFF94. J. Comput. Chem. 1996, 17, 490–519. [Google Scholar] [CrossRef]
- Adasme, M.F.; Linnemann, K.L.; Bolz, S.N.; Kaiser, F.; Salentin, S.; Haupt, V.J.; Schroeder, M. PLIP 2021: Expanding the scope of the protein–ligand interaction profiler to DNA and RNA. Nucleic Acids Res. 2021, 49, W530–W534. [Google Scholar] [CrossRef]
- The PyMOL Molecular Graphics System; Version 2.0; Schrödinger, LLC: New York, NY, USA, 2015.
- Gowers, R.J.; Linke, M.; Barnoud, J.; Reddy, T.J.E.; Melo, M.N.; Seyler, S.L.; Domanski, J.; Dotson, D.L.; Buchoux, S.; Kenney, I.M.; et al. MDAnalysis: A Python Package for the Rapid Analysis of Molecular Dynamics Simulations. In Proceedings of the 15th Python in Science Conference (SCIPY 2016), Austin, TX, USA, 11–17 July 2016; Los Alamos National Laboratory (LANL): Los Alamos, NM, USA, 2019. [Google Scholar]
- Michaud-Agrawal, N.; Denning, E.J.; Woolf, T.B.; Beckstein, O. MDAnalysis: A toolkit for the analysis of molecular dynamics simulations. J. Comput. Chem. 2011, 32, 2319–2327. [Google Scholar] [CrossRef]


| IC50 (µM) | Q[Ag]+DNA/Q[Ag] | E d kcal/mol | |||||
|---|---|---|---|---|---|---|---|
| Complex | HOS | SI a | A2780 | A2780cisR c | HDF | ||
| 1 | 8.8 ± 2.5b | 2.1 | 3.53 ± 0.90 b | 18.1 ± 4.8 | 6.4 × 10² | −252.1 | |
| 6 | 12.7 ± 4.5b | 1.4 | 17.4 ± 3.6 | 3.4 × 10² | −280.7 | ||
| 11 | 3.1 ± 0.9a | 2.7 | 8.5 ± 2.7 | 1.1 × 10² | −252.9 | ||
| 12 | 1.11 ± 0.26 c | 1.17 ± 0.22 | 1.0 × 101 | −224.8 | |||
| 14 | 8.29 ± 2.0b | 3.9 | 0.76 ± 0.29 c | 0.51 ± 0.10 | 32.3 ± 8.7 | 1.1 × 10² | −241.2 |
| 16 | 0.65 ± 0.17 c | 0.67 ± 0.19 | 1.0 × 101 | −277.6 | |||
| 19 | 113.4 ± 16.3 | 10.4 ± 2.9 | 1.7 | −219.8 | |||
| 20 | 84.4 ± 25.6 | 0.9 | 76.9 ± 14.3 | 3.0 | |||
| 21 | 6.7 ± 2.8 | 1.6 | 10.6 ± 3.5 | 3.2 | 238.6 | ||
| 23 | 82.8 ± 15.1 | 1.0 | 82.4 ± 13.5 | 4.1 | −236.9 | ||
| 24 | 33.8 ± 13.4 | 0.9 | 0.66 ± 0.28 b | 30.6 ± 8.5 | 3.2 | ||
Disclaimer/Publisher’s Note: The statements, opinions and data contained in all publications are solely those of the individual author(s) and contributor(s) and not of MDPI and/or the editor(s). MDPI and/or the editor(s) disclaim responsibility for any injury to people or property resulting from any ideas, methods, instructions or products referred to in the content. |
© 2025 by the authors. Licensee MDPI, Basel, Switzerland. This article is an open access article distributed under the terms and conditions of the Creative Commons Attribution (CC BY) license (https://creativecommons.org/licenses/by/4.0/).
Share and Cite
Costa, J.P.; Justino, G.C.; Marques, F.; Carvalho, M.F.N.N. Insights into the Silver Camphorimine Complexes Interactions with DNA Based on Cyclic Voltammetry and Docking Studies. Molecules 2025, 30, 2817. https://doi.org/10.3390/molecules30132817
Costa JP, Justino GC, Marques F, Carvalho MFNN. Insights into the Silver Camphorimine Complexes Interactions with DNA Based on Cyclic Voltammetry and Docking Studies. Molecules. 2025; 30(13):2817. https://doi.org/10.3390/molecules30132817
Chicago/Turabian StyleCosta, Joana P., Gonçalo C. Justino, Fernanda Marques, and M. Fernanda N. N. Carvalho. 2025. "Insights into the Silver Camphorimine Complexes Interactions with DNA Based on Cyclic Voltammetry and Docking Studies" Molecules 30, no. 13: 2817. https://doi.org/10.3390/molecules30132817
APA StyleCosta, J. P., Justino, G. C., Marques, F., & Carvalho, M. F. N. N. (2025). Insights into the Silver Camphorimine Complexes Interactions with DNA Based on Cyclic Voltammetry and Docking Studies. Molecules, 30(13), 2817. https://doi.org/10.3390/molecules30132817