

The Interplay of Inter- and Intramolecular Hydrogen Bonding in Ether Alcohols Related to n-Octanol


Abstract

1. Introduction
2. Computational Methods
2.1. Simulation Details
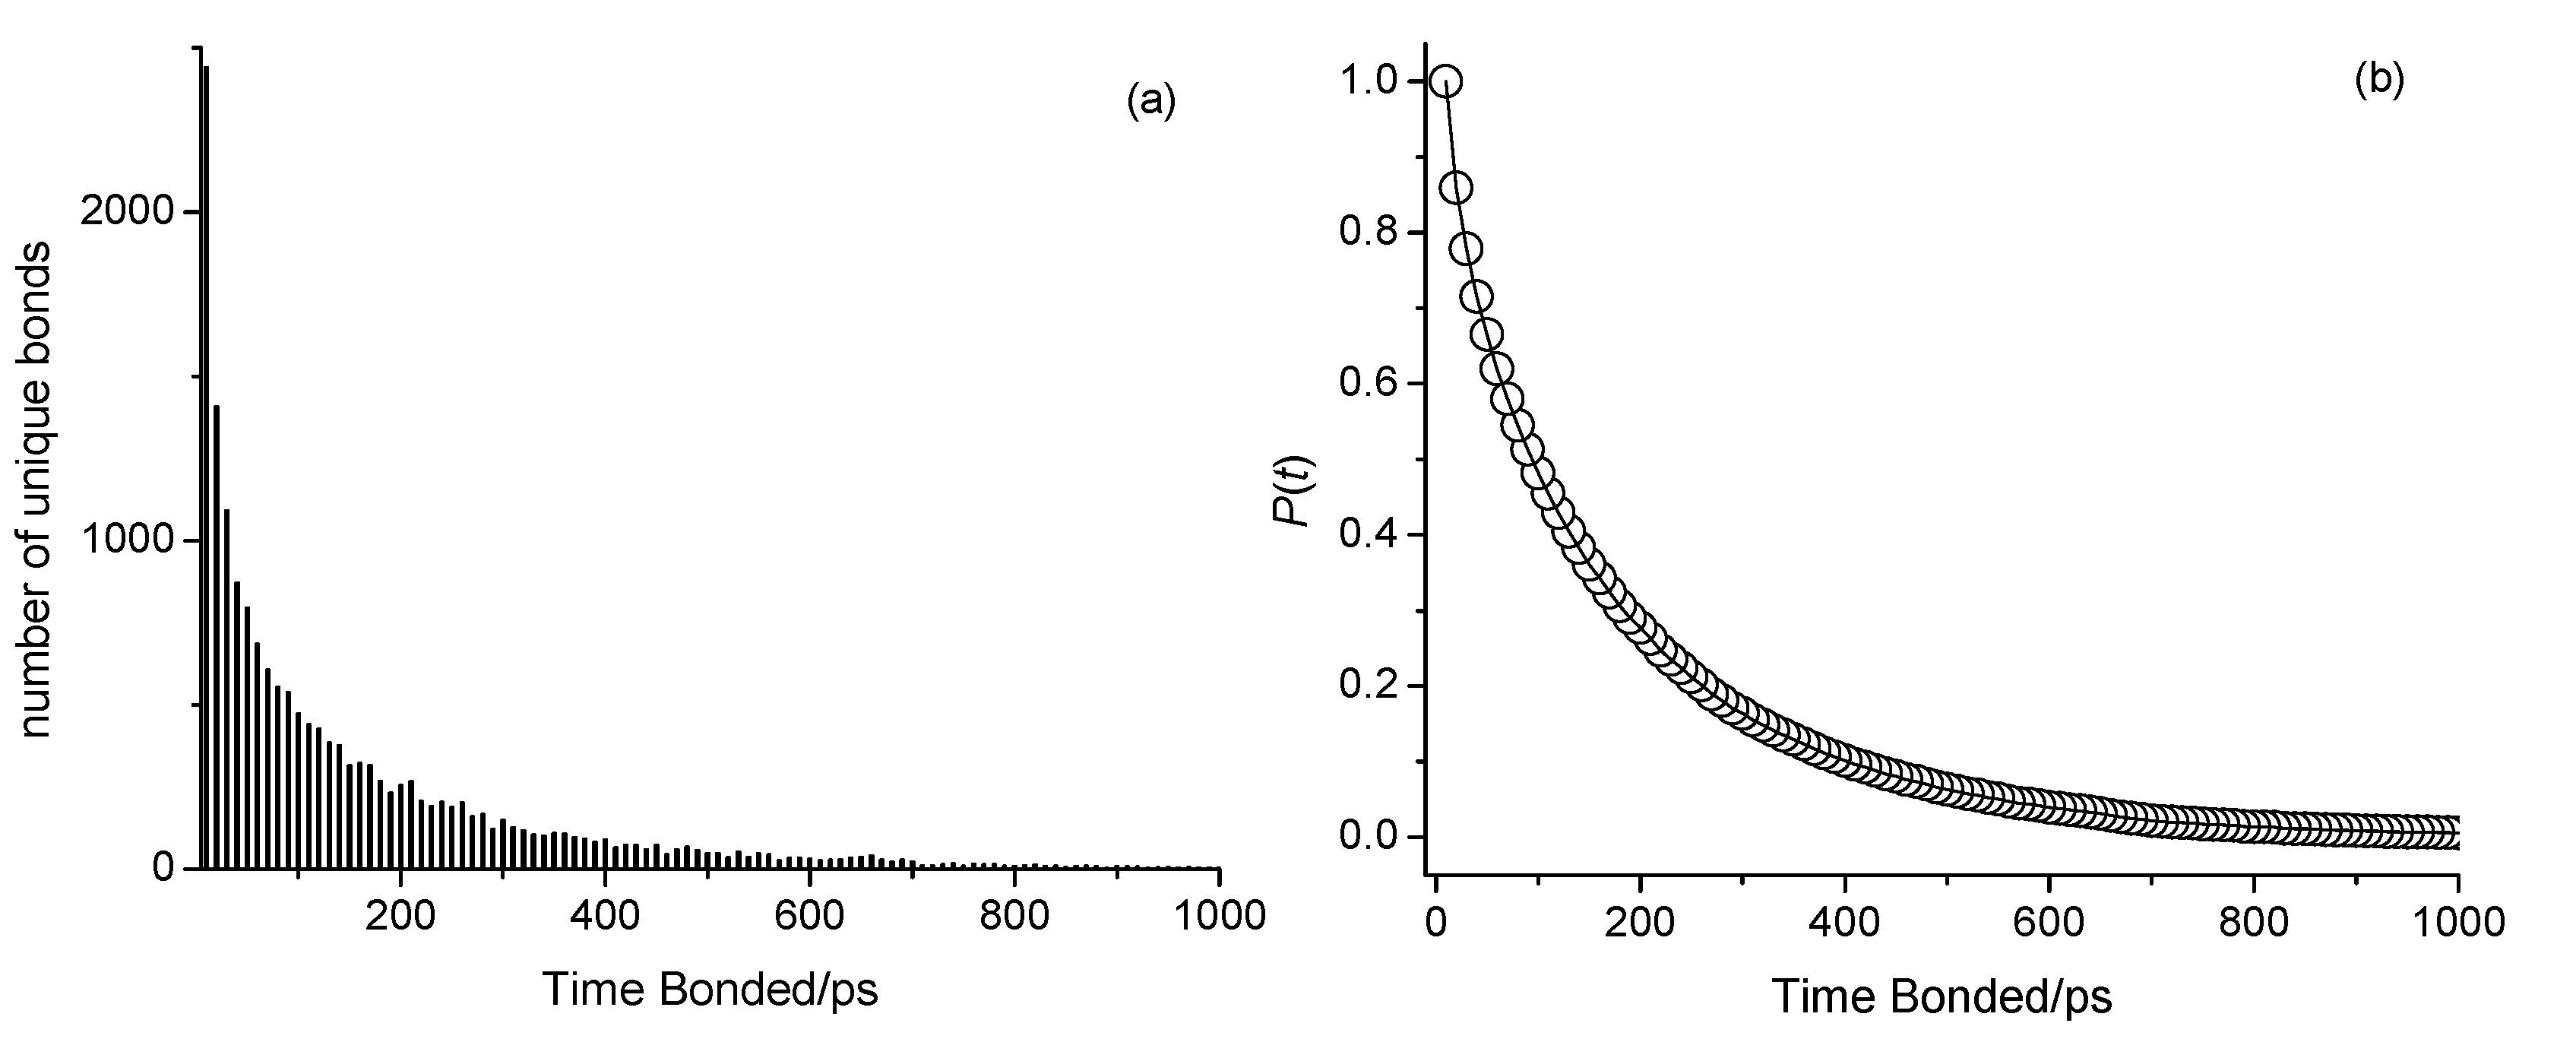
2.2. Analysis
3. Results and Discussion
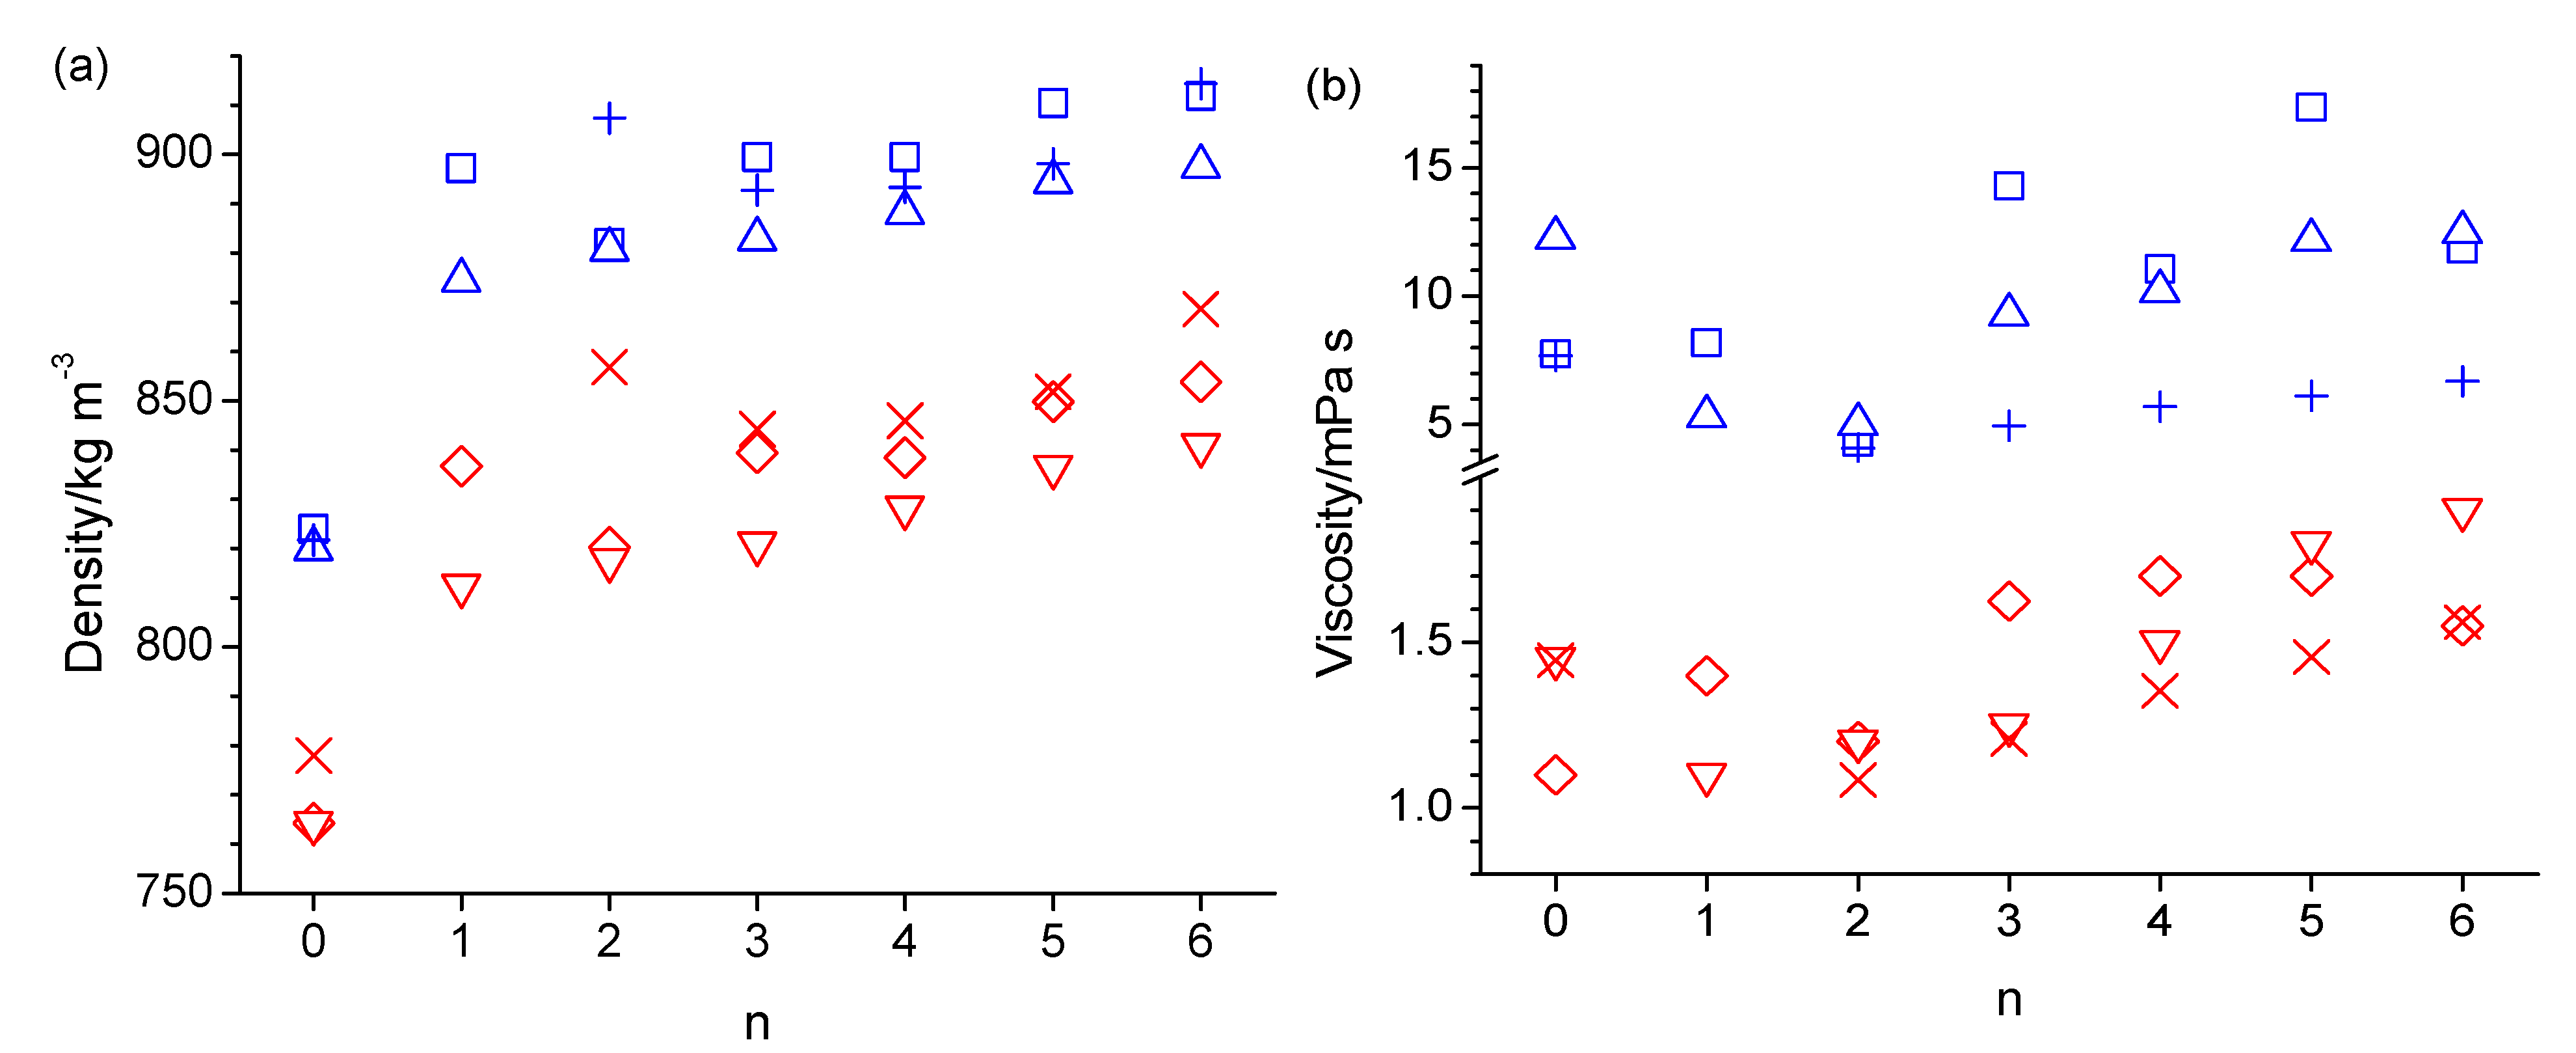
3.1. Comparison of Simulated and Experimental Properties
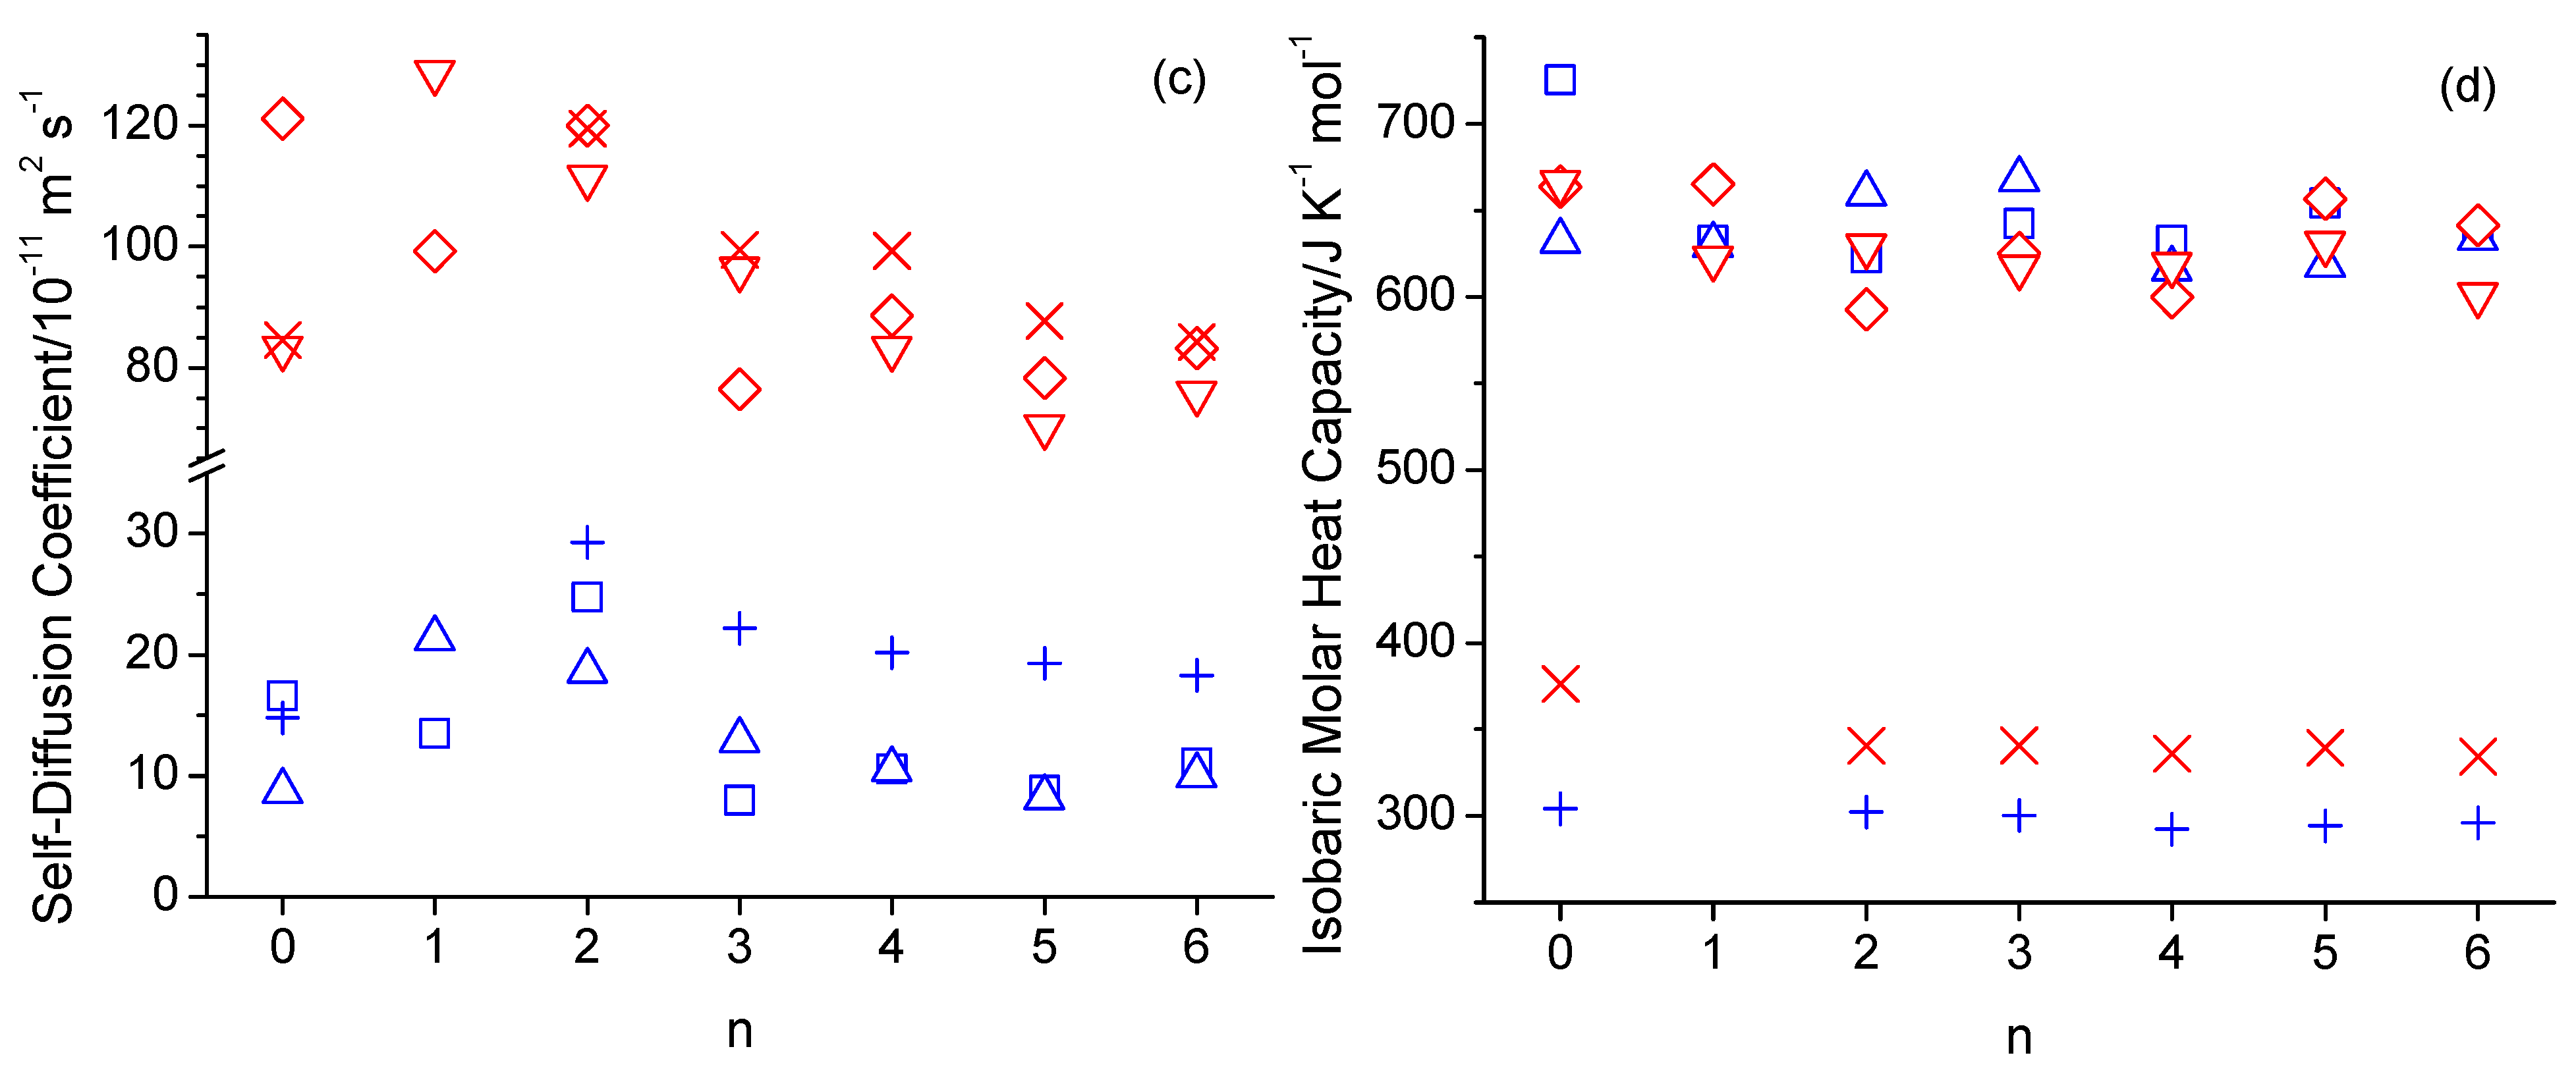
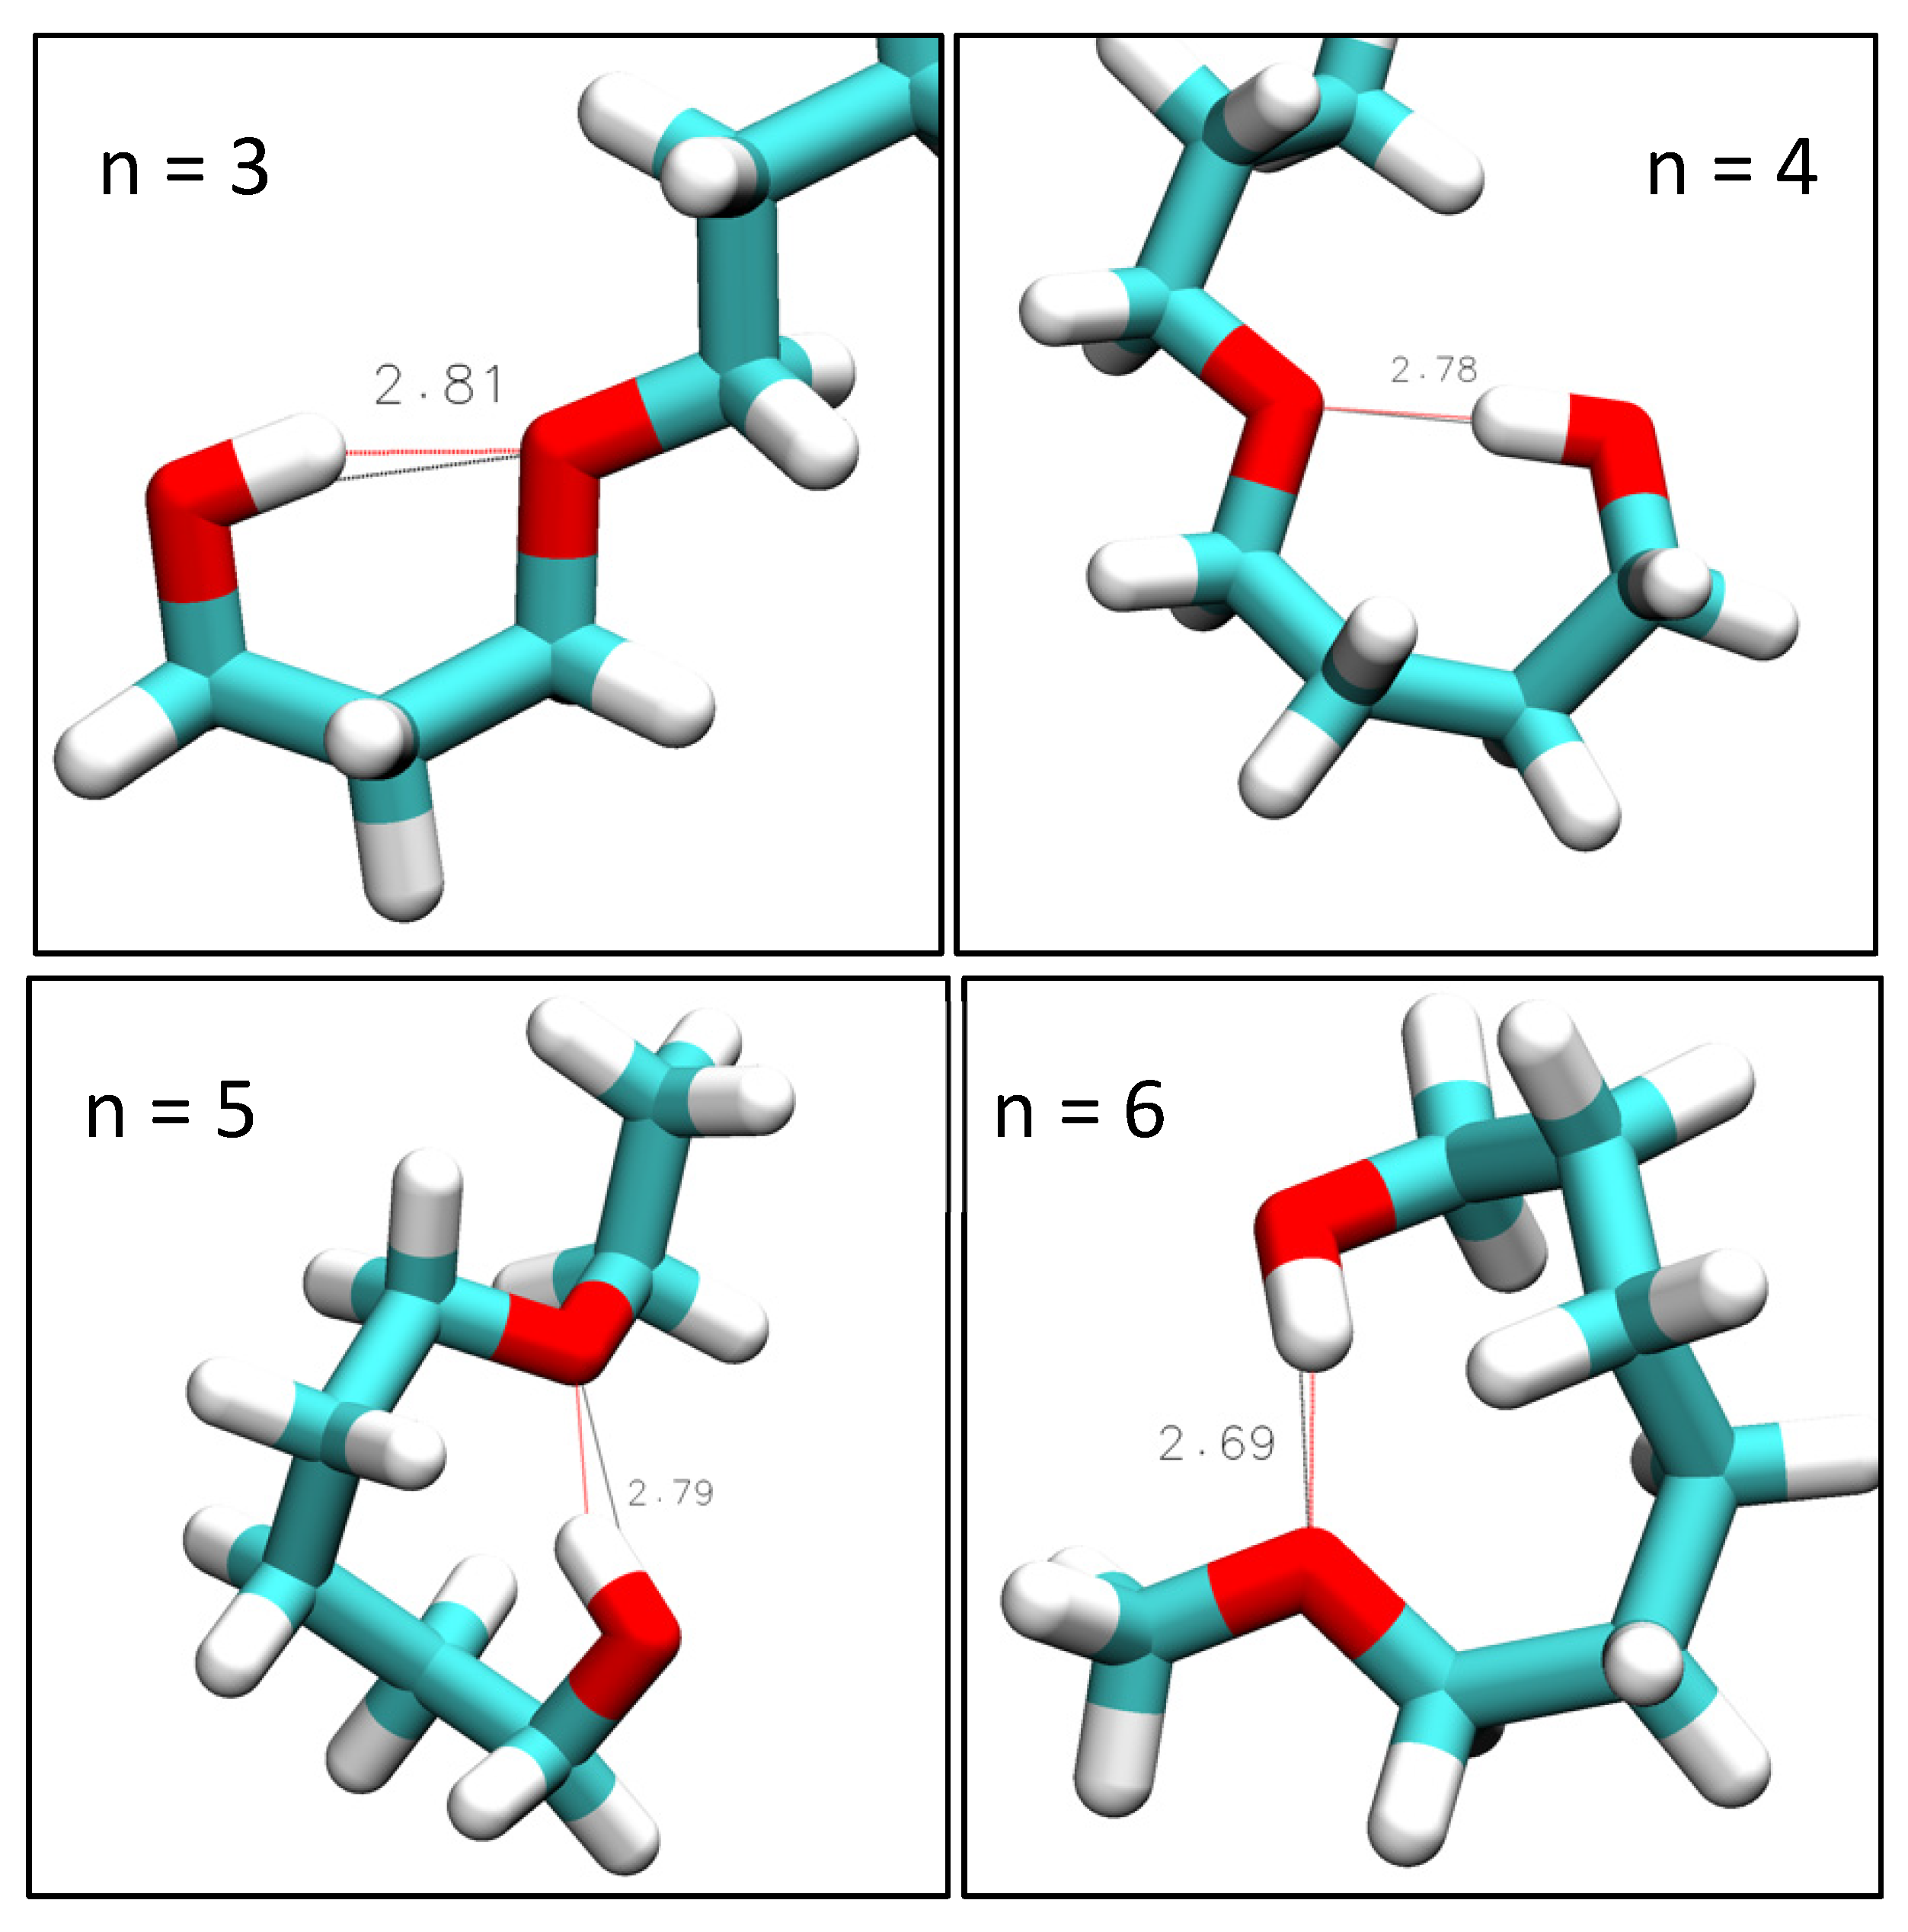
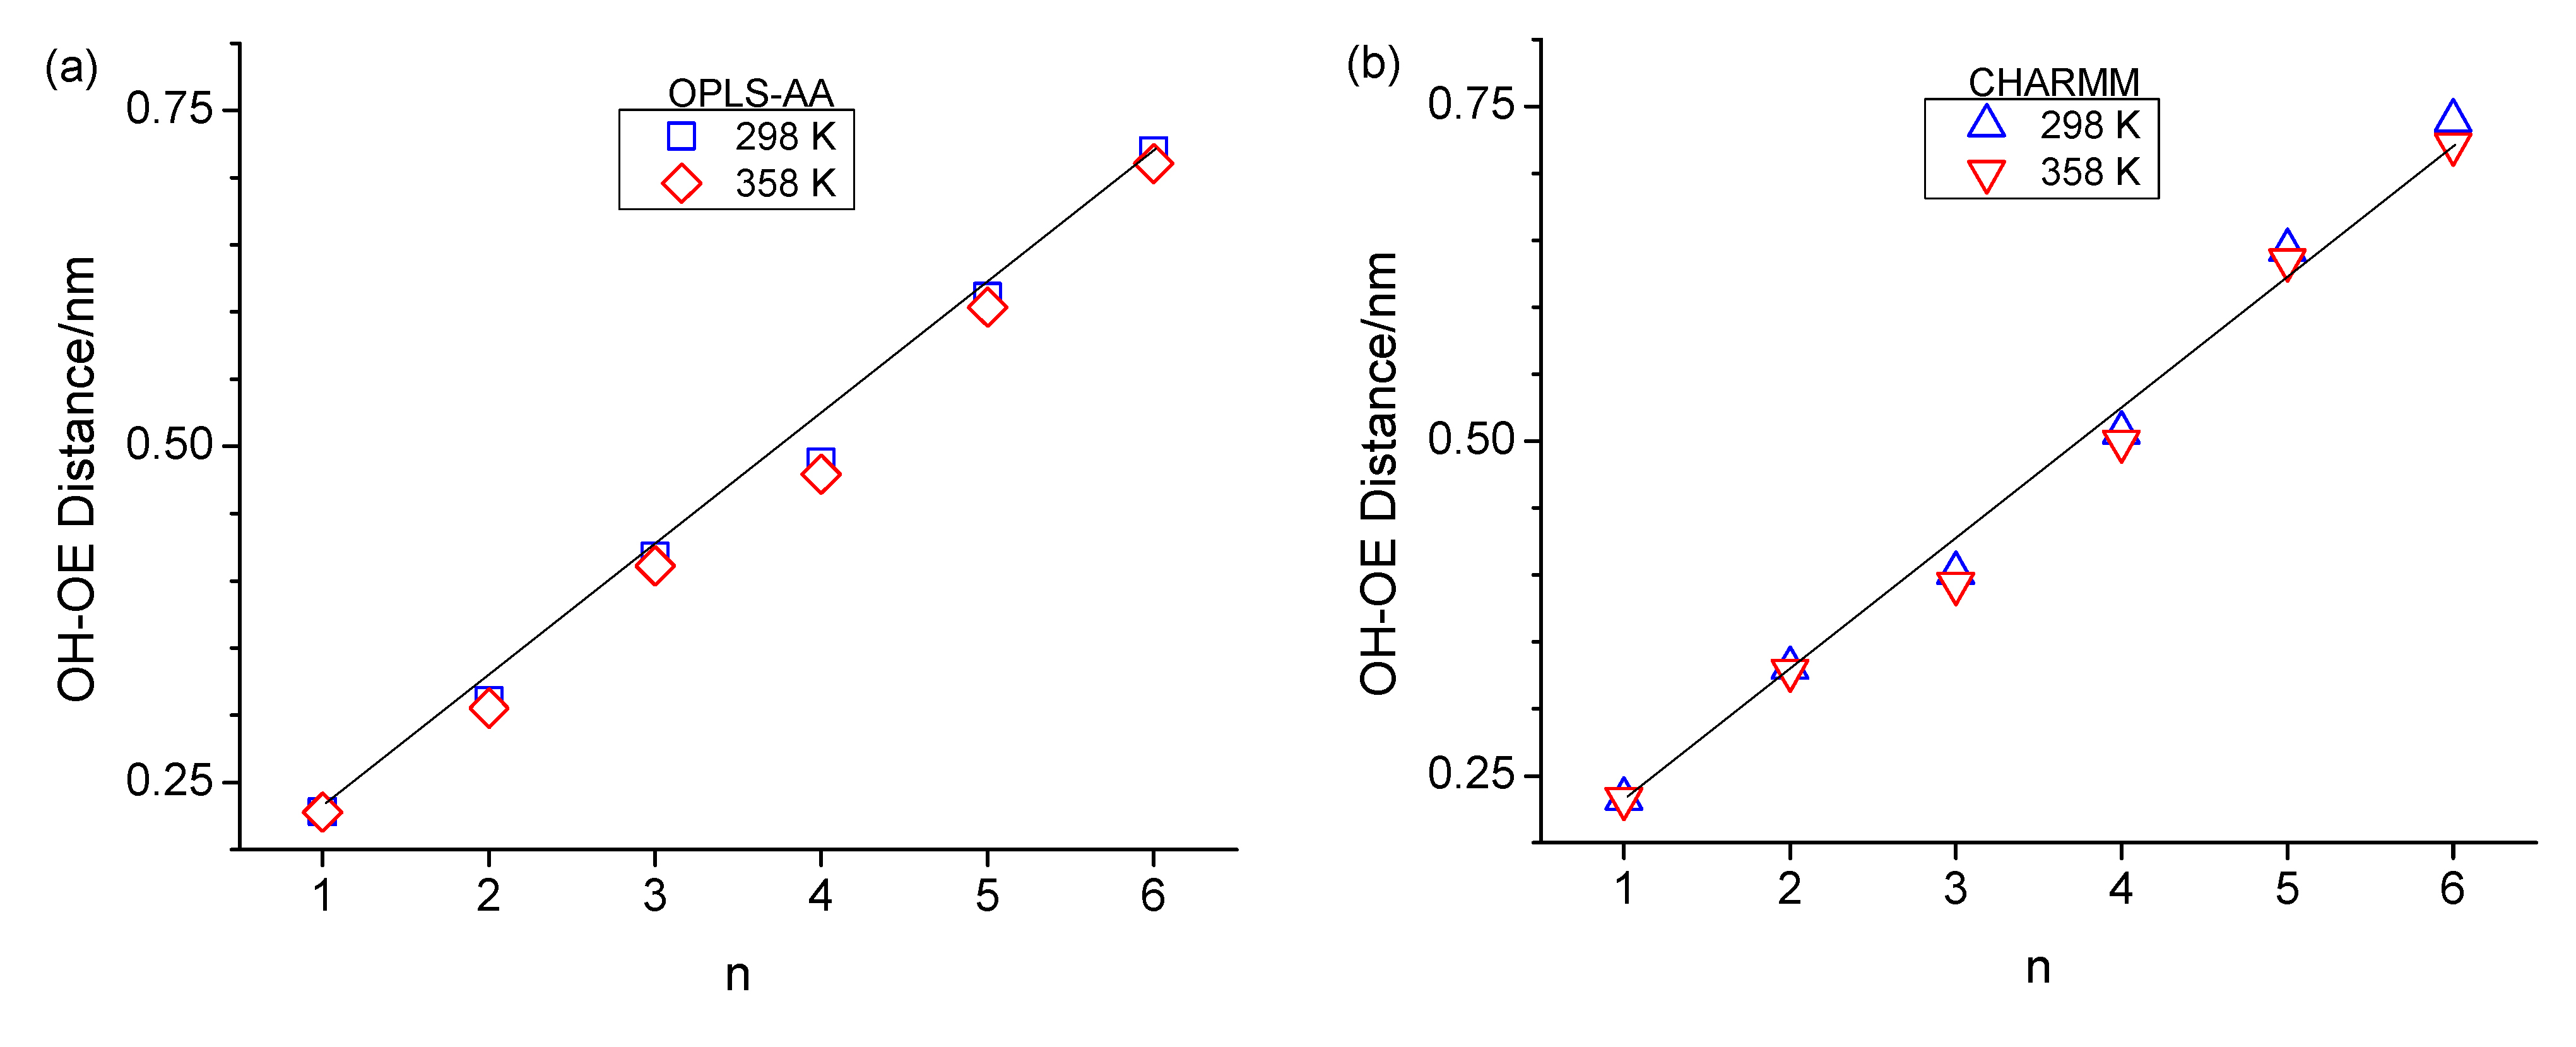
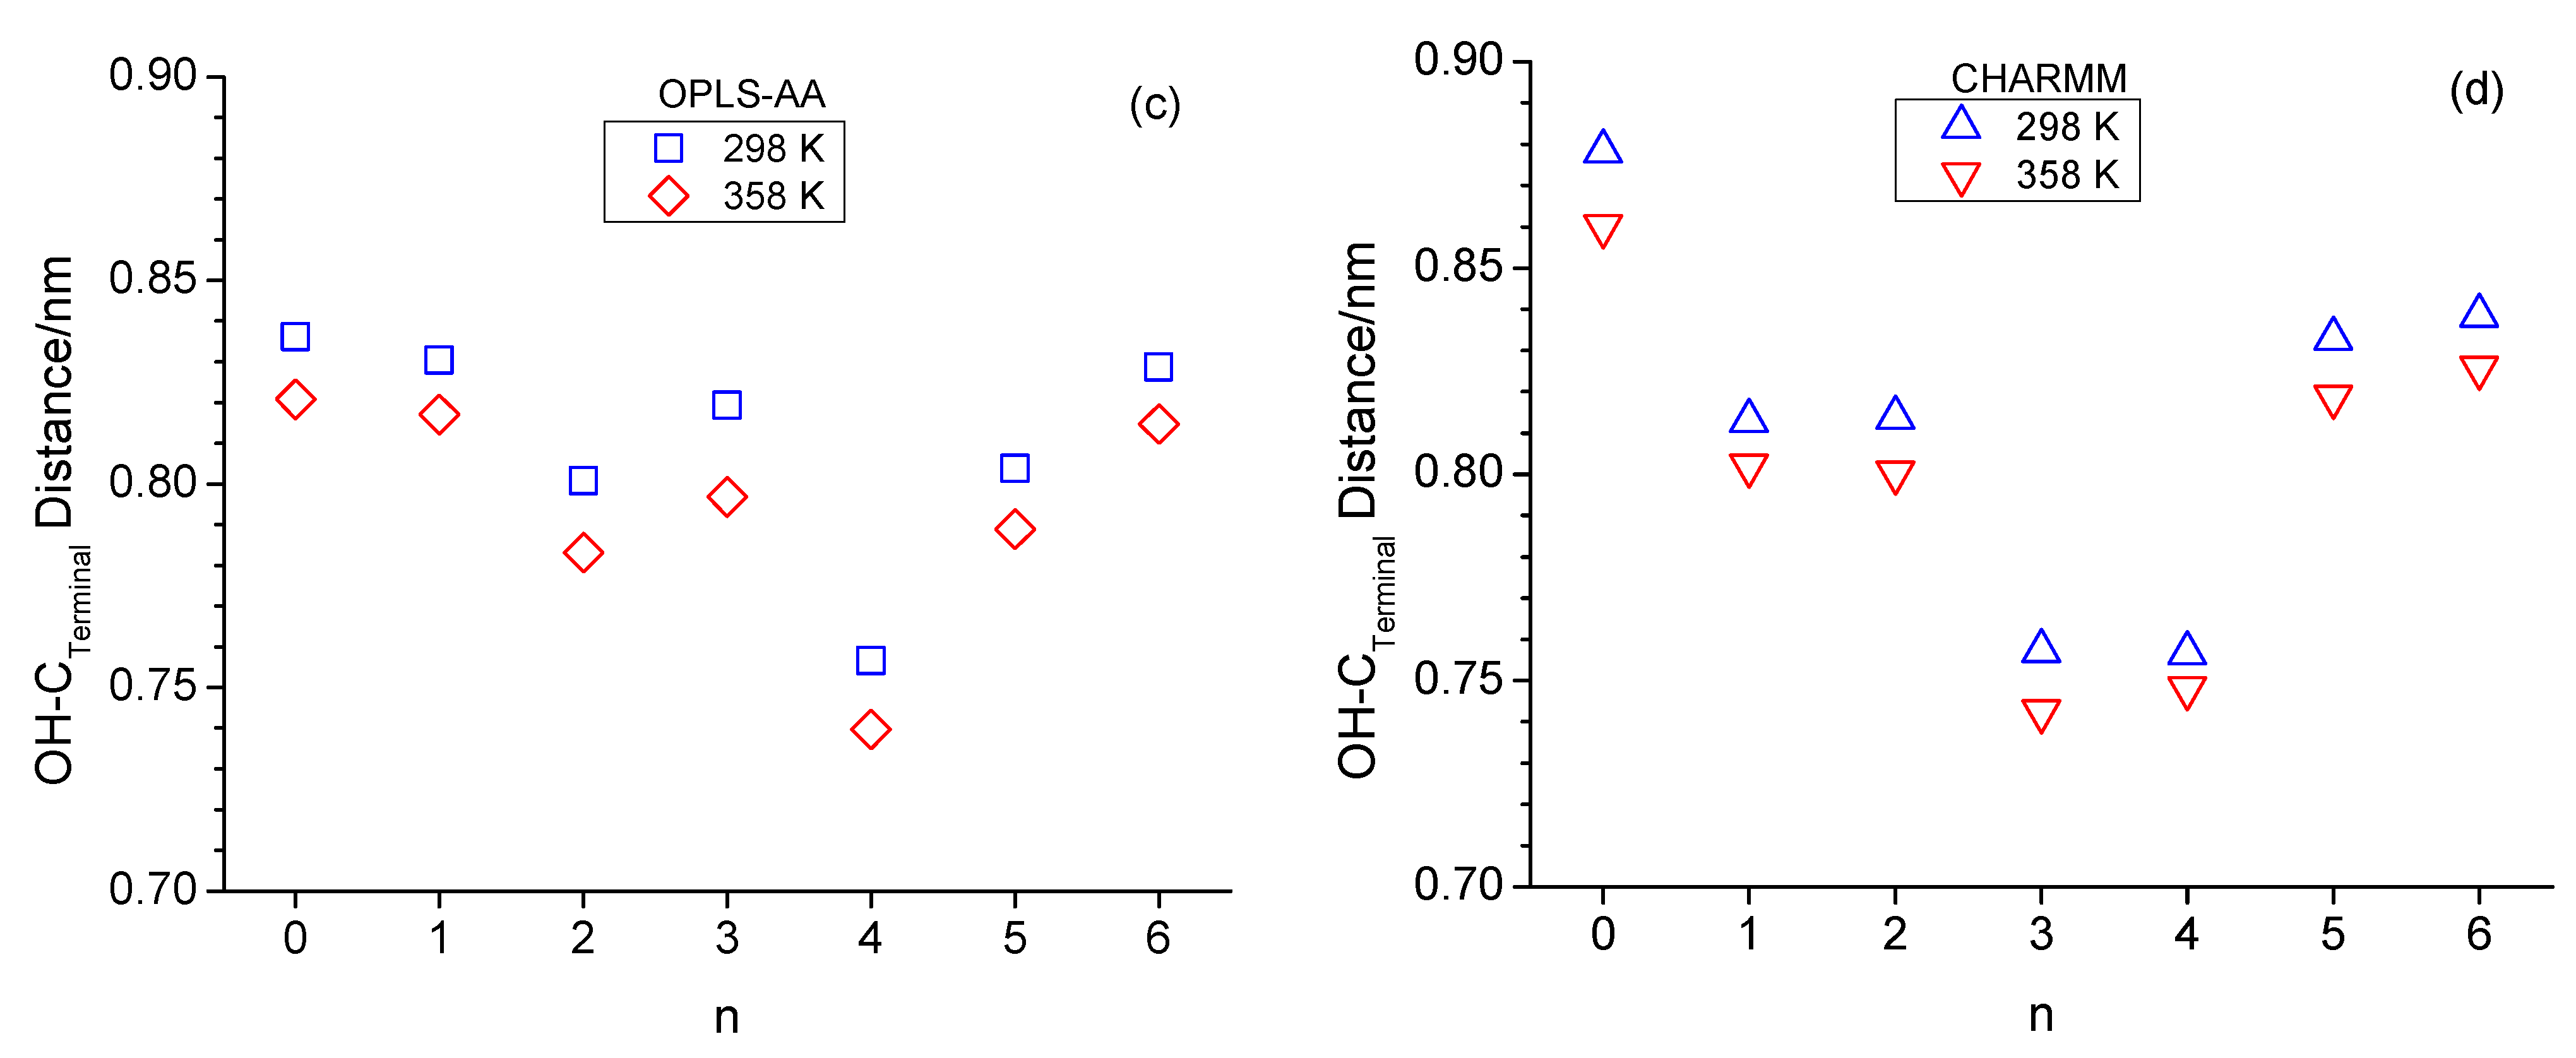
3.2. Intramolecular Hydrogen Bonding
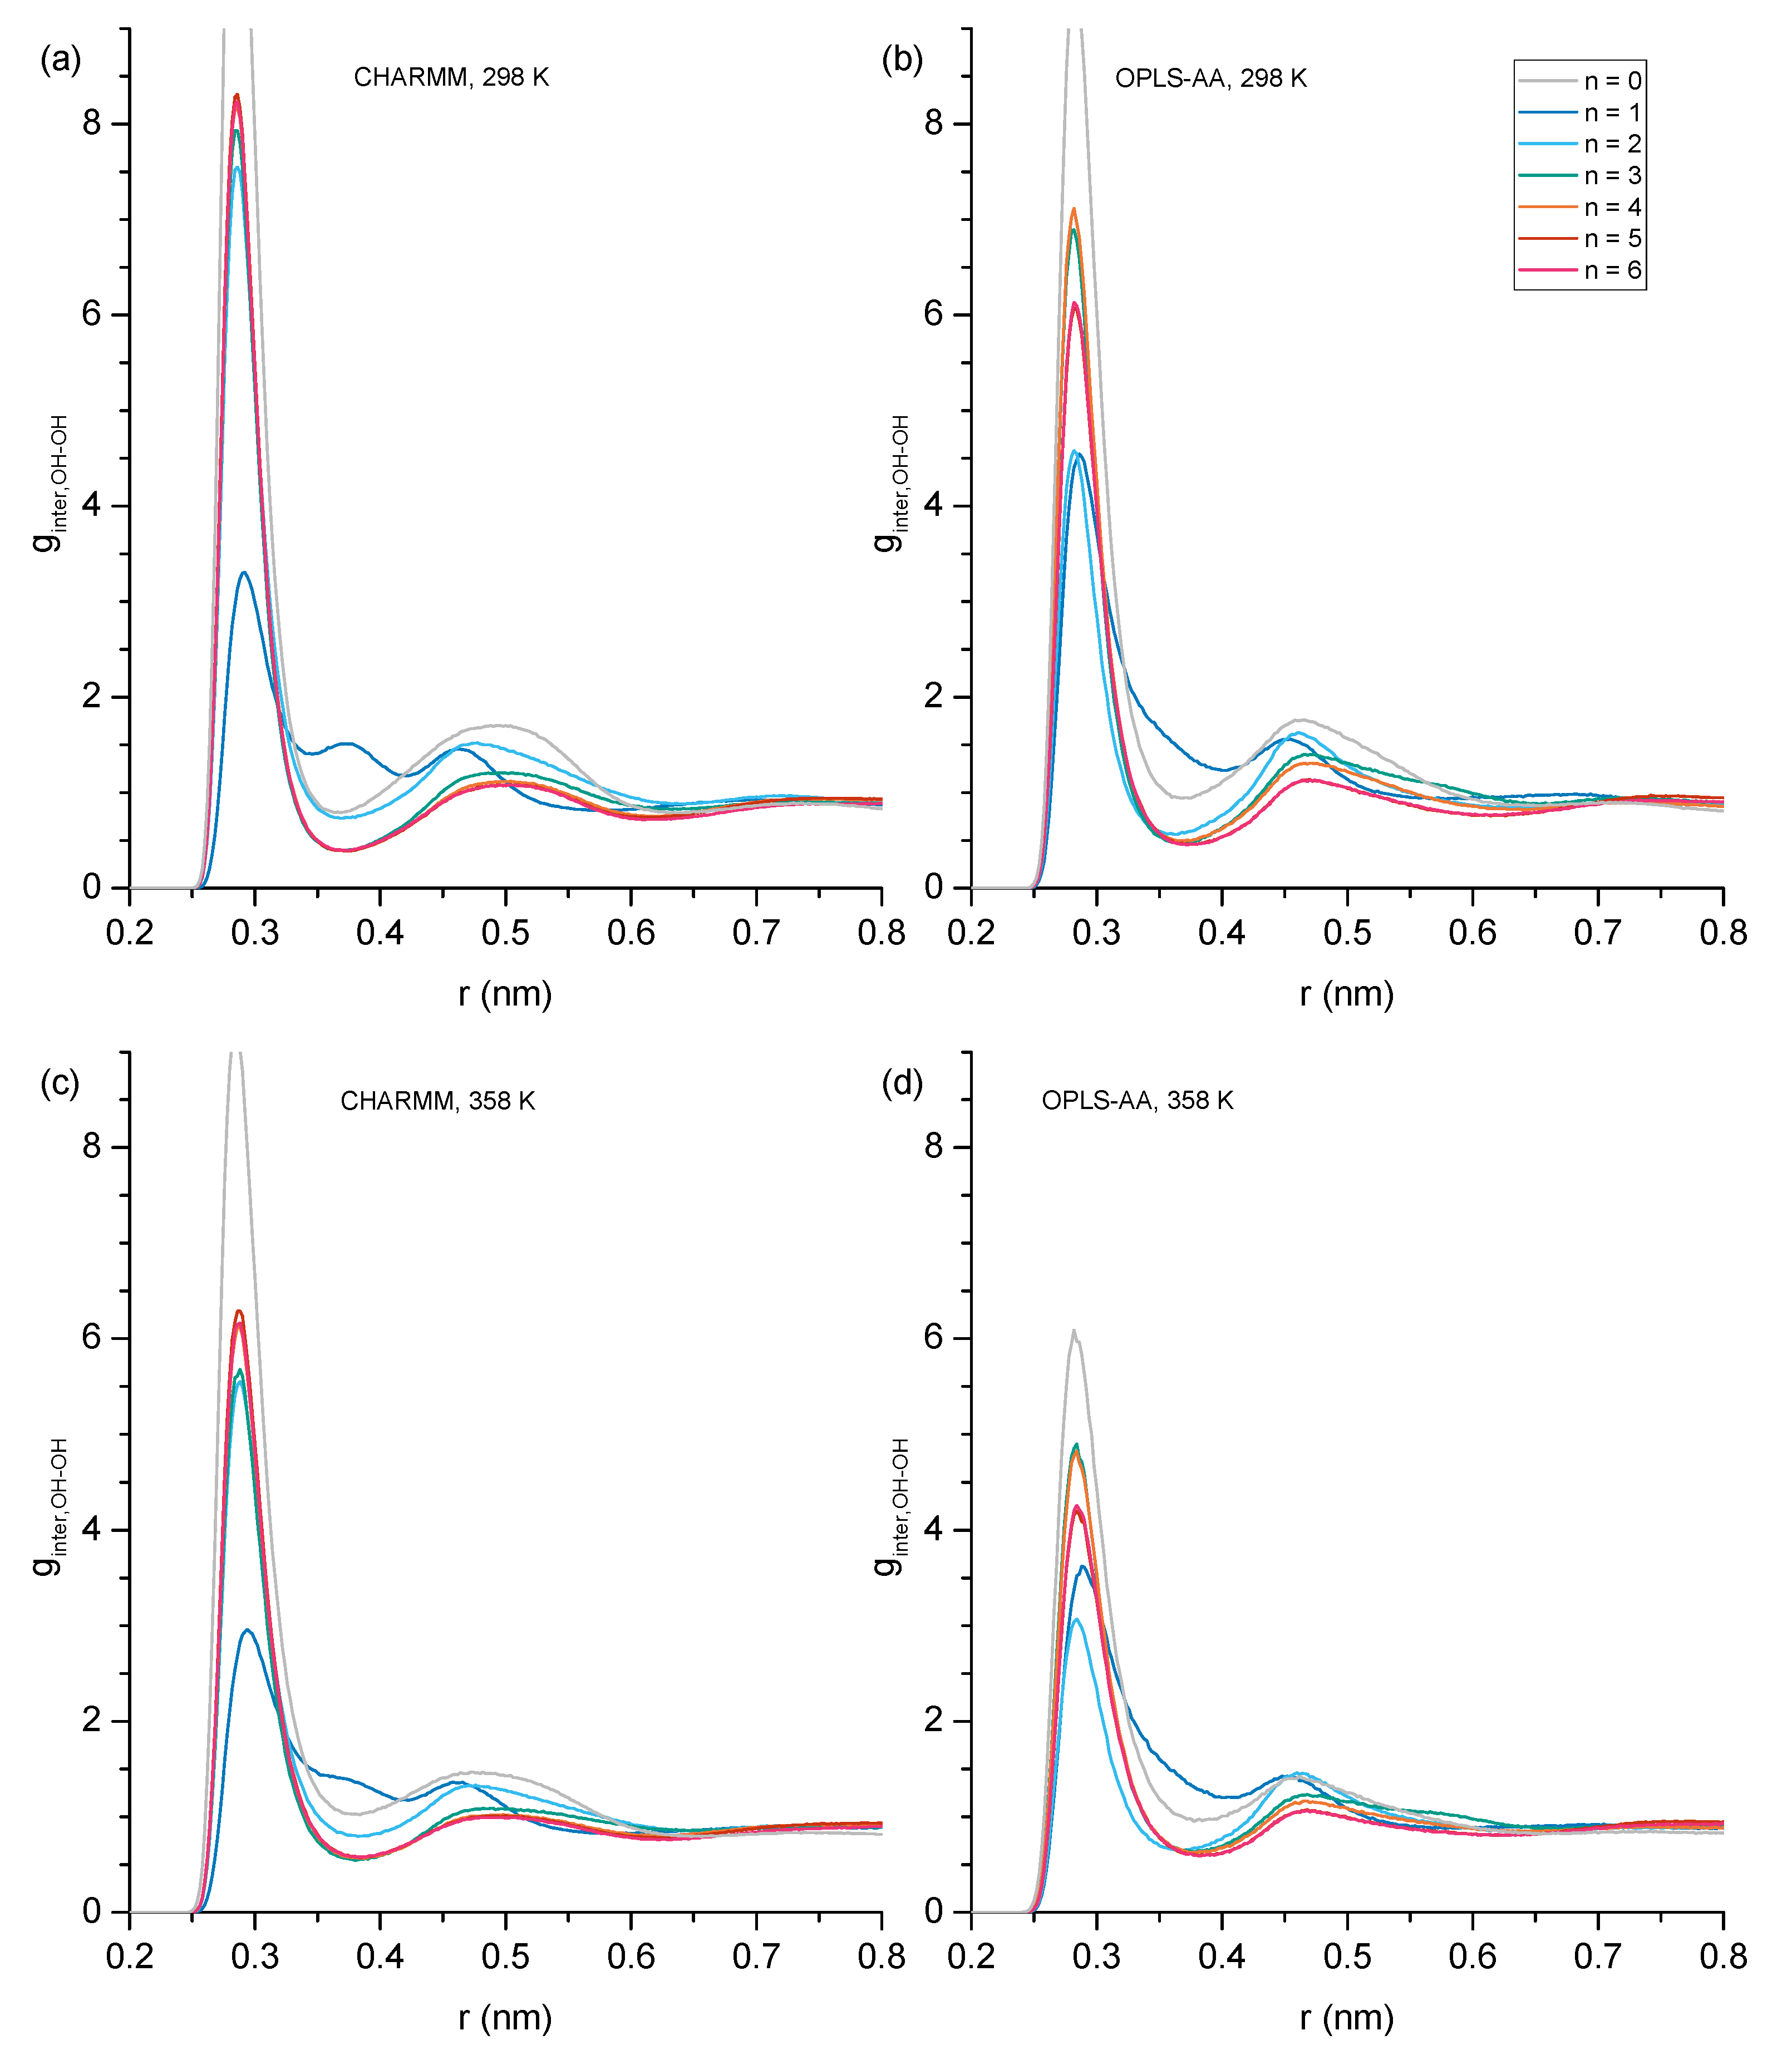
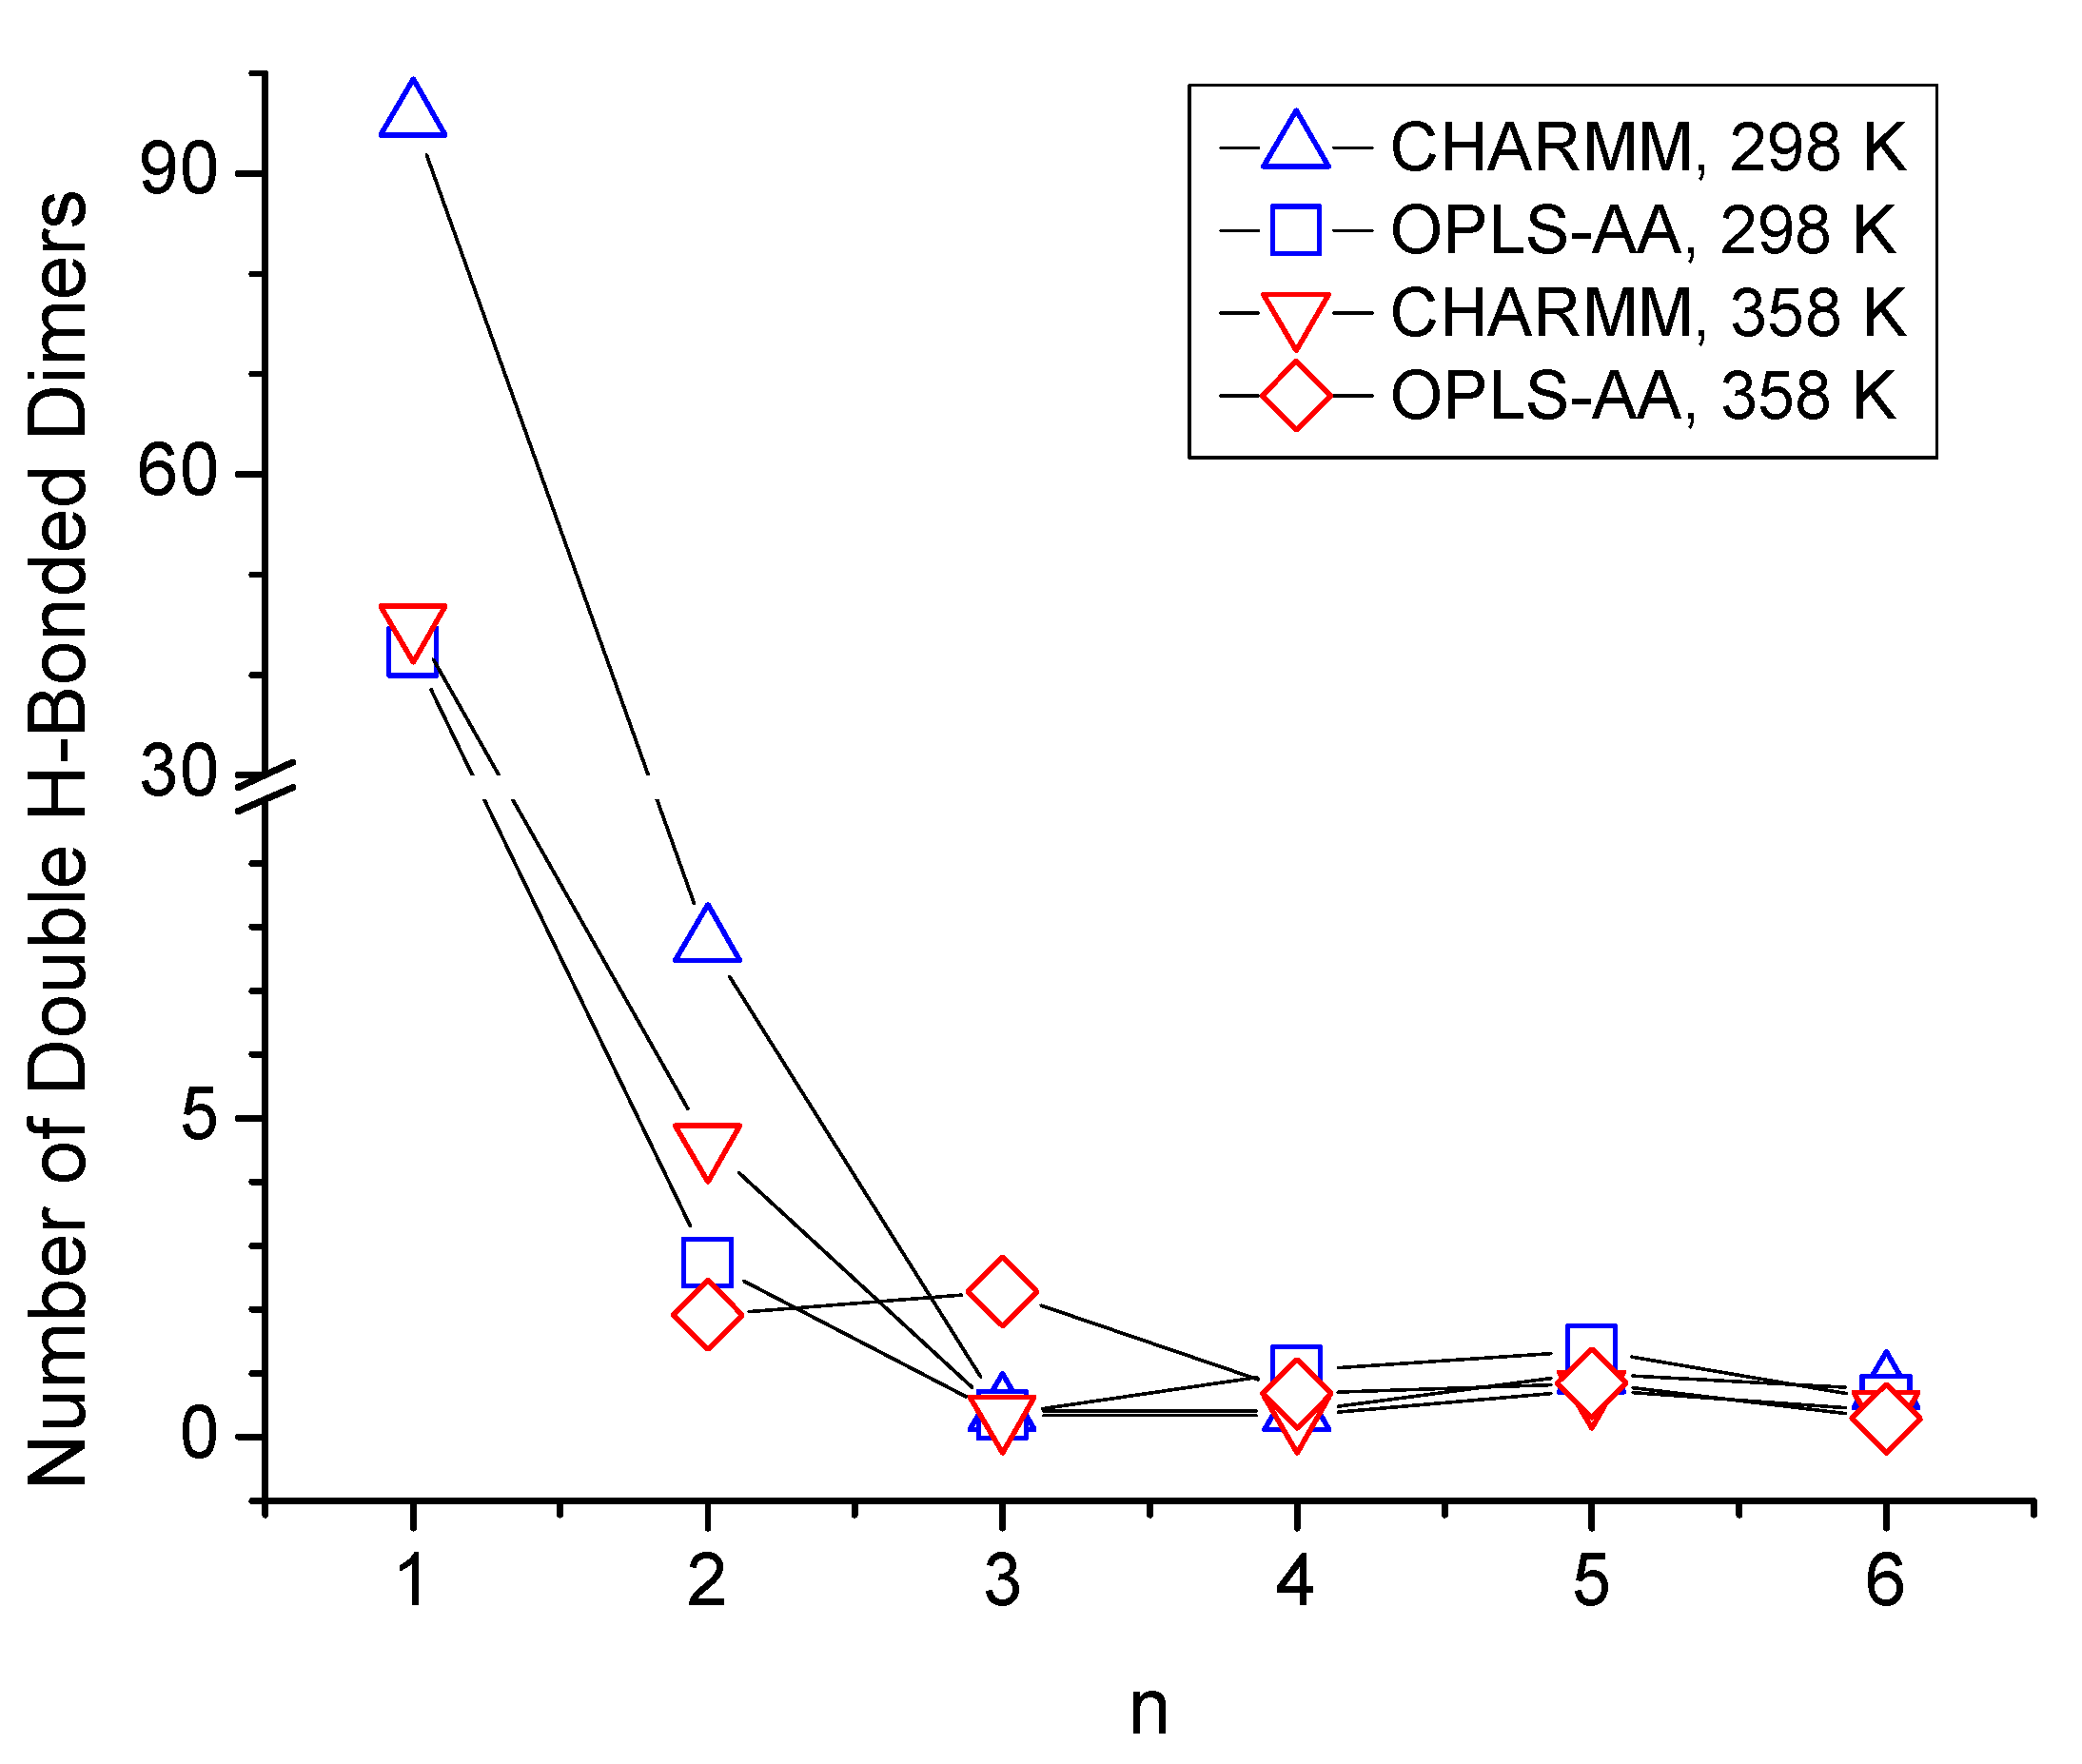
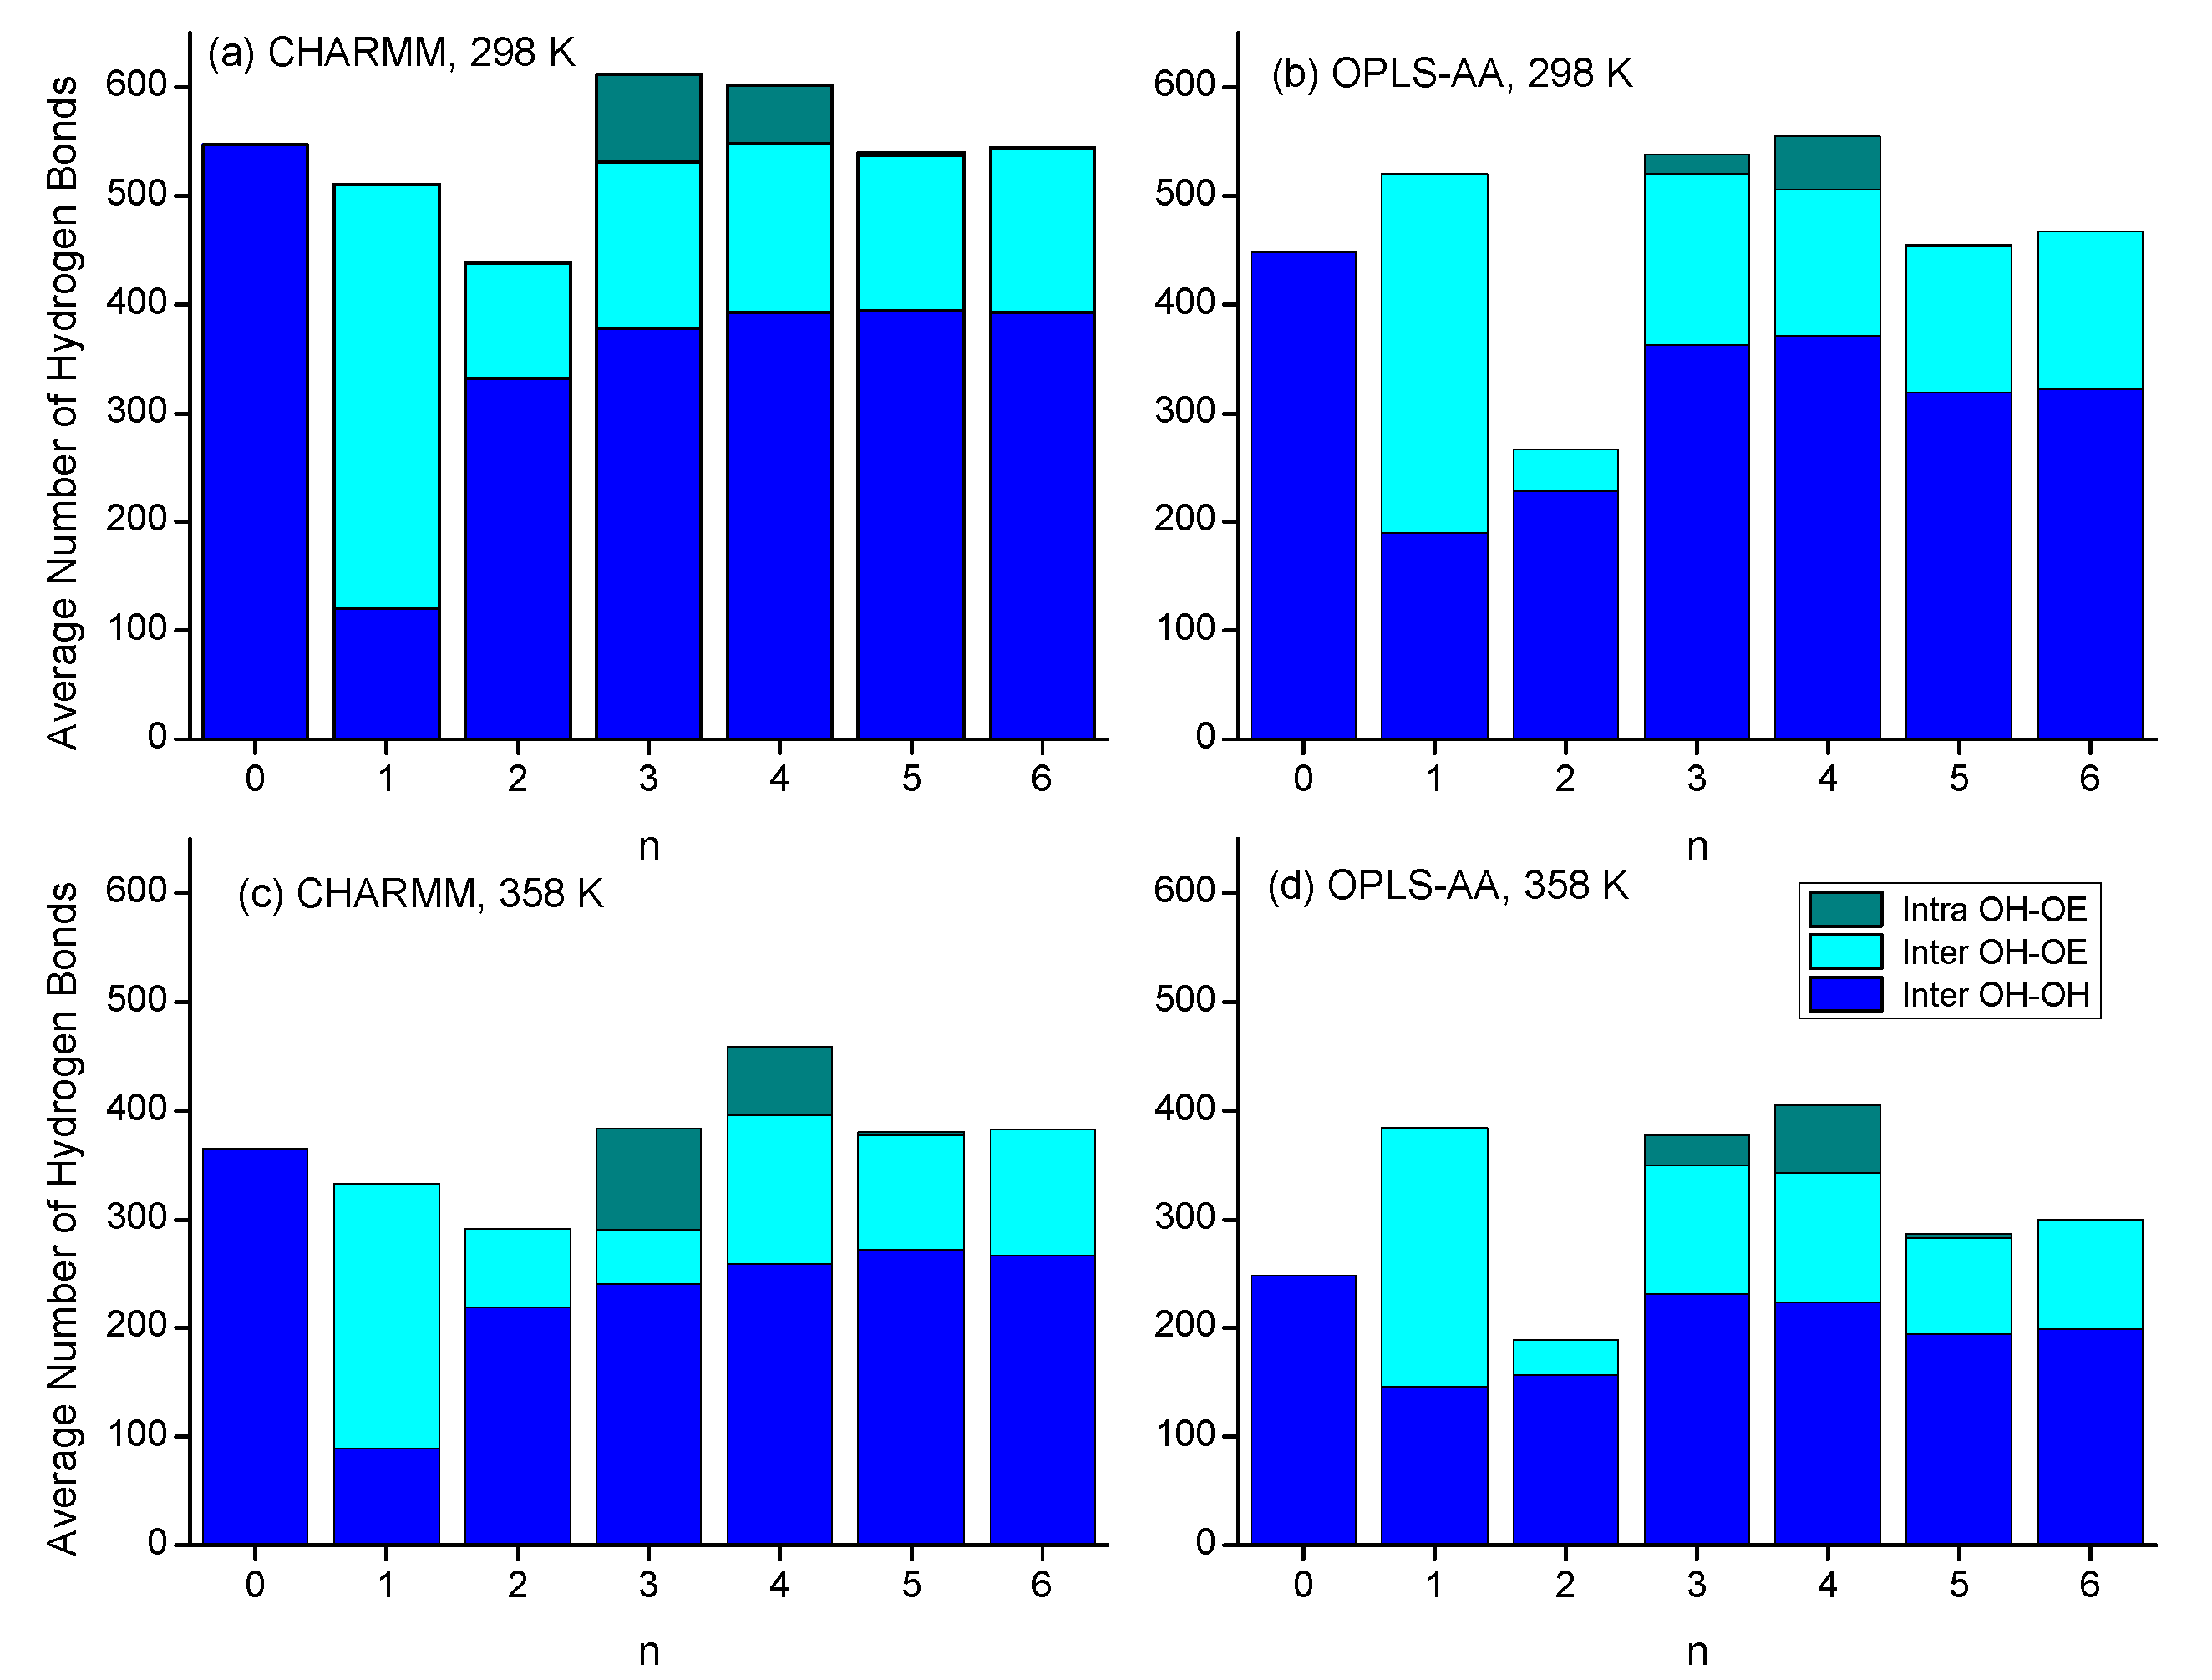
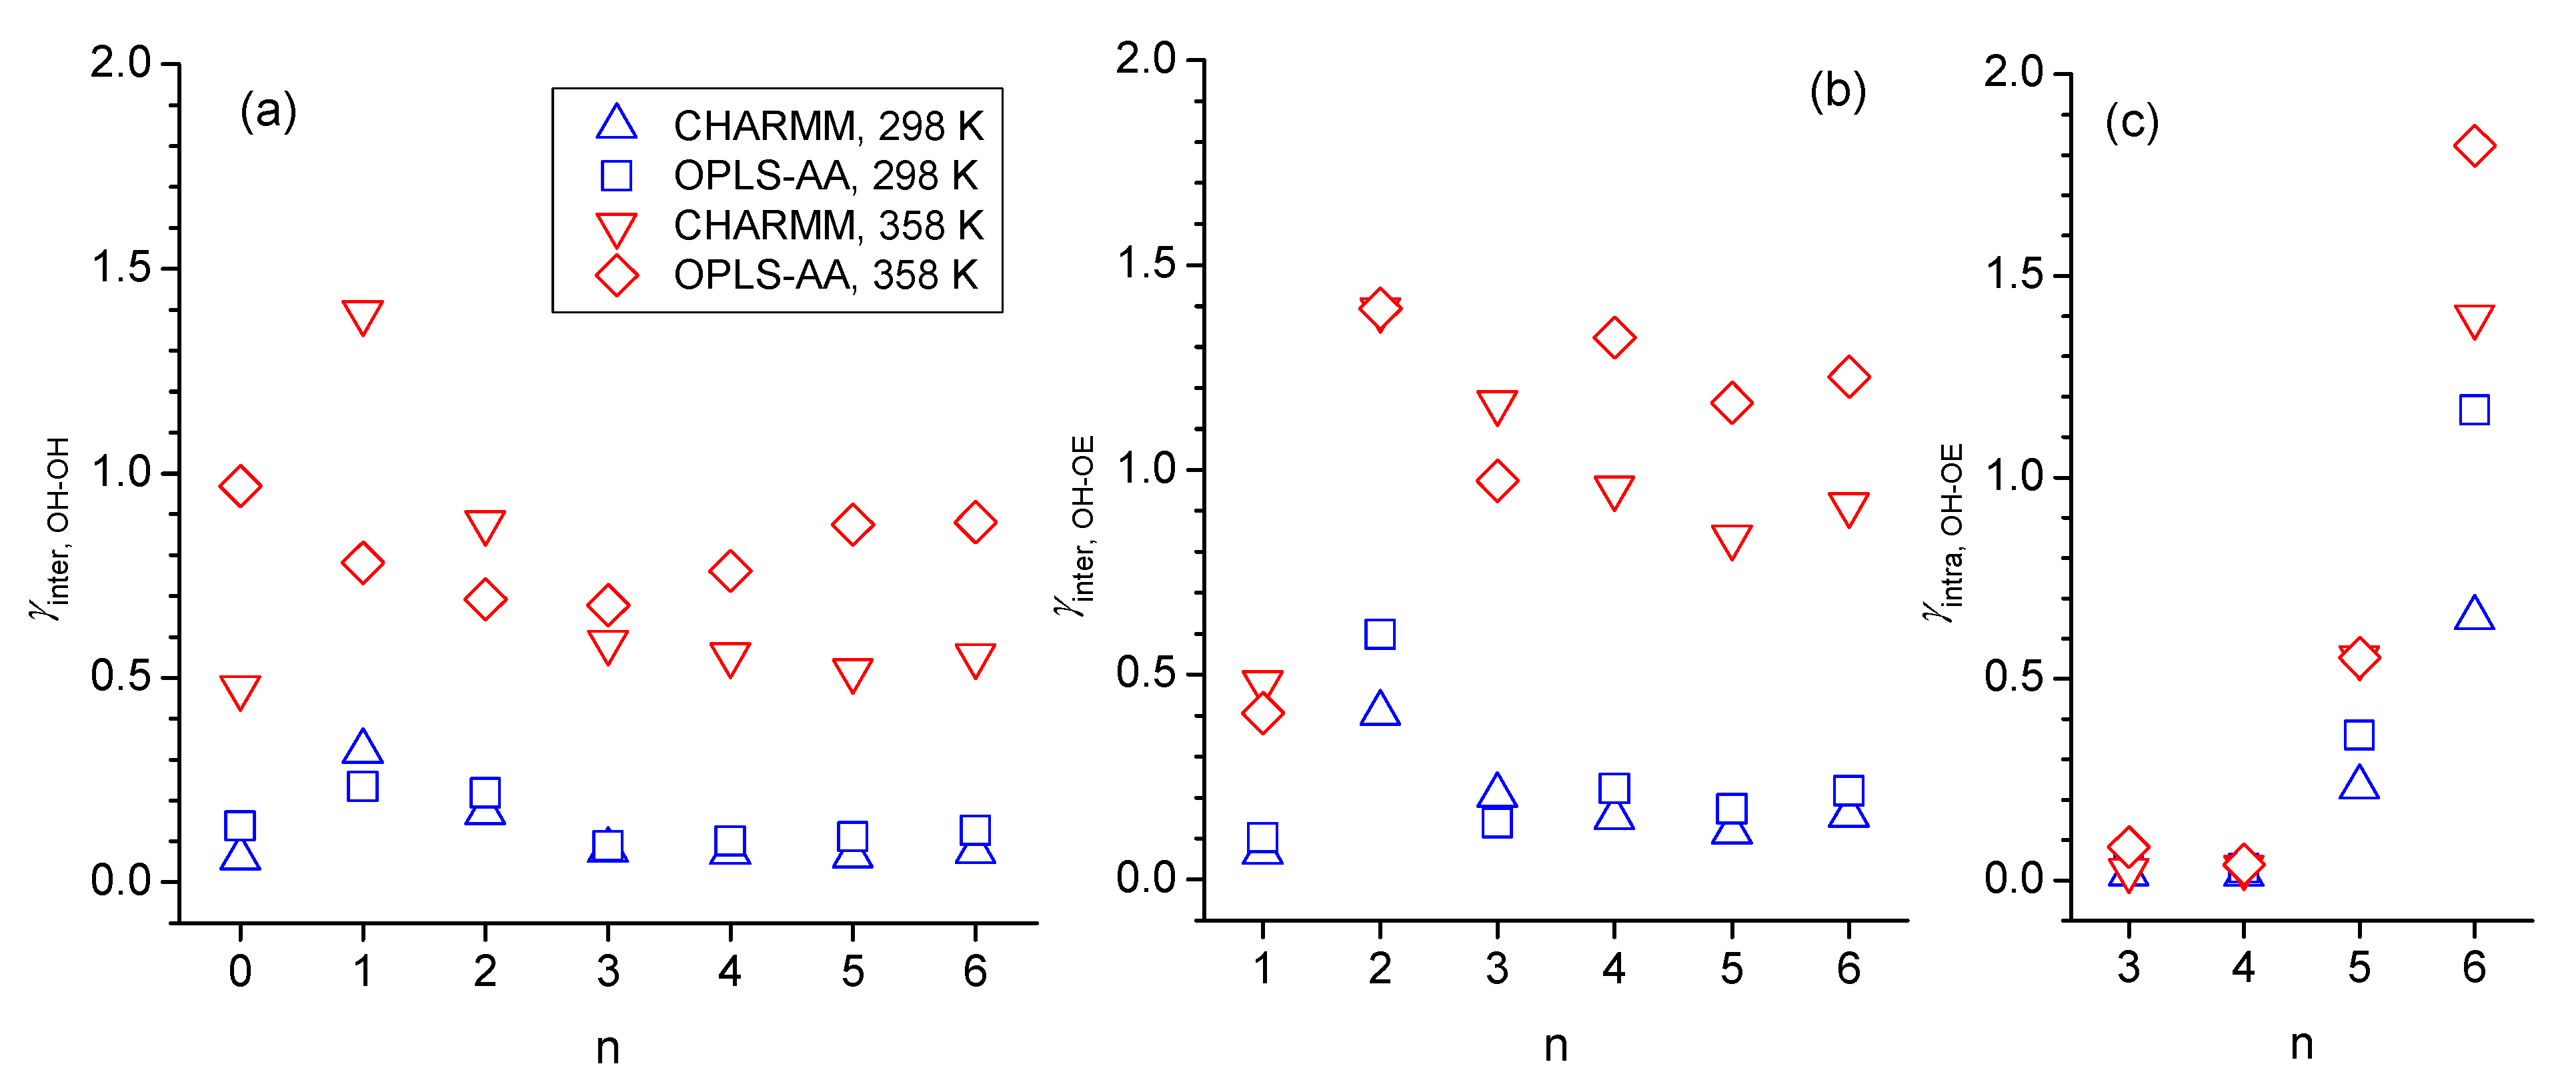
3.3. Intermolecular Hydrogen Bonding
3.4. Interplay of Intra- and Intermolecular Hydrogen Bonding
4. Conclusions
Supplementary Materials
Author Contributions
Funding
Institutional Review Board Statement
Informed Consent Statement
Data Availability Statement
Acknowledgments
Conflicts of Interest
References
- Hoffmann, M.M.; Gonzalez, A.A.; Huynh, M.T.; Miller, K.K.; Gutmann, T.; Buntkowsky, G. Densities, Viscosities, and Self-Diffusion Coefficients of Octan-1-ol and Related Ether-Alcohols. J. Chem. Eng. Data 2024, 69, 2688–2699. [Google Scholar] [CrossRef] [PubMed]
- Scheiner, S. The Hydrogen Bond: A Hundred Years and Counting. J. Ind. Inst. Sci. 2019, 100, 61–76. [Google Scholar] [CrossRef]
- Liu, Y.; Wang, L.; Zhao, L.; Zhang, Y.; Li, Z.T.; Huang, F. Multiple hydrogen bonding driven supramolecular architectures and their biomedical applications. Chem. Soc. Rev. 2024, 53, 1592–1623. [Google Scholar] [CrossRef]
- Ilhami, F.B.; Birhan, Y.S.; Cheng, C.C. Hydrogen-Bonding Interactions from Nucleobase-Decorated Supramolecular Polymer: Synthesis, Self-Assembly and Biomedical Applications. ACS Biomater. Sci. Eng. 2024, 10, 234–254. [Google Scholar] [CrossRef]
- Li, L.; Ma, T.; Wang, M. Protein-Integrated Hydrogen-Bonded Organic Frameworks: Chemistry and Biomedical Applications. Angew. Chem. Int. Ed. Engl. 2024, 63, e202400926. [Google Scholar] [CrossRef]
- Bittner, J.P.; Smirnova, I.; Jakobtorweihen, S. Investigating Biomolecules in Deep Eutectic Solvents with Molecular Dynamics Simulations: Current State, Challenges and Future Perspectives. Molecules 2024, 29, 703. [Google Scholar] [CrossRef]
- Hoffmann, M.M.; Kealy, J.D.; Gutmann, T.; Buntkowsky, G. Densities, viscosities, and self-diffusion coefficients of several polyethylene glycols. J. Chem. Eng. Data 2021, 67, 88–103. [Google Scholar] [CrossRef]
- Hoffmann, M.M.; Horowitz, R.H.; Gutmann, T.; Buntkowsky, G. Densities, viscosities, and self-Diffusion coefficients of ethylene glycol oligomers. J. Chem. Eng. Data 2021, 66, 2480–2500. [Google Scholar] [CrossRef]
- Hoffmann, M.M.; Too, M.D.; Paddock, N.A.; Horstmann, R.; Kloth, S.; Vogel, M.; Buntkowsky, G. On the Behavior of the Ethylene Glycol Components of Polydisperse Polyethylene Glycol PEG200. J. Phys. Chem. B 2023, 127, 1178–1196. [Google Scholar] [CrossRef]
- Hoffmann, M.M.; Too, M.D.; Paddock, N.A.; Horstmann, R.; Kloth, S.; Vogel, M.; Buntkowsky, G. Molecular Dynamics Study of the Green Solvent Polyethylene Glycol with Water Impurities. Molecules 2024, 29, 2070. [Google Scholar] [CrossRef]
- Kardooni, R.; Kiasat, A.R. Polyethylene glycol as a green and biocompatible reaction media for the catalyst free synthesis of organic compounds. Curr. Org. Chem. 2020, 24, 1275–1314. [Google Scholar] [CrossRef]
- Campos, J.F.; Berteina-Raboin, S. Greener synthesis of nitrogen-containing heterocycles in water, PEG, and bio-based solvents. Catalysts 2020, 10, 429. [Google Scholar] [CrossRef]
- Soni, J.; Sahiba, N.; Sethiya, A.; Agarwal, S. Polyethylene glycol: A promising approach for sustainable organic synthesis. J. Mol. Liq. 2020, 315, 113766. [Google Scholar] [CrossRef]
- Visak, Z.P.; Calado, M.S.; Vuksanovic, J.M.; Ivanis, G.R.; Branco, A.S.H.; Grozdanic, N.D.; Kijevcanin, M.L.; Serbanovic, S.P. Solutions of ionic liquids with diverse aliphatic and aromatic solutes—Phase behavior and potentials for applications: A review article. Arabian J. Chem. 2019, 12, 1628–1640. [Google Scholar] [CrossRef]
- McGarvey, P.W.; Hoffmann, M.M. Solubility of some mineral salts in polyethylene glycol and related surfactants. Tens. Surf. Deterg. 2018, 55, 203–209. [Google Scholar] [CrossRef]
- Hoffmann, M.M. Polyethylene glycol as a green chemical solvent. Curr. Opin. Colloid Interface Sci. 2022, 57, 101537. [Google Scholar] [CrossRef]
- Calvo-Flores, F.G.; Monteagudo-Arrebola, M.J.; Dobado, J.A.; Isac-Garcia, J. Green and bio-based solvents. Top. Curr. Chem. 2018, 376, 18. [Google Scholar] [CrossRef]
- Arunan, E.; Desiraju, G.R.; Klein, R.A.; Sadlej, J.; Scheiner, S.; Alkorta, I.; Clary, D.C.; Crabtree, R.H.; Dannenberg, J.J.; Hobza, P.; et al. Definition of the hydrogen bond (IUPAC Recommendations 2011). Pure Appl. Chem. 2011, 83, 1637–1641. [Google Scholar] [CrossRef]
- van der Lubbe, S.C.C.; Fonseca Guerra, C. The Nature of Hydrogen Bonds: A Delineation of the Role of Different Energy Components on Hydrogen Bond Strengths and Lengths. Chem. Asian J. 2019, 14, 2760–2769. [Google Scholar] [CrossRef]
- Renati, P.; Madl, P. What Is the “Hydrogen Bond”? A QFT-QED Perspective. Int. J. Mol. Sci. 2024, 25, 3846. [Google Scholar] [CrossRef]
- Pocheć, M.; Krupka, K.M.; Panek, J.J.; Orzechowski, K.; Jezierska, A. Intermolecular Interactions and Spectroscopic Signatures of the Hydrogen-Bonded System-n-Octanol in Experimental and Theoretical Studies. Molecules 2022, 27, 1225. [Google Scholar] [CrossRef] [PubMed]
- Biswas, S.; Wong, B.M. Ab initio metadynamics calculations reveal complex interfacial effects in acetic acid deprotonation dynamics. J. Mol. Liq. 2021, 330, 115624. [Google Scholar] [CrossRef]
- Jämbeck, J.P.M.; Lyubartsev, A.P. Update to the General Amber Force Field for Small Solutes with an Emphasis on Free Energies of Hydration. J. Phys. Chem. B 2014, 118, 3793–3804. [Google Scholar] [CrossRef]
- Wang, J.; Wolf, R.M.; Caldwell, J.W.; Kollman, P.A.; Case, D.A. Development and testing of a general amber force field. J. Comput. Chem. 2004, 25, 1157–1174. [Google Scholar] [CrossRef]
- Soteras Gutiérrez, I.; Lin, F.-Y.; Vanommeslaeghe, K.; Lemkul, J.A.; Armacost, K.A.; Brooks, C.L.; MacKerell, A.D. Parametrization of halogen bonds in the CHARMM general force field: Improved treatment of ligand–protein interactions. Bioorg. Med. Chem. 2016, 24, 4812–4825. [Google Scholar] [CrossRef]
- Vanommeslaeghe, K.; Hatcher, E.; Acharya, C.; Kundu, S.; Zhong, S.; Shim, J.; Darian, E.; Guvench, O.; Lopes, P.; Vorobyov, I.; et al. CHARMM general force field: A force field for drug-like molecules compatible with the CHARMM all-atom additive biological force fields. J. Comput. Chem. 2010, 31, 671–690. [Google Scholar] [CrossRef] [PubMed]
- Horta, B.A.C.; Merz, P.T.; Fuchs, P.F.J.; Dolenc, J.; Riniker, S.; Hünenberger, P.H. A GROMOS-Compatible Force Field for Small Organic Molecules in the Condensed Phase: The 2016H66 Parameter Set. J. Chem. Theory Comput. 2016, 12, 3825–3850. [Google Scholar] [CrossRef]
- Jorgensen, W.L.; Maxwell, D.S.; Tirado-Rives, J. Development and Testing of the OPLS All-Atom Force Field on Conformational Energetics and Properties of Organic Liquids. J. Am. Chem. Soc. 1996, 118, 11225–11236. [Google Scholar] [CrossRef]
- Sonibare, K.; Rathnayaka, L.; Zhang, L. Comparison of CHARMM and OPLS-aa forcefield predictions for components in one model asphalt mixture. Constr. Build. Mater. 2020, 236, 117577. [Google Scholar] [CrossRef]
- Kulschewski, T.; Pleiss, J. A molecular dynamics study of liquid aliphatic alcohols: Simulation of density and self-diffusion coefficient using a modified OPLS force field. Mol. Sim. 2013, 39, 754–767. [Google Scholar] [CrossRef]
- DeBolt, S.E.; Kollman, P.A. Investigation of Structure, Dynamics, and Solvation in 1-Octanol and Its Water-Saturated Solution: Molecular Dynamics and Free-Energy Perturbation Studies. J. Am. Chem. Soc. 1995, 117, 5316–5340. [Google Scholar] [CrossRef]
- MacCallum, J.L.; Tieleman, D.P. Structures of Neat and Hydrated 1-Octanol from Computer Simulations. J. Am. Chem. Soc. 2002, 124, 15085–15093. [Google Scholar] [CrossRef] [PubMed]
- Sassi, P.; Paolantoni, M.; Cataliotti, R.S.; Palombo, F.; Morresi, A. Water/Alcohol Mixtures: A Spectroscopic Study of the Water-Saturated 1-Octanol Solution. J. Phys. Chem. B 2004, 108, 19557–19565. [Google Scholar] [CrossRef]
- Chen, B.; Siepmann, J.I. Partitioning of Alkane and Alcohol Solutes between Water and (Dry or Wet) 1-Octanol. J. Am. Chem. Soc. 2000, 122, 6464–6467. [Google Scholar] [CrossRef]
- Berendsen, H.J.C.; van der Spoel, D.; van Drunen, R. GROMACS: A message-passing parallel molecular dynamics implementation. Comput. Phys. Commun. 1995, 91, 43–56. [Google Scholar] [CrossRef]
- Abraham, M.J.; Murtola, T.; Schulz, R.; Páll, S.; Smith, J.C.; Hess, B.; Lindahl, E. GROMACS: High performance molecular simulations through multi-level parallelism from laptops to supercomputers. SoftwareX 2015, 1–2, 19–25. [Google Scholar] [CrossRef]
- Hess, B.; Bekker, H.; Berendsen, H.J.C.; Fraaije, J.G.E.M. LINCS: A linear constraint solver for molecular simulations. J. Comput. Chem. 1997, 18, 1463–1472. [Google Scholar] [CrossRef]
- Páll, S.; Hess, B. A flexible algorithm for calculating pair interactions on SIMD architectures. Comput. Phys. Commun. 2013, 184, 2641–2650. [Google Scholar] [CrossRef]
- Darden, T.; York, D.; Pedersen, L. Particle mesh Ewald: An N⋅log(N) method for Ewald sums in large systems. J. Chem. Phys. 1993, 98, 10089–10092. [Google Scholar] [CrossRef]
- Essmann, U.; Perera, L.; Berkowitz, M.L.; Darden, T.; Lee, H.; Pedersen, L.G. A smooth particle mesh Ewald method. J. Chem. Phys. 1995, 103, 8577–8593. [Google Scholar] [CrossRef]
- Bussi, G.; Donadio, D.; Parrinello, M. Canonical sampling through velocity rescaling. J. Chem. Phys. 2007, 126, 014101. [Google Scholar] [CrossRef]
- Parrinello, M.; Rahman, A. Polymorphic transitions in single crystals: A new molecular dynamics method. J. Appl. Phys. 1981, 52, 7182–7190. [Google Scholar] [CrossRef]
- Nosé, S.; Klein, M.L. Constant pressure molecular dynamics for molecular systems. Molec. Phys. 1983, 50, 1055–1076. [Google Scholar] [CrossRef]
- Basconi, J.E.; Shirts, M.R. Effects of Temperature Control Algorithms on Transport Properties and Kinetics in Molecular Dynamics Simulations. J. Chem. Theory Comput. 2013, 9, 2887–2899. [Google Scholar] [CrossRef]
- Maginn, E.J.; Messerly, R.A.; Carlson, D.J.; Roe, D.R.; Elliott, J.R. Best Practices for Computing Transport Properties 1. Self-Diffusivity and Viscosity from Equilibrium Molecular Dynamics [Article v1.0]. Living J. Comp. Mol. Sci. 2019, 1, 6324. [Google Scholar] [CrossRef]
- Theoretical and Computational Biophysics Group. Available online: https://www.ks.uiuc.edu/ (accessed on 2 March 2025).
- Yeh, I.-C.; Hummer, G. System-Size Dependence of Diffusion Coefficients and Viscosities from Molecular Dynamics Simulations with Periodic Boundary Conditions. J. Phys. Chem. B 2004, 108, 15873–15879. [Google Scholar] [CrossRef]
- Zhang, Y.; Otani, A.; Maginn, E.J. Reliable Viscosity Calculation from Equilibrium Molecular Dynamics Simulations: A Time Decomposition Method. J. Chem. Theory Comput. 2015, 11, 3537–3546. [Google Scholar] [CrossRef] [PubMed]
- Michaud-Agrawal, N.; Denning, E.J.; Woolf, T.B.; Beckstein, O. MDAnalysis: A toolkit for the analysis of molecular dynamics simulations. J. Comput. Chem. 2011, 32, 2319–2327. [Google Scholar] [CrossRef] [PubMed]
- Ozkanlar, A.; Zhou, T.; Clark, A.E. Towards a unified description of the hydrogen bond network of liquid water: A dynamics based approach. J. Chem. Phys. 2014, 141, 214107. [Google Scholar] [CrossRef]
- Hoffmann, M.M.; Gutmann, T.; Buntkowsky, G. Thermal Behavior of n-Octanol and Related Ether Alcohols. J. Chem. Eng. Data 2024, 70, 600–606. [Google Scholar] [CrossRef]


| Chemical Name | CAS | Chemical Structure | n |
|---|---|---|---|
| n-octanol | 111-87-5 |  | 0 |
| 1-hexyloxymethanol | 44860-30-2 | 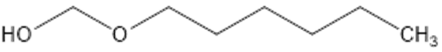 | 1 |
| 2-pentyloxyethanol | 6196-58-3 | 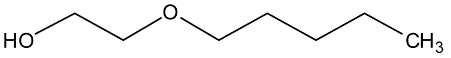 | 2 |
| 3-butoxypropanol | 10215-33-5 | 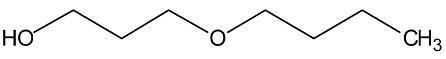 | 3 |
| 4-propoxybutanol | 84629-33-4 |  | 4 |
| 5-ethoxypentanol | 10215-35-7 | 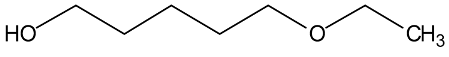 | 5 |
| 6-methoxyhexanol | 57021-65-5 |  | 6 |
| n | Nnetwork | Nbonds | Quartile 1 | Median | Quartile 3 | Max | Dimers | Cyclic |
|---|---|---|---|---|---|---|---|---|
| 298 K CHARMM | ||||||||
| 0 | 231.1 ± 8.4 | 2.4 ± 1.9 | 1 | 2 | 3 | 23 | 0.0 | 0.9 |
| 1 | 290.0 ± 8.1 | 1.8 ± 0.9 | 1 | 2 | 2 | 11 | 95.7 | 0.0 |
| 2 | 240.9 ± 26.6 | 1.9 ± 1.3 | 1 | 1 | 2 | 19 | 7.8 | 0.1 |
| 3 | 270.2 ± 10.3 | 2.0 ± 1.5 | 1 | 1 | 2 | 21 | 0.4 | 0.2 |
| 4 | 250.4 ± 9.0 | 2.2 ± 1.8 | 1 | 2 | 3 | 27 | 0.4 | 0.2 |
| 5 | 214.3 ± 8.5 | 2.5 ± 2.2 | 1 | 2 | 3 | 38 | 1.0 | 0.3 |
| 6 | 212.4 ± 8.8 | 2.6 ± 2.3 | 1 | 2 | 3 | 34 | 0.7 | 0.2 |
| 298 K OPLS-AA | ||||||||
| 0 | 229.1 ± 7.8 | 2.0 ± 1.4 | 1 | 1 | 2 | 17 | 0.0 | 1.5 |
| 1 | 252.9 ± 8.4 | 2.1 ± 1.5 | 1 | 2 | 2 | 25 | 42.2 | 0.0 |
| 2 | 181.7 ± 8.0 | 1.5 ± 0.9 | 1 | 1 | 2 | 14 | 2.7 | 0.0 |
| 3 | 224.3 ± 8.9 | 2.3 ± 2.0 | 1 | 2 | 3 | 28 | 0.3 | 0.4 |
| 4 | 248.6 ± 8.6 | 2.0 ± 1.6 | 1 | 1 | 3 | 22 | 1.0 | 0.6 |
| 5 | 217.7 ± 8.4 | 2.1 ± 1.7 | 1 | 1 | 3 | 23 | 1.4 | 0.4 |
| 6 | 215.3 ± 8.3 | 2.2 ± 1.8 | 1 | 1 | 3 | 23 | 0.6 | 0.4 |
| 358 K CHARMM | ||||||||
| 0 | 213.7 ± 8.4 | 1.7 ± 1.3 | 1 | 1 | 2 | 16 | 0.0 | 0.4 |
| 1 | 222.8 ± 9.4 | 1.5 ± 0.7 | 1 | 1 | 2 | 11 | 45.0 | 0.0 |
| 2 | 191.0 ± 8.4 | 1.5 ± 0.9 | 1 | 1 | 2 | 11 | 4.6 | 0.0 |
| 3 | 256.7 ± 10.4 | 1.5 ± 0.9 | 1 | 1 | 2 | 14 | 0.3 | 0.1 |
| 4 | 243.5 ± 9.7 | 1.6 ± 1.1 | 1 | 1 | 2 | 16 | 0.3 | 0.1 |
| 5 | 209.1 ± 8.2 | 1.8 ± 1.3 | 1 | 1 | 2 | 18 | 0.7 | 0.1 |
| 6 | 207.9 ± 7.9 | 1.8 ± 1.4 | 1 | 1 | 2 | 17 | 0.4 | 0.1 |
| 358 K OPLS-AA | ||||||||
| 0 | 173.9 ± 9.0 | 1.4 ± 0.8 | 1 | 1 | 2 | 11 | 0.0 | 0.4 |
| 1 | 226.2 ± 8.3 | 1.7 ± 1.1 | 1 | 1 | 2 | 15 | 24.3 | 0.0 |
| 2 | 144.4 ± 8.6 | 1.3 ± 0.7 | 1 | 1 | 1 | 10 | 1.9 | 0.0 |
| 3 | 171.5 ± 8.5 | 1.4 ± 0.8 | 1 | 1 | 2 | 11 | 2.3 | 0.0 |
| 4 | 229.0 ± 9.5 | 1.5 ± 0.9 | 1 | 1 | 2 | 13 | 0.8 | 0.1 |
| 5 | 185.8 ± 8.6 | 1.5 ± 0.9 | 1 | 1 | 2 | 12 | 0.9 | 0.1 |
| 6 | 189.6 ± 8.2 | 1.6 ± 1.0 | 1 | 1 | 2 | 14 | 0.3 | 0.1 |
Disclaimer/Publisher’s Note: The statements, opinions and data contained in all publications are solely those of the individual author(s) and contributor(s) and not of MDPI and/or the editor(s). MDPI and/or the editor(s) disclaim responsibility for any injury to people or property resulting from any ideas, methods, instructions or products referred to in the content. |
© 2025 by the authors. Licensee MDPI, Basel, Switzerland. This article is an open access article distributed under the terms and conditions of the Creative Commons Attribution (CC BY) license (https://creativecommons.org/licenses/by/4.0/).
Share and Cite
Hoffmann, M.M.; Smith, T.N.; Buntkowsky, G. The Interplay of Inter- and Intramolecular Hydrogen Bonding in Ether Alcohols Related to n-Octanol. Molecules 2025, 30, 2456. https://doi.org/10.3390/molecules30112456
Hoffmann MM, Smith TN, Buntkowsky G. The Interplay of Inter- and Intramolecular Hydrogen Bonding in Ether Alcohols Related to n-Octanol. Molecules. 2025; 30(11):2456. https://doi.org/10.3390/molecules30112456
Chicago/Turabian StyleHoffmann, Markus M., Troy N. Smith, and Gerd Buntkowsky. 2025. "The Interplay of Inter- and Intramolecular Hydrogen Bonding in Ether Alcohols Related to n-Octanol" Molecules 30, no. 11: 2456. https://doi.org/10.3390/molecules30112456
APA StyleHoffmann, M. M., Smith, T. N., & Buntkowsky, G. (2025). The Interplay of Inter- and Intramolecular Hydrogen Bonding in Ether Alcohols Related to n-Octanol. Molecules, 30(11), 2456. https://doi.org/10.3390/molecules30112456