

Shock Wave-Induced Degradation of Polyethylene and Polystyrene: A Reactive Molecular Dynamics Study on Nanoplastic Transformation in Aqueous Environments


Abstract
1. Introduction
2. Results and Discussion
2.1. Preparation of the LDPE Nanoparticle
2.2. Conducting Degradation Reactions of LDPE Nanoparticle in Water
2.3. Preparation of PS Nanoparticle
2.4. Conducting Degradation Reactions of PS Nanoparticle in Water
3. Methods
4. Summary and Conclusions
Author Contributions
Funding
Institutional Review Board Statement
Informed Consent Statement
Data Availability Statement
Conflicts of Interest
References
- Yang, S.-S.; Wu, W.-M.; Pang, J.-W.; He, L.; Ding, M.-Q.; Li, M.-X.; Zhao, Y.-L.; Sun, H.-J.; Xing, D.-F.; Ren, N.-Q.; et al. Bibliometric Analysis of Publications on Biodegradation of Plastics: Explosively Emerging Research over 70 Years. J. Clean. Prod. 2023, 428, 139423. [Google Scholar] [CrossRef]
- Lin, Z.; Jin, T.; Zou, T.; Xu, L.; Xi, B.; Xu, D.; He, J.; Xiong, L.; Tang, C.; Peng, J.; et al. Current Progress on Plastic/Microplastic Degradation: Fact Influences and Mechanism. Environ. Pollut. 2022, 304, 119159. [Google Scholar] [CrossRef] [PubMed]
- Liu, L.; Xu, M.; Ye, Y.; Zhang, B. On the Degradation of (Micro)Plastics: Degradation Methods, Influencing Factors, Environmental Impacts. Sci. Total Environ. 2022, 806, 151312. [Google Scholar] [CrossRef]
- Tiago, G.A.O.; Mariquito, A.; Martins-Dias, S.; Marques, A.C. The Problem of Polyethylene Waste—Recent Attempts for Its Mitigation. Sci. Total Environ. 2023, 892, 164629. [Google Scholar] [CrossRef] [PubMed]
- Aniśko, J.; Sałasińska, K.; Barczewski, M. Thermal Stability and Degradation Kinetics of Bio-Based Low-Density Polyethylenes. Polimery 2023, 68, 451–460. [Google Scholar] [CrossRef]
- Heimowska, A. Environmental Degradation of Oxo-Biodegradable Polyethylene Bags. Water 2023, 15, 4059. [Google Scholar] [CrossRef]
- Hiejima, Y.; Kida, T.; Takeda, K.; Igarashi, T.; Nitta, K. Microscopic Structural Changes during Photodegradation of Low-Density Polyethylene Detected by Raman Spectroscopy. Polym. Degrad. Stab. 2018, 150, 67–72. [Google Scholar] [CrossRef]
- Lee, S.; Alam, M.B.; Jung, M.-J.; Lee, S.; Liu, K.-H.; Lee, S.-H.; Kim, S. Identification and Toxicity Evaluation of Water-Soluble Chemicals Generated by the Photooxidative Degradation of Expanded Polystyrene. Front. Environ. Sci. 2022, 10, 938120. [Google Scholar] [CrossRef]
- Mejía Torres, I.S.; Colín-Orozco, E.; Olayo, M.G.; Martínez, I.G.; Sánchez Pozos, M.; González Salgado, F.; Cruz, G.J. Carbonization, Hydrogenation and Oxidation in the Thermal Degradation of Expanded Polystyrene. J. Mater. Sci. 2018, 53, 2268–2276. [Google Scholar] [CrossRef]
- Huang, J.; Cheng, X.; Meng, H.; Pan, G.; Wang, S.; Wang, D. Density Functional Theory Study on the Catalytic Degradation Mechanism of Polystyrene. AIP Adv. 2020, 10, 085004. [Google Scholar] [CrossRef]
- Chen, L.; Tran, H.D.; Ramprasad, R. Atomistic Mechanisms for Chemical Defects Formation in Polyethylene. J. Chem. Phys. 2018, 149, 234902. [Google Scholar] [CrossRef] [PubMed]
- Lane, J.M.D.; Moore, N.W. Molecular and Kinetic Models for High-Rate Thermal Degradation of Polyethylene. J. Phys. Chem. A 2018, 122, 3962–3970. [Google Scholar] [CrossRef] [PubMed]
- Pires Da Mata Costa, L.; Brandão, A.L.T.; Pinto, J.C. Modeling of Polystyrene Degradation Using Kinetic Monte Carlo. J. Anal. Appl. Pyrolysis 2022, 167, 105683. [Google Scholar] [CrossRef]
- Ashraf, C.; van Duin, A.C.T. Extension of the ReaxFF Combustion Force Field toward Syngas Combustion and Initial Oxidation Kinetics. J. Phys. Chem. A 2017, 121, 1051–1068. [Google Scholar] [CrossRef]
- Chenoweth, K.; van Duin, A.C.T.; Goddard, W.A. ReaxFF Reactive Force Field for Molecular Dynamics Simulations of Hydrocarbon Oxidation. J. Phys. Chem. A 2008, 112, 1040–1053. [Google Scholar] [CrossRef]
- Panczyk, T.; Nieszporek, K. Formation of Degraded LDPE Surfaces Using Mechanical Cleavage and Shock Compression Analyzed by Means of Molecular Dynamics Simulations. Comput. Mater. Sci. 2023, 230, 112522. [Google Scholar] [CrossRef]
- Panczyk, T.; Nieszporek, K.; Wolski, P. Surface Chemistry of Degraded Polyethylene Terephthalate (PET): Insights from Reactive Molecular Dynamics Study. Appl. Surf. Sci. 2024, 654, 159493. [Google Scholar] [CrossRef]
- Panczyk, T.; Nieszporek, K.; Wolski, P. Modeling the Degradation of Polypropylene and Polystyrene under Shock Compression and Mechanical Cleaving Using the ReaxFF Force Field. Chemosphere 2024, 357, 142056. [Google Scholar] [CrossRef]
- Rice, B.M.; Byrd, E.F.C. Theoretical Study of Shocked Formic Acid: Born–Oppenheimer MD Calculations of the Shock Hugoniot and Early-Stage Chemistry. J. Phys. Chem. B 2016, 120, 1711–1719. [Google Scholar] [CrossRef]
- Hamilton, B.W.; Kroonblawd, M.P.; Strachan, A. Extemporaneous Mechanochemistry: Shock-Wave-Induced Ultrafast Chemical Reactions Due to Intramolecular Strain Energy. J. Phys. Chem. Lett. 2022, 13, 6657–6663. [Google Scholar] [CrossRef]
- Yamaguchi, M.; Takahashi, M. Rheological Properties of Low-Density Polyethylenes Produced by Tubular and Vessel Processes. Polymer 2001, 42, 8663–8670. [Google Scholar] [CrossRef]
- Malpass, D.B. Introduction to Industrial Polyethylene: Properties, Catalysts, Processes; Scrivener; Wiley: Salem, MA, USA; Hoboken, NJ, USA, 2010; ISBN 978-0-470-62598-9. [Google Scholar]
- Sousa da Silva, A.W.; Vranken, W.F. ACPYPE—AnteChamber PYthon Parser interfacE. BMC Res. Notes 2012, 5, 367. [Google Scholar] [CrossRef] [PubMed]
- Zhang, W.; van Duin, A.C.T. Improvement of the ReaxFF Description for Functionalized Hydrocarbon/Water Weak Interactions in the Condensed Phase. J. Phys. Chem. B 2018, 122, 4083–4092. [Google Scholar] [CrossRef] [PubMed]
- Monti, S.; Corozzi, A.; Fristrup, P.; Joshi, K.L.; Shin, Y.K.; Oelschlaeger, P.; van Duin, A.C.T.; Barone, V. Exploring the Conformational and Reactive Dynamics of Biomolecules in Solution Using an Extended Version of the Glycine Reactive Force Field. Phys. Chem. Chem. Phys. 2013, 15, 15062. [Google Scholar] [CrossRef]
- Gewert, B.; Plassmann, M.M.; MacLeod, M. Pathways for Degradation of Plastic Polymers Floating in the Marine Environment. Environ. Sci. Process. Impacts 2015, 17, 1513–1521. [Google Scholar] [CrossRef]
- Zhang, K.; Hamidian, A.H.; Tubić, A.; Zhang, Y.; Fang, J.K.H.; Wu, C.; Lam, P.K.S. Understanding Plastic Degradation and Microplastic Formation in the Environment: A Review. Environ. Pollut. 2021, 274, 116554. [Google Scholar] [CrossRef]
- Yan, M.; Harnish, B. A Simple Method for the Attachment of Polymer Films on Solid Substrates. Adv. Mater. 2003, 15, 244–248. [Google Scholar] [CrossRef]
- Ravelo, R.; Holian, B.; Germann, T.; Lomdahl, P. Constant-Stress Hugoniostat Method for Following the Dynamical Evolution of Shocked Matter. Phys. Rev. B 2004, 70, 014103. [Google Scholar] [CrossRef]
- Mattsson, T.R.; Lane, J.M.D.; Cochrane, K.R.; Desjarlais, M.P.; Thompson, A.P.; Pierce, F.; Grest, G.S. First-Principles and Classical Molecular Dynamics Simulation of Shocked Polymers. Phys. Rev. B 2010, 81, 054103. [Google Scholar] [CrossRef]
- Thompson, A.P.; Aktulga, H.M.; Berger, R.; Bolintineanu, D.S.; Brown, W.M.; Crozier, P.S.; In ’T Veld, P.J.; Kohlmeyer, A.; Moore, S.G.; Nguyen, T.D.; et al. LAMMPS—A Flexible Simulation Tool for Particle-Based Materials Modeling at the Atomic, Meso, and Continuum Scales. Comput. Phys. Commun. 2022, 271, 108171. [Google Scholar] [CrossRef]
- Case, D.A.; Aktulga, H.M.; Belfon, K.; Cerutti, D.S.; Cisneros, G.A.; Cruzeiro, V.W.D.; Forouzesh, N.; Giese, T.J.; Götz, A.W.; Gohlke, H.; et al. AmberTools. J. Chem. Inf. Model. 2023, 63, 6183–6191. [Google Scholar] [CrossRef] [PubMed]
- Dupradeau, F.-Y.; Pigache, A.; Zaffran, T.; Savineau, C.; Lelong, R.; Grivel, N.; Lelong, D.; Rosanski, W.; Cieplak, P. The R.E.D. Tools: Advances in RESP and ESP Charge Derivation and Force Field Library Building. Phys. Chem. Chem. Phys. 2010, 12, 7821. [Google Scholar] [CrossRef] [PubMed]
- Rappe, A.K.; Goddard, W.A. Charge Equilibration for Molecular Dynamics Simulations. J. Phys. Chem. 1991, 95, 3358–3363. [Google Scholar] [CrossRef]


| Initial State | Compression Pressure | ||||
|---|---|---|---|---|---|
| 30 GPa | 40 GPa | 50 GPa | |||
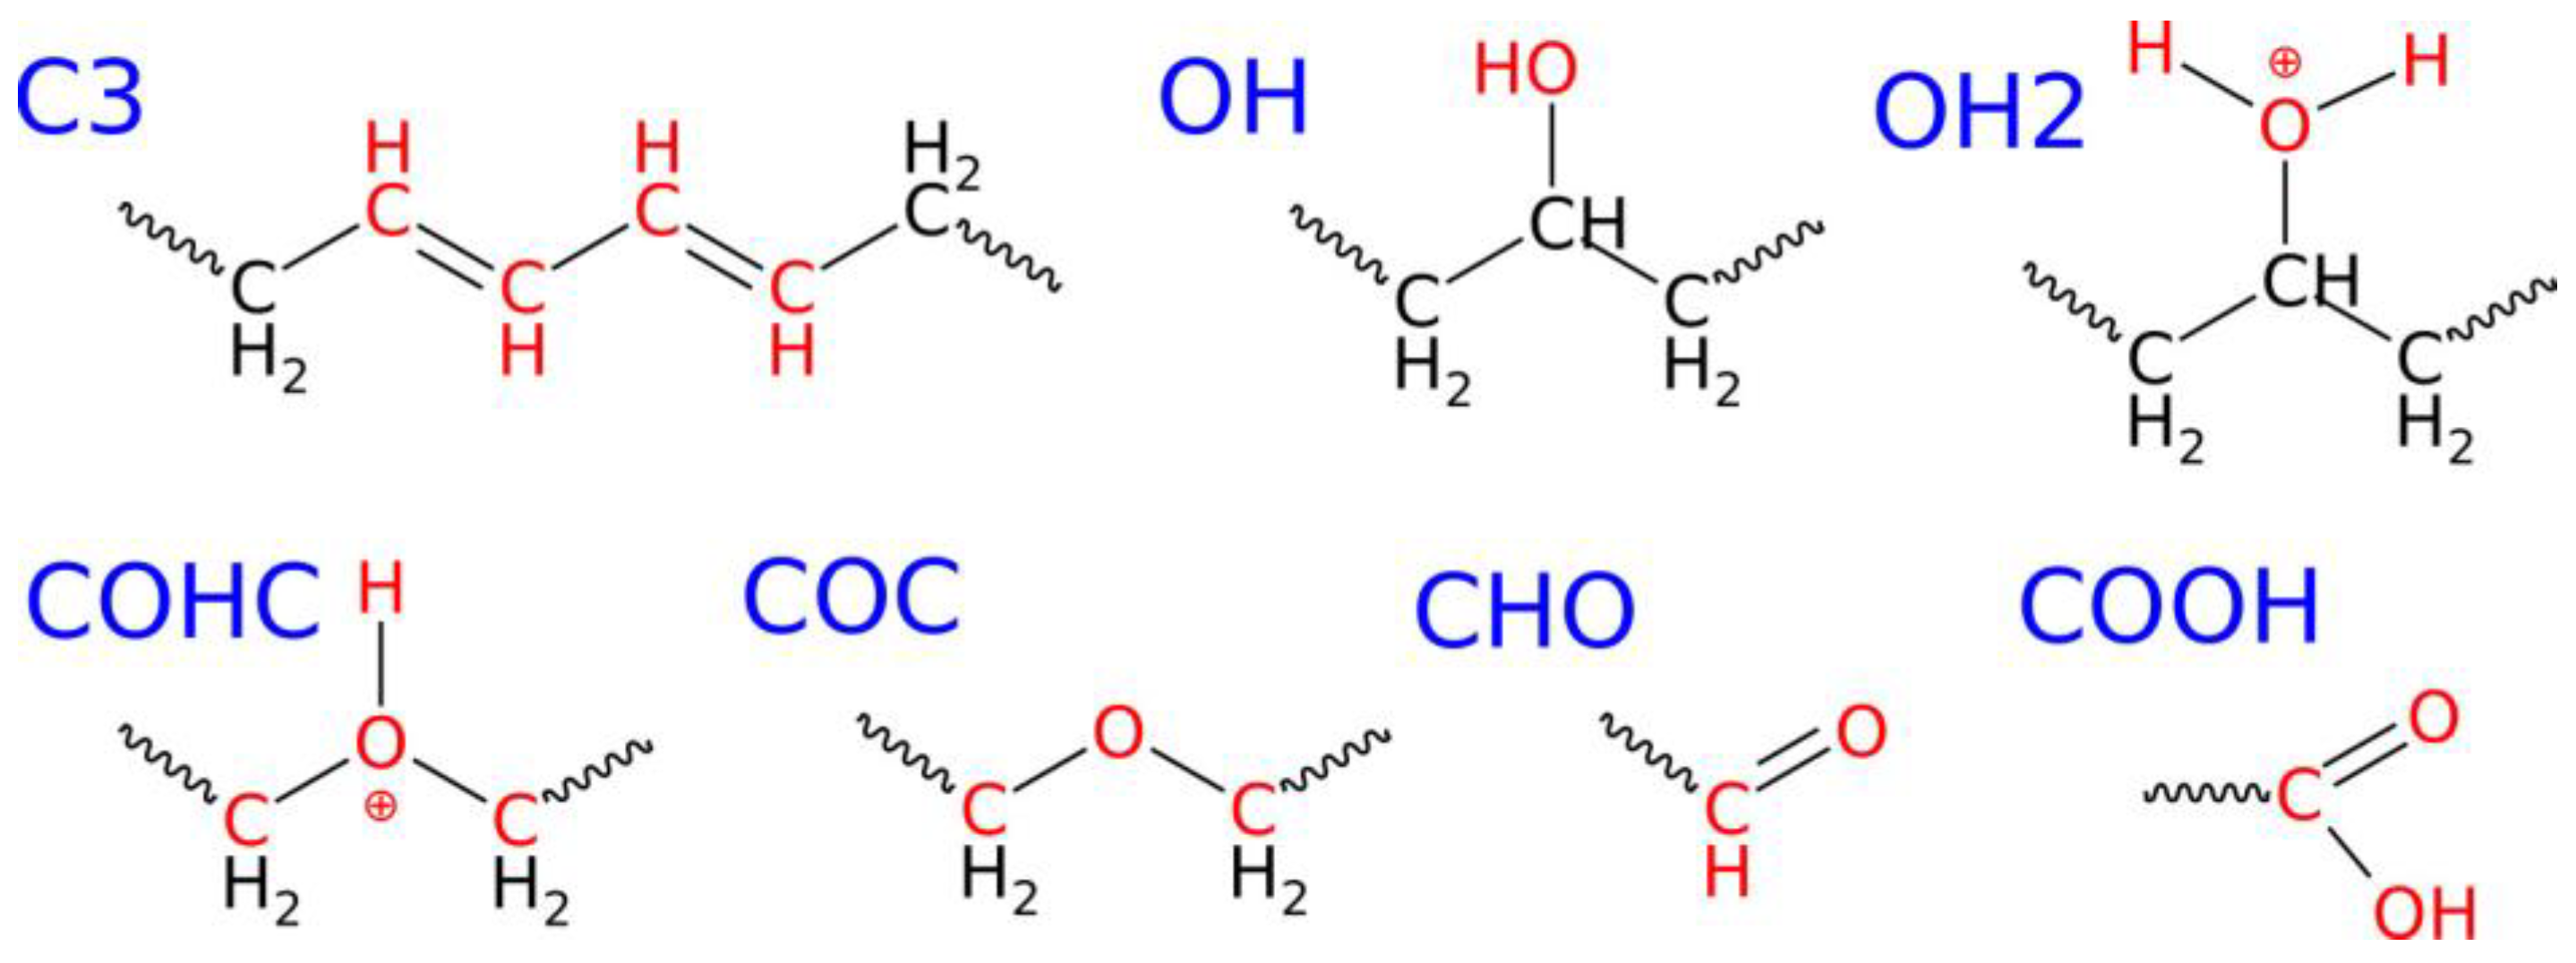
| New chemical connections/ functional groups within/on the nanoparticle | C3 | 0 | 0 | 8 | 47 |
| OH | 0 | 7 | 61 | 96 | |
| OH2 | 0 | 0 | 2 | 6 | |
| COHC | 0 | 0 | 0 | 1 | |
| COC | 0 | 0 | 1 | 16 | |
| CHO | 0 | 0 | 0 | 4 | |
| COOH | 0 | 0 | 0 | 1 | |
| Gyration radius, Rg, Å | 14.66 | 14.74 | 14.86 | 14.51 | |
| Solvent Accessible Surface Area, SASA, Å2 | 7091 | 7152 | 7376 | 6944 | |
| Stoichiometry and molar mass | C975H1952; 13,678 g mol−1 | C975H1943O8H7; 13,804 g mol−1 | C962H1835O68H74; 14,566 g mol−1 | C882H1440O125H245; 14,292 g mol−1 | |
| Other fragmentation products | none | none | C13H24O2H2 | C30H43O5H16; C24H33O6H12; C17H28O5H9; C9H19OH; C6H10O2H3; C2H4O2H2; C2H5OH; CHH3 | |
| Initial State | Compression Pressure | ||||
|---|---|---|---|---|---|
| 20 GPa | 30 GPa | 40 GPa | |||
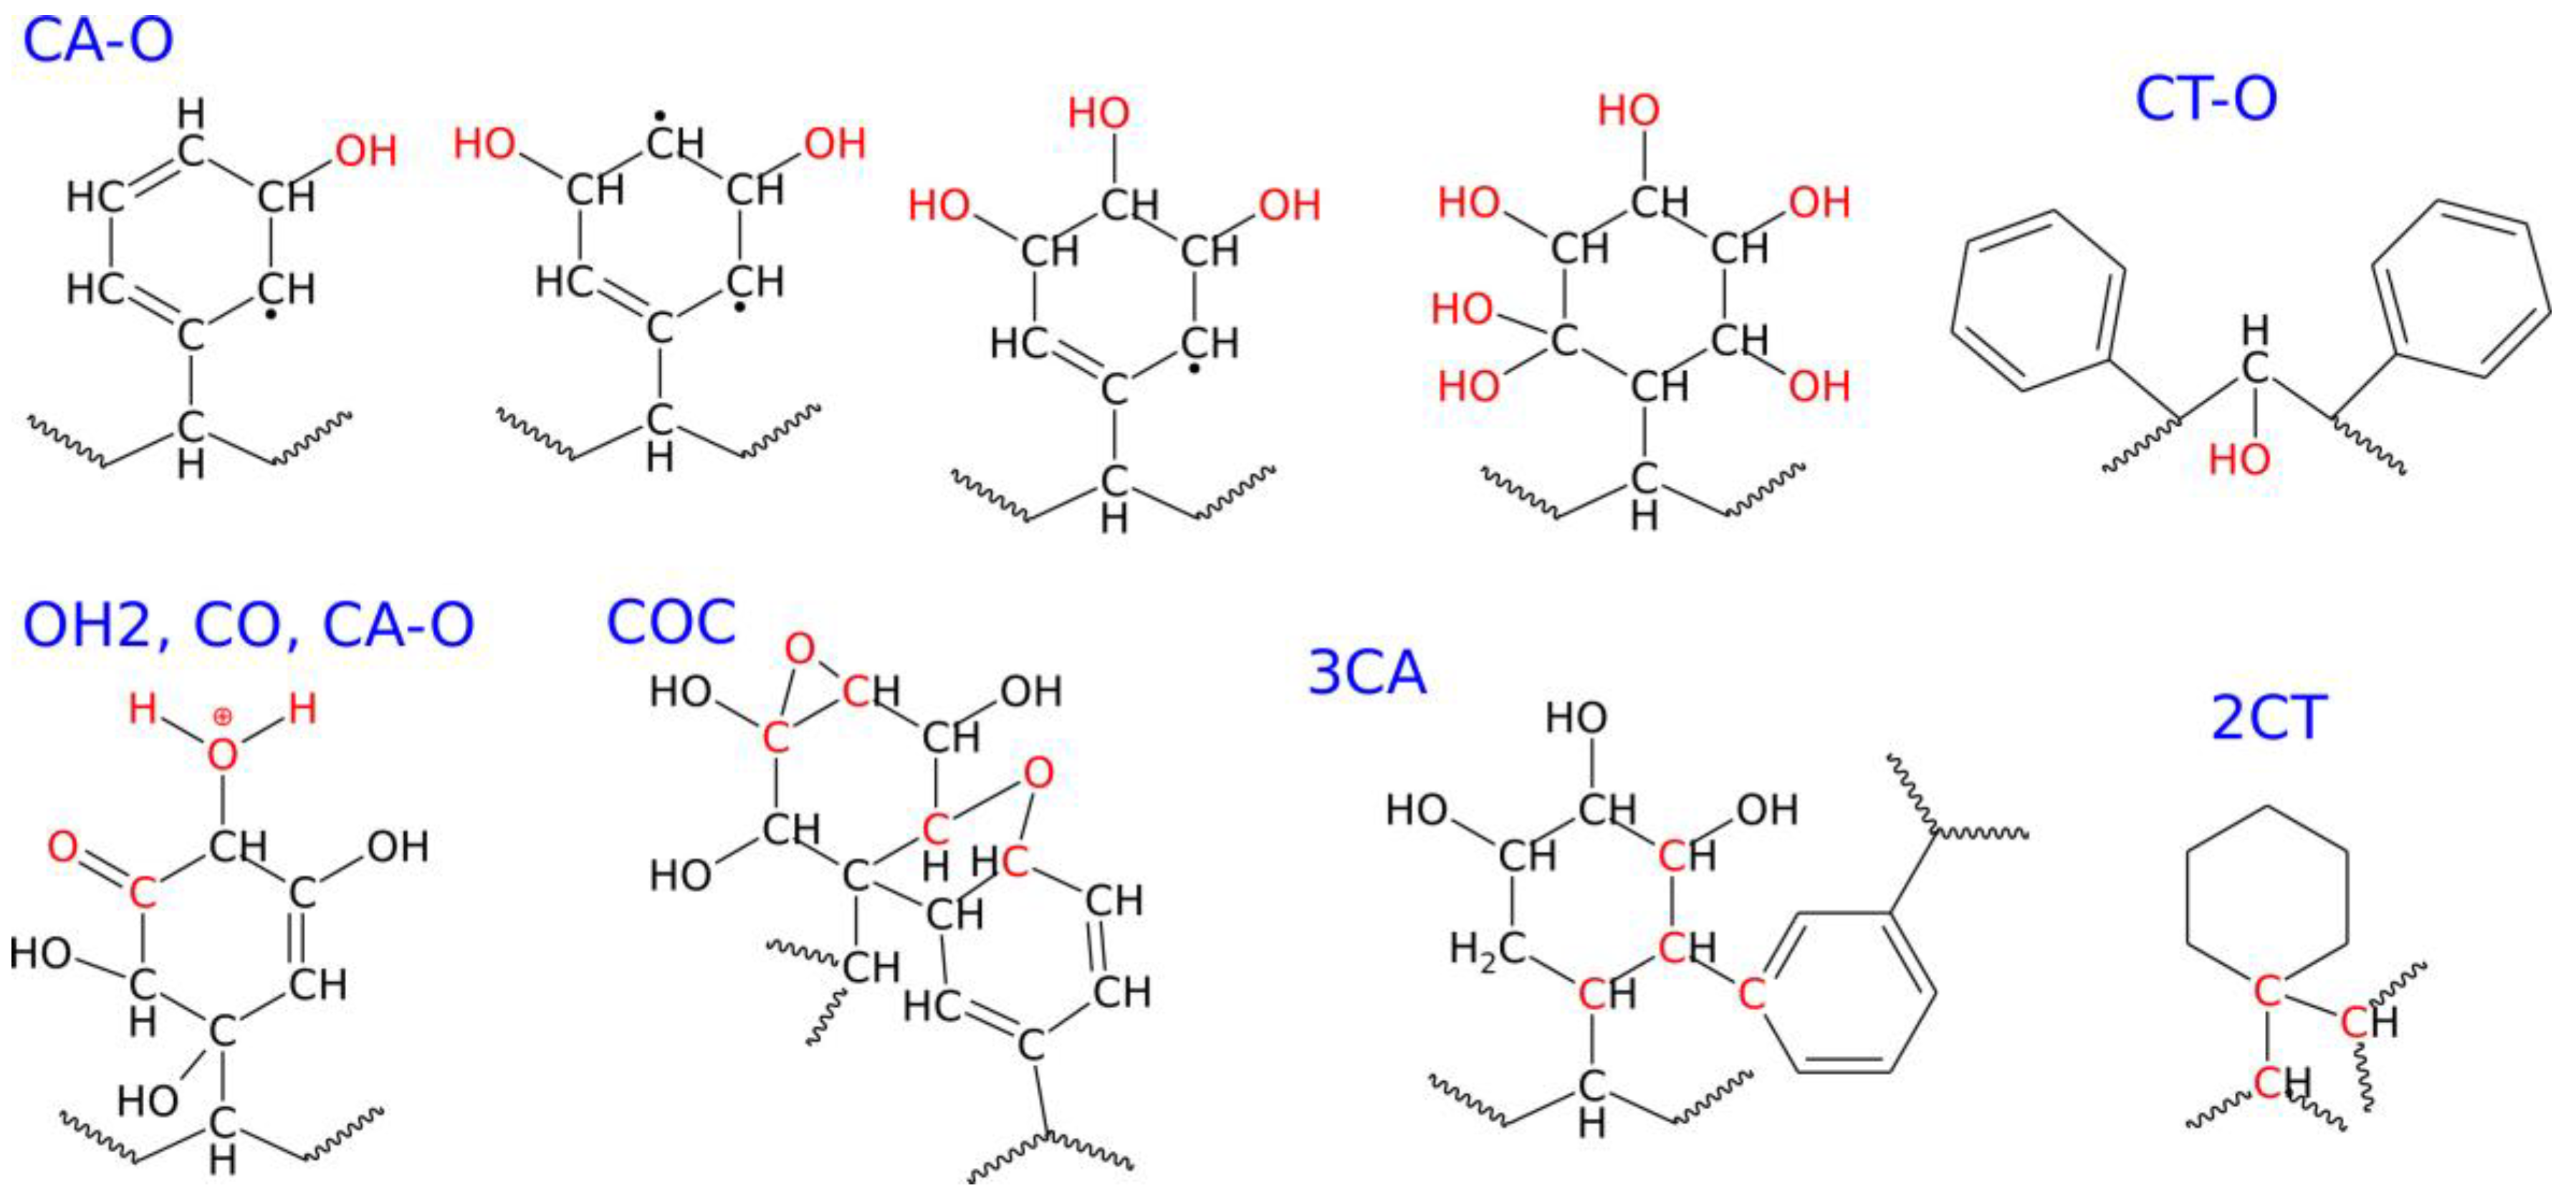
| New chemical connections/ functional groups within/on the nanoparticle | CA–O | 0 | 6 | 179 | 319 |
| CT–O | 0 | 1 | 8 | 52 | |
| OH | 0 | 7 | 156 | 246 | |
| OH2 | 0 | 0 | 11 | 55 | |
| COHC | 0 | 0 | 0 | 1 | |
| COC | 0 | 0 | 6 | 23 | |
| CO | 0 | 0 | 8 | 19 | |
| CHO | 0 | 0 | 0 | 2 | |
| COOH | 0 | 0 | 0 | 1 | |
| 3CA | 0 | 0 | 48 | 338 | |
| 2CT | 0 | 0 | 0 | 11 | |
| Gyration radius, Rg, Å | 15.74 | 15.78 | 16.45 | 14.68 | |
| Solvent Accessible Surface Area, SASA, Å2 | 9250 | 9173 | 9632 | 7471 | |
| Stoichiometry and molar mass | C1546H1550; 20,131 g mol−1 | C1546H1550O7H6; 20,249 g mol−1 | C1546H1484O181H181; 23,143 g mol−1 | C1538H1195O346H566; 25,783 g mol−1 | |
| Other fragmentation products | none | none | none | C3HO5H7; CHO3H3; COH3; CHOH; | |
Disclaimer/Publisher’s Note: The statements, opinions and data contained in all publications are solely those of the individual author(s) and contributor(s) and not of MDPI and/or the editor(s). MDPI and/or the editor(s) disclaim responsibility for any injury to people or property resulting from any ideas, methods, instructions or products referred to in the content. |
© 2025 by the authors. Licensee MDPI, Basel, Switzerland. This article is an open access article distributed under the terms and conditions of the Creative Commons Attribution (CC BY) license (https://creativecommons.org/licenses/by/4.0/).
Share and Cite
Panczyk, T.; Cichy, M.; Panczyk, M. Shock Wave-Induced Degradation of Polyethylene and Polystyrene: A Reactive Molecular Dynamics Study on Nanoplastic Transformation in Aqueous Environments. Molecules 2025, 30, 2164. https://doi.org/10.3390/molecules30102164
Panczyk T, Cichy M, Panczyk M. Shock Wave-Induced Degradation of Polyethylene and Polystyrene: A Reactive Molecular Dynamics Study on Nanoplastic Transformation in Aqueous Environments. Molecules. 2025; 30(10):2164. https://doi.org/10.3390/molecules30102164
Chicago/Turabian StylePanczyk, Tomasz, Marcin Cichy, and Monika Panczyk. 2025. "Shock Wave-Induced Degradation of Polyethylene and Polystyrene: A Reactive Molecular Dynamics Study on Nanoplastic Transformation in Aqueous Environments" Molecules 30, no. 10: 2164. https://doi.org/10.3390/molecules30102164
APA StylePanczyk, T., Cichy, M., & Panczyk, M. (2025). Shock Wave-Induced Degradation of Polyethylene and Polystyrene: A Reactive Molecular Dynamics Study on Nanoplastic Transformation in Aqueous Environments. Molecules, 30(10), 2164. https://doi.org/10.3390/molecules30102164