

Anti-Psoriatic Activity of Black, Green and White Tea Extracts from Southeastern China

Abstract
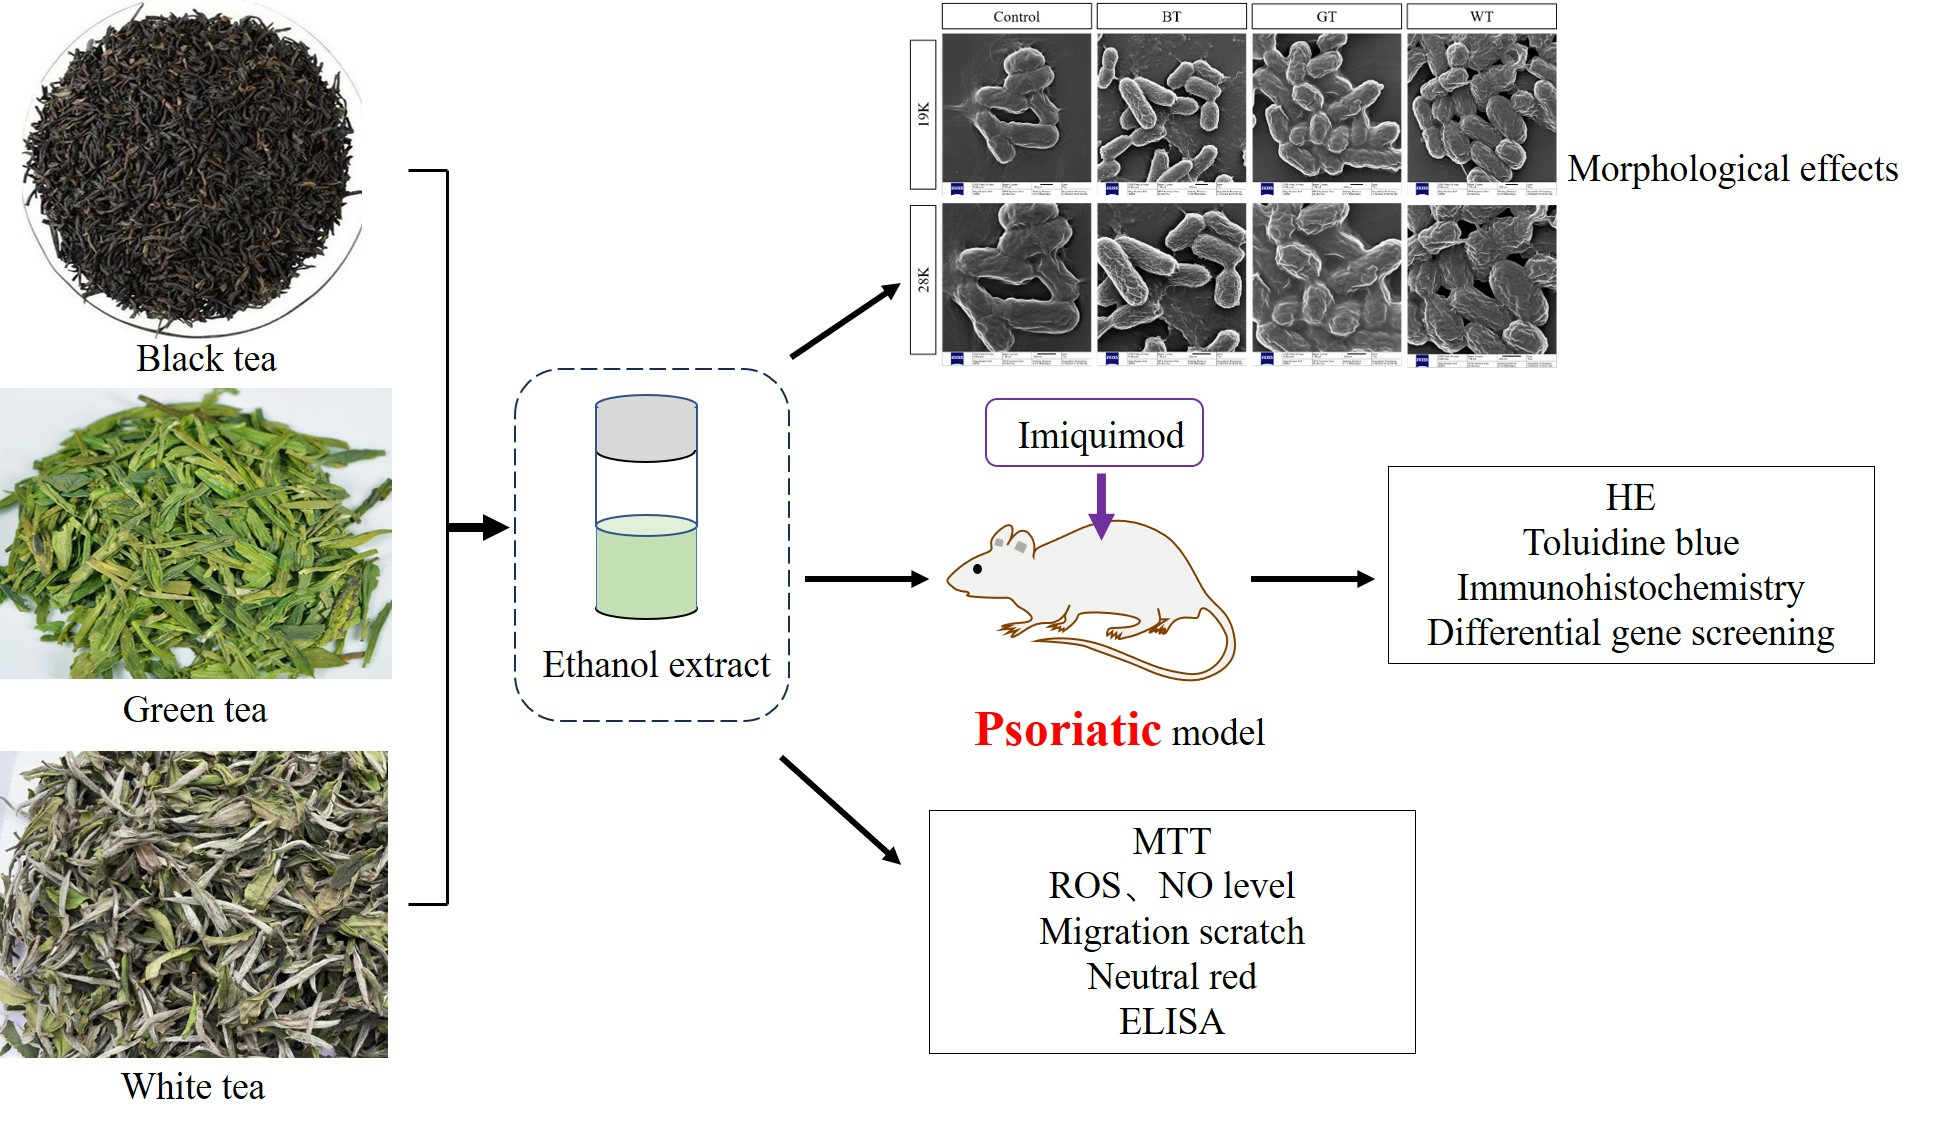
1. Introduction
2. Results
2.1. Experimental Result
2.1.1. Chemical Composition of Ethanol Extract of Three Kinds of Tea
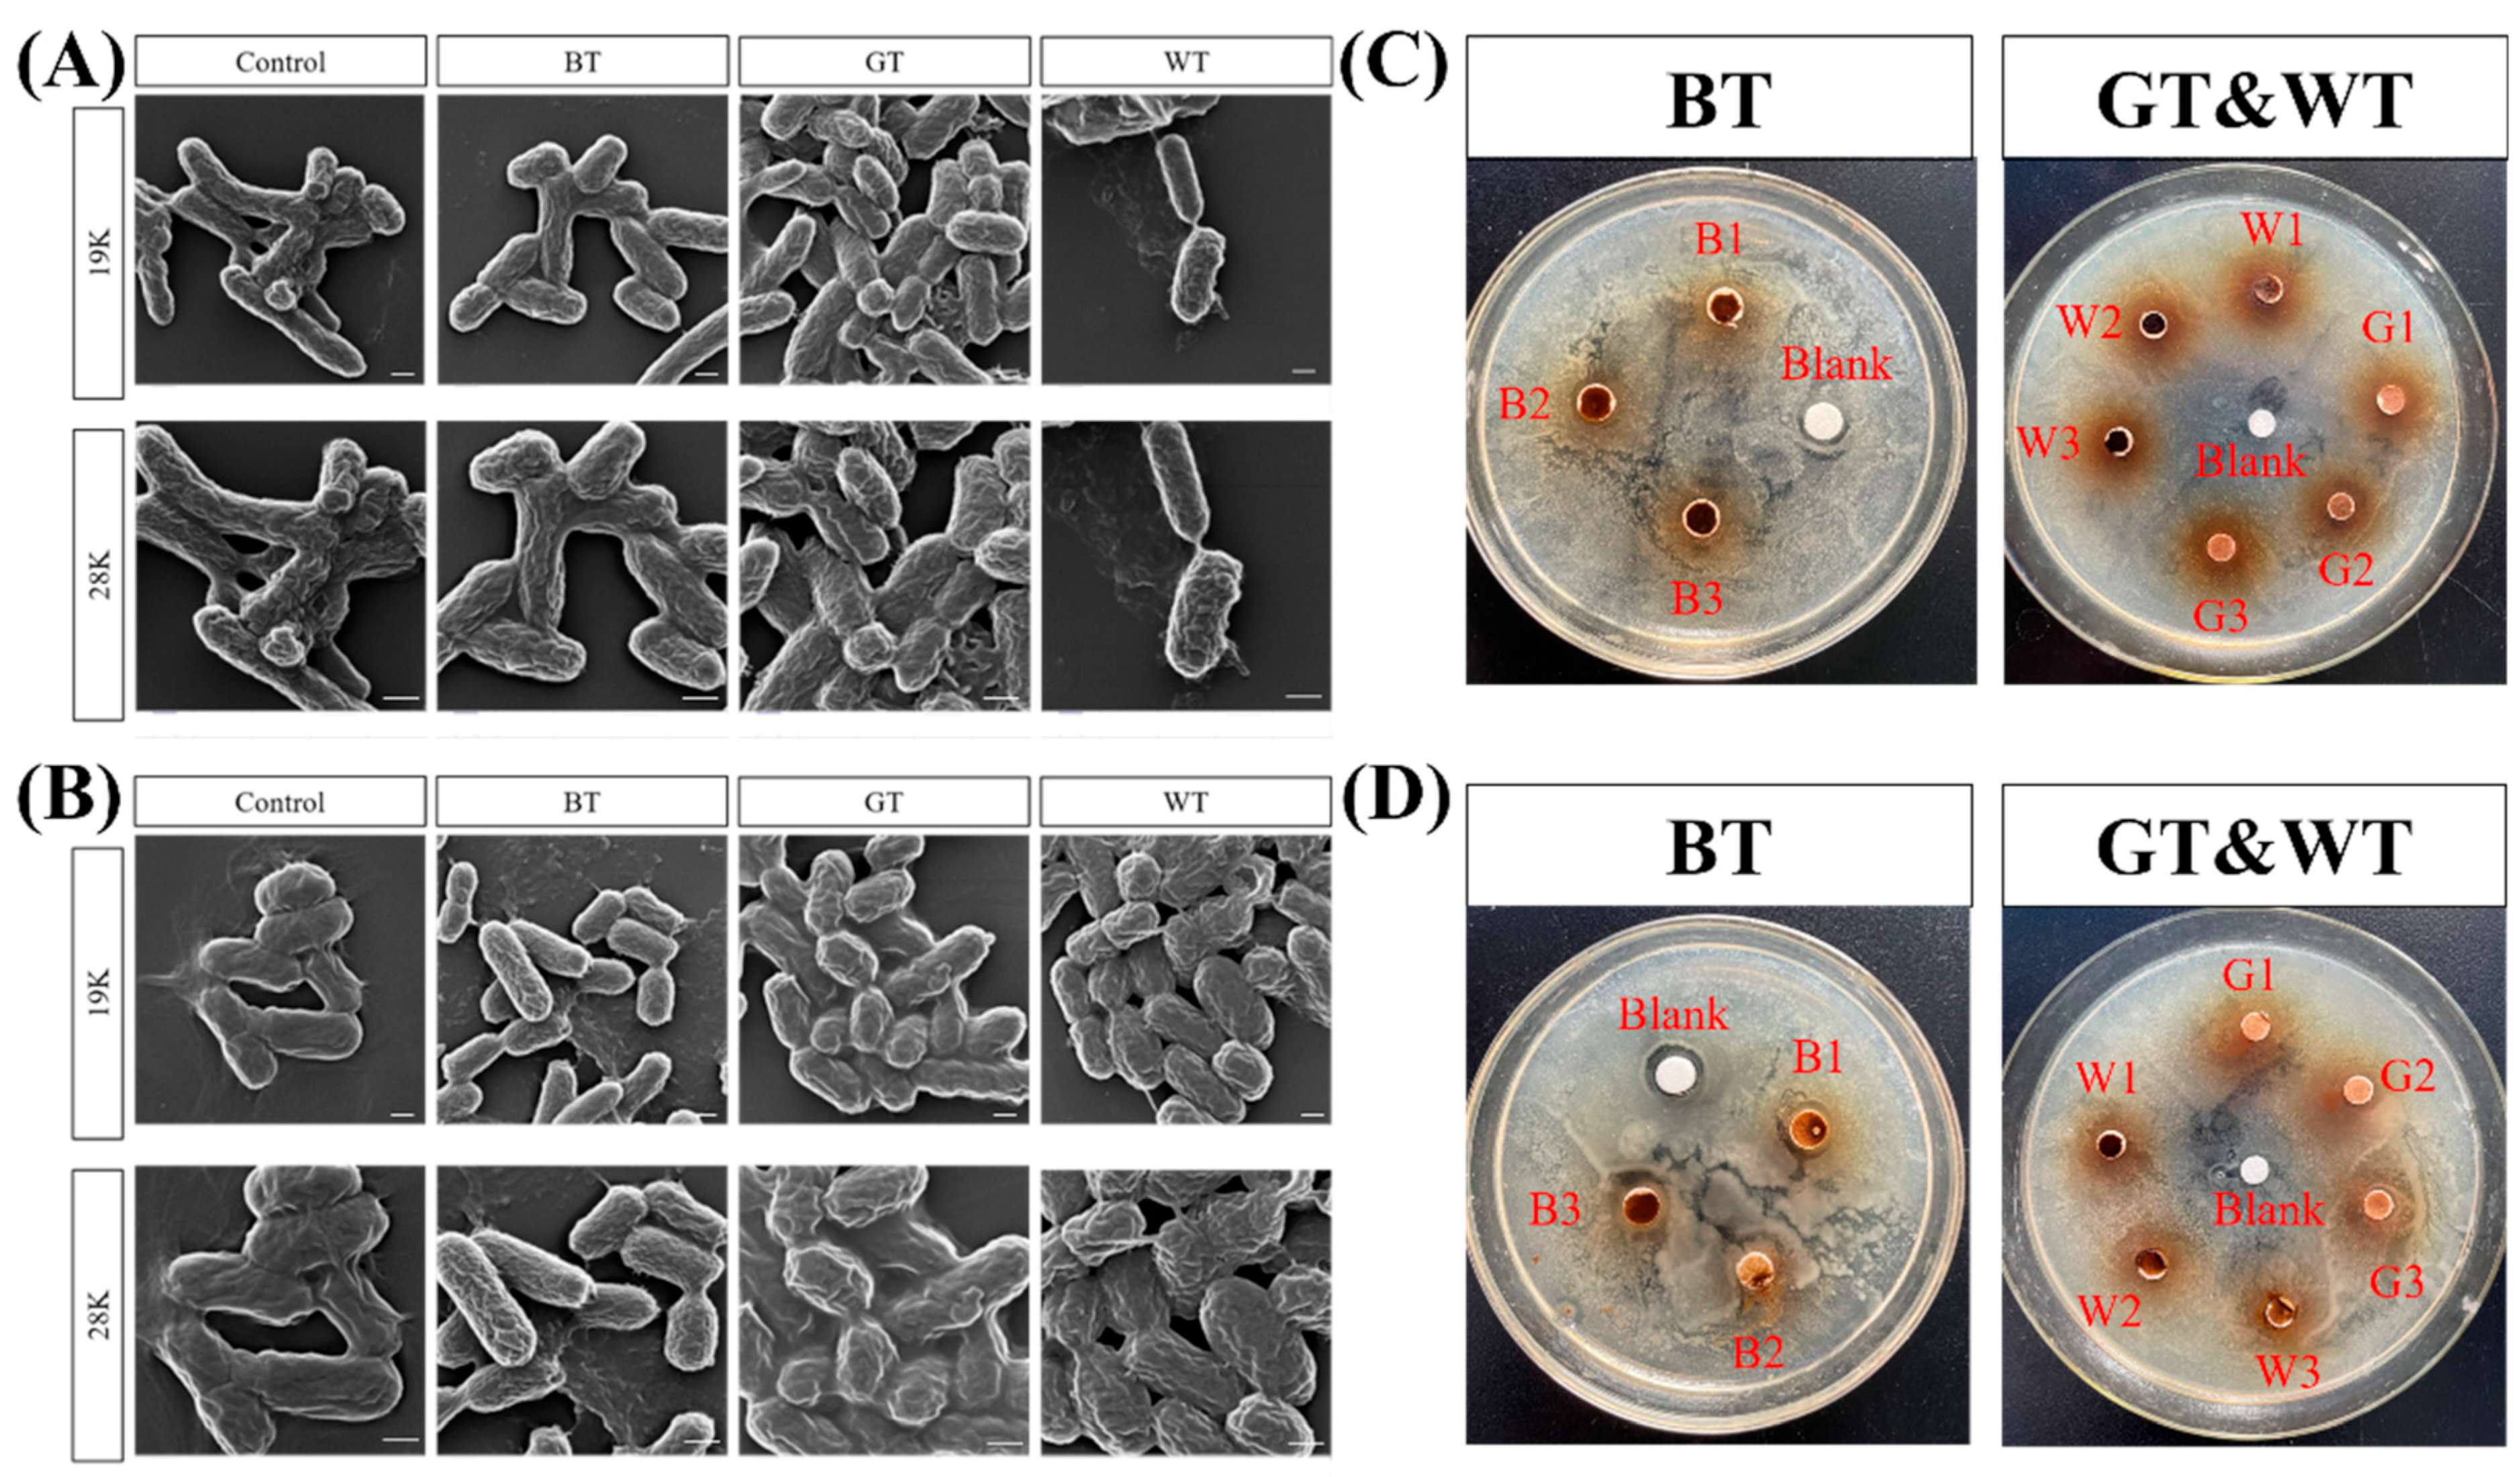
2.1.2. Antibacterial Ability
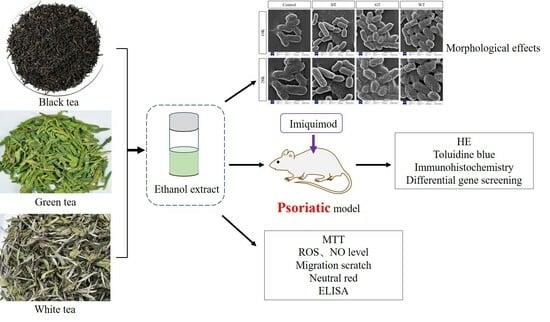
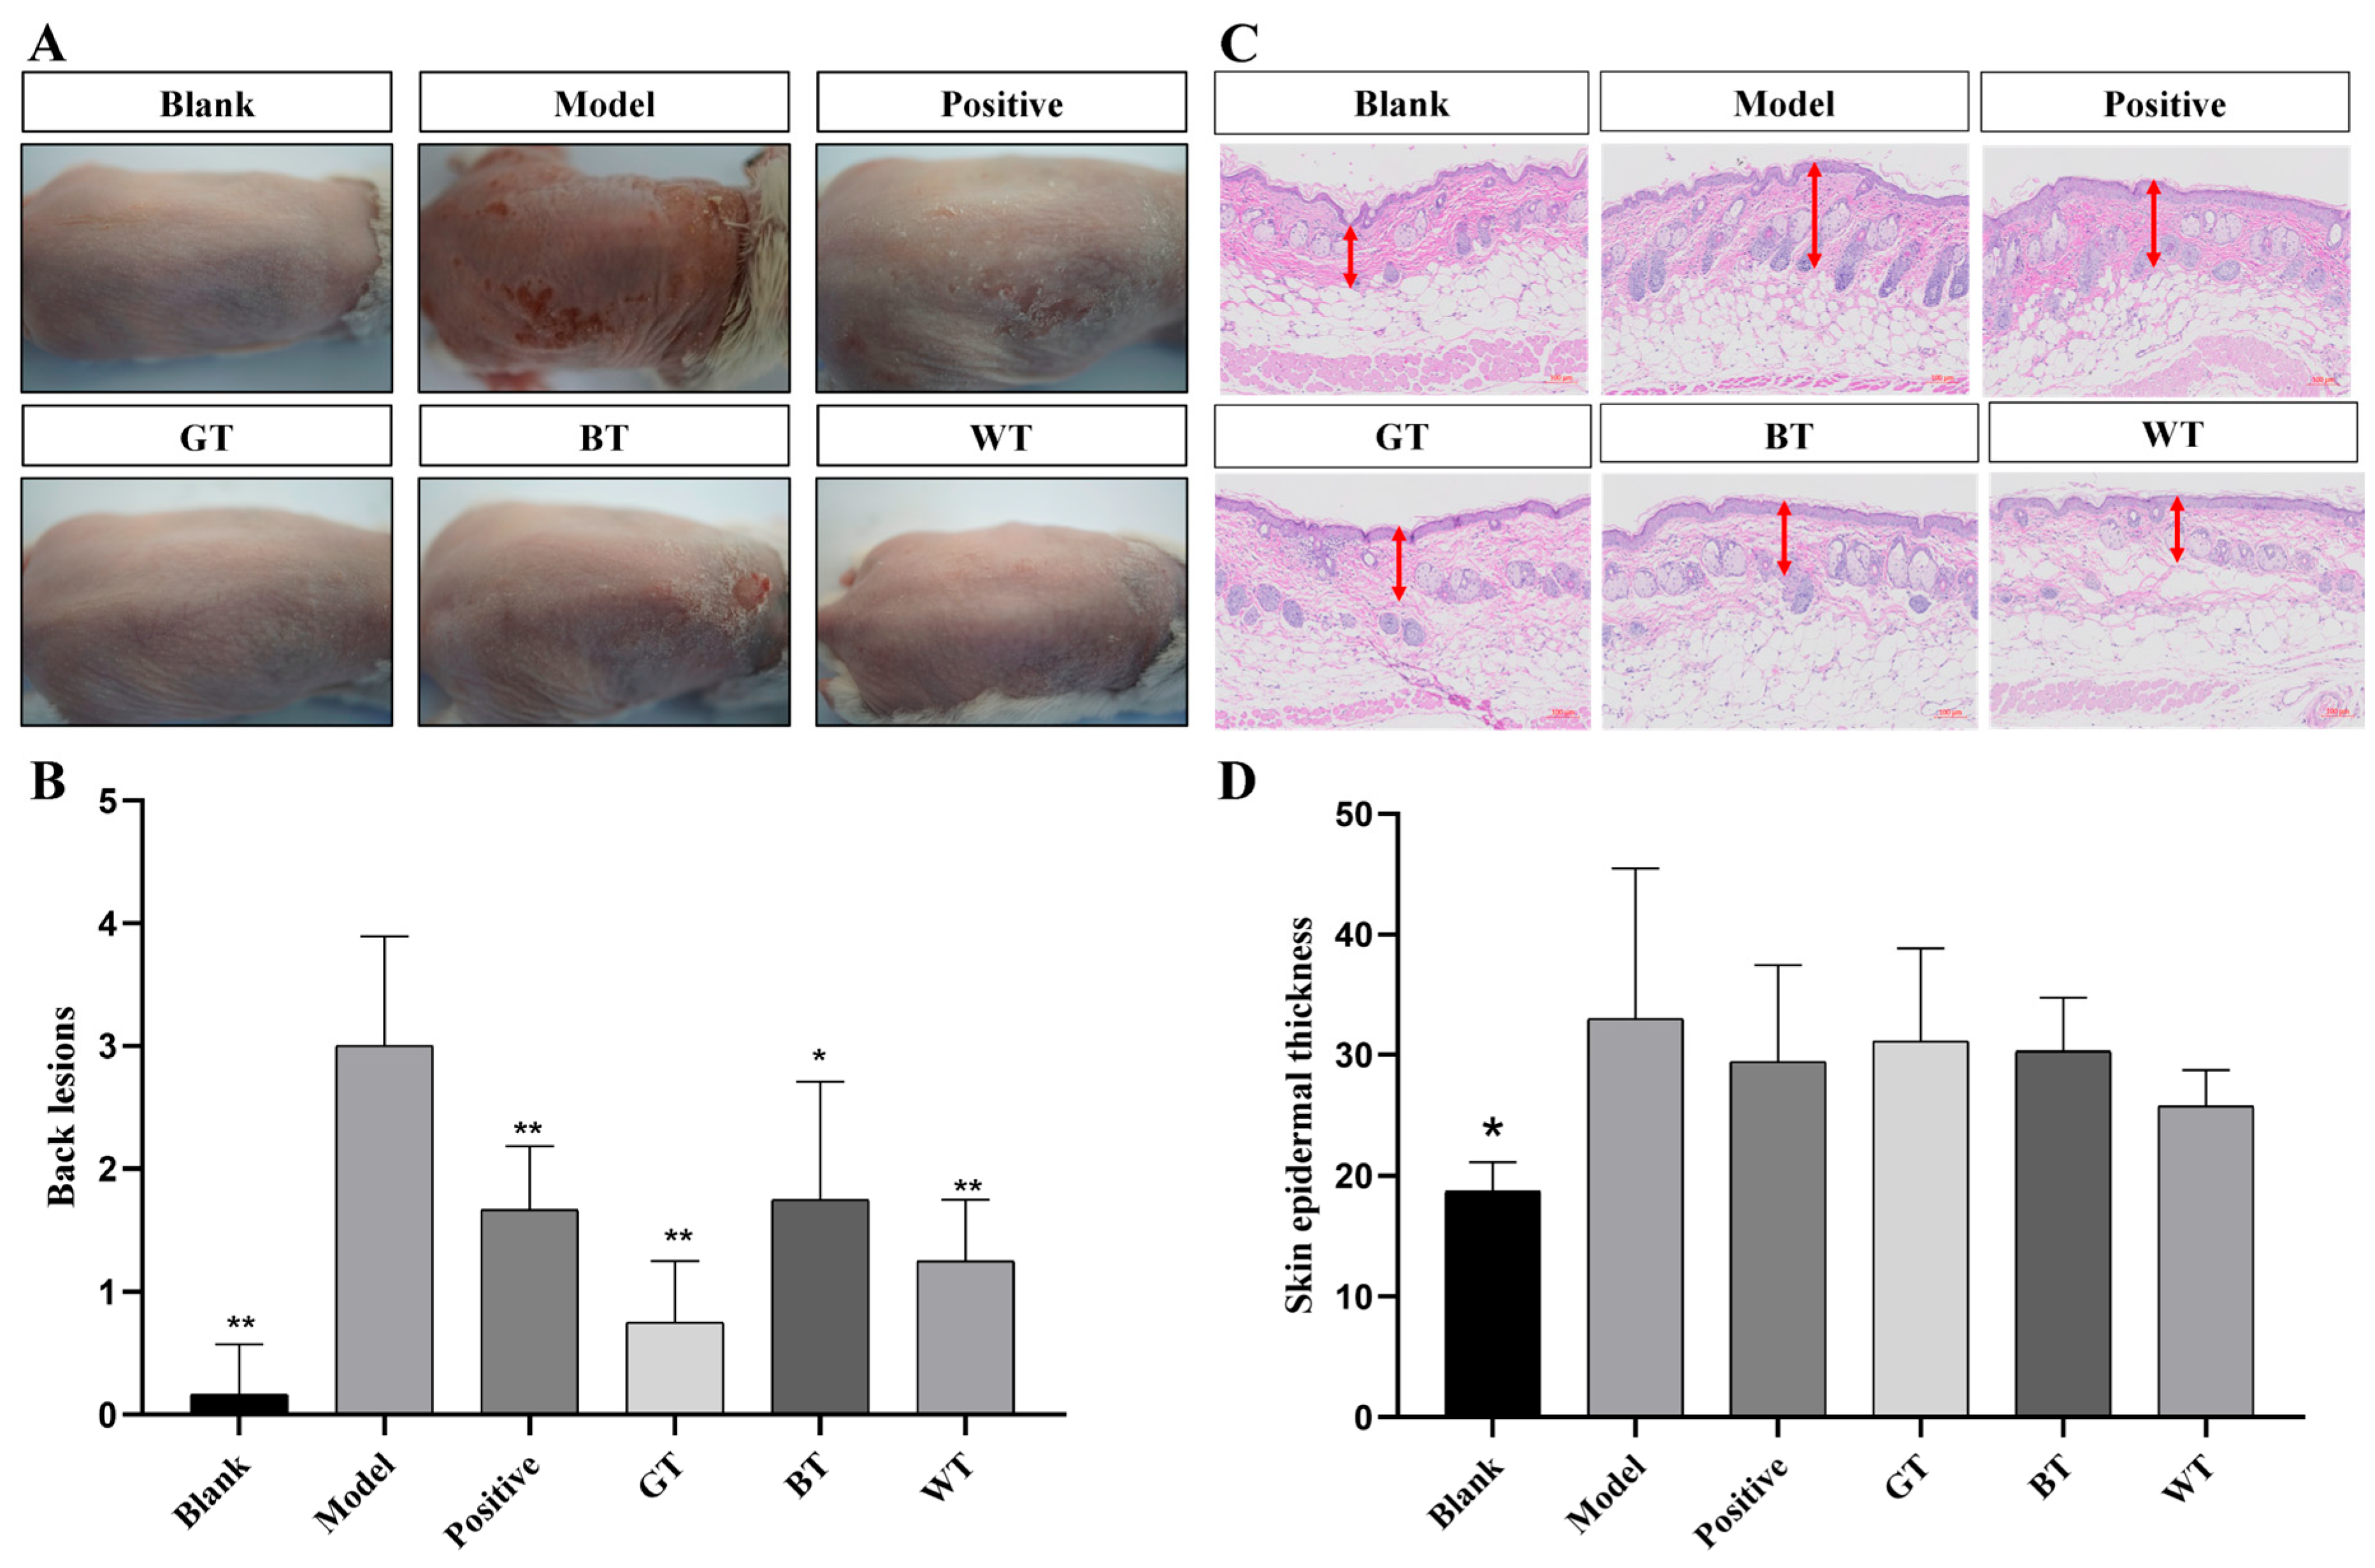
2.1.3. Animal Experiments
Apparent Skin Evaluation and HE Staining
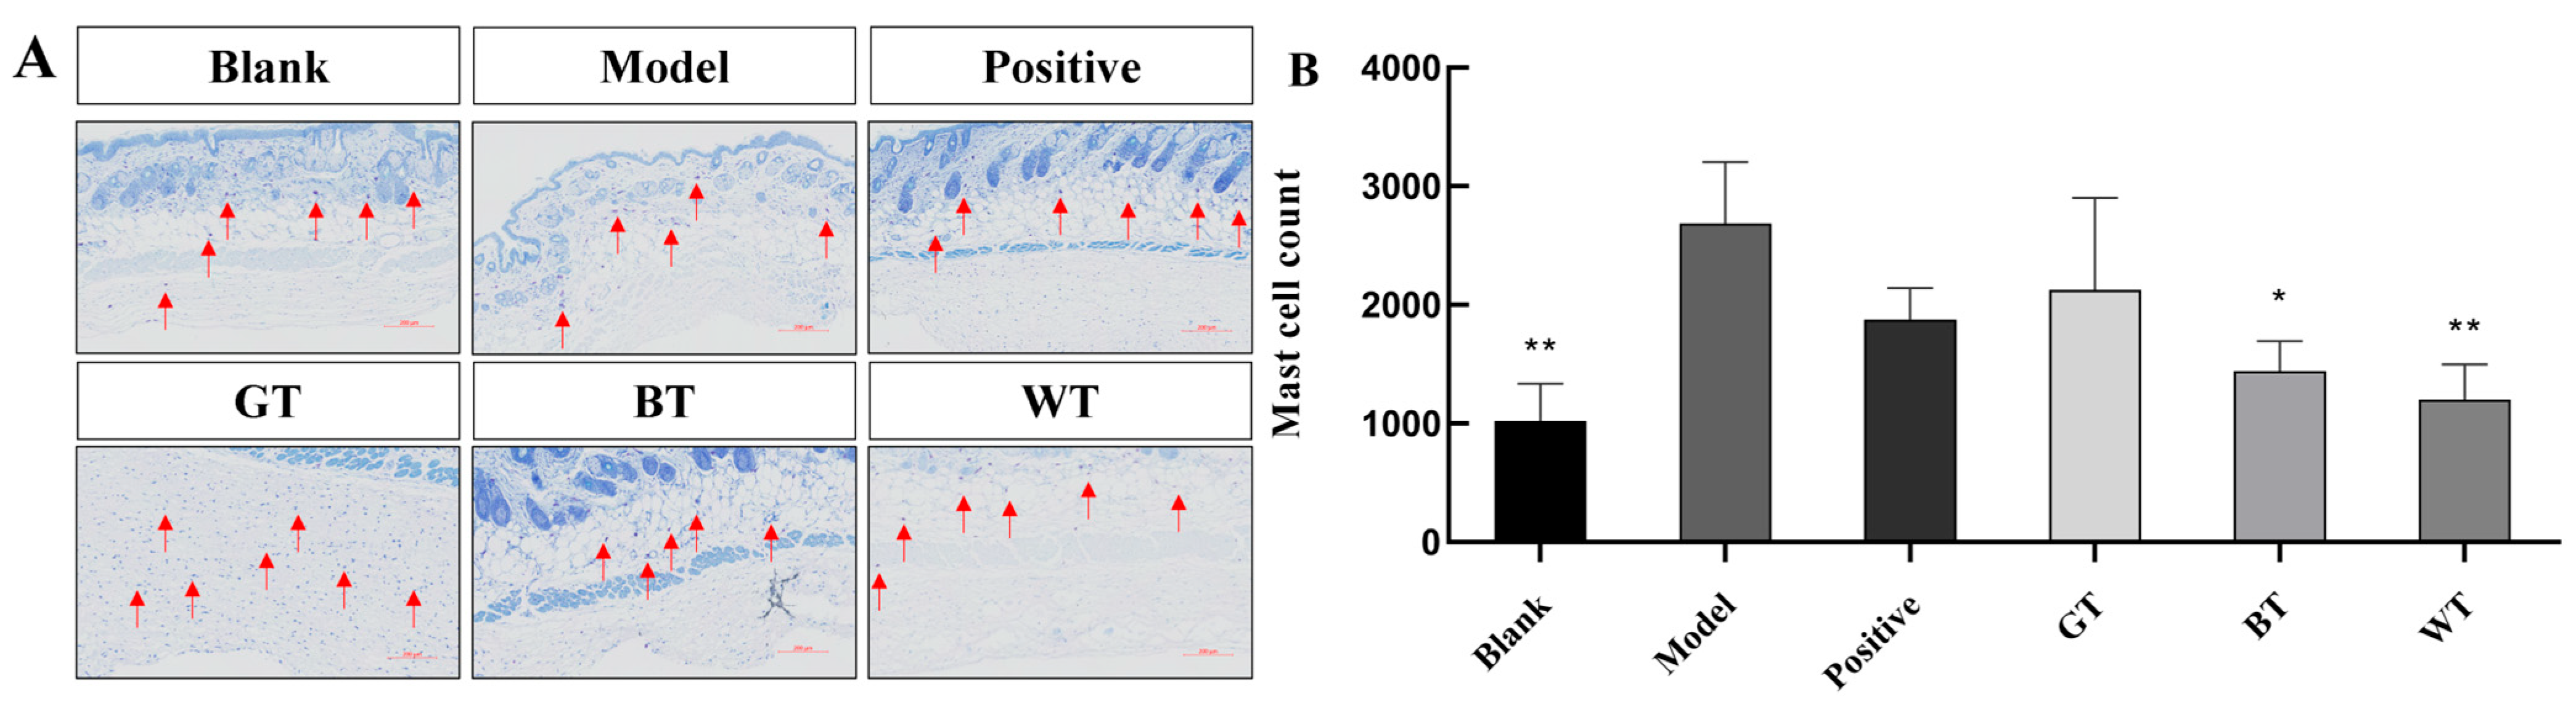
Skin Toluidine Blue Staining
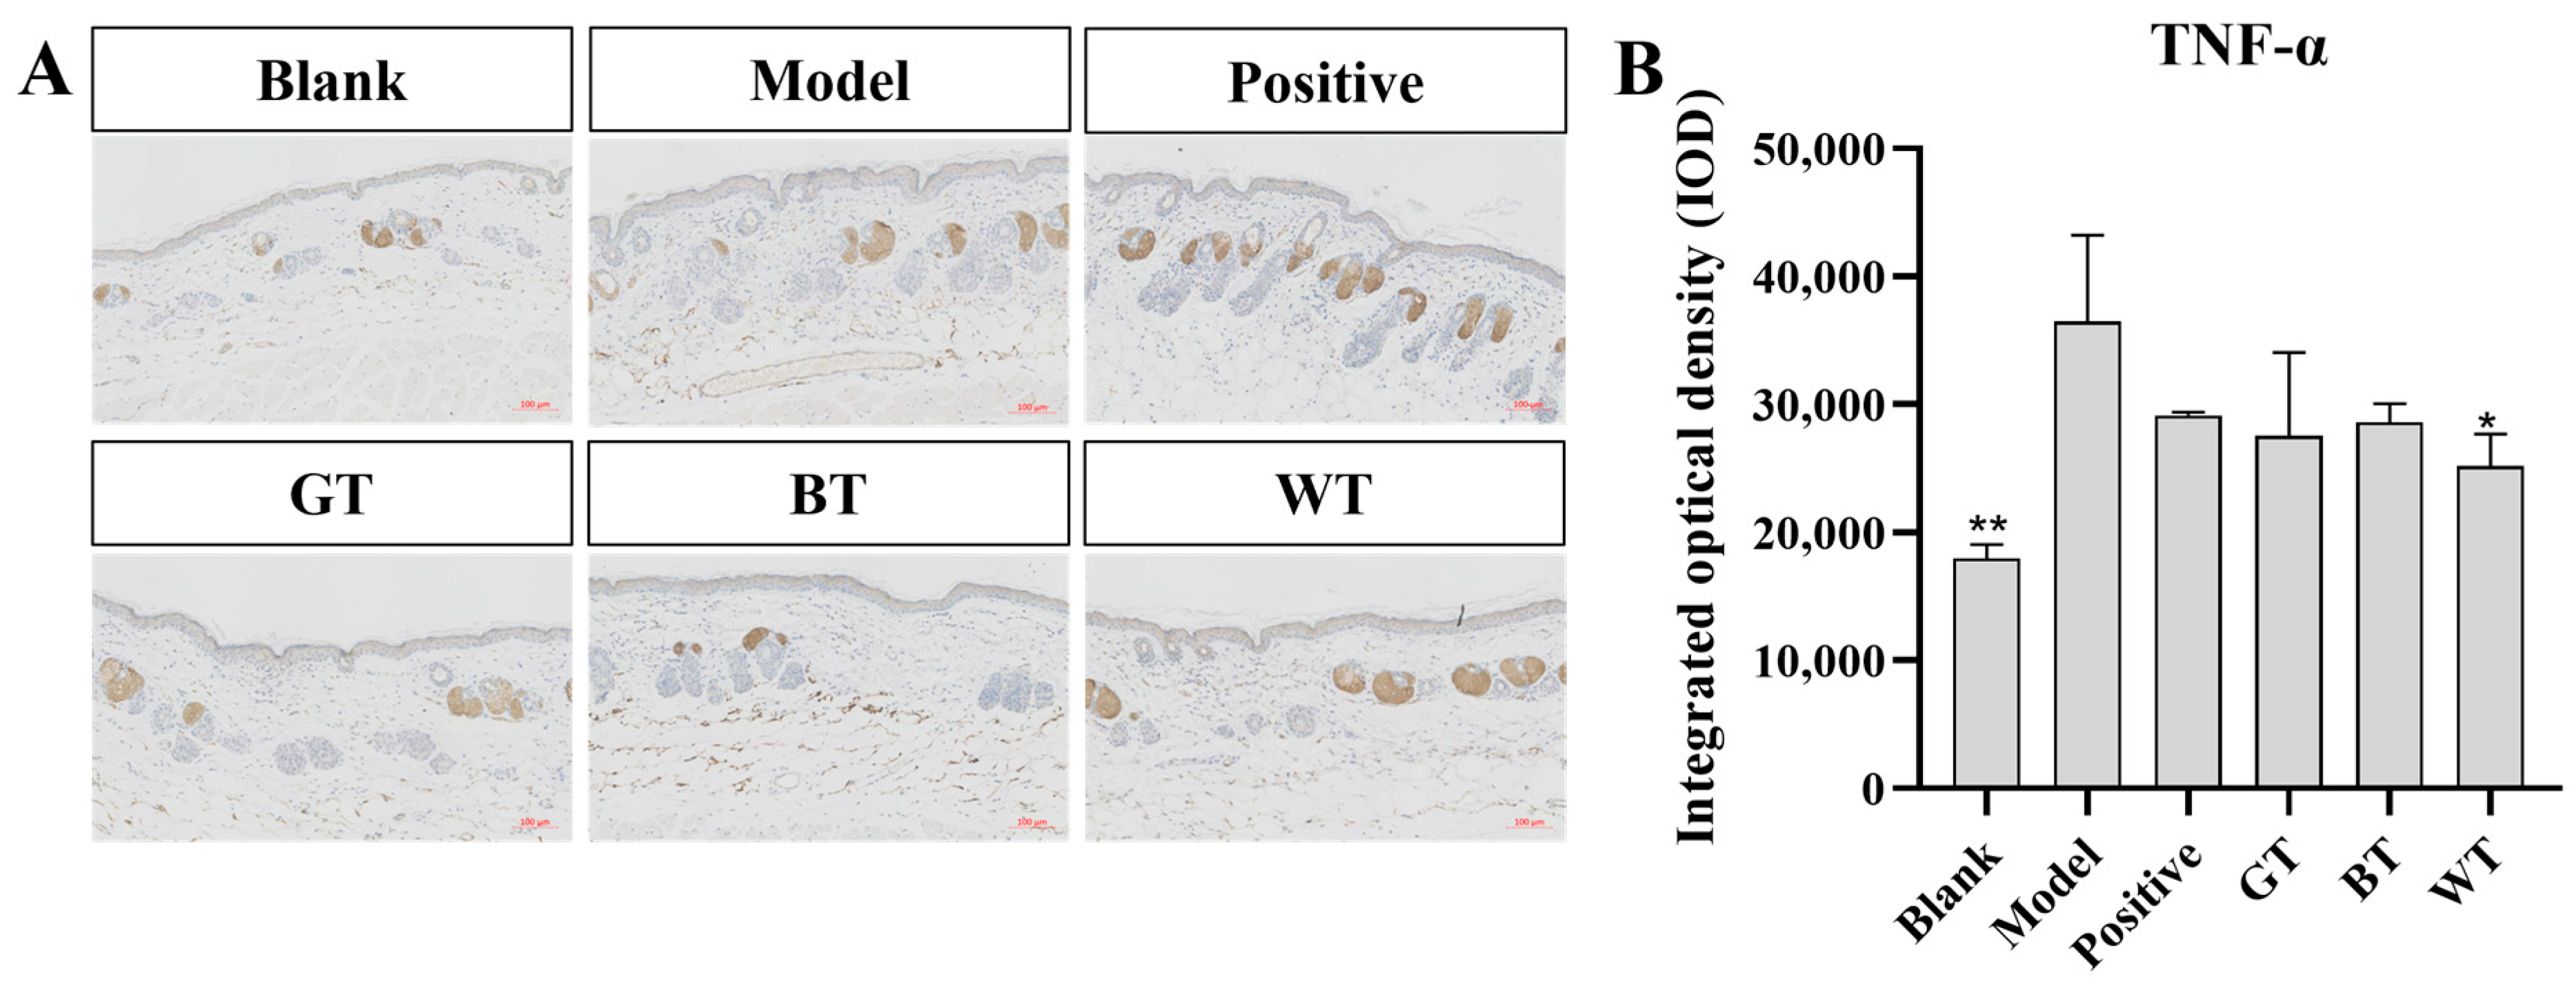
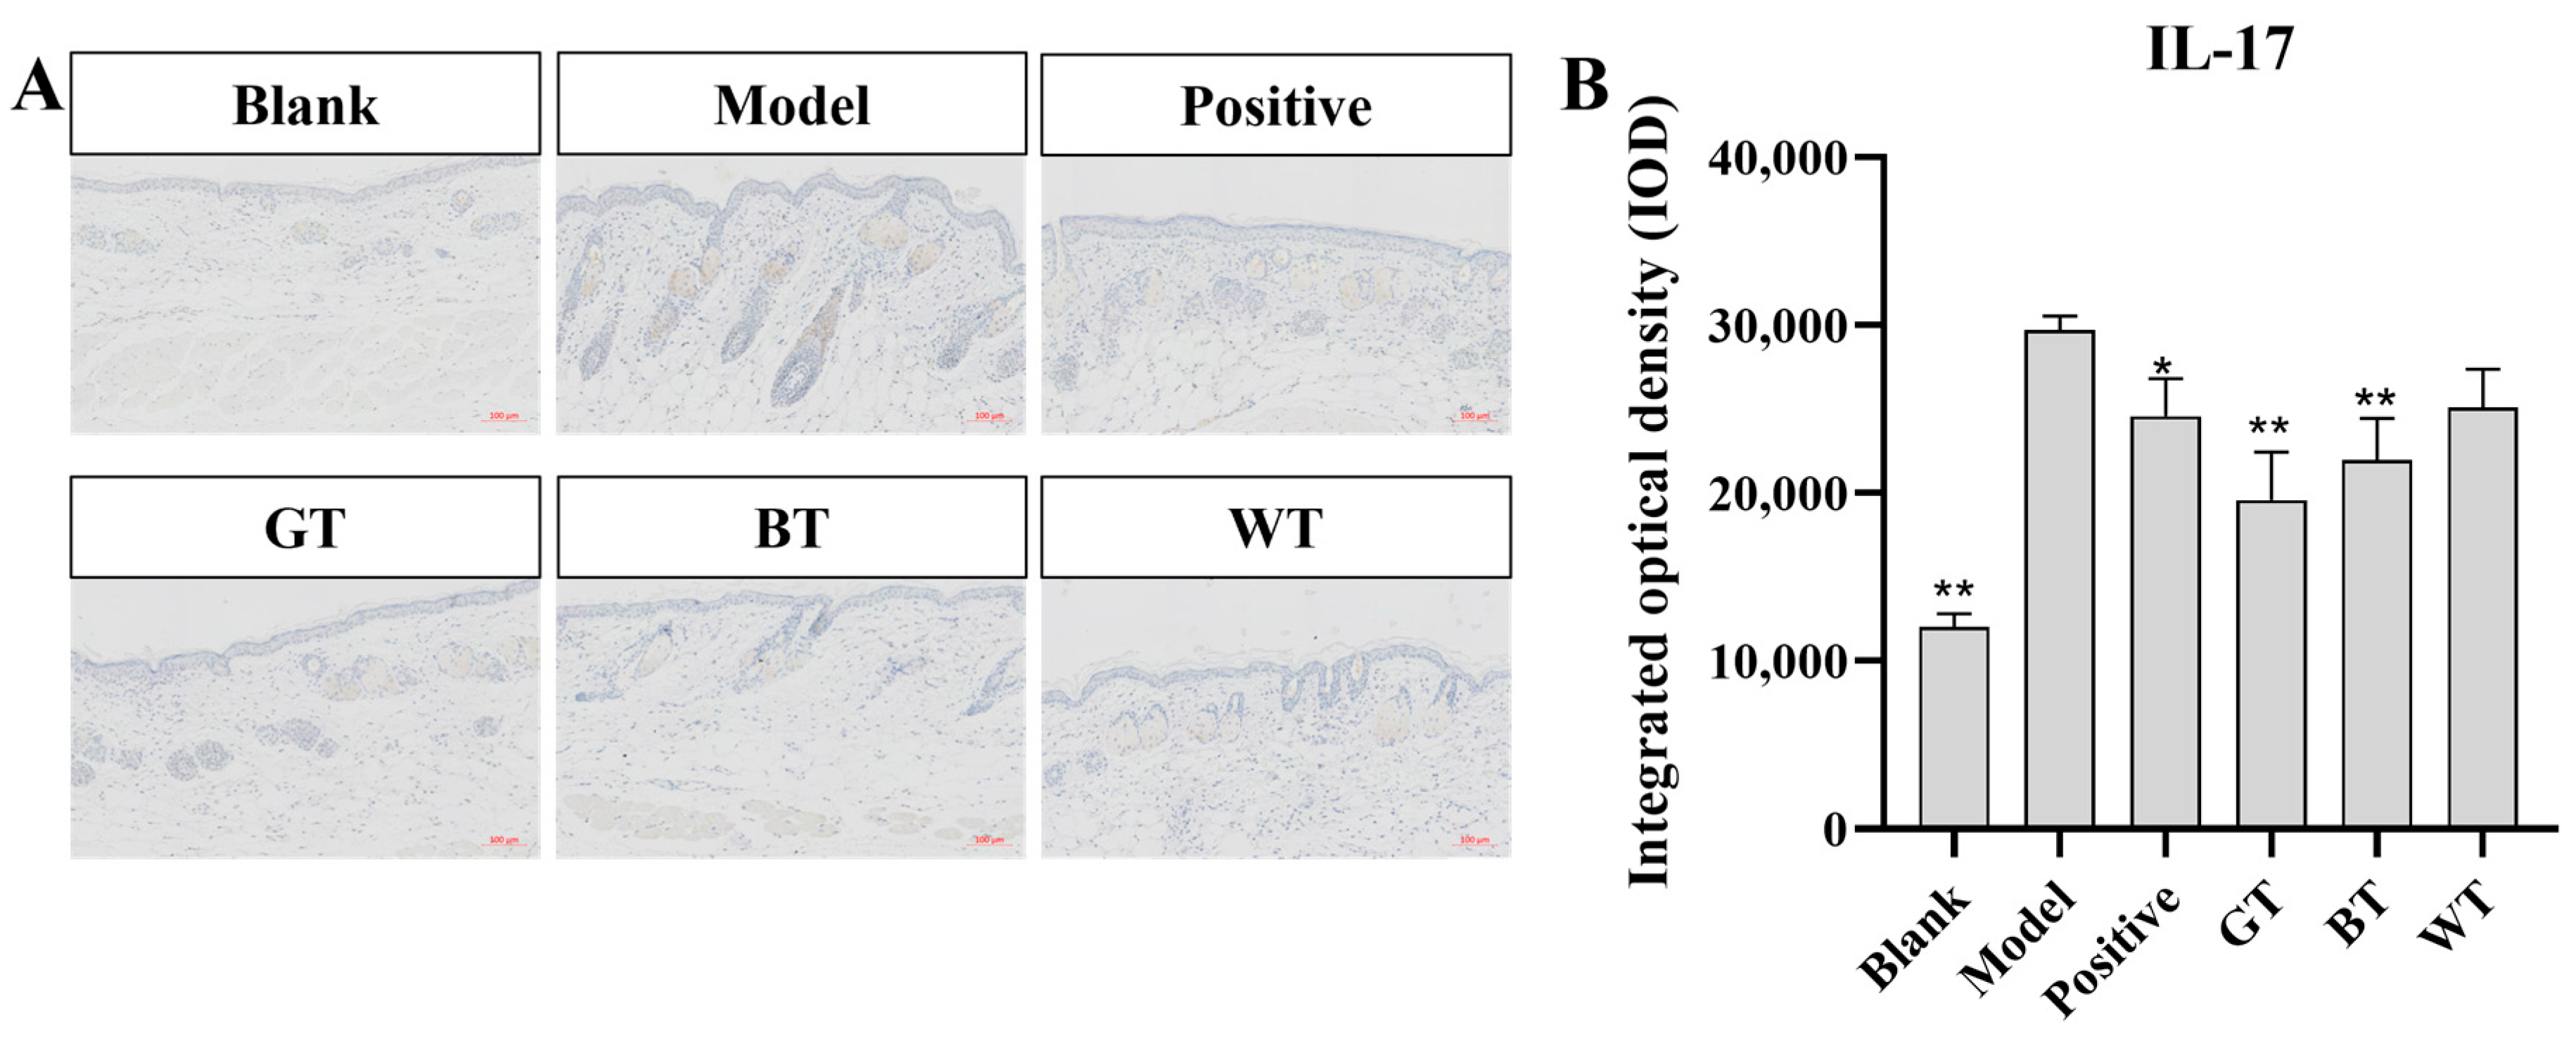
Immunohistochemistry
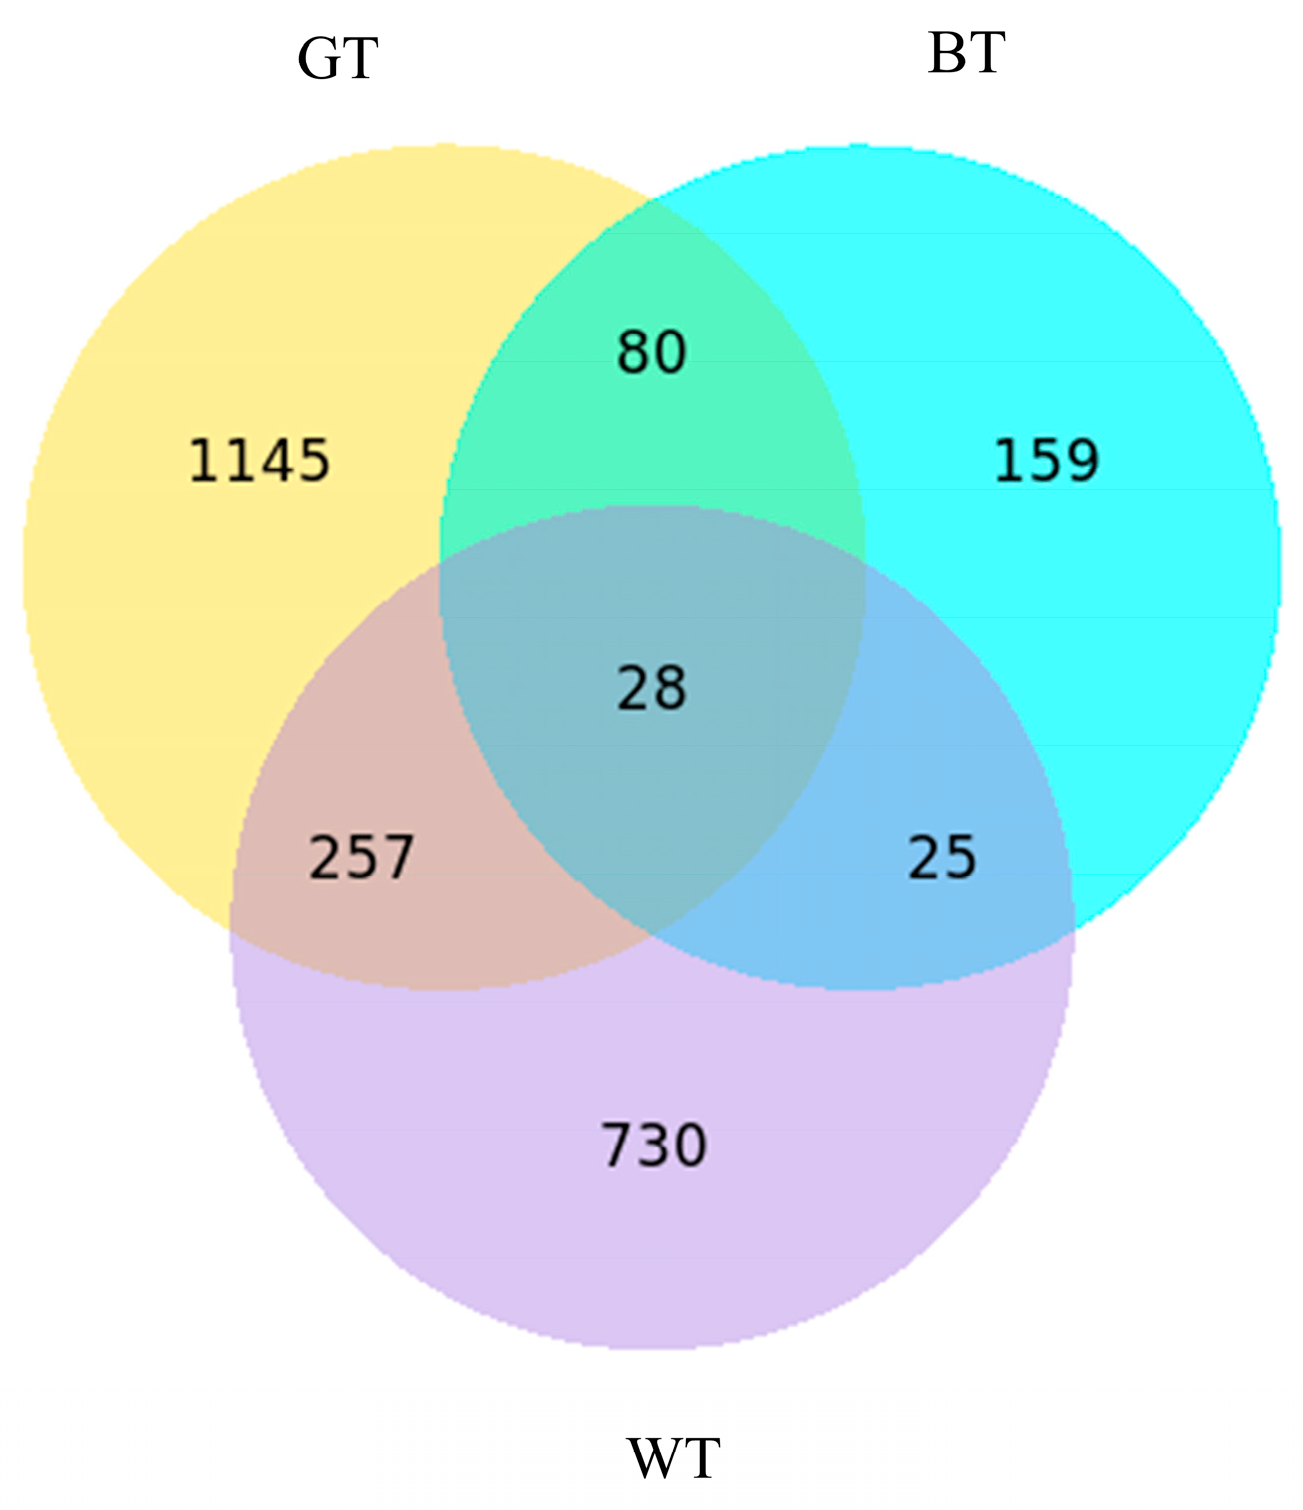
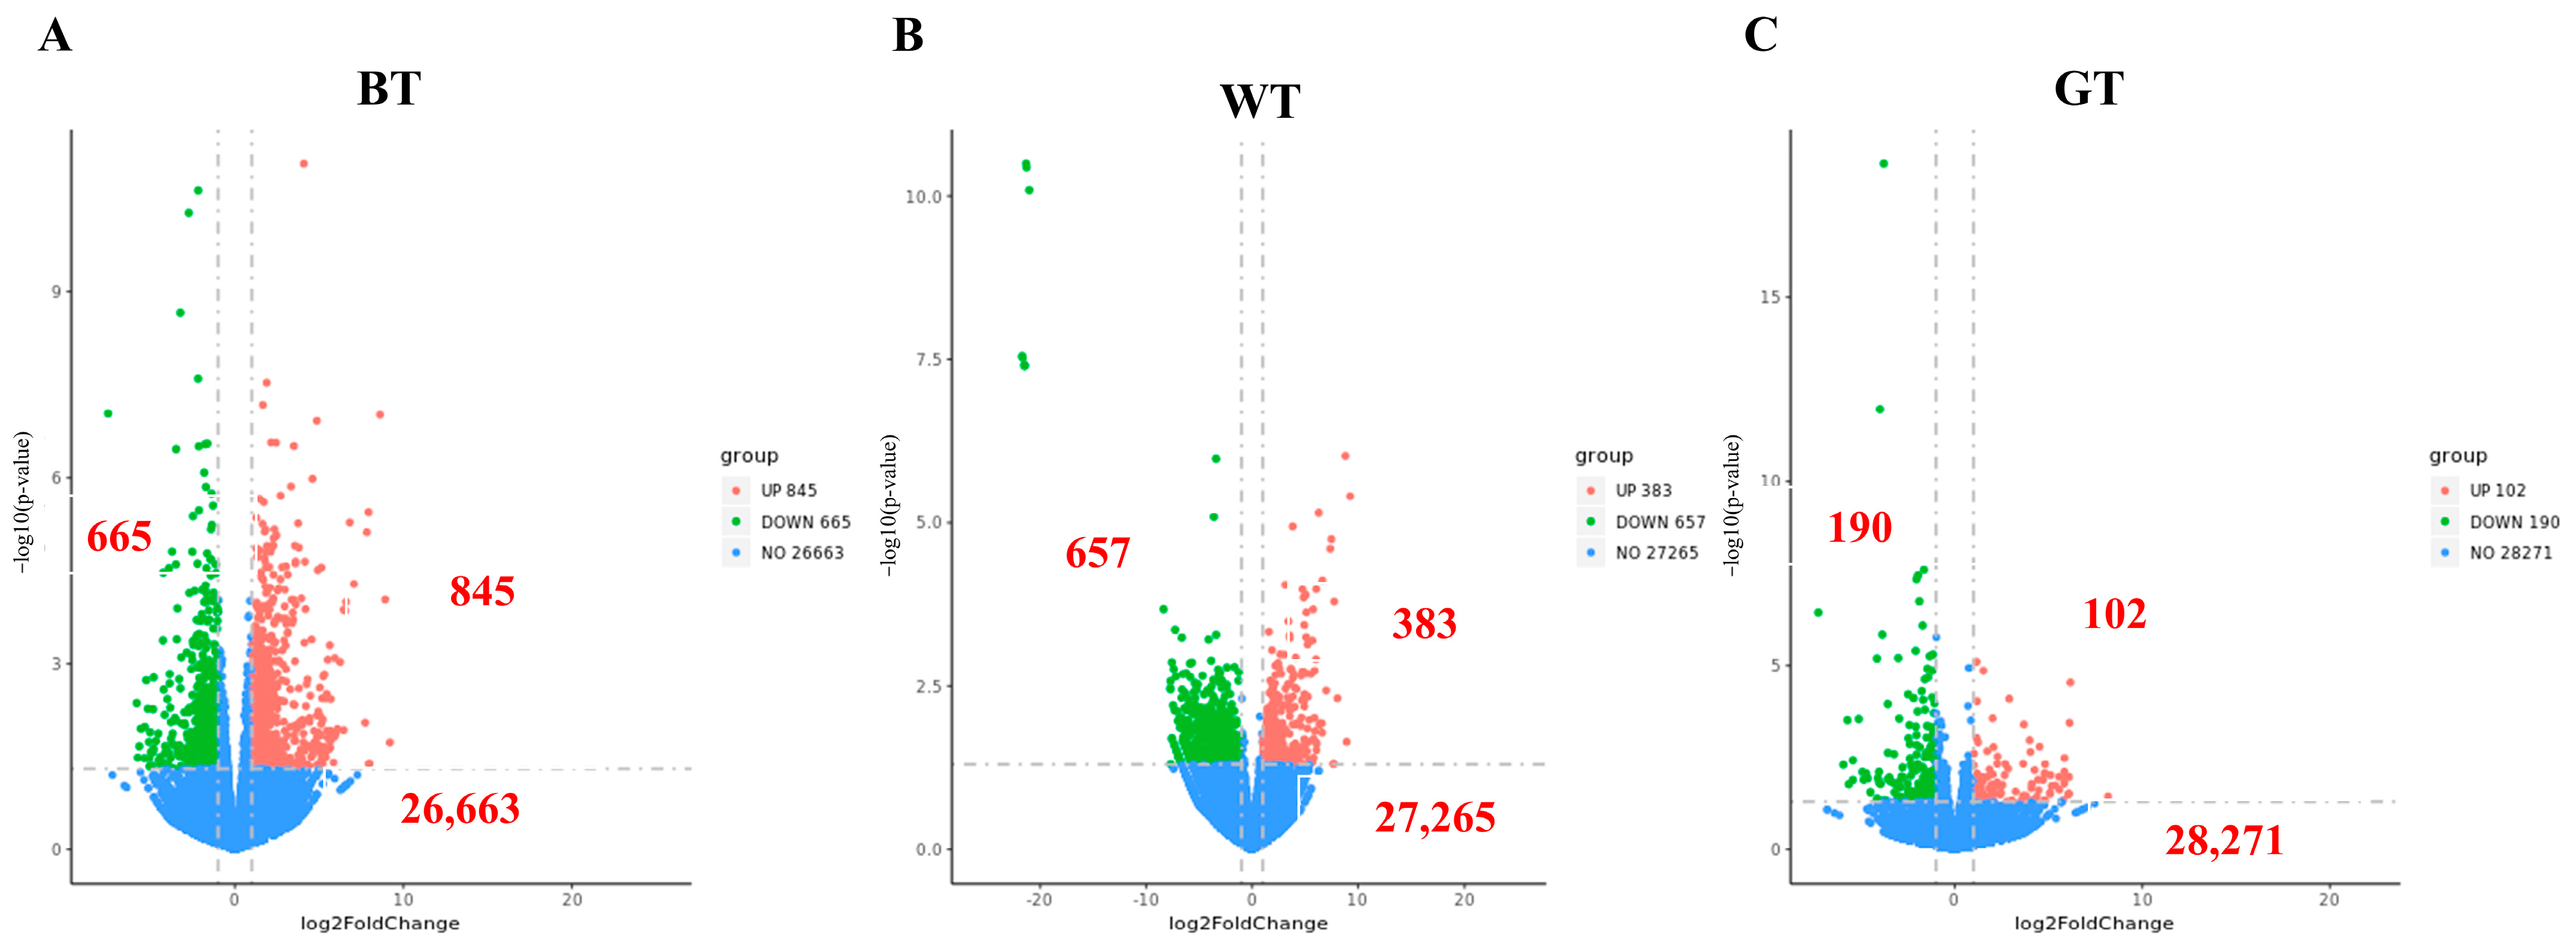
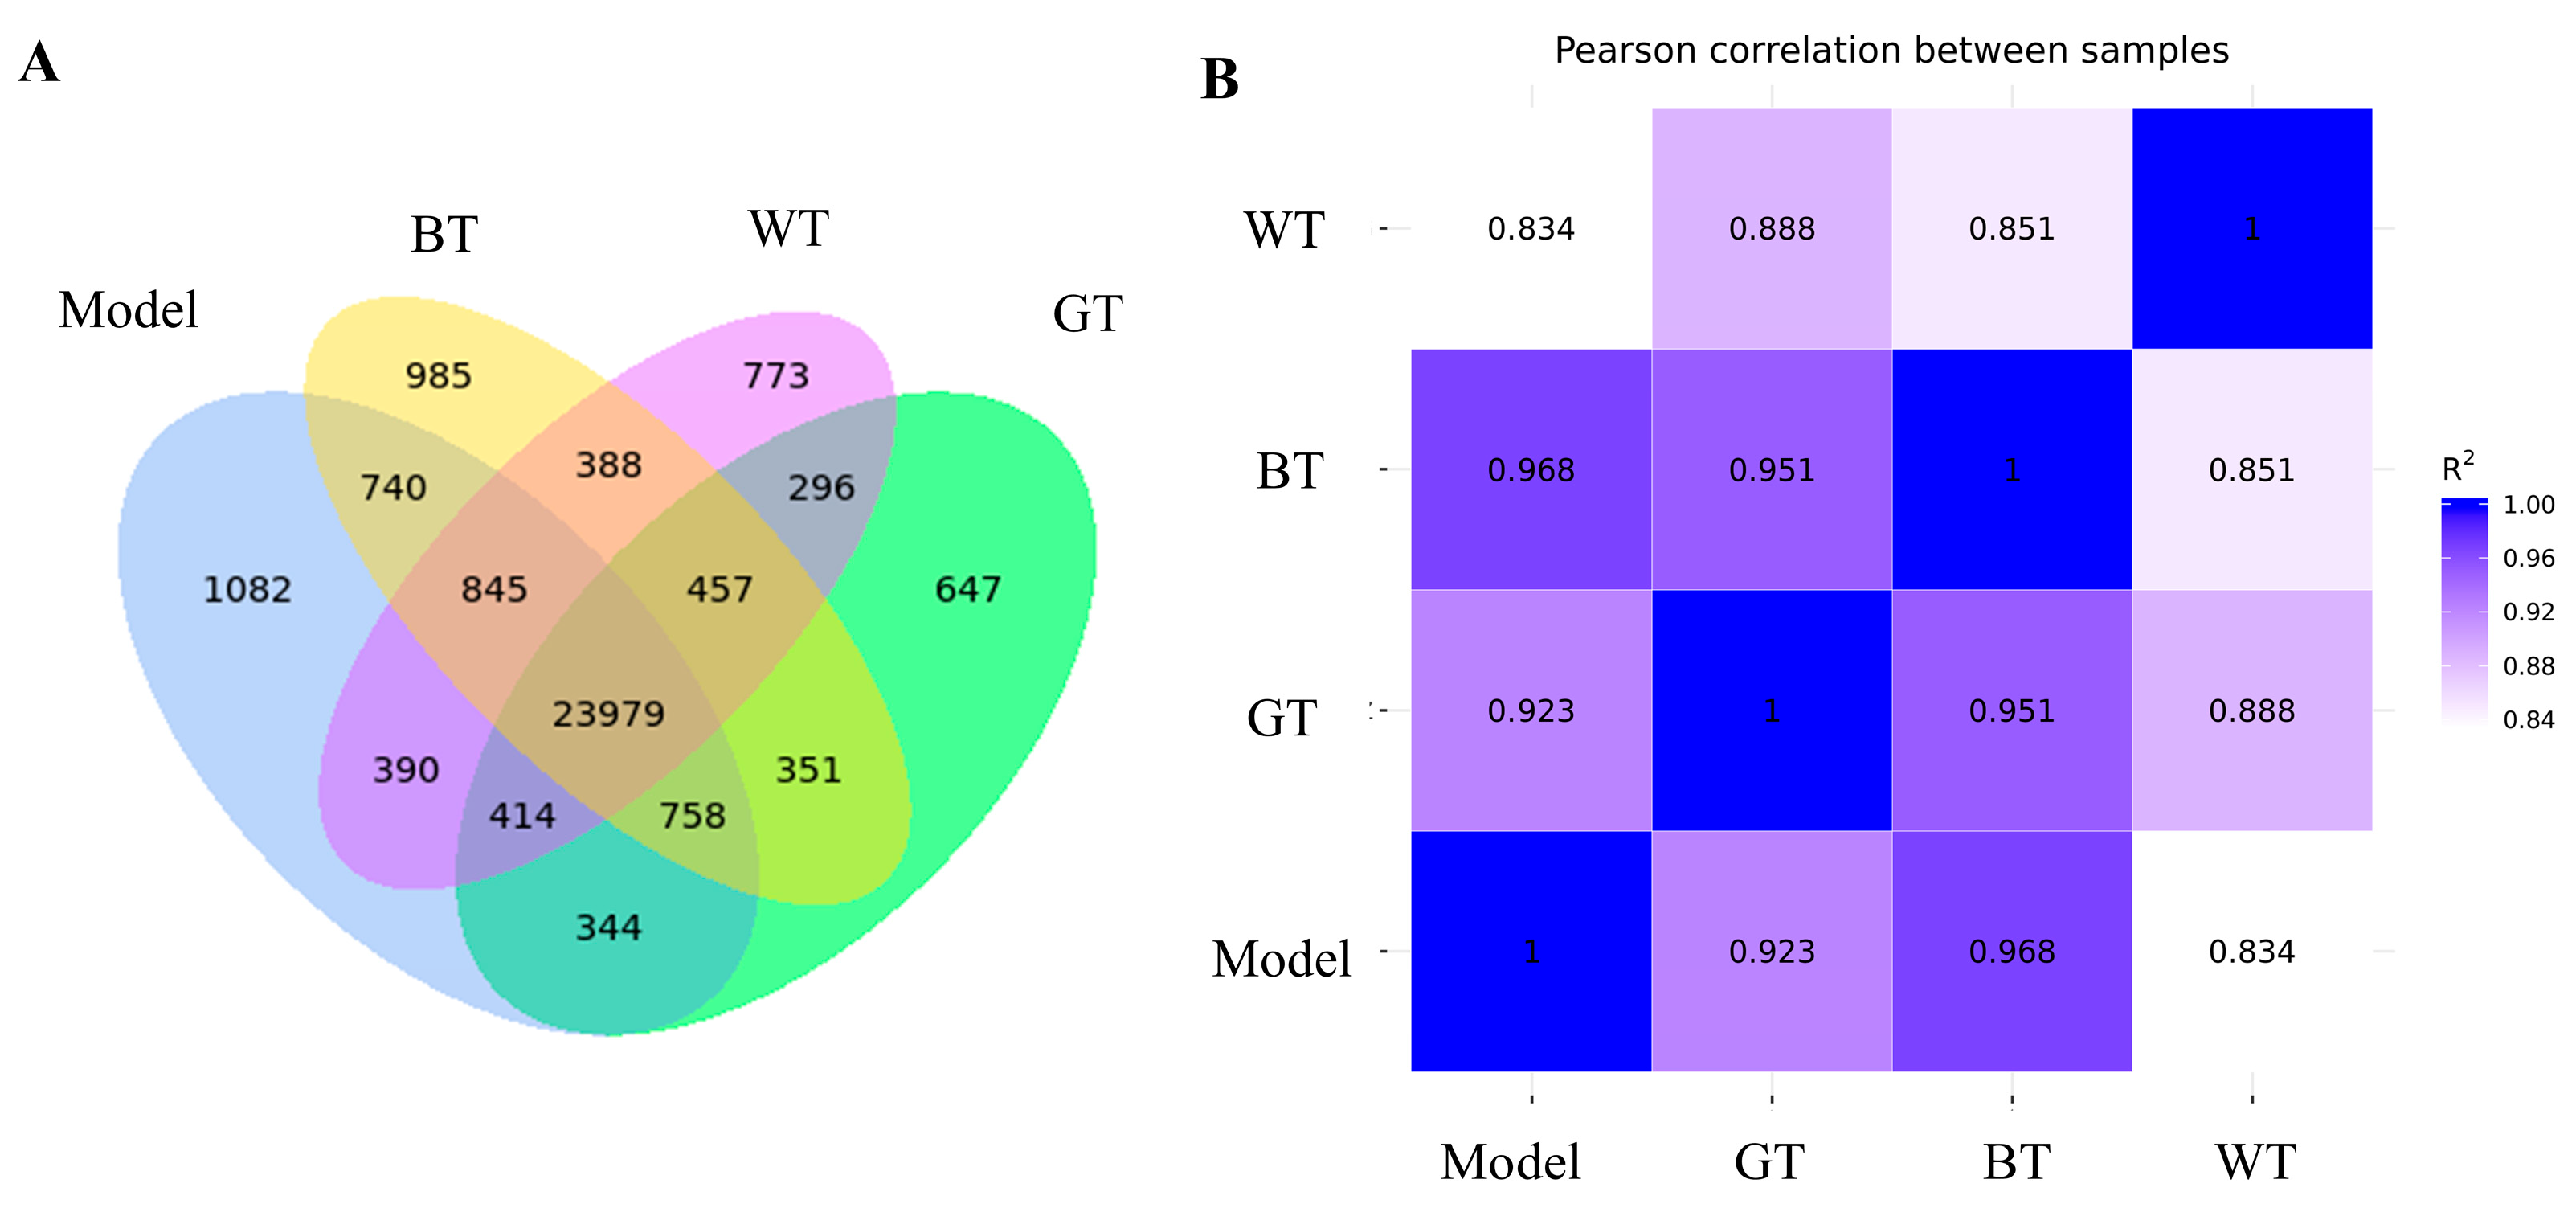
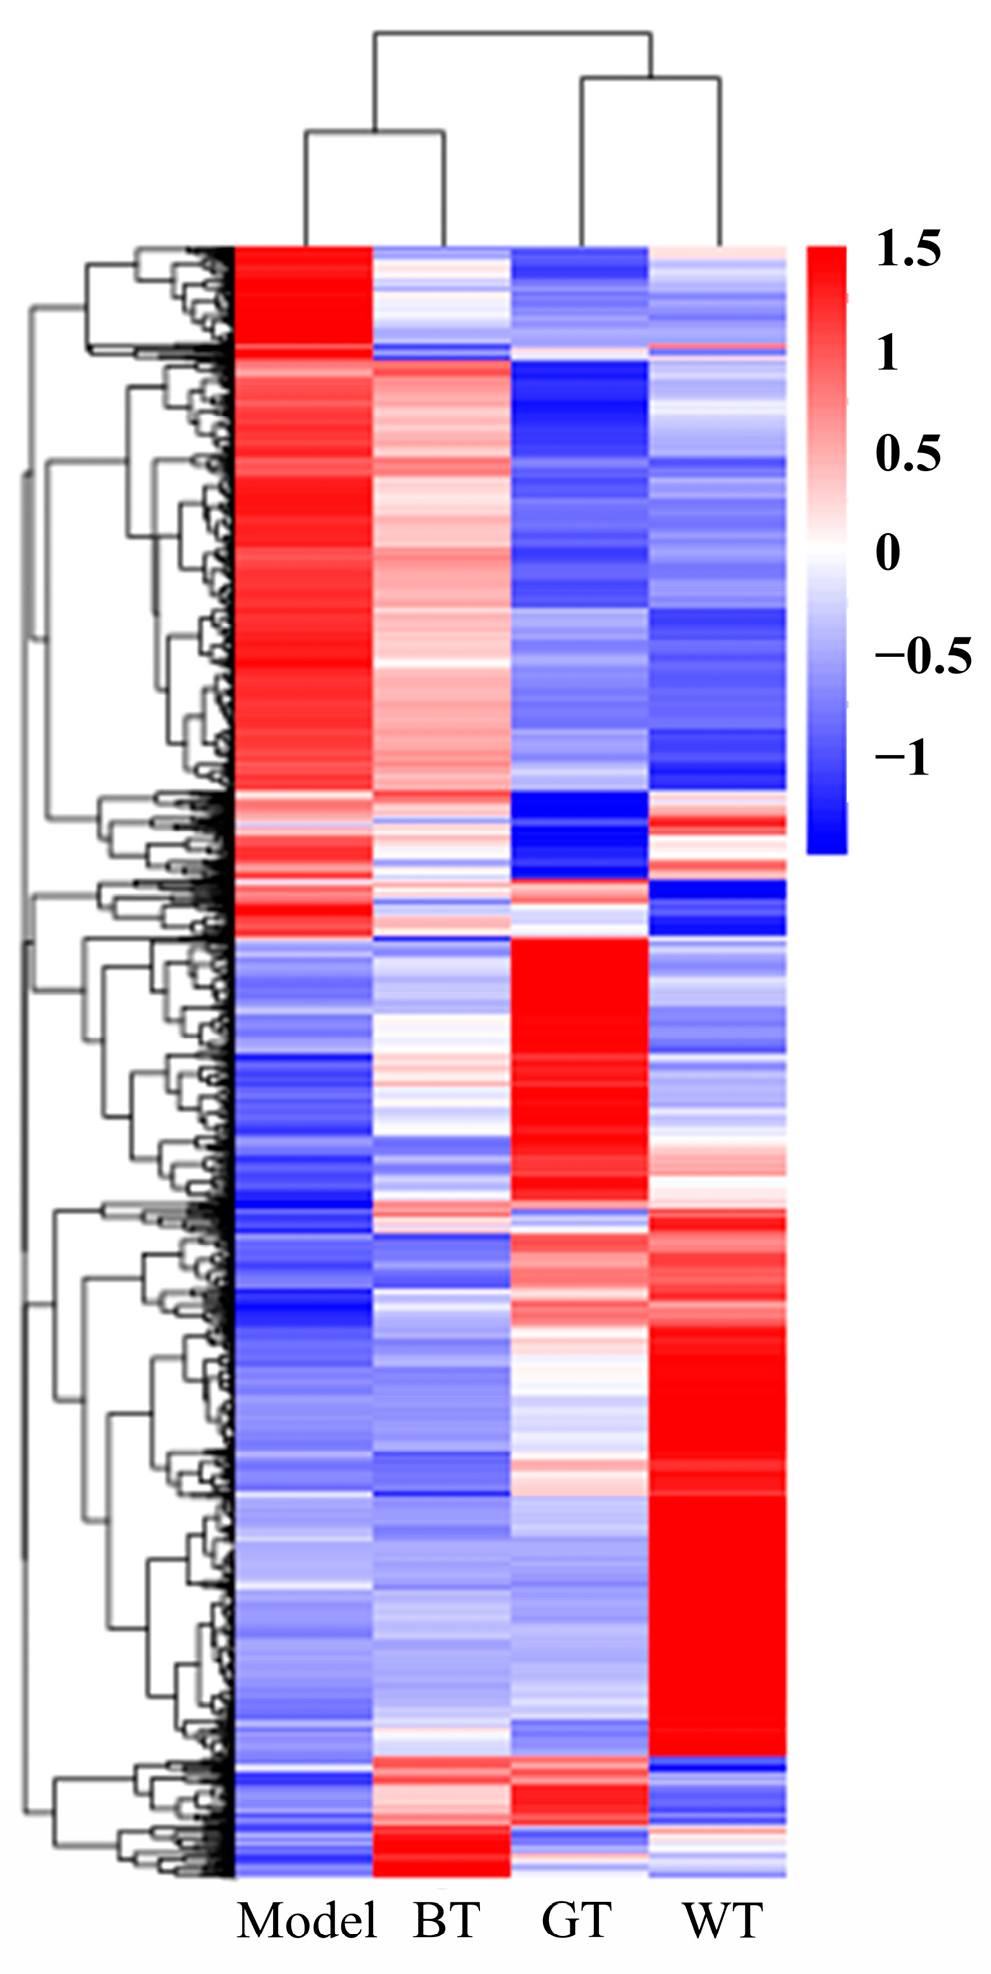
Analysis of Differentially Expressed Genes and Their Expression Levels
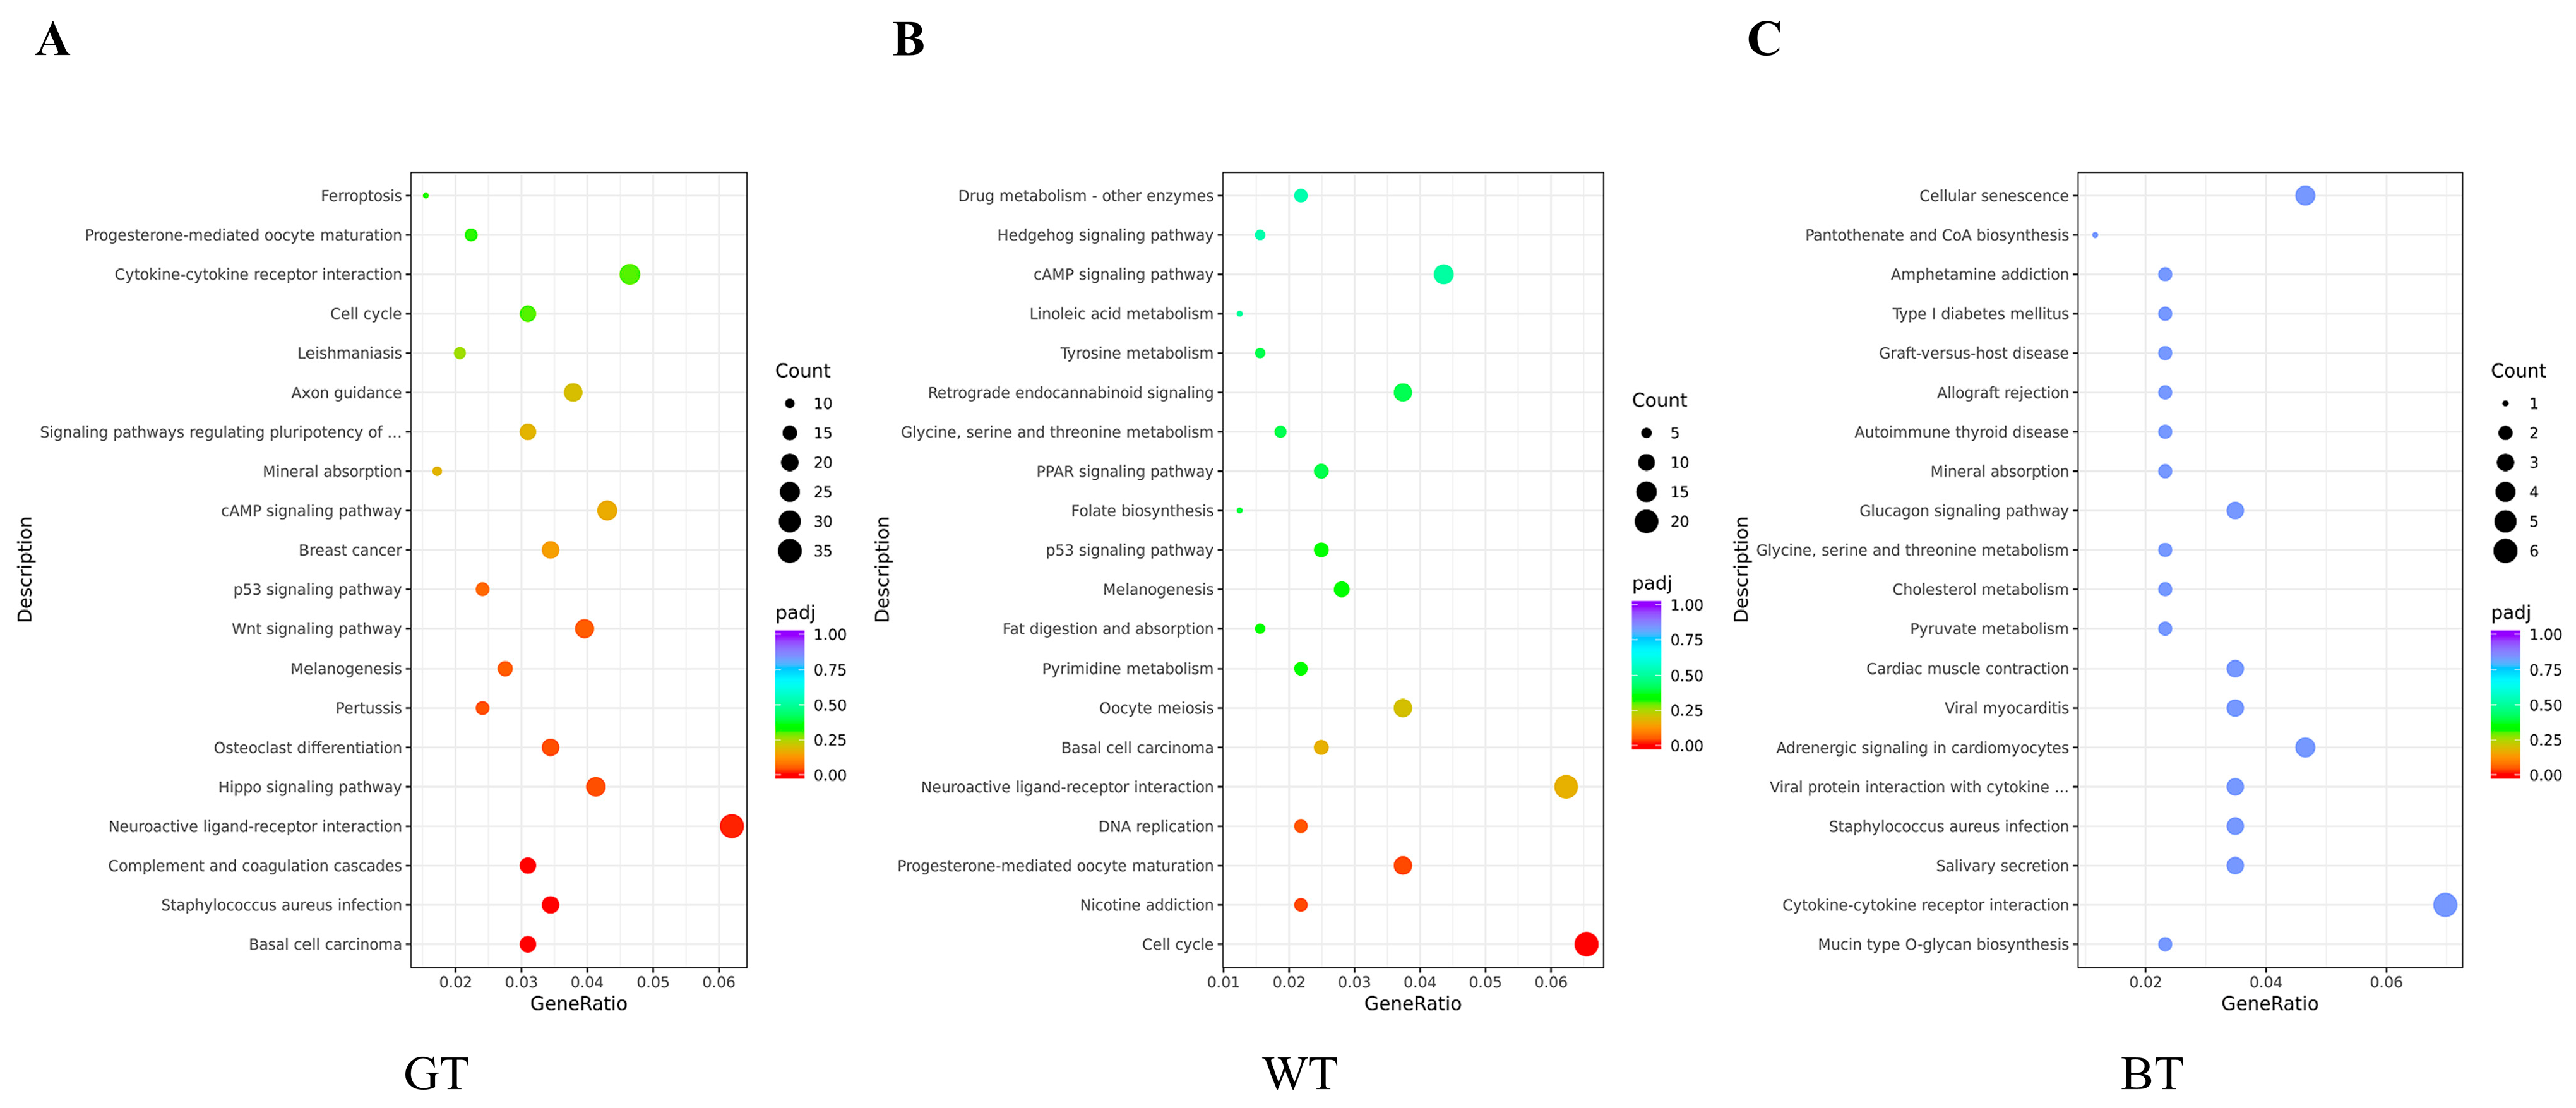
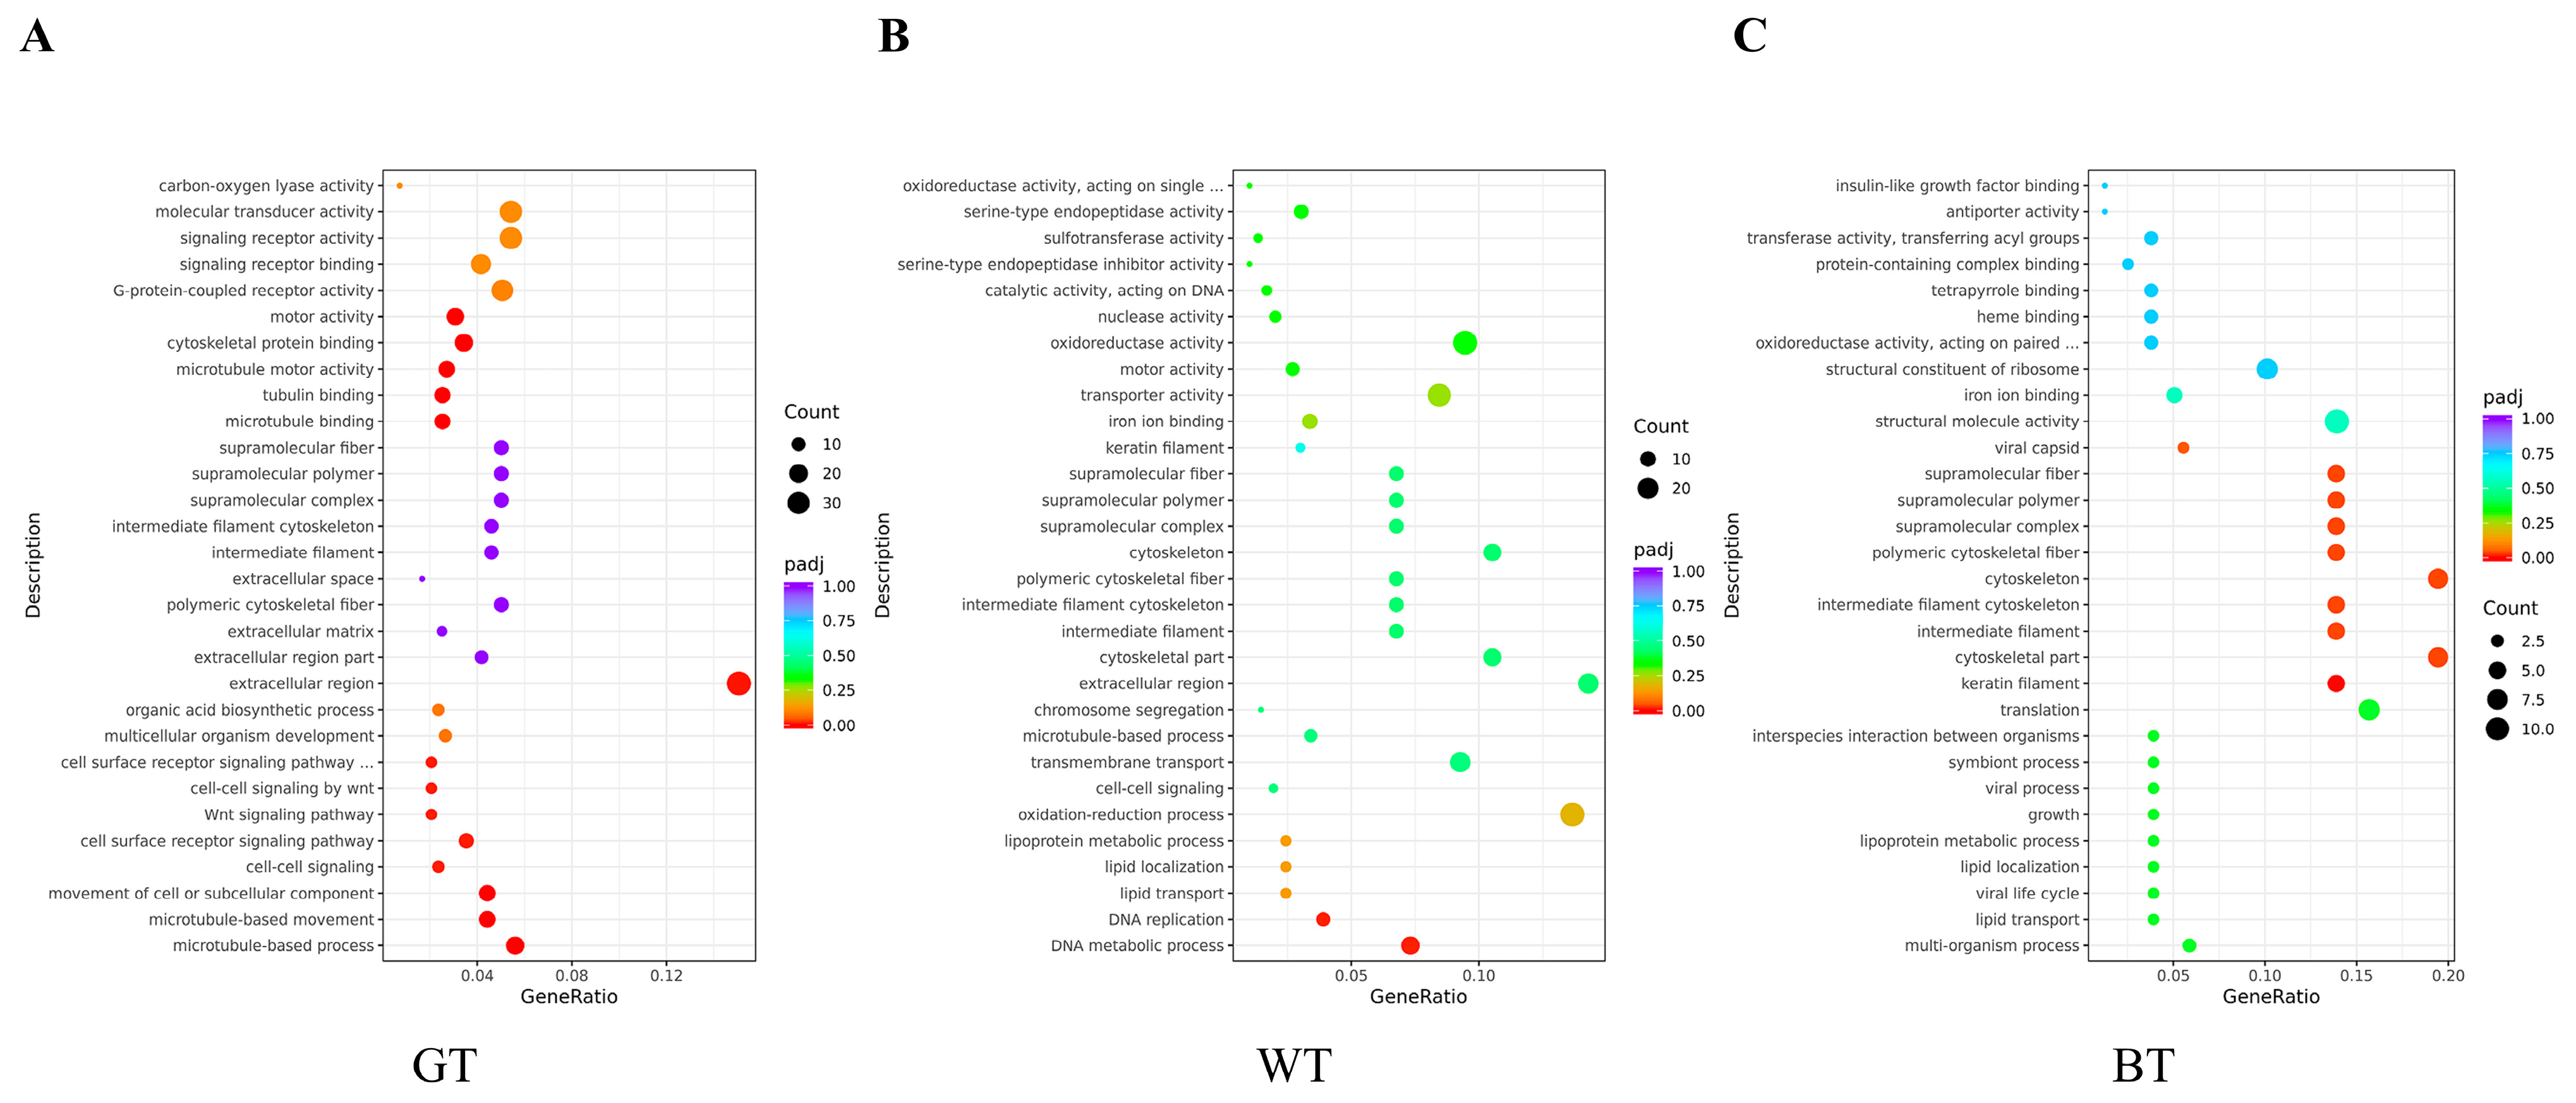
Gene Function Analysis
2.1.4. Cell Experiment
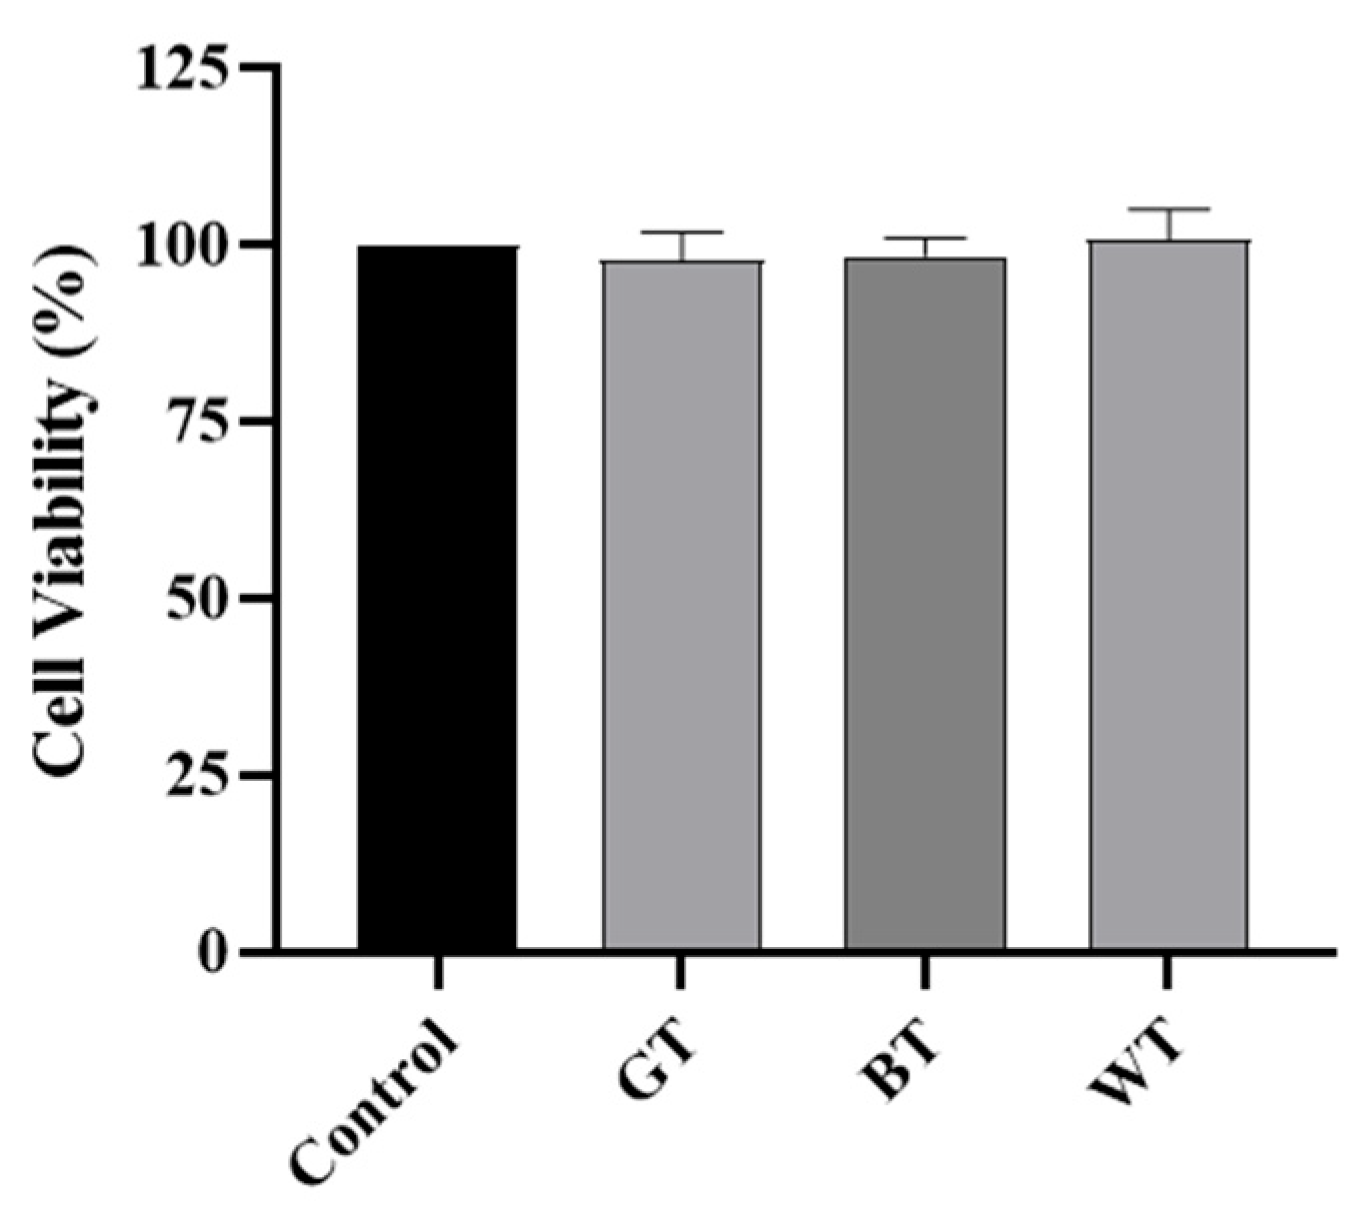
MTT Experiment Results
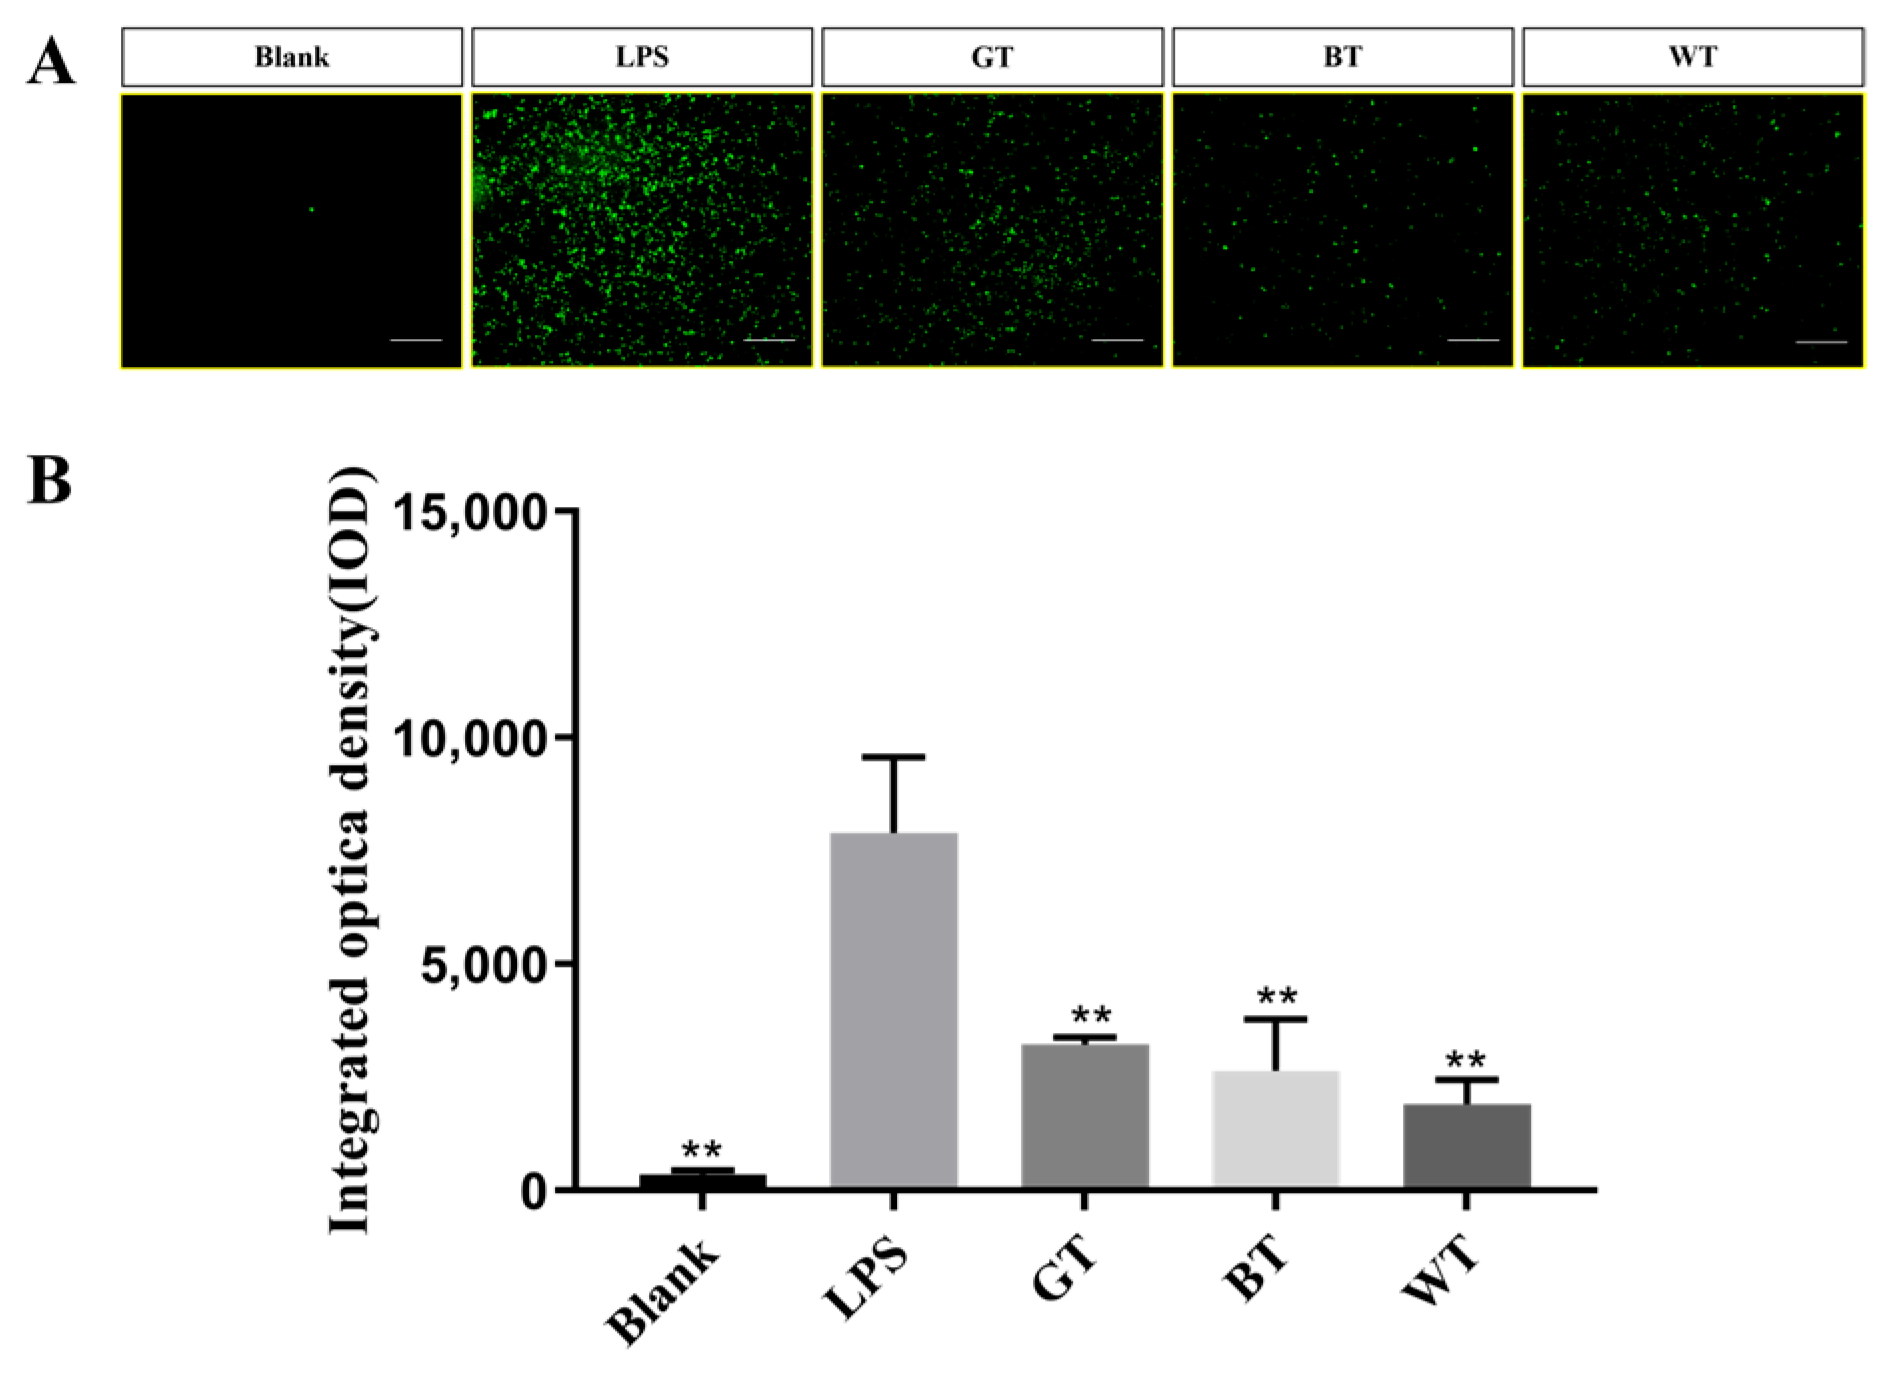
ROS Release
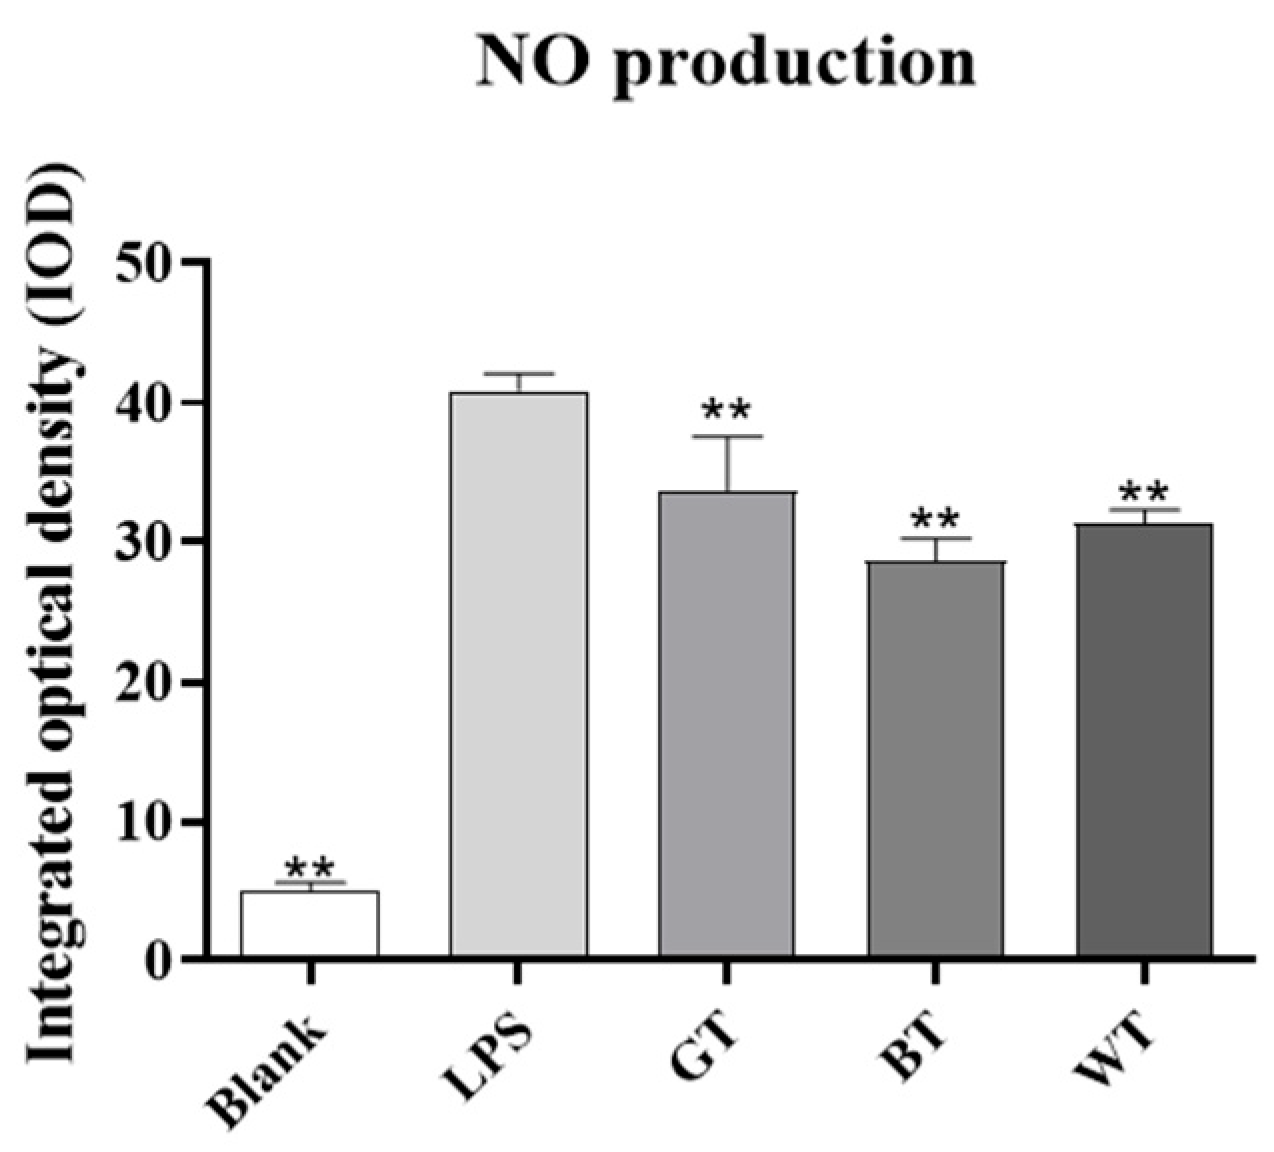
Determination of NO Release
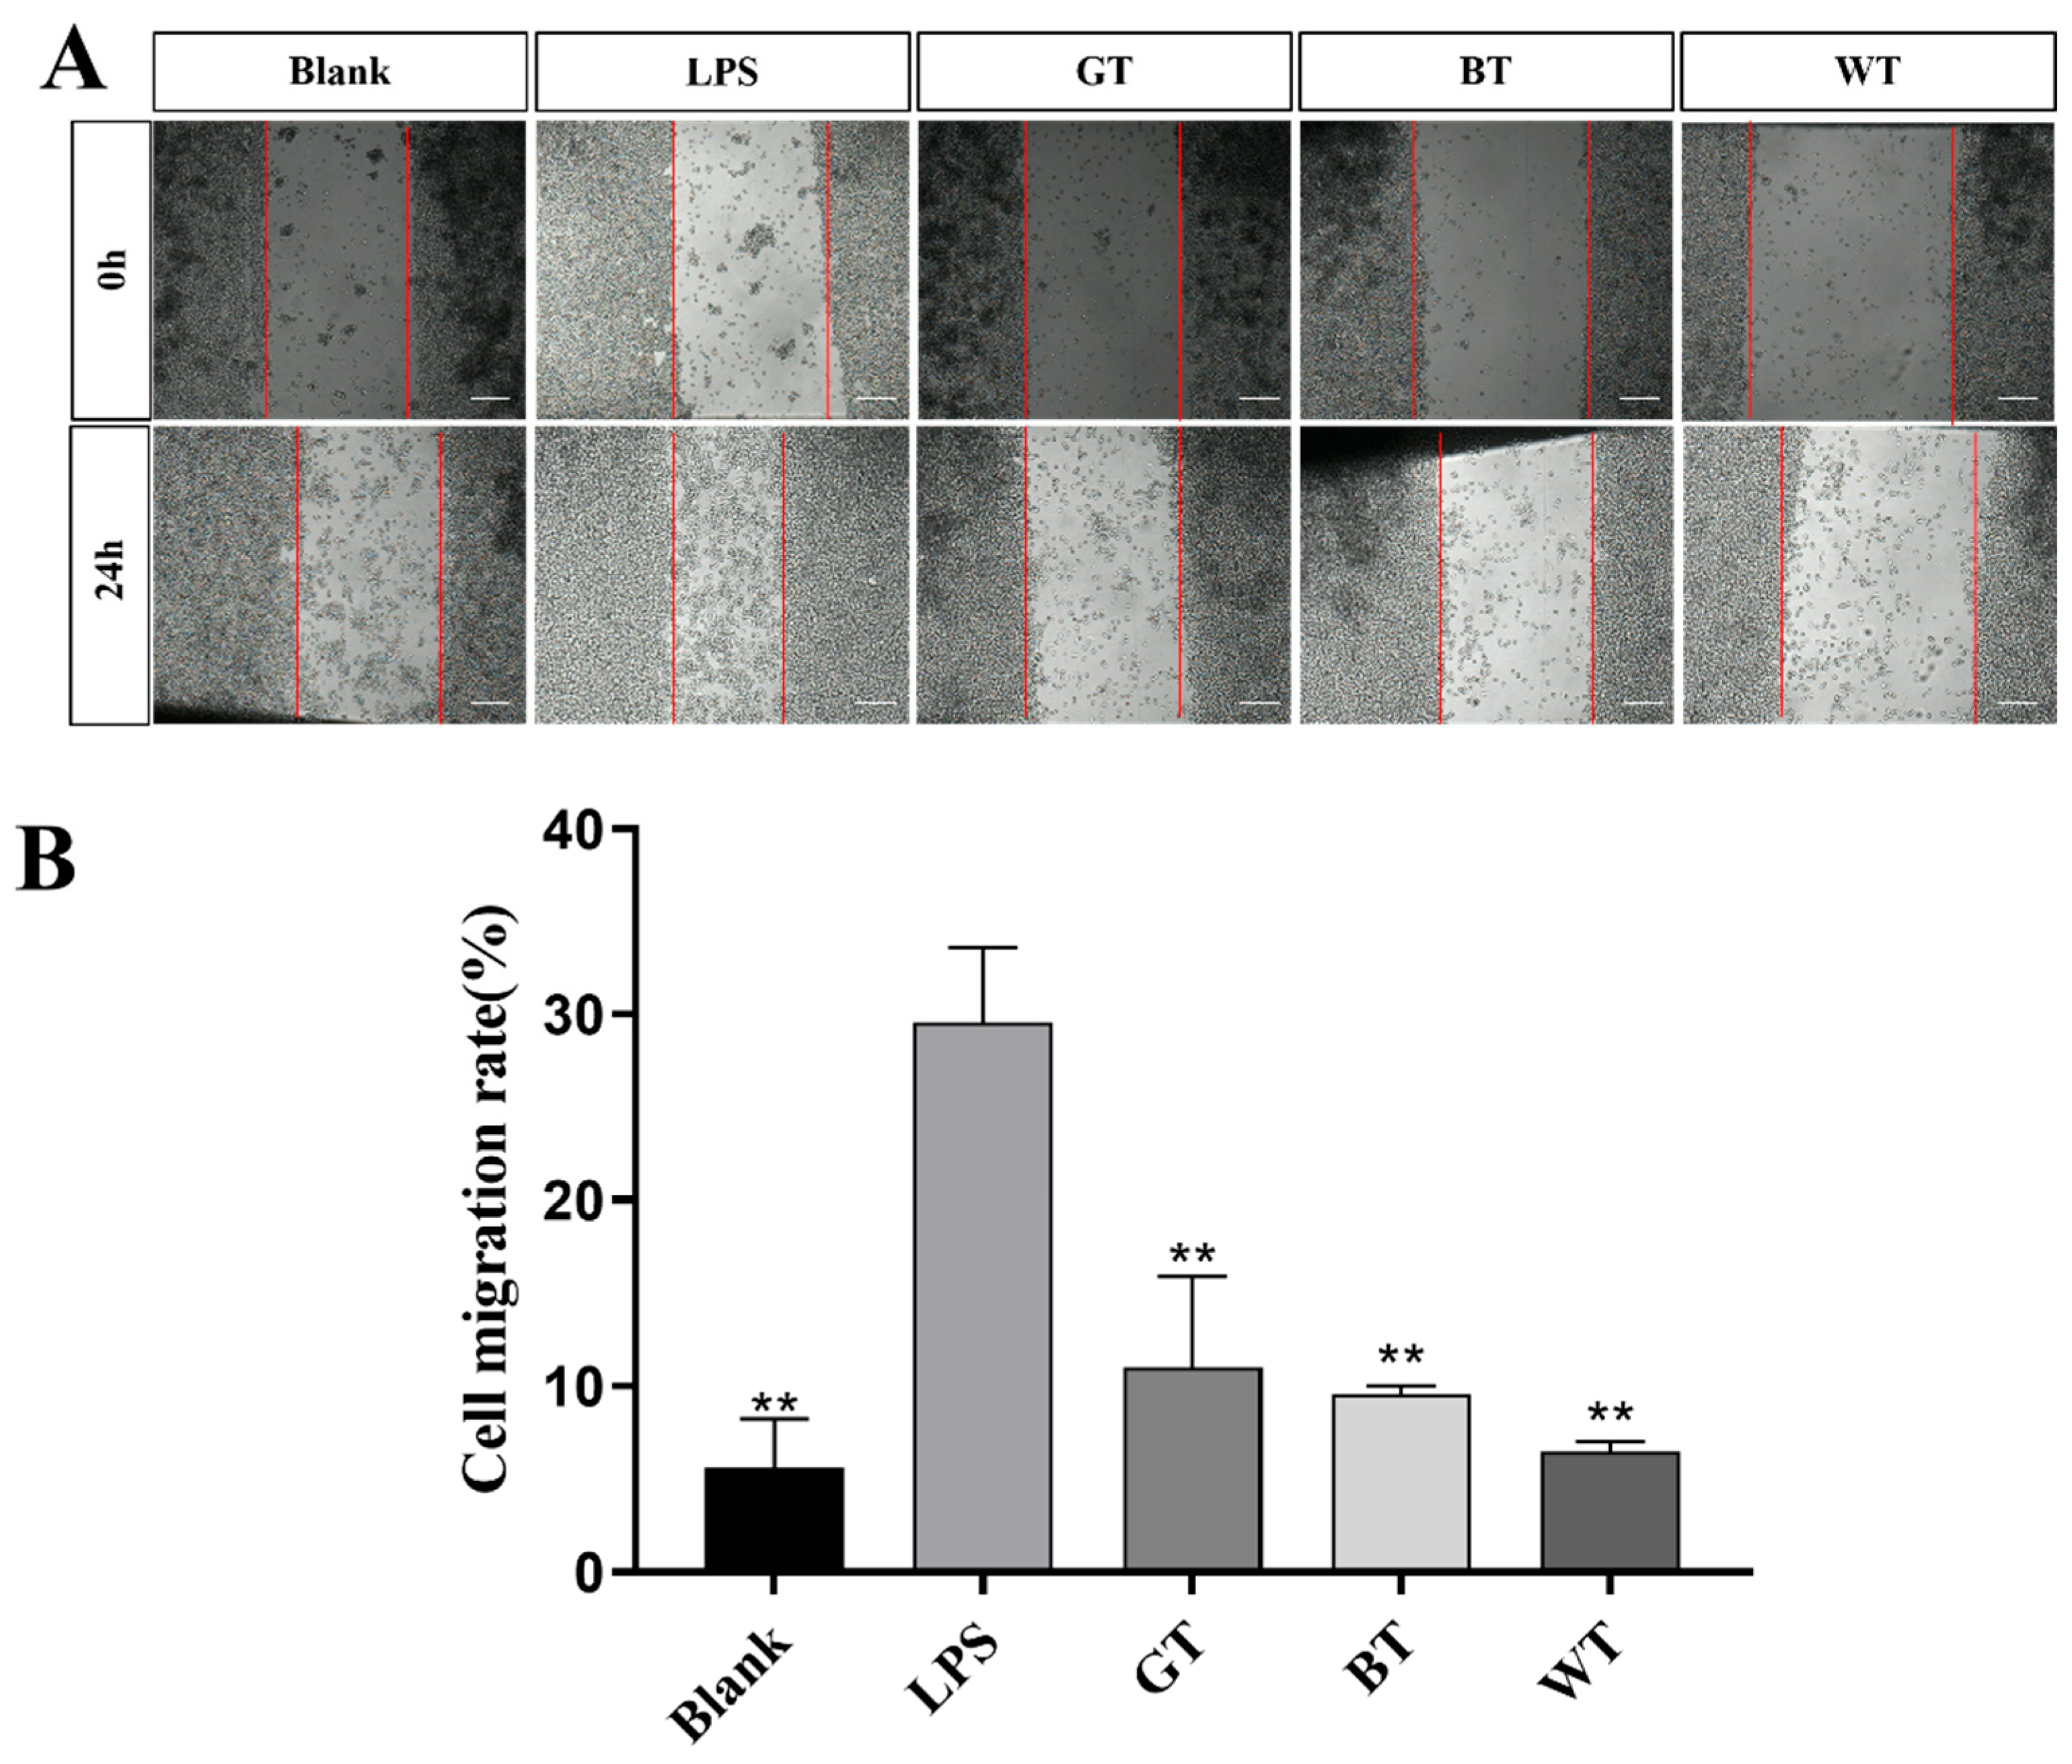
Migration Scratch
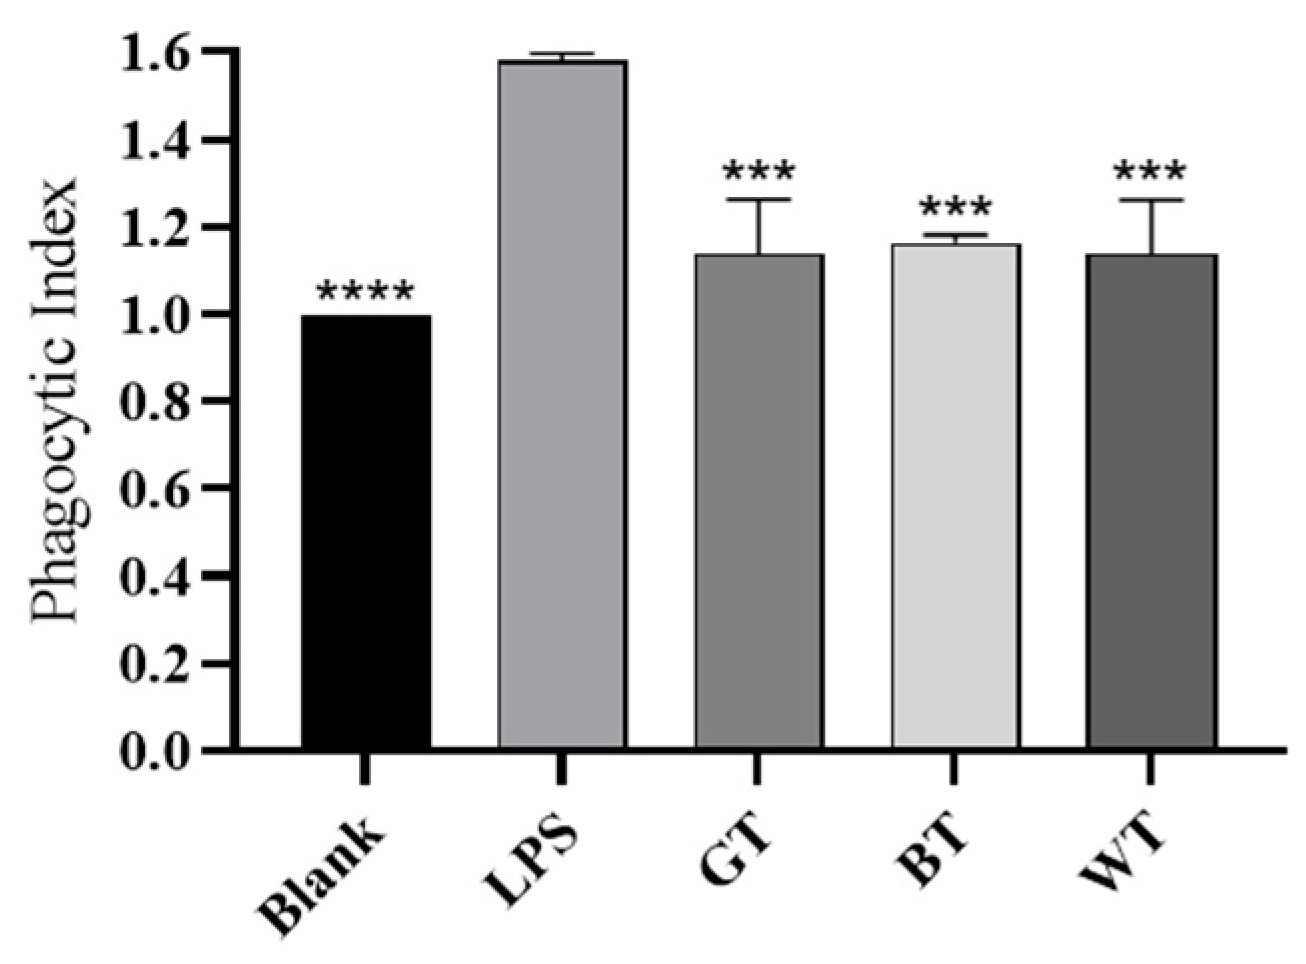
Phagocytic Neutral Red Experiment
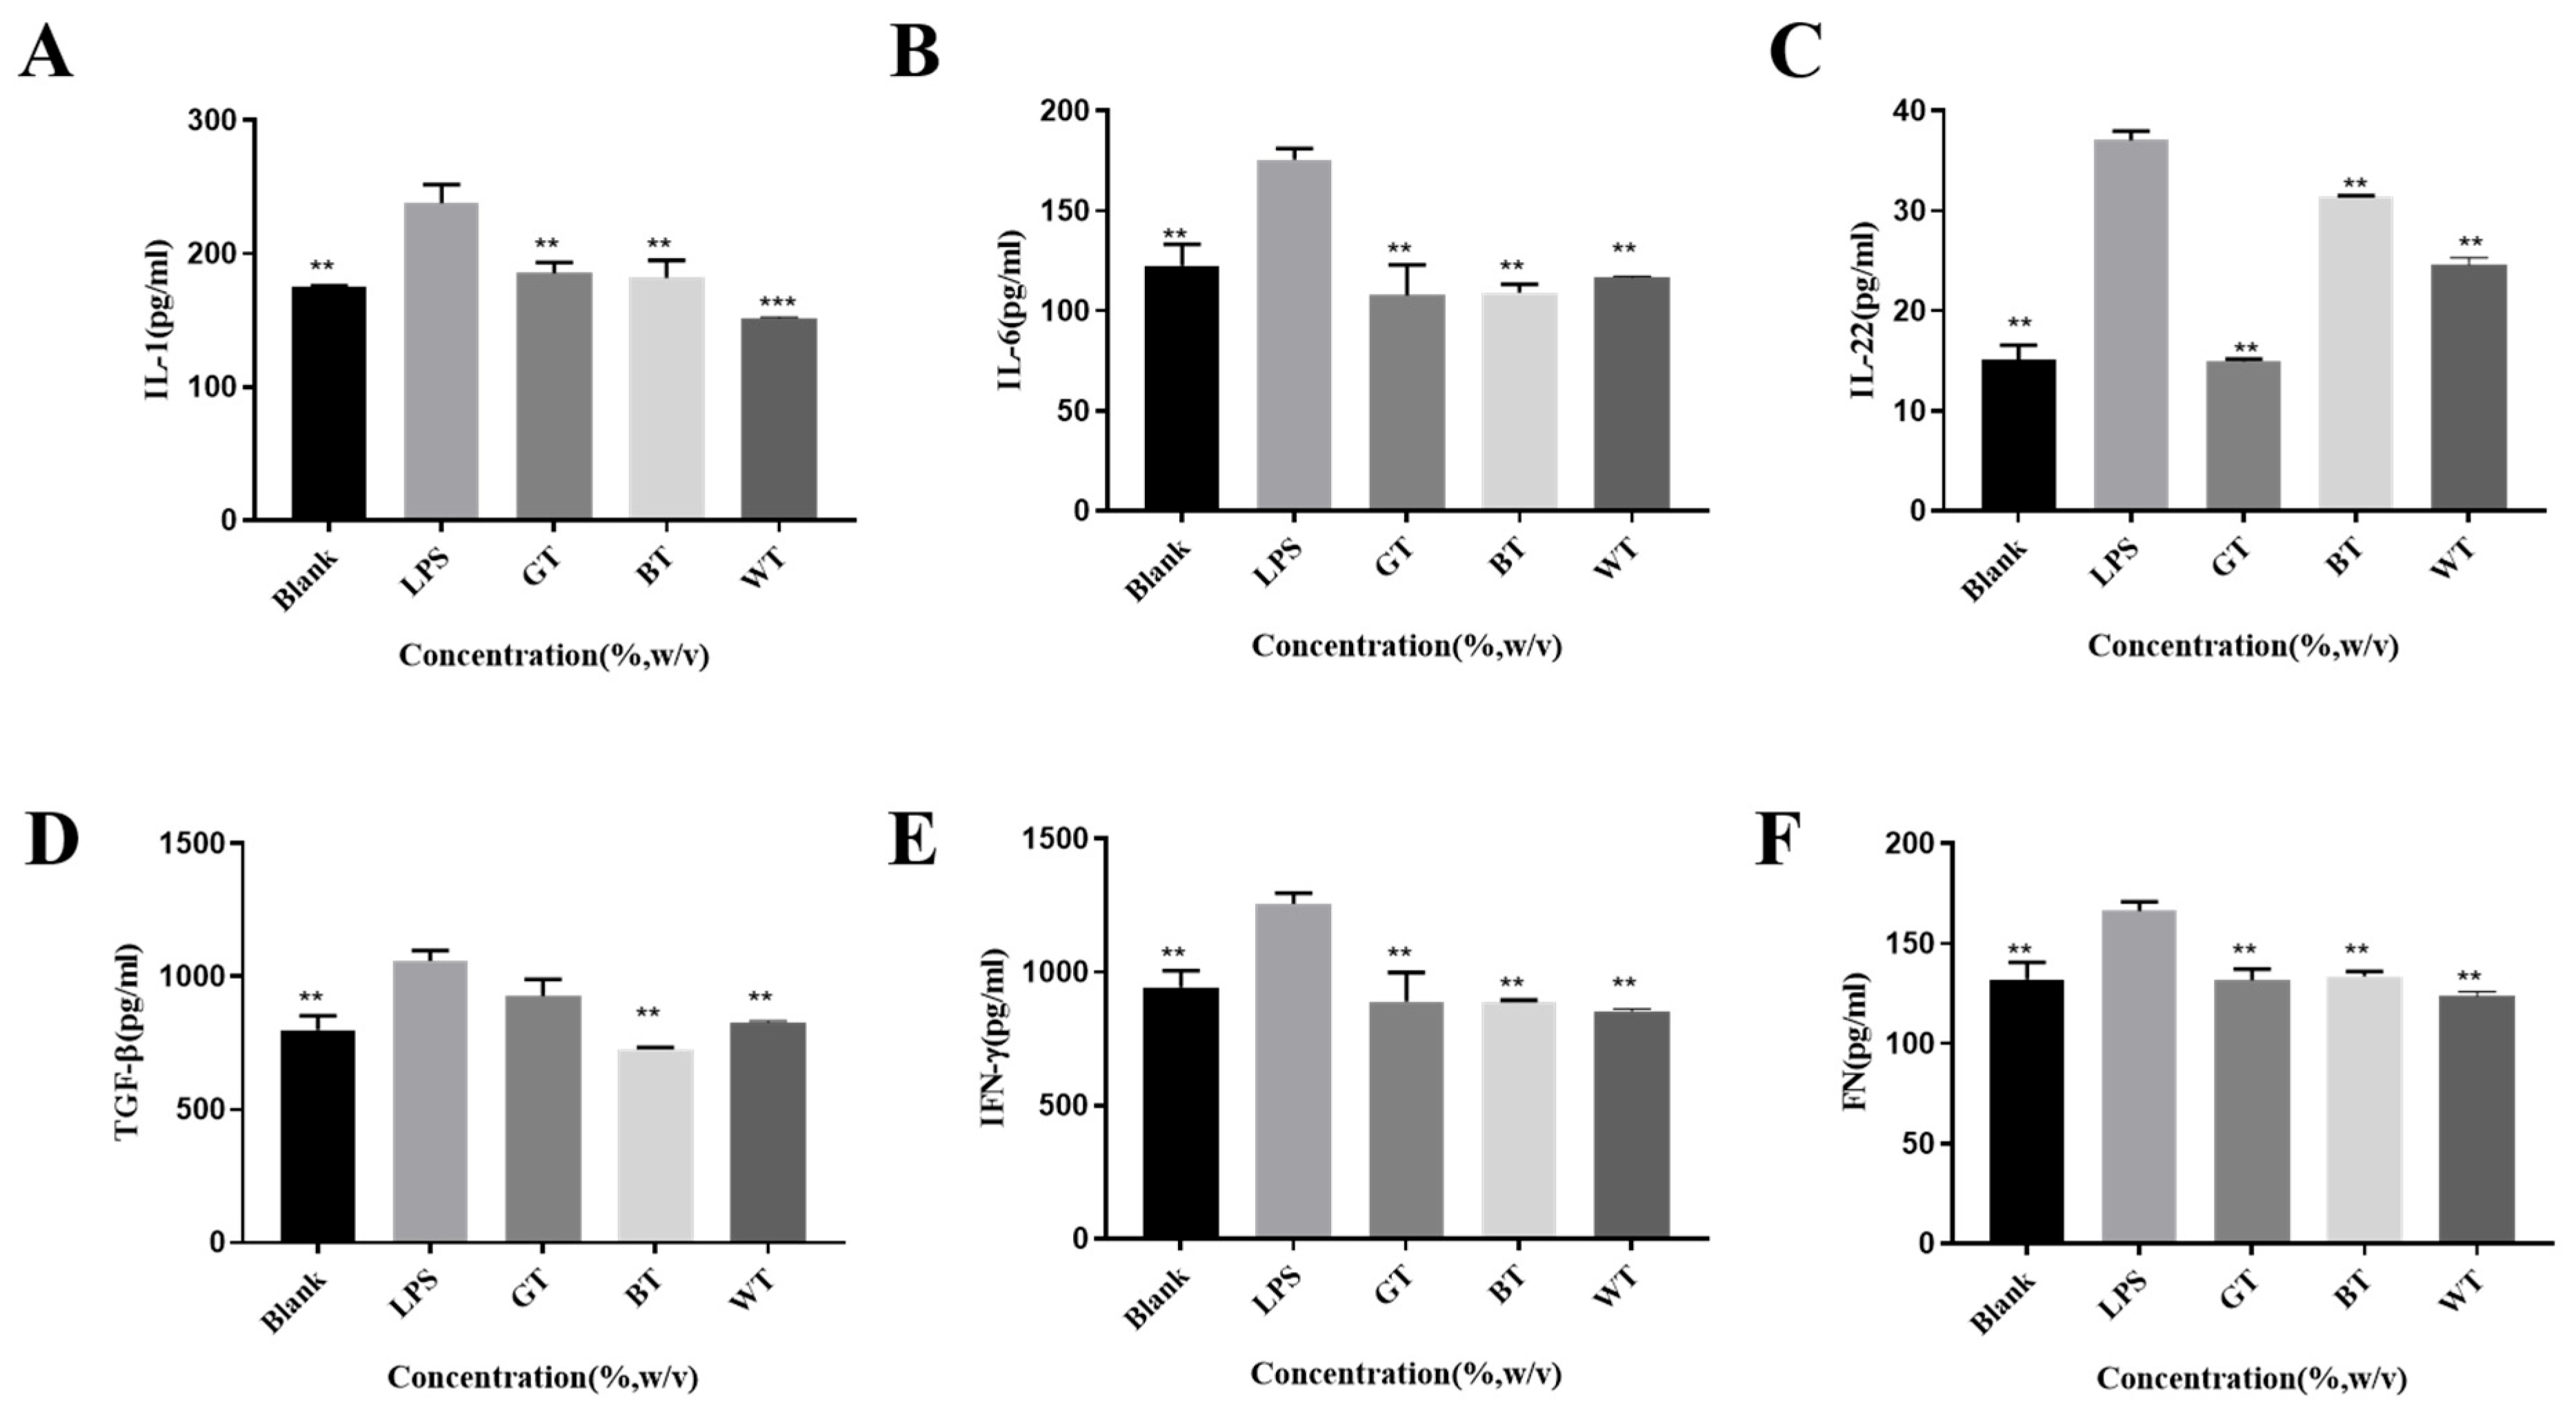
ELISA Experiment Results
3. Discussion
4. Materials and Methods
4.1. Reagents and Plant Materials
4.2. Extraction of Three Alcohol Extracts from Tea
4.3. Chemical Composition Analysis of Three Kinds of Tea
4.4. Bacterial Observation and Inhibition Assay
4.5. Animal Experiments
4.6. Histological Observation and Immunohistochemical Analysis
4.7. Differential Gene Screening and Functional Analysis
4.8. Cytotoxicity Assay
4.9. ROS Level Detection
4.10. NO Secretion Detection
4.11. Cell Scratch Test
4.12. Neutral Red Uptake Assay
4.13. Measurement of Skin IL-1, IL-6, IL-22, IFN-γ, TGF-β and FN Levels
4.14. Statistical Analysis
5. Conclusions
Author Contributions
Funding
Institutional Review Board Statement
Informed Consent Statement
Data Availability Statement
Acknowledgments
Conflicts of Interest
References
- World Health Organization. Global Report on Psoriasis; World Health Organization: Geneva, Switzerland, 2016. [Google Scholar]
- Institute for Health Metrics and Evaluation (IHME). Global Burden of Disease Study 2010 (GBD 2010) Results by Cause 1990–2010; Institute for Health Metrics and Evaluation (IHME): Seattle, WA, USA, 2012. [Google Scholar]
- Fujii, R.; Mould, J.; Tang, B.; Brandt, H.; Pomerantz, D.; Chapnick, J.; Sternbach, N.; Manfrin, D. PSY46 burden of disease in patients with diagnosed psoriasis in Brazil: Results From 2011 National Health and Wellness Survey (NHWS). Value Health 2012, 15, A107. [Google Scholar] [CrossRef]
- Griffiths, C.E.M.; Christophers, E.; Barker, J.N.W.N.; Chalmers, R.J.G.; Chimenti, S.; Krueger, G.G.; Leonardi, C.; Menter, A.; Ortonne, J.P.; Fry, L. A classification of psoriasis vulgaris according to phenotype. Br. J. Dermatol. 2007, 156, 258–262. [Google Scholar] [CrossRef]
- Lowes, M.A.; Suárez-Fariñas, M.; Krueger, J.G. Immunology of Psoriasis. Annu. Rev. Immunol. 2014, 32, 227–255. [Google Scholar] [CrossRef]
- Rendon, A.; Schäkel, K. Psoriasis Pathogenesis and Treatment. Int. J. Mol. Sci. 2019, 20, 1475. [Google Scholar] [CrossRef]
- Abraham, N.; Krishnan, N.; Raj, A. Management of psoriasis-ayurveda and allopathy—A review. Int. J. Dermatol. Clin. Res. 2019, 5, 018–023. [Google Scholar] [CrossRef]
- Huang, T.-H.; Lin, C.-F.; Alalaiwe, A.; Yang, S.-C.; Fang, J.-Y. Apoptotic or Antiproliferative Activity of Natural Products against Keratinocytes for the Treatment of Psoriasis. Int. J. Mol. Sci. 2019, 20, 2558. [Google Scholar] [CrossRef] [PubMed]
- Dabholkar, N.; Rapalli, V.K.; Singhvi, G. Potential herbal constituents for psoriasis treatment as protective and effective therapy. Phytother. Res. 2021, 35, 2429–2444. [Google Scholar] [CrossRef] [PubMed]
- Wiseman, S.A.; Balentine, D.A.; Frei, B. Antioxidants in tea. Crit. Rev. Food Sci. Nutr. 1997, 37, 705–718. [Google Scholar] [CrossRef] [PubMed]
- Li, Q.S.; Wang, Y.Q.; Liang, Y.R.; Lu, J.L. The anti-allergic potential of tea: A review of its components, mechanisms and risks. Food Funct. 2021, 12, 57–69. [Google Scholar] [CrossRef]
- Rothenberg, D.O.N.; Zhang, L. Mechanisms Underlying the Anti-Depressive Effects of Regular Tea Consumption. Nutrients 2019, 11, 1361. [Google Scholar] [CrossRef] [PubMed]
- Kochman, J.; Jakubczyk, K.; Antoniewicz, J.; Mruk, H.; Janda, K. Health Benefits and Chemical Composition of Matcha Green Tea: A Review. Molecules 2021, 26, 85. [Google Scholar] [CrossRef]
- Hilal, Y.; Engelhardt, U. Characterisation of white tea—Comparison to green and black tea. J. Verbraucherschutz Leb. 2007, 2, 414–421. [Google Scholar] [CrossRef]
- Rashidi, B.; Malekzadeh, M.; Goodarzi, M.; Masoudifar, A.; Mirzaei, H. Green tea and its anti-angiogenesis effects. Biomed. Pharmacother. 2017, 89, 949–956. [Google Scholar] [CrossRef] [PubMed]
- Reygaert, W.C. The antimicrobial possibilities of green tea. Front. Microbiol. 2014, 5, 434. [Google Scholar] [CrossRef] [PubMed]
- Łuczaj, W.; Skrzydlewska, E. Antioxidative properties of black tea. Prev. Med. 2005, 40, 910–918. [Google Scholar] [CrossRef]
- Dias, T. White Tea (Camellia sinensis (L.)): An-tioxidant properties and beneficial health effects. Int. J. Food Sci. Nutr. Diet 2013, 2, 19–26. [Google Scholar]
- Sanlier, N.; Atik, İ.; Atik, A. A minireview of effects of white tea consumption on diseases. Trends Food Sci. Technol. 2018, 82, 82–88. [Google Scholar] [CrossRef]
- Honma, M.; Hayashi, K. Psoriasis: Recent progress in molecular-targeted therapies. J. Dermatol. 2021, 48, 761–777. [Google Scholar] [CrossRef]
- Pan, J.; Jiang, Y.; Lv, Y.; Li, M.; Zhang, S.; Liu, J.; Zhu, Y.; Zhang, H. Comparison of the main compounds in Fuding white tea infusions from various tea types. Food Sci. Biotechnol. 2018, 27, 1311–1318. [Google Scholar] [CrossRef]
- Xu, Y.-Q.; Ji, W.-B.; Yu, P.; Chen, J.-X.; Wang, F.; Yin, J.-F. Effect of extraction methods on the chemical components and taste quality of green tea extract. Food Chem. 2018, 248, 146–154. [Google Scholar] [CrossRef]
- Ito, A.; Yanase, E. Study into the chemical changes of tea leaf polyphenols during japanese black tea processing. Food Res. Int. 2022, 160, 111731. [Google Scholar] [CrossRef]
- Cejka, Č.; Kubinova, S.; Cejkova, J. Trehalose in ophthalmology. Histol. Histopathol. 2019, 34, 611–618. [Google Scholar]
- Barcelos, R.P.; Lima, F.D.; Carvalho, N.R.; Bresciani, G.; Royes, L.F.F. Caffeine effects on systemic metabolism, oxidative-inflammatory pathways, and exercise performance. Nutr. Res. 2020, 80, 1–17. [Google Scholar] [CrossRef]
- Kapoor, B.; Gulati, M.; Rani, P.; Gupta, R. Psoriasis: Interplay between dysbiosis and host immune system. Autoimmun. Rev. 2022, 21, 103169. [Google Scholar] [CrossRef] [PubMed]
- Chang, H.-W.; Yan, D.; Singh, R.; Liu, J.; Lu, X.; Ucmak, D.; Lee, K.; Afifi, L.; Fadrosh, D.; Leech, J.; et al. Alteration of the cutaneous microbiome in psoriasis and potential role in Th17 polarization. Microbiome 2018, 6, 154. [Google Scholar] [CrossRef]
- Buhaș, M.C.; Gavrilaș, L.I.; Candrea, R.; Cătinean, A.; Mocan, A.; Miere, D.; Tătaru, A. Gut microbiota in psoriasis. Nutrients 2022, 14, 2970. [Google Scholar] [CrossRef] [PubMed]
- Hidalgo-Cantabrana, C.; Gómez, J.; Delgado, S.; Requena-López, S.; Queiro-Silva, R.; Margolles, A.; Coto, E.; Sánchez, B.; Coto-Segura, P. Gut microbiota dysbiosis in a cohort of patients with psoriasis. Br. J. Dermatol. 2019, 181, 1287–1295. [Google Scholar] [CrossRef] [PubMed]
- Wen, C.; Pan, Y.; Gao, M.; Wang, J.; Huang, K.; Tu, P. Altered gut microbiome composition in nontreated plaque psoriasis patients. Microb. Pathog. 2023, 175, 105970. [Google Scholar] [CrossRef] [PubMed]
- Zhou, X.-Y.; Chen, K.; Zhang, J.-A. Mast cells as important regulators in the development of psoriasis. Front. Immunol. 2022, 13, 1022986. [Google Scholar] [CrossRef]
- Zhou, X.; Hu, Y.; Liu, L.; Liu, L.; Chen, H.; Huang, D.; Ju, M.; Luan, C.; Chen, K.; Zhang, J. IL-33-mediated activation of mast cells is involved in the progression of imiquimod-induced psoriasis-like dermatitis. Cell Commun. Signal. 2023, 21, 52. [Google Scholar] [CrossRef]
- Mosca, M.; Hong, J.; Hadeler, E.; Hakimi, M.; Liao, W.; Bhutani, T. The Role of IL-17 Cytokines in Psoriasis. Immunotargets Ther. 2021, 10, 409–418. [Google Scholar] [CrossRef] [PubMed]
- Vandeghinste, N.; Klattig, J.; Jagerschmidt, C.; Lavazais, S.; Marsais, F.; Haas, J.D.; Auberval, M.; Lauffer, F.; Moran, T.; Ongenaert, M.; et al. Neutralization of IL-17C Reduces Skin Inflammation in Mouse Models of Psoriasis and Atopic Dermatitis. J. Investig. Dermatol. 2018, 138, 1555–1563. [Google Scholar] [CrossRef]
- Naveed, M.; BiBi, J.; Kamboh, A.A.; Suheryani, I.; Kakar, I.; Fazlani, S.A.; FangFang, X.; Yunjuan, L.; Kakar, M.U.; Abd El-Hack, M.E. Pharmacological values and therapeutic properties of black tea (Camellia sinensis): A comprehensive overview. Biomed. Pharmacother. 2018, 100, 521–531. [Google Scholar] [CrossRef] [PubMed]
- Barbalho, S.M.; Bosso, H.; Salzedas-Pescinini, L.M.; de Alvares Goulart, R. Green tea: A possibility in the therapeutic approach of inflammatory bowel diseases?: Green tea and inflammatory bowel diseases. Complement. Ther. Med. 2019, 43, 148–153. [Google Scholar] [CrossRef]
- Chokshi, A.; Beckler, M.D.; Laloo, A.; Kesselman, M.M. Paradoxical tumor necrosis factor-alpha (TNF-α) inhibitor-induced psoriasis: A systematic review of pathogenesis, clinical presentation, and treatment. Cureus 2023, 15, e42791. [Google Scholar] [CrossRef] [PubMed]
- Saral, S.; Dokumacioglu, E.; Mercantepe, T.; Atak, M.; Cinar, S.; Saral, O.; Yildiz, L.; Iskender, H.; Tumkaya, L. The effect of white tea on serum TNF-α/NF-κB and immunohistochemical parameters in cisplatin-related renal dysfunction in female rats. Biomed. Pharmacother. 2019, 112, 108604. [Google Scholar] [CrossRef]
- Paul, S.; Sen, S.; Nath, I.; Kumar, A.; Biswas, U.K. Psoriasis, An inflammatory condition associated with oxidative stress. Asian J. Med. Sci. 2021, 12, 24. [Google Scholar] [CrossRef]
- Cannavo, S.P.; Riso, G.; Casciaro, M.; Di Salvo, E.; Gangemi, S. Oxidative stress involvement in psoriasis: A systematic review. Free. Radic. Res. 2019, 53, 829–840. [Google Scholar] [CrossRef]
- Dobrică, E.-C.; Cozma, M.-A.; Găman, M.-A.; Voiculescu, V.-M.; Găman, A.M. The Involvement of Oxidative Stress in Psoriasis: A Systematic Review. Antioxidants 2022, 11, 282. [Google Scholar] [CrossRef]
- Korman, N. Management of psoriasis as a systemic disease: What is the evidence? Br. J. Dermatol. 2020, 182, 840–848. [Google Scholar] [CrossRef]
- Ghosh, A.; Roy, M. Black Tea Extract, via Modulation of TGF-β Pathway, Prevents Inorganic Arsenic-induced Development of Squamous Cell Carcinoma of the Skin in Swiss Albino Mice. J. Cancer Prev. 2023, 28, 12–23. [Google Scholar] [CrossRef] [PubMed]
- Li, J.; Yip, Y.W.Y.; Ren, J.; Hui, W.K.; He, J.N.; Yu, Q.X.; Chu, K.O.; Ng, T.K.; Chan, S.O.; Pang, C.P.; et al. Green tea catechins alleviate autoimmune symptoms and visual impairment in a murine model for human chronic intraocular inflammation by inhibiting Th17-associated pro-inflammatory gene expression. Sci. Rep. 2019, 9, 2301. [Google Scholar] [CrossRef] [PubMed]
- Ghoreschi, K.; Balato, A.; Enerbäck, C.; Sabat, R. Therapeutics targeting the IL-23 and IL-17 pathway in psoriasis. Lancet 2021, 397, 754–766. [Google Scholar] [CrossRef]
- Liu, W.; Pan, W.; Zou, M.; Jin, S.; Mi, R.; Cheng, G.; Piao, H. Tacrolimus and paclitaxel co-loaded O/O ointment without surfactant: Synergistic combinations for the treatment of psoriasis. Eur. J. Pharm. Biopharm. 2023, 185, 28–43. [Google Scholar] [CrossRef]
- Fereig, S.A.; El-Zaafarany, G.M.; Arafa, M.G.; Abdel-Mottaleb, M.M.A. Tacrolimus-loaded chitosan nanoparticles for enhanced skin deposition and management of plaque psoriasis. Carbohydr. Polym. 2021, 268, 118238. [Google Scholar] [CrossRef] [PubMed]


| NO. | Identified Compounds I | Relative Content% II | Mass (m/z) | Formula | Classification III | ||
|---|---|---|---|---|---|---|---|
| BT | GT | WT | |||||
| 1 | Choline | 1.67 | 0.84 | 1.28 | 103.09989 | C5H13NO | |
| 2 | L-Valine | 0.26 | 0.34 | 0.34 | 117.07899 | C5H11NO2 | a |
| 3 | Succinic acid | 0.02 | 0.02 | 0.03 | 118.02647 | C4H6O4 | c |
| 4 | 4-Hydroxybenzaldehyde | / | 0.06 | 0.02 | 122.0368 | C7H6O2 | |
| 5 | Nicotinamide | 0.18 | 0.15 | 0.36 | 122.04798 | C6H6N2O | |
| 6 | 5-Hydroxymethyl-2-furaldehyde | 0.08 | 0.12 | 0.08 | 126.03163 | C6H6O3 | c |
| 7 | D-(+)-Pyroglutamic Acid | 0.46 | 0.82 | 0.50 | 129.04247 | C5H7NO3 | c |
| 8 | Pipecolic acid | 0.08 | 0.37 | 0.07 | 129.07886 | C6H11NO2 | c |
| 9 | L-Norleucine | 0.18 | 0.34 | 0.27 | 131.09454 | C6H13NO2 | c |
| 10 | Salicylic acid | 0.03 | 0.05 | 0.08 | 138.03149 | C7H6O3 | c |
| 11 | Isophorone | 0.12 | 0.06 | 0.12 | 138.10425 | C9H14O | |
| 12 | L-Glutamic acid | 0.33 | 0.84 | 0.44 | 147.05287 | C5H9NO4 | a |
| 13 | 2,3-Dihydroxybenzoic acid | 0.02 | / | 0.02 | 154.02644 | C7H6O4 | c |
| 14 | 4-tert-Amylphenol | 0.04 | 0.06 | 0.05 | 164.11852 | C11H16O | p |
| 15 | L-Phenylalanine | 0.07 | 0.10 | 0.08 | 165.07867 | C9H11NO2 | a |
| 16 | Gallic acid | / | / | 0.00 | 170.02037 | C7H6O5 | c |
| 17 | 6,7-Dihydroxycoumarin | 0.15 | 0.02 | 0.06 | 178.02626 | C9H6O4 | s |
| 18 | Theobromine | 0.21 | 0.06 | 0.03 | 180.06439 | C7H8N4O2 | |
| 19 | Citric acid | 0.12 | 0.08 | 0.23 | 192.02703 | C6H8O7 | c |
| 20 | Scopoletin | 0.01 | / | / | 192.04196 | C10H8O4 | |
| 21 | D-(−)-Quinic acid | 3.48 | 2.68 | 3.30 | 192.06323 | C7H12O6 | c |
| 22 | Caffeine | 34.37 | 0.02 | 17.96 | 194.07998 | C8H10N4O2 | |
| 23 | Gluconic acid | 0.36 | 0.08 | 0.29 | 196.05806 | C6H12O7 | c |
| 24 | NP-021797 | 0.05 | / | / | 214.1564 | C12H22O3 | |
| 25 | Palmitic acid | / | / | 0.01 | 256.24022 | C16H32O2 | c |
| 26 | Adenosine | 0.01 | 0.01 | 0.02 | 267.09582 | C10H13N5O4 | |
| 27 | Monolaurin | 0.05 | 0.05 | 0.08 | 274.21374 | C15H30O4 | |
| 28 | Linoleic acid | 0.02 | 0.01 | 0.02 | 280.24019 | C18H32O2 | c |
| 29 | Elaidic acid | 0.12 | 0.10 | 0.20 | 282.25582 | C18H34O2 | c |
| 30 | Stearamide | 3.20 | 5.26 | 3.24 | 283.28694 | C18H37NO | |
| 31 | Phenylethyl 2-Glucoside | / | 0.02 | 0.01 | 284.12516 | C14H20O6 | s |
| 32 | Kaempferol | 0.02 | 0.02 | 0.01 | 286.04693 | C15H10O6 | f |
| 33 | Luteolin | 0.07 | 0.01 | 0.01 | 286.04742 | C15H10O6 | f |
| 34 | 9-Oxo-10(E),12(E)-octadecadienoic acid | 0.33 | 0.14 | 0.31 | 294.21877 | C18H30O3 | c |
| 35 | Tridemorph | 0.20 | 0.29 | 0.19 | 297.3024 | C19H39NO | |
| 36 | Morin | 0.08 | 0.10 | 0.07 | 302.04181 | C15H10O7 | f |
| 37 | NP-010776 | 0.07 | 0.14 | 0.02 | 302.04185 | C15H10O7 | |
| 38 | Quercetin | 0.03 | 0.04 | 0.01 | 302.04213 | C15H10O7 | f |
| 39 | 2,3-dihydroxypropyl 12-methyltridecanoate | 1.60 | 1.32 | 2.13 | 302.24482 | C17H34O4 | |
| 40 | (−)-Gallocatechin | 0.02 | 2.87 | 0.51 | 306.07345 | C15H14O7 | p |
| 41 | Oleoyl ethylamide | 0.79 | 1.16 | 0.74 | 309.30232 | C20H39NO | |
| 42 | (±)9-HpODE | / | / | 0.01 | 312.23027 | C18H32O4 | c |
| 43 | (±)9(10)-DiHOME | 0.37 | 0.23 | 0.53 | 314.24565 | C18H34O4 | c |
| 44 | NP-008993 | 0.08 | 0.06 | 0.10 | 314.24587 | C18H34O4 | |
| 45 | NP-020139 | / | 0.01 | 0.01 | 316.07956 | C13H16O9 | |
| 46 | Myricetin | / | 0.05 | 0.02 | 318.03673 | C15H10O8 | f |
| 47 | 5-OxoETE | 0.21 | 0.11 | 0.24 | 318.21647 | C20H30O3 | c |
| 48 | Linoleoyl Ethanolamide | 0.05 | 0.06 | 0.03 | 323.28161 | C20H37NO2 | |
| 49 | Glabridin | 0.07 | 0.04 | 0.08 | 324.1356 | C20H20O4 | f |
| 50 | TOFA | 1.39 | 1.14 | 1.72 | 324.22701 | C19H32O4 | c |
| 51 | Corchorifatty acid F | 0.03 | / | 0.01 | 328.22506 | C18H32O5 | c |
| 52 | NP-002113 | 0.03 | 0.02 | 0.03 | 332.1956 | C20H28O4 | |
| 53 | Bicyclo Prostaglandin E2 | 0.09 | 0.08 | 0.13 | 334.21122 | C20H30O4 | c |
| 54 | Erucamide | 4.63 | 4.20 | 5.89 | 337.33354 | C22H43NO | |
| 55 | NP-000587 | 0.14 | / | 0.04 | 338.1 | C16H18O8 | c |
| 56 | Docosanamide | 0.18 | 0.25 | 0.21 | 339.34927 | C22H45NO | |
| 57 | Cyanox 2246 | 6.15 | 6.88 | 6.13 | 340.24028 | C23H32O2 | p |
| 58 | Trehalose | 0.82 | 5.25 | 2.74 | 342.11622 | C12H22O11 | s |
| 59 | NP-021781 | 0.03 | 0.03 | 0.05 | 344.25547 | C19H36O5 | c |
| 60 | Methoxyacetyl fentanyl | 0.02 | 0.01 | 0.03 | 352.22175 | C22H28N2O2 | |
| 61 | Monoolein | 0.61 | 0.49 | 0.89 | 356.29175 | C21H40O4 | |
| 62 | 1-Stearoylglycerol | 30.98 | 24.48 | 40.15 | 358.30741 | C21H42O4 | |
| 63 | PEG n8 | 0.12 | 0.11 | 0.27 | 370.21938 | C16H34O9 | |
| 64 | 5-(Ethylsulfonyl)-2-[(3S)-1-(4-methoxybenzyl)-3-pyrrolidinyl]-1,3-benzoxazole | 0.03 | 0.04 | 0.03 | 400.14894 | C21H24N2O4S | |
| 65 | Bis-(4-ethylbenzylidene) sorbitol | 2.88 | 2.79 | 4.58 | 414.20329 | C24H30O6 | |
| 66 | AL 8810 Methyl ester | 0.02 | 0.07 | 0.07 | 416.24012 | C25H33FO4 | |
| 67 | NP-020760 | 0.01 | 0.04 | 0.02 | 418.25592 | C21H38O8 | |
| 69 | Isovitexin | 0.05 | 0.03 | 0.01 | 432.10491 | C21H20O10 | s |
| 70 | Vitexin | 0.04 | 0.03 | 0.01 | 432.10503 | C21H20O10 | f |
| 71 | Afzelin | 0.01 | / | / | 432.1051 | C21H20O10 | s |
| 72 | Nα-({(3R,4R,5R)-4,5-dihydroxy-3-[(3-pyridinylcarbonyl)amino]-1-cyclohexen-1-yl}carbonyl)-L-tyrosinamide | / | 27.65 | / | 440.16493 | C22H24N4O6 | |
| 73 | Astragalin | 0.13 | 0.12 | 0.02 | 448.1001 | C21H20O11 | f |
| 74 | Oleanolic acid | 0.09 | 0.11 | 456.35933 | C30H48O3 | c | |
| 75 | Epigallocatechin gallate | 0.08 | 3.61 | 1.07 | 458.08481 | C22H18O11 | f |
| 76 | Isoquercitrin | 0.22 | 0.62 | 0.16 | 464.09494 | C21H20O12 | s |
| 77 | Myricetin 3-O-beta-d-galactopyranoside | 0.04 | 0.41 | 0.14 | 480.08991 | C21H20O13 | s |
| 78 | PEG n11 | 0.06 | 0.05 | 0.10 | 502.29807 | C22H46O12 | |
| 79 | Methyl (2R,4S,6S,12bR)-4-(4-fluorophenyl)-2-{[2-(4-morpholinyl)ethyl]amino}-1,2,3,4,6,7,12,12b-octahydroindolo[2,3-a]quinolizine-6-carboxylate | 0.06 | 0.04 | 0.07 | 506.26366 | C29H35FN4O3 | |
| 80 | (3beta,9xi)-3-(beta-d-Glucopyranosyloxy)-14-hydroxycard-20(22)-enolide | 0.06 | / | 0.01 | 536.2954 | C29H44O9 | |
| 81 | PEG n12 | 0.04 | 0.03 | 0.07 | 546.32419 | C24H50O13 | |
| 82 | Vicenin III | 0.26 | 0.17 | 0.08 | 564.14715 | C26H28O14 | s |
| 83 | Vitexin rhamnoside | 0.05 | 0.07 | 0.05 | 578.16279 | C27H30O14 | s |
| 84 | Vicenin II | 0.03 | 0.02 | 0.01 | 594.15772 | C27H30O15 | s |
| 85 | Kaempferol-3-O-rutinoside | 0.08 | 0.17 | 0.02 | 594.15805 | C27H30O15 | s |
| 86 | Rutin | 0.15 | 0.99 | 0.14 | 610.15276 | C27H30O16 | s |
| 87 | 1,2-Dipalmitoylphosphatidylglycerol | 0.45 | 0.26 | 0.59 | 722.51659 | C38H75O10P | |
| 88 | Grosvenorine | 0.01 | / | / | 740.21585 | C33H40O19 | f |
| Amino acids | 0.66 | 1.29 | 0.85 | ||||
| Carboxylic acids | 7.68 | 6.41 | 8.22 | ||||
| Flavonoids | 0.55 | 4.02 | 1.29 | ||||
| Phenols | 6.22 | 9.81 | 6.69 | ||||
| Sugars | 1.84 | 7.77 | 3.42 | ||||
| Alcohol Extract of Tea | Inhibition Zone Diameter (mm) | |
|---|---|---|
| Gram Negative Bacteria | Gram Positive Microbes | |
| Escherichia coli | Staphylococcus aureus | |
| BT | 1.9 ± 0.57 | 3.0 ± 0.20 |
| WT | 1.6 ± 0.55 | 1.5 ± 0.50 |
| GT | 1.3 ± 0.81 | 1.2 ± 0.69 |
| Negative Control | 0.9 ± 0.23 | 1.1 ± 0.34 |
Disclaimer/Publisher’s Note: The statements, opinions and data contained in all publications are solely those of the individual author(s) and contributor(s) and not of MDPI and/or the editor(s). MDPI and/or the editor(s) disclaim responsibility for any injury to people or property resulting from any ideas, methods, instructions or products referred to in the content. |
© 2024 by the authors. Licensee MDPI, Basel, Switzerland. This article is an open access article distributed under the terms and conditions of the Creative Commons Attribution (CC BY) license (https://creativecommons.org/licenses/by/4.0/).
Share and Cite
Zhang, L.; Huang, Z.; Xuan, J.; Yang, L.; Zhao, T.; Peng, W. Anti-Psoriatic Activity of Black, Green and White Tea Extracts from Southeastern China. Molecules 2024, 29, 1279. https://doi.org/10.3390/molecules29061279
Zhang L, Huang Z, Xuan J, Yang L, Zhao T, Peng W. Anti-Psoriatic Activity of Black, Green and White Tea Extracts from Southeastern China. Molecules. 2024; 29(6):1279. https://doi.org/10.3390/molecules29061279
Chicago/Turabian StyleZhang, Lanyue, Zeting Huang, Jie Xuan, Lu Yang, Tiantian Zhao, and Weihua Peng. 2024. "Anti-Psoriatic Activity of Black, Green and White Tea Extracts from Southeastern China" Molecules 29, no. 6: 1279. https://doi.org/10.3390/molecules29061279
APA StyleZhang, L., Huang, Z., Xuan, J., Yang, L., Zhao, T., & Peng, W. (2024). Anti-Psoriatic Activity of Black, Green and White Tea Extracts from Southeastern China. Molecules, 29(6), 1279. https://doi.org/10.3390/molecules29061279