


Supervised Machine Learning-Based Prediction of Hydrogen Storage Classes Utilizing Dibenzyltoluene as an Organic Carrier


Abstract
1. Introduction
2. Simulations and Results
3. Materials and Methods

| S. No. | Input/Output Parameters |
|---|---|
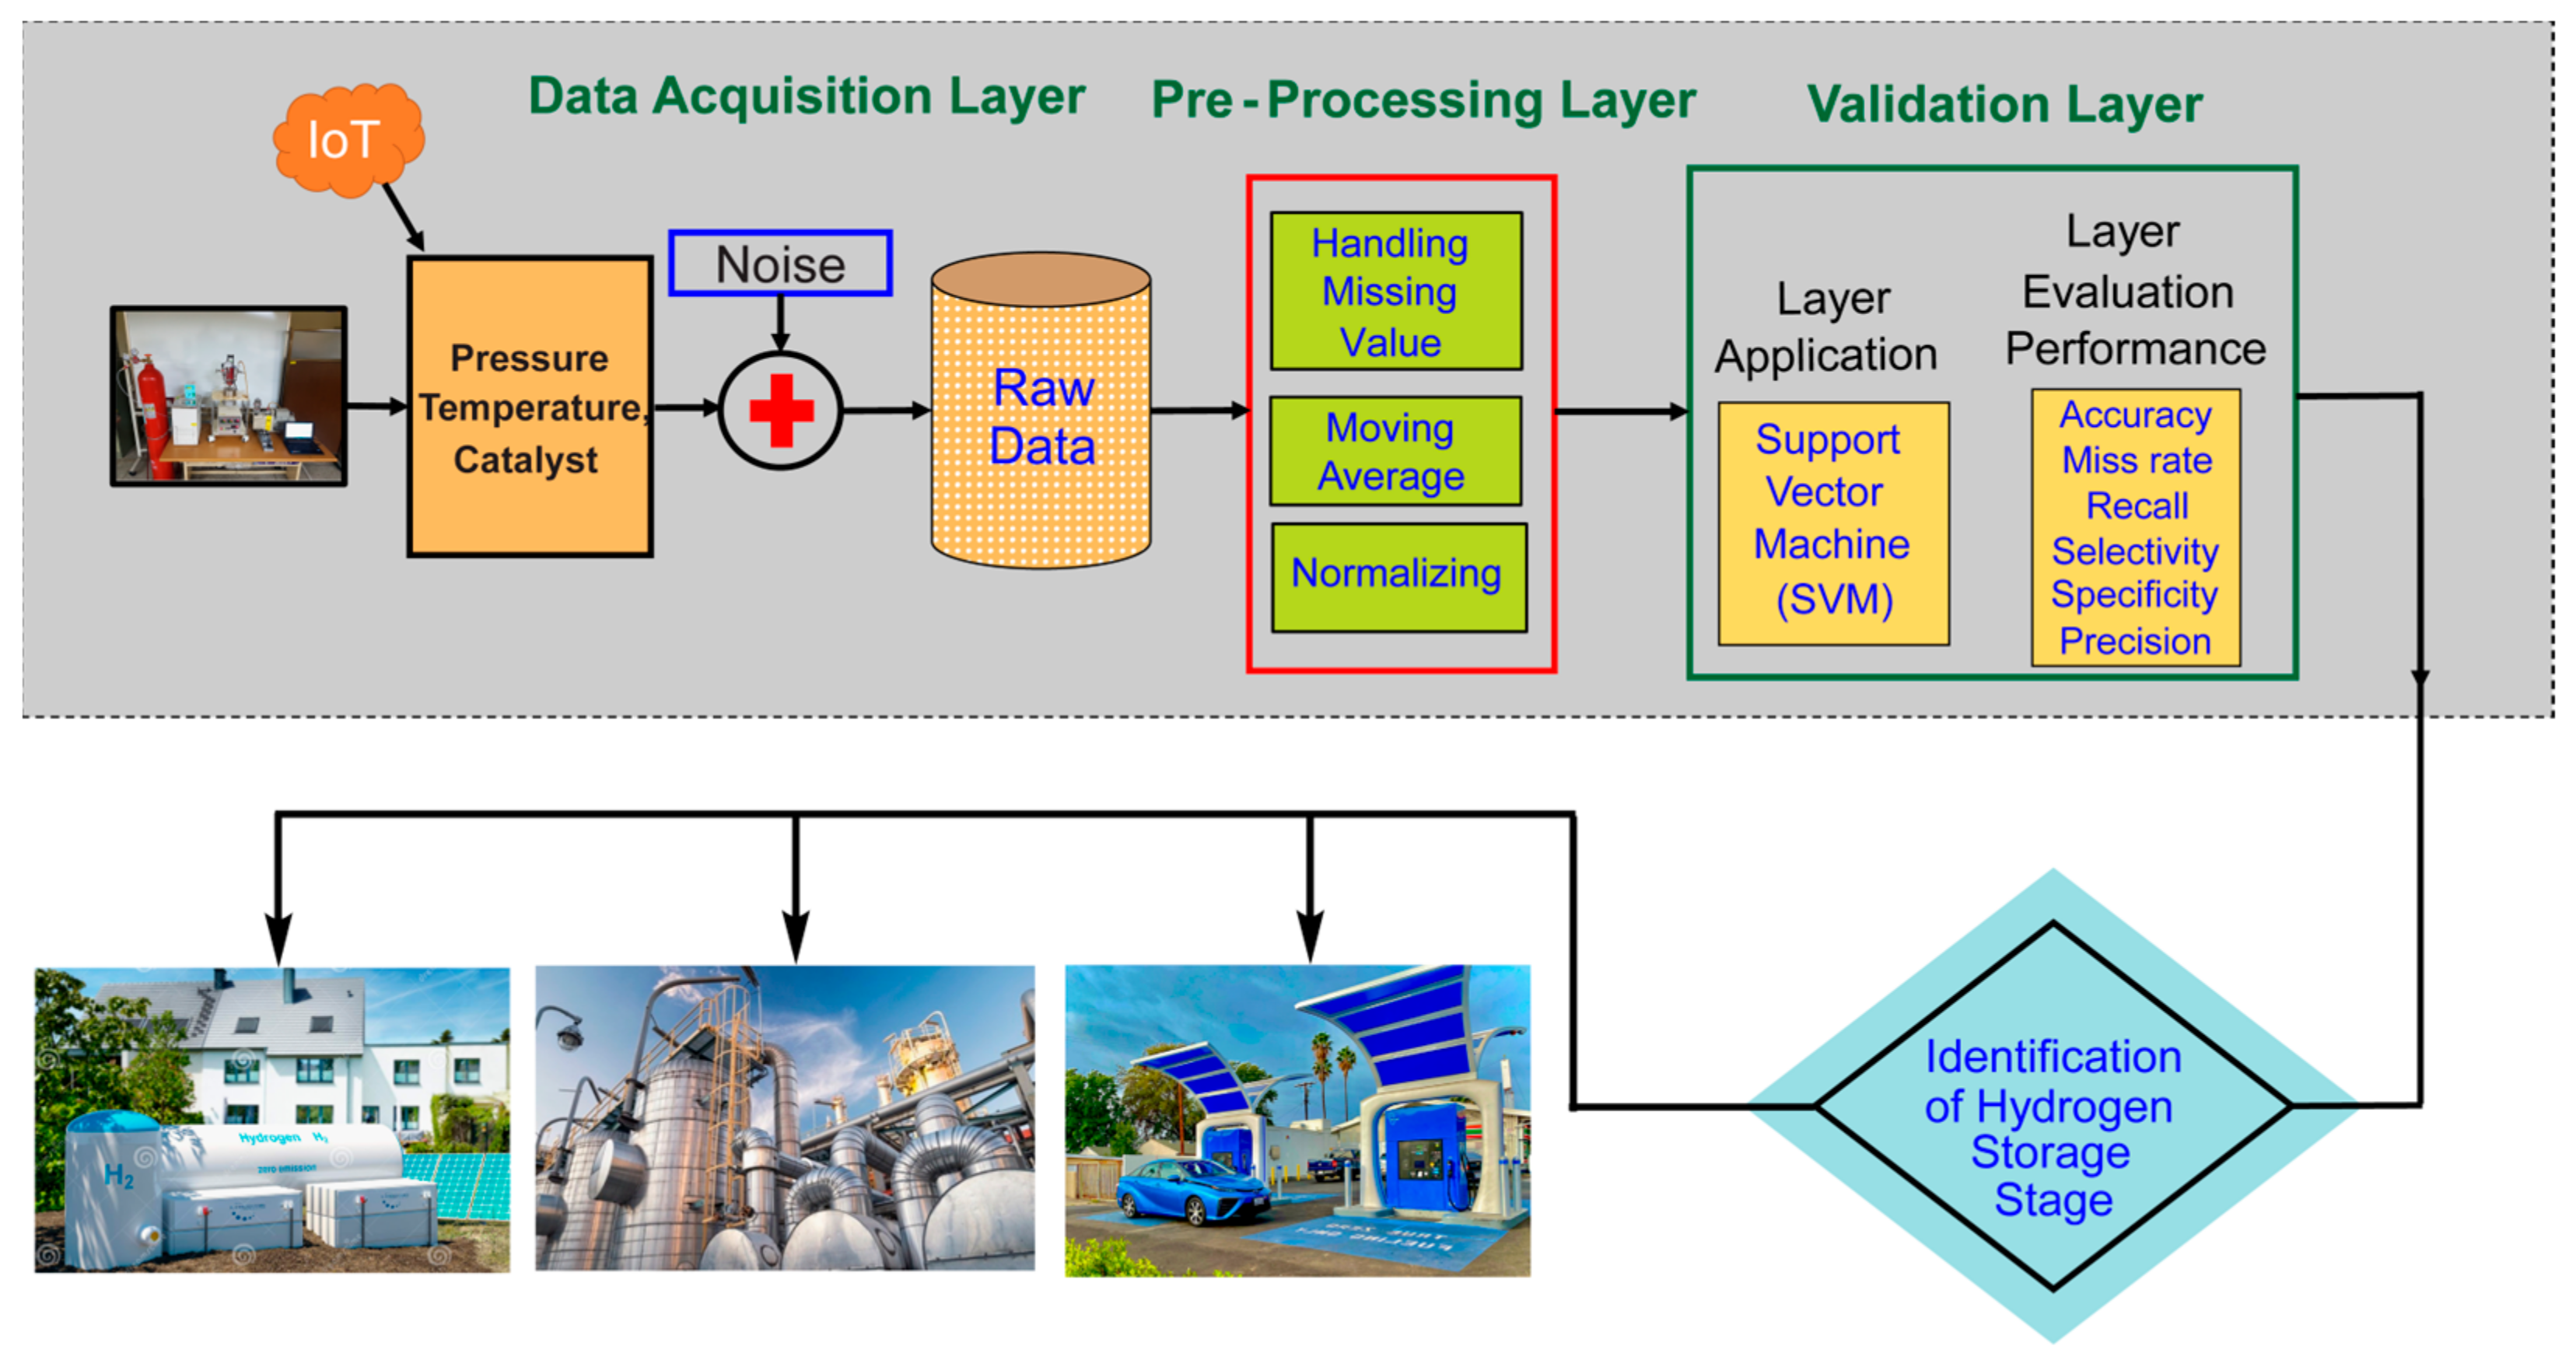
| Input 1 | Temperature |
| Input 2 | Pressure |
| Input 3 | H0-DBT Concentration |
| Input 4 | Catalyst Concentration |
| Output | Hydrogen Storage Classes (Low, Medium, and High) |
4. Discussions
4.1. 5-Fold Cross Validation
4.2. Resubstitution Validation
4.3. Holdout Validation
4.4. Receiver Operating Characteristic Curve
4.5. Comparative Analysis of the 5-FCV, RV, and HV
5. Conclusions
Author Contributions
Funding
Institutional Review Board Statement
Informed Consent Statement
Data Availability Statement
Conflicts of Interest
References
- Available online: http://sdg.iisd.org/news/world-population-to-reach-9-9-billion-by-2050/ (accessed on 14 December 2023).
- Endo, N.; Goshome, K.; Tetsuhiko, M.; Segawa, Y.; Shimoda, E.; Nozu, T. Thermal management and power saving operations for improved energy efficiency within a renewable hydrogen energy system utilizing metal hydride hydrogen storage. Int. J. Hydrogen Energy 2021, 46, 262–271. [Google Scholar] [CrossRef]
- Singh, R.; Singh, M.; Gautam, S. Hydrogen economy, energy, and liquid organic carriers for Its mobility. Mater. Today Proc. 2021, 46, 5420–5427. [Google Scholar] [CrossRef]
- World Health Organization. COP24 Special Report: Health and Climate Change; WHO: Geneva, Switzerland, 2018. [Google Scholar]
- Franco, M.; Bilal, U.; Diez-Roux, A.V. Preventing non-communicable diseases through structural changes in urban environments. J. Epidemiol. Commun. Health 2015, 69, 509–511. [Google Scholar] [CrossRef] [PubMed]
- Singh, R.; Altaee, A.; Gautam, S. Nanomaterials in the advancement of hydrogen energy storage. Heliyon 2020, 6, 04487. [Google Scholar] [CrossRef] [PubMed]
- Yang, J.; Sudik, A.; Wolverton, C.; Siegel, D.J. High capacity hydrogen storage materials: Attributes for automotive applications and techniques for materials discovery. Chem. Soc. Rev. 2010, 39, 656–675. [Google Scholar] [CrossRef] [PubMed]
- Ali, A.; Kumar, G.U.; Lee, H.J. Parametric study of the hydrogenation of dibenzyltoluene and its dehydrogenation performance as a liquid organic hydrogen carrier. J. Mech. Sci. Technol. 2020, 34, 3069–3077. [Google Scholar] [CrossRef]
- Kölbig, M.; Weckerle, C.; Linder, M.; Bürger, I. Review on thermal applications for metal hydrides in fuel cell vehicles: Operation modes, recent developments and crucial design aspects. Renew. Sustain. Energy Rev. 2022, 162, 112385–112394. [Google Scholar] [CrossRef]
- Abohamzeh, E.; Salehi, F.; Sheikholeslami, M.; Abbassi, R.; Khan, F. Review of hydrogen safety during storage, transmission, and applications processes. J. Loss Prev. Process Ind. 2021, 72, 104569–104578. [Google Scholar] [CrossRef]
- Yang, M.; Han, C.; Ni, G.; Wu, J.; Cheng, H. Temperature controlled three-stage catalytic dehydrogenation and cycle performance of perhydro-9-ethylcarbazole. Int. J. Hydrogen Energy 2012, 37, 12839–12845. [Google Scholar] [CrossRef]
- Wang, B.; Yan, T.; Chang, T.; Wei, J.; Zhou, Q.; Yang, S.; Fang, T. Palladium supported on reduced graphene oxide as a high-performance catalyst for the dehydrogenation of dodecahydro-N-ethylcarbazole. Carbon 2017, 122, 9–18. [Google Scholar] [CrossRef]
- Mehranfar, A.; Izadyar, M.; Esmaeili, A.A. Hydrogen storage by N-ethylcarbazol as a new liquid organic hydrogen carrier: A dft study on the mechanism. Int. J. Hydrogen Energy 2015, 40, 5797–5806. [Google Scholar] [CrossRef]
- Xue, W.; Liu, H.; Zhao, B.; Ge, L.; Yang, S.; Qiu, M.; Li, J.; Han, W.; Chen, X. Single Rh1Co catalyst enabling reversible hydrogenation and dehydrogenation of N-ethylcarbazole for hydrogen storage. Appl. Catal. B Environ. 2023, 327, 122453. [Google Scholar] [CrossRef]
- Jiang, Z.; Gong, X.; Wang, B.; Wu, Z.; Fang, T. A experimental study on the dehydrogenation performance of dodecahydro-N-ethylcarbazole on M/TiO2 catalysts. Int. J. Hydrogen Energy 2019, 44, 2951–2959. [Google Scholar] [CrossRef]
- Ge, L.; Qiu, M.; Zhu, Y.; Yang, S.; Li, W.; Li, W.; Jiang, Z.; Chen, X. Synergistic catalysis of Ru single-atoms and zeolite boosts high-efficiency hydrogen storage. Appl. Catal. B Environ. 2022, 319, 121958. [Google Scholar] [CrossRef]
- Dong, Y.; Yang, M.; Zhu, T.; Chen, X.; Cheng, G.; Ke, H.; Cheng, H. Fast dehydrogenation kinetics of perhydro-N-propylcarbazole over a supported Pd catalyst. ACS Appl. Energy Mater. 2018, 1, 4285–4292. [Google Scholar] [CrossRef]
- Dong, Y.; Yang, M.; Yang, Z.; Ke, H.; Cheng, H. Catalytic hydrogenation and dehydrogenation of N-ethylindole as a new heteroaromatic liquid organic hydrogen carrier. Int. J. Hydrogen Energy 2015, 40, 10918–10922. [Google Scholar] [CrossRef]
- Dong, Y.; Yang, M.; Zhu, T.; Chen, X.; Li, C.; Ke, H.; Cheng, H. Hydrogenation Kinetics of N-Ethylindole on a Supported Ru Catalyst. Energy Technol. 2018, 6, 558–562. [Google Scholar] [CrossRef]
- Li, L.; Yang, M.; Dong, Y.; Mei, P.; Cheng, H. Hydrogen storage and release from a new promising liquid organic hydrogen storage carrier: 2-methylindole. Int. J. Hydrogen Energy 2016, 41, 16129–16134. [Google Scholar] [CrossRef]
- Chen, Z.; Yang, M.; Zhu, T.; Zhang, Z.; Chen, X.; Liu, Z.; Dong, Y.; Cheng, G.; Cheng, H. 7-ethylindole: A new efficient liquid organic hydrogen carrier with fast kinetics. Int. J. Hydrogen Energy 2018, 43, 12688–12696. [Google Scholar] [CrossRef]
- Yang, M.; Cheng, G.; Xie, D.; Zhu, T.; Dong, Y.; Ke, H.; Cheng, H. Study of hydrogenation and dehydrogenation of 1-methylindole for reversible onboard hydrogen storage application. Int. J. Hydrogen Energy 2018, 43, 8868–8876. [Google Scholar] [CrossRef]
- Yang, M.; Xing, X.; Zhu, T.; Chen, X.; Dong, Y.; Cheng, H. Fast hydrogenation kinetics of acridine as a candidate of liquid organic hydrogen carrier family with high capacity. J. Energy Chem. 2020, 41, 115–119. [Google Scholar] [CrossRef]
- Brückner, N.; Obesser, K.; Bösmann, A.; Teichmann, D.; Arlt, W.; Dungs, J.; Wasserscheid, P. Evaluation of Industrially applied heat-transfer fluids as liquid organic hydrogen carrier systems. ChemSusChem 2014, 7, 229–235. [Google Scholar] [CrossRef]
- Modisha, P.M.; Jordaan, J.H.; Bösmann, A.; Wasserscheid, P.; Bessarabov, D. Analysis of reaction mixtures of perhydro-dibenzyltoluene using two-dimensional gas chromatography and single quadrupole gas chromatography. Int. J. Hydrogen Energy 2018, 43, 5620–5636. [Google Scholar] [CrossRef]
- Markiewicz, M.; Zhang, Y.Q.; Bösmann, A.; Brückner, N.; Thöming, J.; Wasserscheid, P.; Stolte, S. Environmental and health impact assessment of liquid organic hydrogen carrier systems–challenges and preliminary results. Energy Environ. Sci. 2015, 8, 1035–1045. [Google Scholar] [CrossRef]
- Heller, A.; Rausch, M.H.; Schulz, P.S.; Wasserscheid, P.; Fröba, A.P. Binary diffusion coefficients of the liquid organic hydrogen carrier system dibenzyltoluene/perhydrodibenzyltoluene. J. Chem. Eng. Data 2016, 61, 504–511. [Google Scholar] [CrossRef]
- Leinweber, A.; Müller, K. Hydrogenation of the liquid organic hydrogen carrier compound monobenzyl toluene: Reaction pathway and kinetic effects. Energy Technol. 2018, 6, 513–520. [Google Scholar] [CrossRef]
- Müller, K.; Stark, K.; Emel’yanenko, V.N.; Varfolomeev, M.A.; Zaitsau, D.H.; Shoifet, E.; Schick, C.; Verevkin, S.P.; Arlt, W. Liquid organic hydrogen carriers: Thermophysical and thermochemical studies of benzyl-and dibenzyl-toluene derivatives. Ind. Eng. Chem. Res. 2015, 54, 7967–7976. [Google Scholar] [CrossRef]
- Rao, P.C.; Yoon, M. Potential liquid-organic hydrogen carrier systems: A review on recent progress. Energies 2020, 13, 6040. [Google Scholar] [CrossRef]
- Ali, A.; Rohini, A.K.; Noh, Y.S.; Moon, D.J.; Lee, H.J. Hydrogenation of dibenzyltoluene and the catalytic performance of Pt/Al2O3 with various Pt loadings for hydrogen production from perhydro-dibenzyltoluene. Int. J. Energy Res. 2022, 46, 6672–6688. [Google Scholar] [CrossRef]
- Shi, L.; Qi, S.; Qu, J.; Che, T.; Yi, C.; Yang, B. Integration of hydrogenation and dehydrogenation based on dibenzyltoluene as liquid organic hydrogen energy carrier. Int. J. Hydrogen Energy 2019, 44, 5345–5354. [Google Scholar] [CrossRef]
- Greeley, J.; Jaramillo, T.F.; Bonde, J.; Chorkendorff, I.B.; Nørskov, J.K. Computational high-throughput screening of electrocatalytic materials for hydrogen evolution. Nat. Mater. 2006, 5, 909–913. [Google Scholar] [CrossRef] [PubMed]
- Hong, W.T.; Welsch, R.E.; Shao-Horn, Y. Descriptors of oxygen-evolution activity for oxides: A statistical evaluation. J. Phys. Chem. C 2016, 120, 78–86. [Google Scholar] [CrossRef]
- Pilania, G.; Mannodi-Kanakkithodi, A.; Uberuaga, B.P.; Ramprasad, R.; Gubernatis, J.E.; Lookman, T. Machine learning bandgaps of double perovskites. Sci. Rep. 2016, 6, 19375. [Google Scholar] [CrossRef]
- Pilania, G.; Balachandran, P.V.; Kim, C.; Lookman, T. Finding new perovskite halides via machine learning. Front. Mater. 2016, 19, 23–29. [Google Scholar] [CrossRef]
- Pilania, G.; Balachandran, P.V.; Gubernatis, J.E.; Lookman, T. Classification of ABO3 perovskite solids: A machine learning study. Acta Crystallogr. Sect. B Struct. Sci. Cryst. Eng. Mater. 2015, 71, 507–513. [Google Scholar] [CrossRef]
- Balachandran, P.V.; Broderick, S.R.; Rajan, K. Identifying the ‘inorganic gene’ for high-temperature piezoelectric perovskites through statistical learning. Proc. R. Soc. A Math. Phys. Eng. Sci. 2011, 467, 2271–2290. [Google Scholar] [CrossRef]
- Sparks, T.D.; Gaultois, M.W.; Oliynyk, A.; Brgoch, J.; Meredig, B. Data mining our way to the next generation of thermoelectrics. Scr. Mater. 2016, 111, 10–15. [Google Scholar] [CrossRef]
- Yan, J.; Gorai, P.; Ortiz, B.; Miller, S.; Barnett, S.A.; Mason, T.; Stevanović, V.; Toberer, E.S. Material descriptors for predicting thermoelectric performance. Energy Environ. Sci. 2015, 8, 983–994. [Google Scholar] [CrossRef]
- Seshadri, R.; Sparks, T.D. Perspective: Interactive material property databases through aggregation of literature data. APL Mater. 2016, 4, 053206. [Google Scholar] [CrossRef]
- Oliynyk, A.O.; Antono, E.; Sparks, T.D.; Ghadbeigi, L.; Gaultois, M.W.; Meredig, B.; Mar, A. High-throughput machine-learning-driven synthesis of full-Heusler compounds. Chem. Mater. 2016, 28, 7324–7331. [Google Scholar] [CrossRef]
- Rahnama, A.; Clark, S.; Sridhar, S. Machine learning for predicting occurrence of interphase precipitation in HSLA steels. Comput. Mater. Sci. 2018, 154, 169–177. [Google Scholar] [CrossRef]
- Wilmer, C.E.; Leaf, M.; Lee, C.Y.; Farha, O.K.; Hauser, B.G.; Hupp, J.T.; Snurr, R.Q. Large-scale screening of hypothetical metal–organic frameworks. Nat. Chem. 2012, 4, 83–89. [Google Scholar] [CrossRef] [PubMed]
- Lin, L.C.; Berger, A.H.; Martin, R.L.; Kim, J.; Swisher, J.A.; Jariwala, K.; Rycroft, C.H.; Bhown, A.S.; Deem, M.W.; Haranczyk, M.; et al. In silico screening of carbon-capture materials. Nat. Mater. 2012, 11, 633–641. [Google Scholar] [CrossRef] [PubMed]
- Gómez-Bombarelli, R.; Aguilera-Iparraguirre, J.; Hirzel, T.D.; Duvenaud, D.; Maclaurin, D.; Blood-Forsythe, M.A.; Chae, H.S.; Einzinger, M.; Ha, D.G.; Wu, T.; et al. Design of efficient molecular organic light-emitting diodes by a high-throughput virtual screening and experimental approach. Nat. Mater. 2016, 15, 1120–1127. [Google Scholar] [CrossRef] [PubMed]
- Kim, E.; Huang, K.; Tomala, A.; Matthews, S.; Strubell, E.; Saunders, A.; McCallum, A.; Olivetti, E. Machine-learned and codified synthesis parameters of oxide materials. Sci. Data 2017, 4, 170127. [Google Scholar] [CrossRef] [PubMed]
- Sumpter, B.G.; Vasudevan, R.K.; Potok, T.; Kalinin, S.V. A bridge for accelerating materials by design. NPJ Comput. Mater. 2015, 1, 15008. [Google Scholar] [CrossRef]
- Kalinin, S.V.; Sumpter, B.G.; Archibald, R.K. Big–deep–smart data in imaging for guiding materials design. Nat. Mater. 2015, 14, 973–980. [Google Scholar] [CrossRef]
- Kim, E.; Huang, K.; Jegelka, S.; Olivetti, E. Virtual screening of inorganic materials synthesis parameters with deep learning. NPJ Comput. Mater. 2017, 3, 53. [Google Scholar] [CrossRef]
- Dashti, A.; Harami, H.R.; Rezakazemi, M. Accurate prediction of solubility of gases within H2-selective nanocomposite membranes using committee machine intelligent system. Int. J. Hydrogen Energy 2018, 43, 6614–6624. [Google Scholar] [CrossRef]
- Rezakazemi, M.; Dashti, A.; Asghari, M.; Shirazian, S. H2-selective mixed matrix membranes modeling using ANFIS, PSO-ANFIS, GA-ANFIS. Int. J. Hydrogen Energy 2017, 42, 15211–15225. [Google Scholar] [CrossRef]
- Rezakazemi, M.; Azarafza, A.; Dashti, A.; Shirazian, S. Development of hybrid models for prediction of gas permeation through FS/POSS/PDMS nanocomposite membranes. Int. J. Hydrogen Energy 2018, 43, 17283–17294. [Google Scholar] [CrossRef]
- Rahnama, A.; Zepon, G.; Sridhar, S. Machine learning based prediction of metal hydrides for hydrogen storage, part I: Prediction of hydrogen weight percent. Int. J. Hydrogen Energy 2019, 44, 7337–7344. [Google Scholar] [CrossRef]
- Rahnama, A.; Zepon, G.; Sridhar, S. Machine learning based prediction of metal hydrides for hydrogen storage, part II: Prediction of material class. Int. J. Hydrogen Energy 2019, 44, 7345–7353. [Google Scholar] [CrossRef]
- Zhang, Y.; Wang, Y.; Zhou, G.; Jin, J.; Wang, B.; Wang, X.; Cichocki, A. Multi-kernel extreme learning machine for EEG classification in brain-computer interfaces. Expert. Syst. Appl. 2018, 96, 302–310. [Google Scholar] [CrossRef]
- Jain, V.; Merchant, A.; Roy, S.; Ford, J.B. Developing an emic scale to measure ad-evoked nostalgia in a collectivist emerging market. J. Bus. Res. 2019, 99, 140–156. [Google Scholar] [CrossRef]
- Rahman, A.U.; Sultan, K.; Naseer, I.; Majeed, R.; Musleh, D.; Gollapalli, M.A.S.; Chabani, S.; Ibrahim, N.; Siddiqui, S.Y.; Khan, M.A. Supervised machine learning-based prediction of COVID-19. Comput. Mater. Contin. 2021, 69, 21–34. [Google Scholar]
- Khan, M.A.; Abu-Khadrah, A.; Siddiqui, S.Y.; Ghazal, T.M.; Faiz, T.; Ahmad, M.; Lee, S.W. Support-vector-machine-based adaptive scheduling in mode 4 communication. Comput. Mater. Contin. 2022, 73, 3319–3331. [Google Scholar]
- Tahir, A.; Asif, M.; Ahmad, M.B.; Mahmood, T.; Khan, M.A.; Ali, M. Brain Tumor Detection using Decision-Based Fusion Empowered with Fuzzy Logic. Math. Probl. Eng. 2022, 2022, 2710285. [Google Scholar] [CrossRef]
- Abidi, W.U.H.; Daoud, M.S.; Ihnaini, B.; Khan, M.A.; Alyas, T.; Fatima, A.; Ahmad, M. Real-time shill bidding fraud detection empowered with fussed machine learning. IEEE Access 2021, 9, 113612–113621. [Google Scholar] [CrossRef]
- Nadeem, M.W.; Goh, H.G.; Ponnusamy, V.; Andonovic, I.; Khan, M.A.; Hussain, M. A fusion-based machine learning approach for the prediction of the onset of diabetes. Healthcare 2021, 9, 1393. [Google Scholar] [CrossRef] [PubMed]
- Ata, A.; Khan, M.A.; Abbas, S.; Khan, M.S.; Ahmad, G. Adaptive IoT empowered smart road traffic congestion control system using supervised machine learning algorithm. Comput. J. 2021, 64, 1672–1679. [Google Scholar] [CrossRef]
- Choi, H.; Ali, A.; Khan, M.A.; Abbas, N. Prediction of hydrogen storage in dibenzyltoluene empowered with machine learning. J. Energy Storage 2022, 55, 105844. [Google Scholar]
- Ali, A.; Khan, M.A.; Choi, H. Hydrogen Storage Prediction in Dibenzyltoluene as Liquid Organic Hydrogen Carrier Empowered with Weighted Federated Machine Learning. Mathematics 2022, 10, 3846. [Google Scholar] [CrossRef]
- Thornton, A.W.; Simon, C.M.; Kim, J.; Kwon, O.; Deeg, K.S.; Konstas, K.; Pas, S.J.; Hill, M.R.; Winkler, D.A.; Haranczyk, M.; et al. Materials genome in action: Identifying the performance limits of physical hydrogen storage. Chem. Mater. 2017, 29, 2844–2854. [Google Scholar] [CrossRef] [PubMed]
- Bucior, B.J.; Bobbitt, N.S.; Islamoglu, T.; Goswami, S.; Gopalan, A.; Yildirim, T.; Farha, O.K.; Bagheri, N.; Snurr, R.Q. Energy-based descriptors to rapidly predict hydrogen storage in metal–organic frameworks. Mol. Syst. Des. Eng. 2019, 4, 162–174. [Google Scholar] [CrossRef]
- Hastie, T.; Tibshirani, R.; Friedman, J.H.; Friedman, J.H. The Elements of Statistical Learning: Data Mining, Inference, and Prediction; Springer: New York, NY, USA, 2009; Volume 2, pp. 1–758. [Google Scholar]


| Parameters | Predicted Classes | ||
|---|---|---|---|
| (a) Low Class | (b) Medium Class | (c) High Class | |
| True Positive (TP) | 39,725 | 57,787 | 46,375 |
| False Negative (FN) | 7528 | 0 | 1773 |
| False Positive (FP) | 0 | 9301 | 0 |
| True Negative (TN) | 105,935 | 84,300 | 103,240 |
| Parameters | Predicted Classes | ||
|---|---|---|---|
| (a) Low Class | (b) Medium Class | (c) High Class | |
| True Positive (TP) | 35,033 | 48,120 | 37,093 |
| False Negative (FN) | 1860 | 0 | 1894 |
| False Positive (FP) | 0 | 3754 | 0 |
| True Negative (TN) | 87,107 | 73,126 | 86,013 |
| Evaluation Parameters | 5-Fold Cross Validation and Resubstitution Validation | Holdout Validation | ||||
|---|---|---|---|---|---|---|
| Low Class | Medium Class | High Class | Low Class | Medium Class | High Class | |
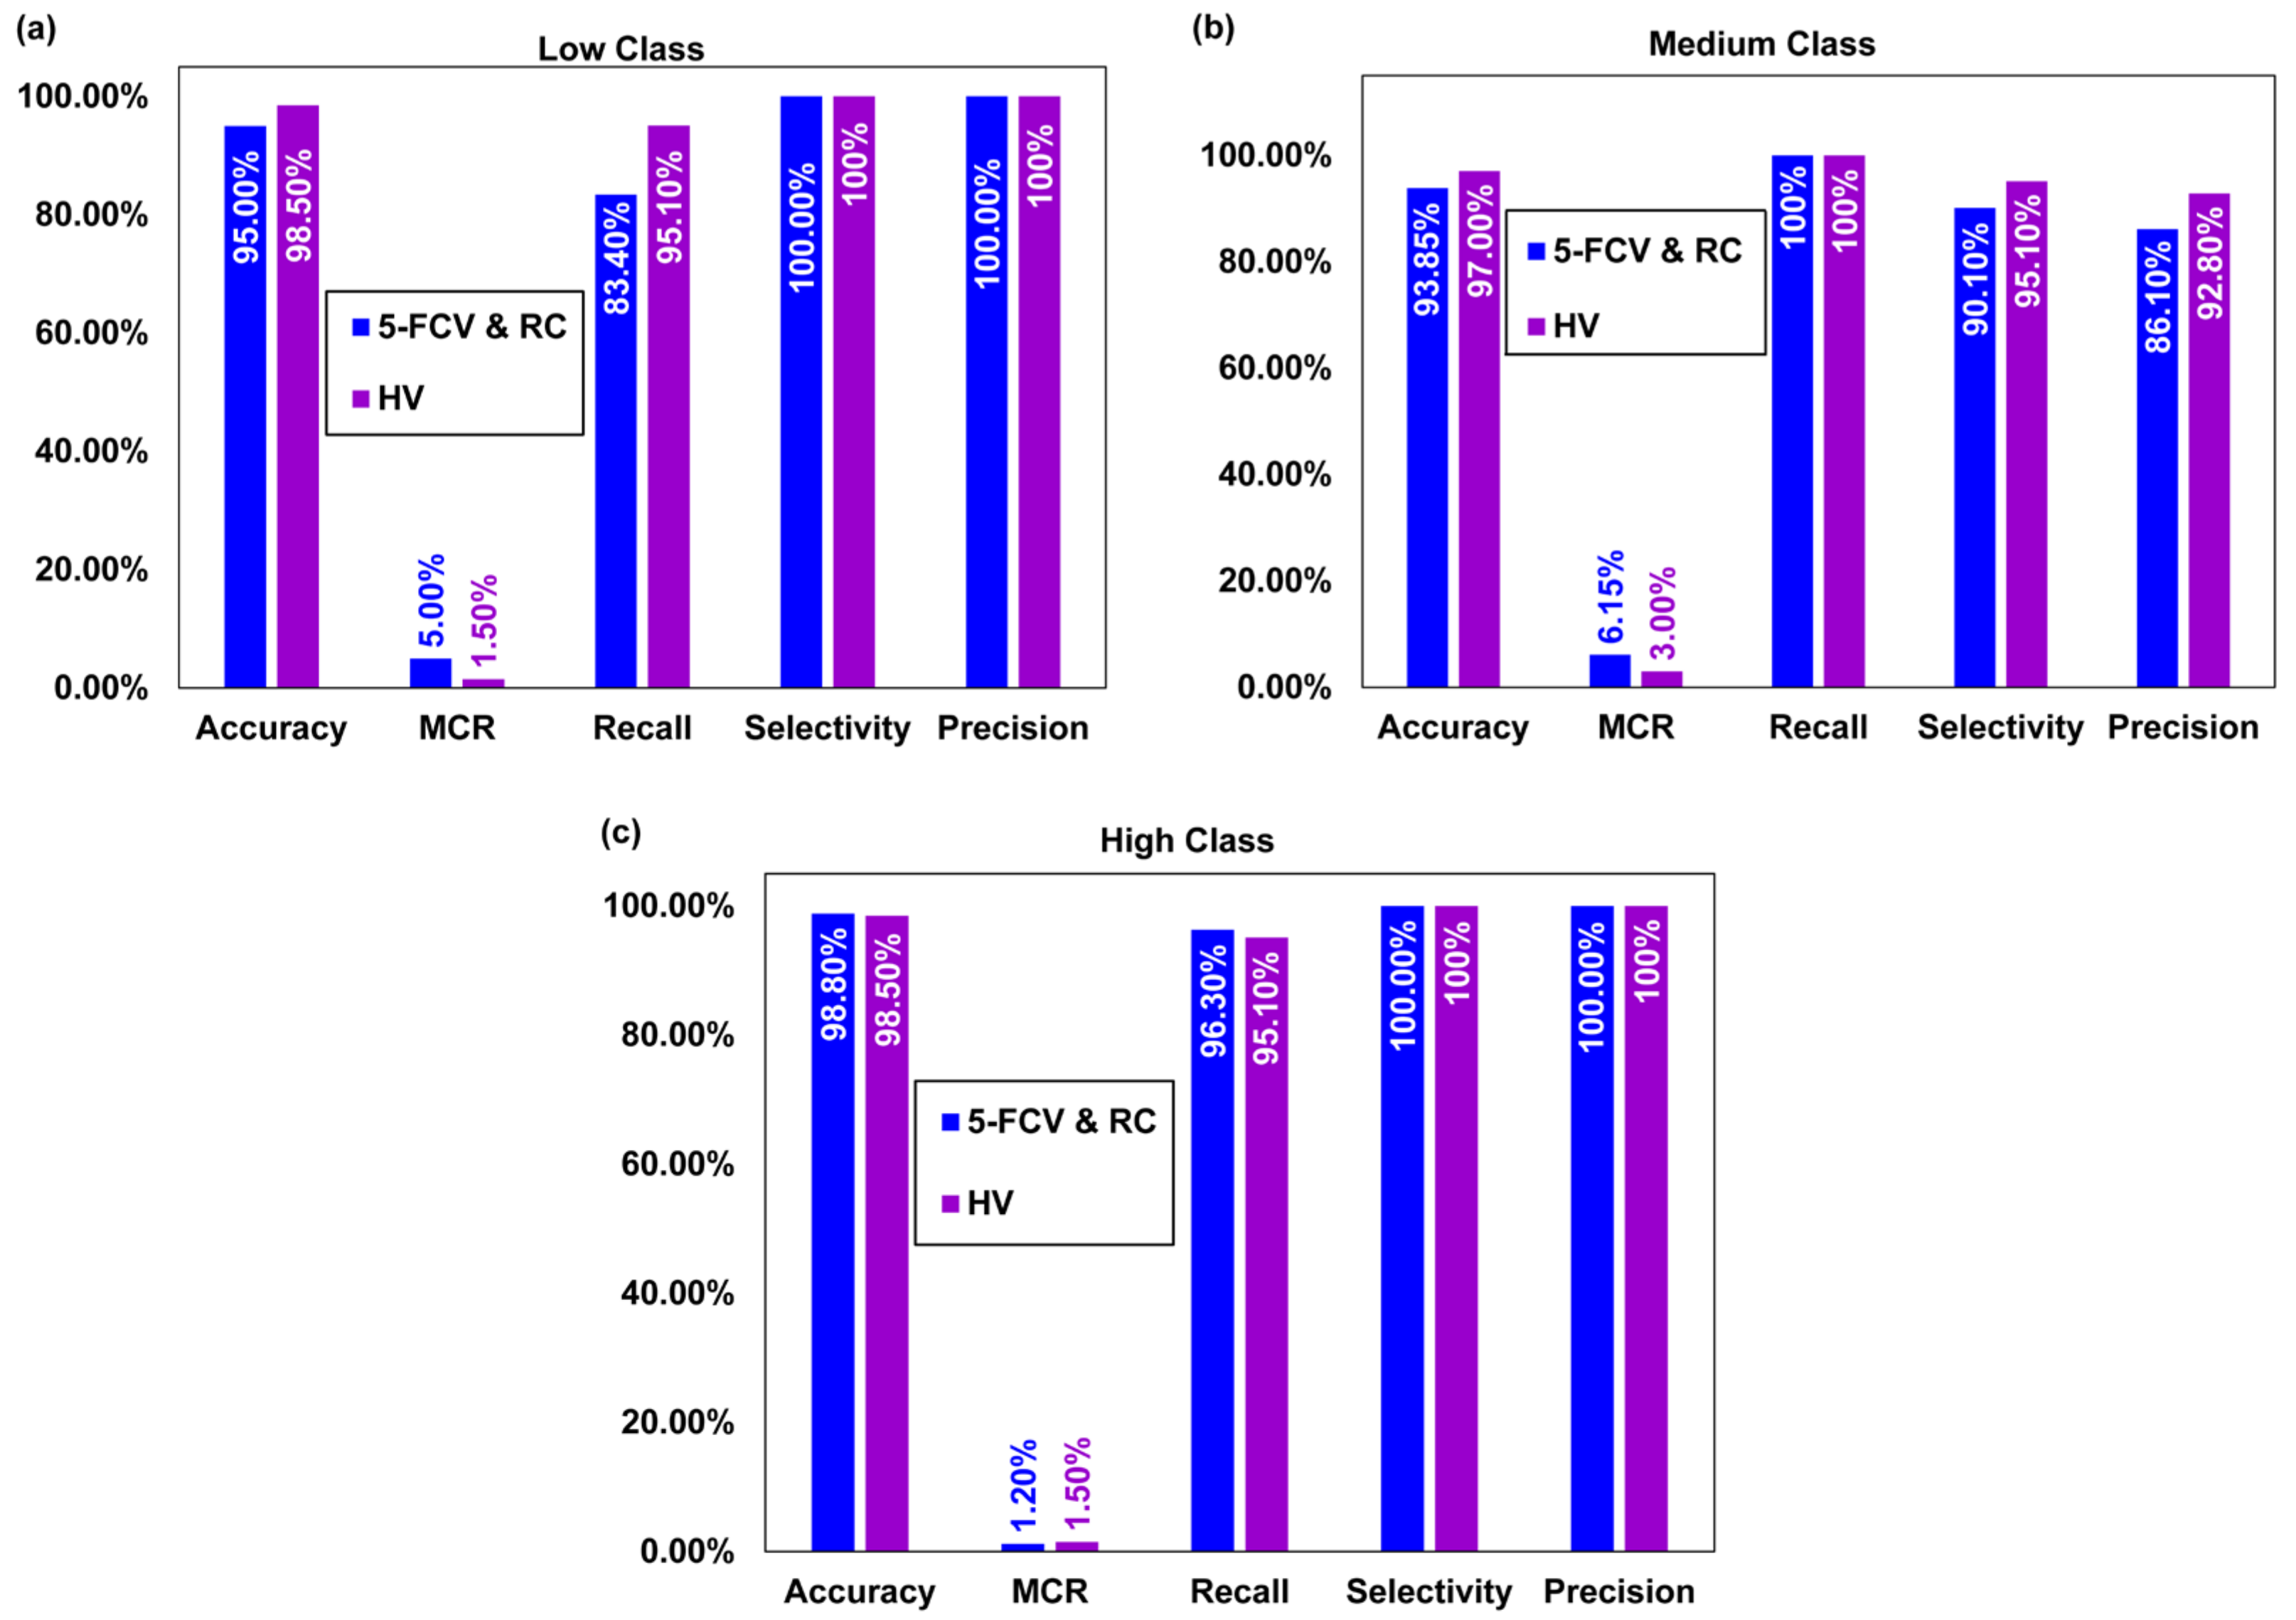
| Accuracy | 95.0% | 93.8% | 98.8% | 98.5% | 97.0% | 98.5% |
| Miss rate | 5.0% | 6.15% | 1.20% | 1.50% | 3.00% | 1.50% |
| Selectivity | 100% | 90.1% | 100% | 100% | 95.1% | 100% |
| Recall/Sensitivity | 83.4% | 100% | 96.3% | 95.1% | 100% | 95.1% |
| Precision | 100% | 86.1% | 100% | 100% | 92.8% | 100% |
| F1 Score | 90.9% | 92.5% | 98.1% | 97.5% | 96.2% | 97.5% |
| False positive rate | 0 | 9.90% | 0 | 0 | 4.90% | 0 |
| False discovery rate | 0 | 13.9% | 0.00 | 0 | 7.20% | 0 |
| False omission rate | 6.60% | 0 | 1.70% | 2.10% | 0 | 2.15% |
| Negative Predictive Value | 93.4% | 100% | 98.3% | 97.9% | 100% | 97.8% |
| Studies | Year | Storage System | Model | Accuracy |
|---|---|---|---|---|
| Thornton et al. [66] | 2017 | Nanoporous materials | Neural Network | 88.0% |
| Rahnama et al. [54] | 2019 | Metal hydrides | Boosted decision tree regression | 83.0% |
| Rahnama et al. [55] | 2019 | Metal hydrides | Multiclass neural network | 80.0% |
| Bucior et al. [67] | 2019 | Metal organic frameworks | Multilinear regression with LASSO [68] | 96.0% |
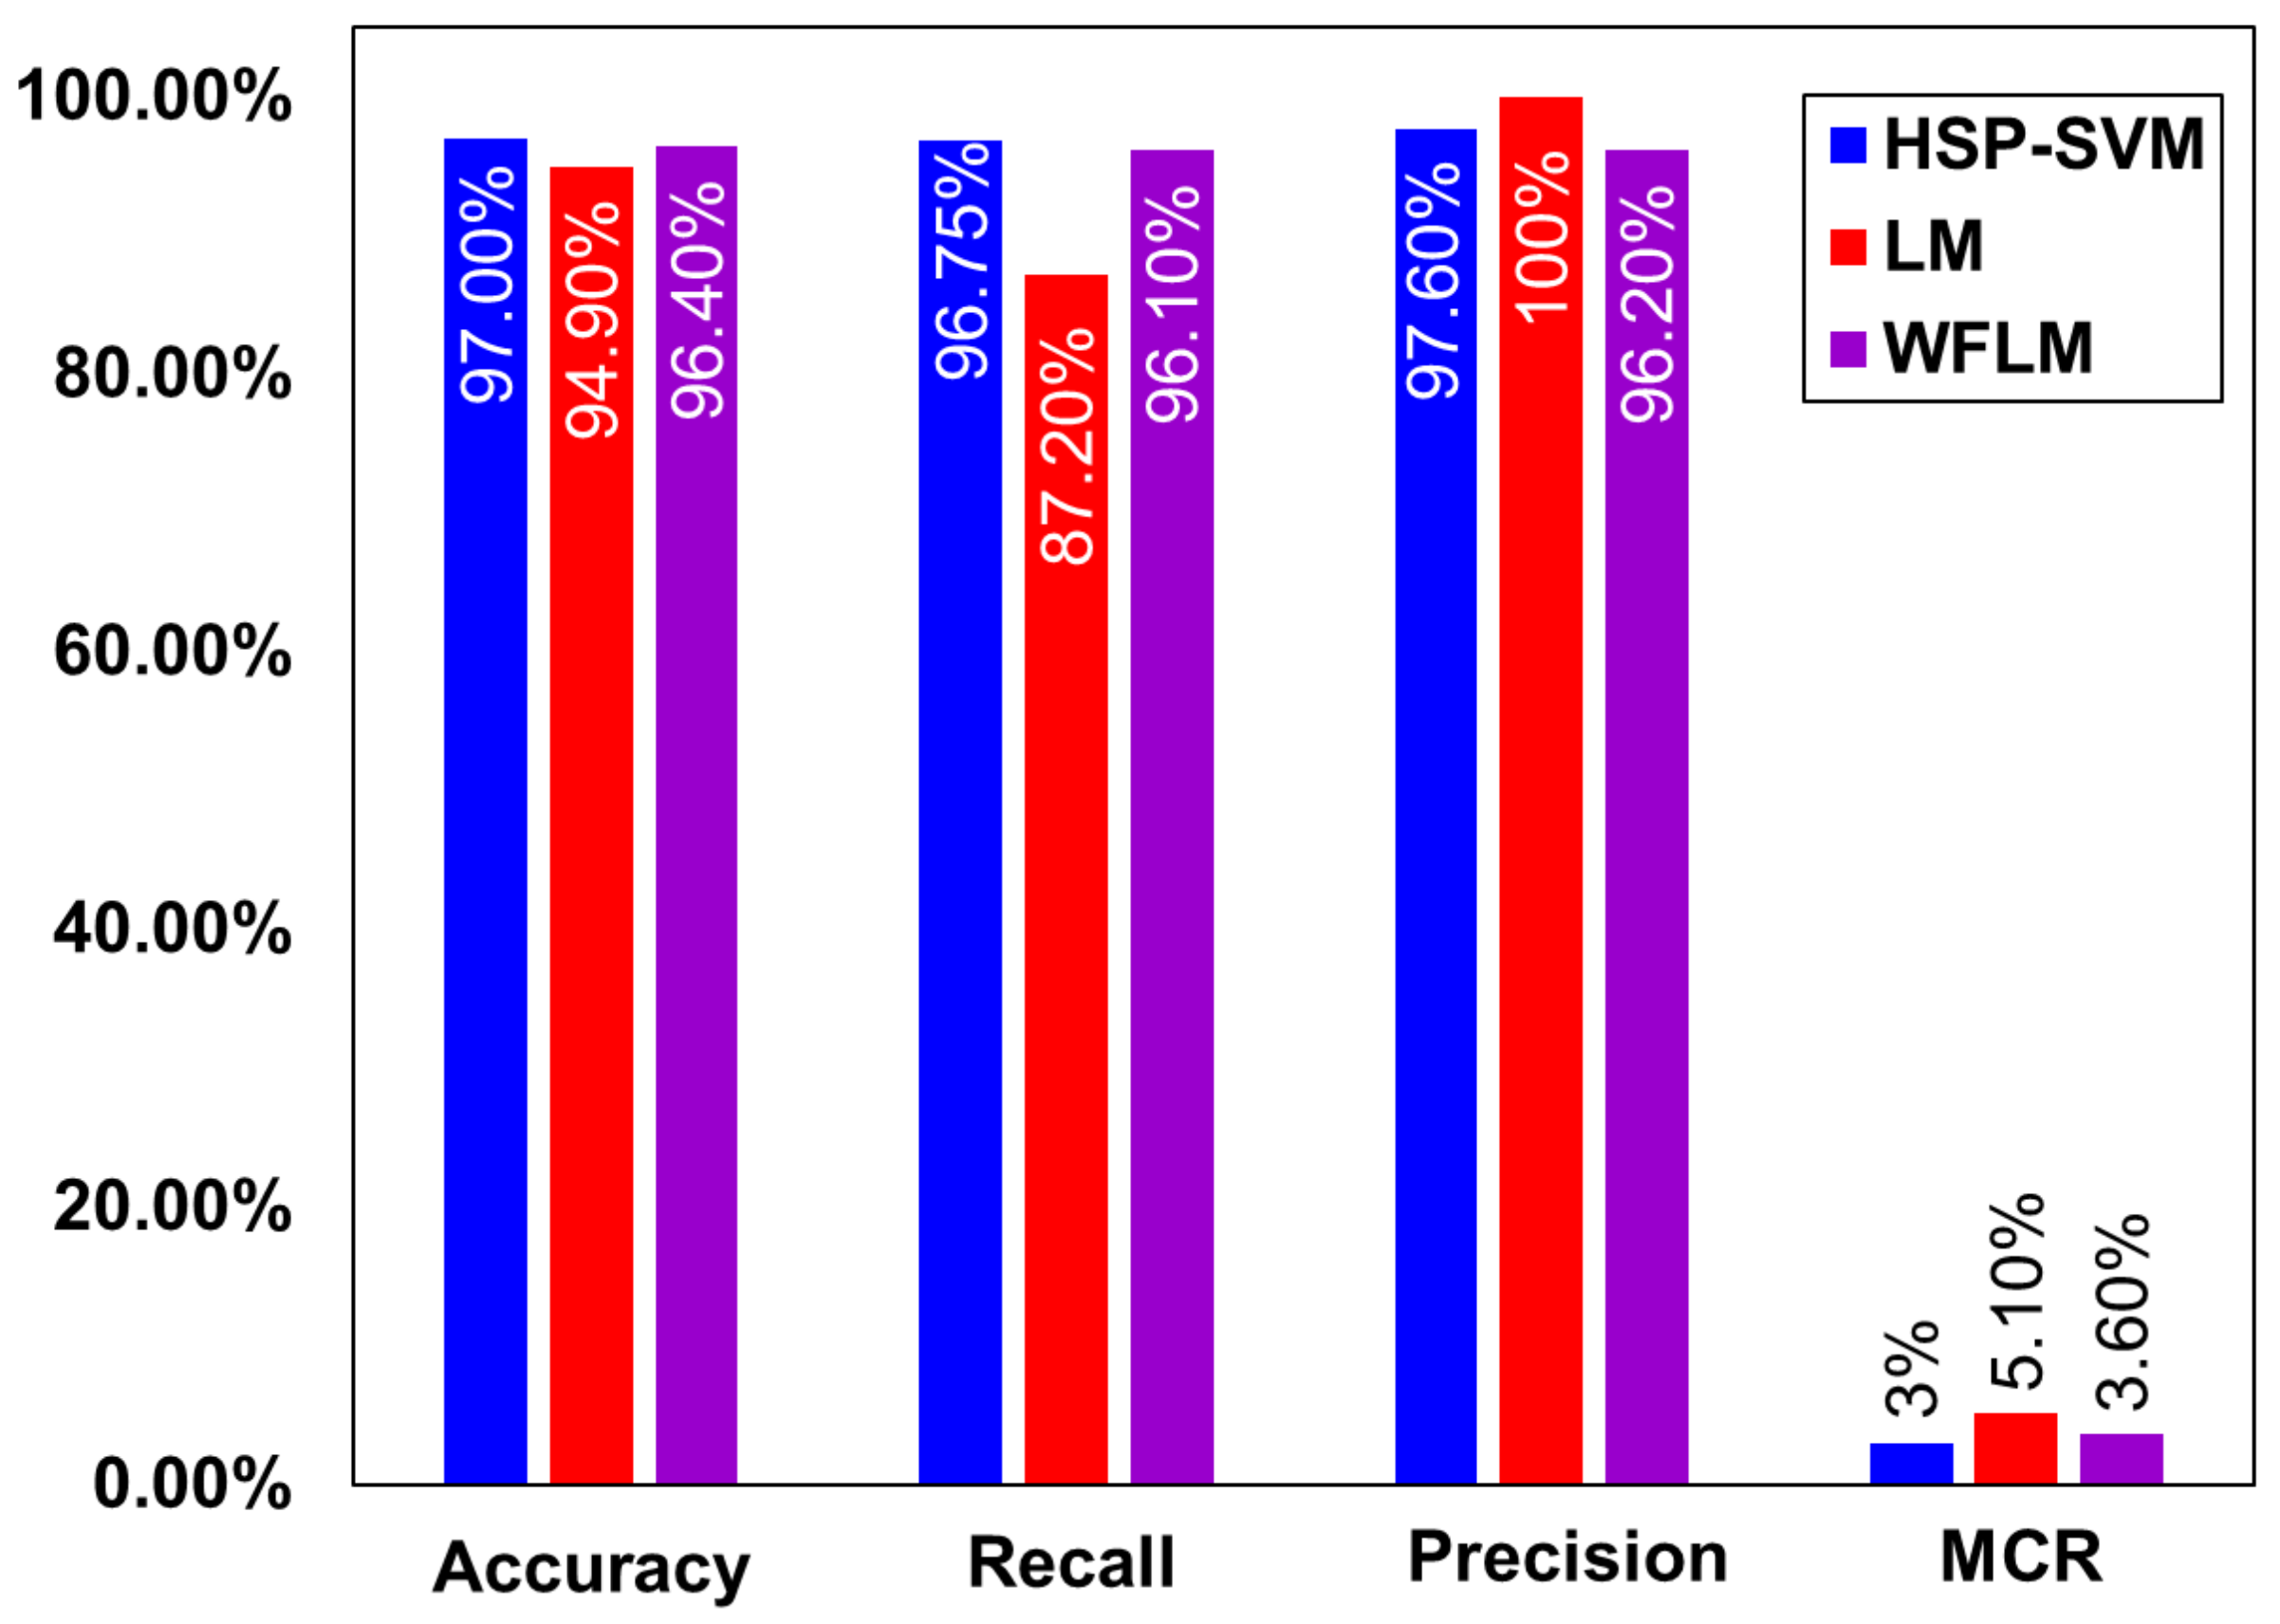
| Choi et al. [64] | 2022 | LOHC | Levenberg–Marquardt | 94.9% |
| Ali et al. [65] | 2022 | LOHC | HSPS-WFML | 96.4% |
| Ali et al. | Current Study | LOHC | HSP-SVM | 97.0% |
Disclaimer/Publisher’s Note: The statements, opinions and data contained in all publications are solely those of the individual author(s) and contributor(s) and not of MDPI and/or the editor(s). MDPI and/or the editor(s) disclaim responsibility for any injury to people or property resulting from any ideas, methods, instructions or products referred to in the content. |
© 2024 by the authors. Licensee MDPI, Basel, Switzerland. This article is an open access article distributed under the terms and conditions of the Creative Commons Attribution (CC BY) license (https://creativecommons.org/licenses/by/4.0/).
Share and Cite
Ali, A.; Khan, M.A.; Choi, H. Supervised Machine Learning-Based Prediction of Hydrogen Storage Classes Utilizing Dibenzyltoluene as an Organic Carrier. Molecules 2024, 29, 1280. https://doi.org/10.3390/molecules29061280
Ali A, Khan MA, Choi H. Supervised Machine Learning-Based Prediction of Hydrogen Storage Classes Utilizing Dibenzyltoluene as an Organic Carrier. Molecules. 2024; 29(6):1280. https://doi.org/10.3390/molecules29061280
Chicago/Turabian StyleAli, Ahsan, Muhammad Adnan Khan, and Hoimyung Choi. 2024. "Supervised Machine Learning-Based Prediction of Hydrogen Storage Classes Utilizing Dibenzyltoluene as an Organic Carrier" Molecules 29, no. 6: 1280. https://doi.org/10.3390/molecules29061280
APA StyleAli, A., Khan, M. A., & Choi, H. (2024). Supervised Machine Learning-Based Prediction of Hydrogen Storage Classes Utilizing Dibenzyltoluene as an Organic Carrier. Molecules, 29(6), 1280. https://doi.org/10.3390/molecules29061280