Article

How Aqueous Solvation Impacts the Frequencies and Intensities of Infrared Absorption Bands in Flavin: The Quest for a Suitable Solvent Model

1
Department of Chemistry, Georgia State University, Atlanta, GA 30303, USA
2
Department of Physics and Astronomy, Georgia State University, Atlanta, GA 30303, USA
*
Author to whom correspondence should be addressed.
Molecules 2024, 29(2), 520; https://doi.org/10.3390/molecules29020520
Submission received: 20 December 2023 / Revised: 16 January 2024 / Accepted: 17 January 2024 / Published: 20 January 2024

Abstract

:
FTIR spectroscopy accompanied by quantum chemical simulations can reveal important information about molecular structure and intermolecular interactions in the condensed phase. Simulations typically account for the solvent either through cluster quantum mechanical (QM) models, polarizable continuum models (PCM), or hybrid quantum mechanical/molecular mechanical (QM/MM) models. Recently, we studied the effect of aqueous solvent interactions on the vibrational frequencies of lumiflavin, a minimal flavin model, using cluster QM and PCM models. Those models successfully reproduced the relative frequencies of four prominent stretching modes of flavin’s isoalloxazine ring in the diagnostic 1450–1750 cm−1 range but poorly reproduced the relative band intensities. Here, we extend our studies on this system and account for solvation through a series of increasingly sophisticated models. Only by combining elements of QM clusters, QM/MM, and PCM approaches do we obtain an improved agreement with the experiment. The study sheds light more generally on factors that can impact the computed frequencies and intensities of IR bands in solution.

Graphical Abstract

1. Introduction

FTIR spectroscopy measurements are typically carried out in the condensed phase, where intermolecular interactions like hydrogen bonding impact the frequencies and broadening of spectral bands [1]. To simulate condensed-phase FTIR spectra, computational models must account for the effect of intermolecular interactions on molecular vibrations. Understanding how to best model FTIR spectra in the condensed phase can be especially useful for developing suitable protocols to simulate FTIR spectra of biomolecules, where shifts in IR frequencies (often measured using difference spectroscopy) encode important information about changes in local interactions or macromolecular structure [2,3,4]. For instance, FTIR spectroscopies have been used to probe intermediates formed following the photoexcitation of several flavin-binding photoreceptors [5,6,7,8,9,10,11,12,13,14,15,16,17]. FTIR spectra of protein-bound flavin have also been simulated using hybrid quantum mechanical/molecular mechanical (QM/MM) methods to accompany such experiments [4,18,19,20,21,22].
Here, we focus on flavin in solution, a benchmark system for which vibrational frequencies have been reported experimentally [7,22,23,24,25,26,27,28,29] and computationally [28,29,30,31,32,33,34]. The accurate simulation of vibrational frequencies and intensities is important not only to reproduce FTIR difference signals, but also to compute Franck–Condon factors for electronic transitions [30,32,35,36,37,38,39,40]. Several methods are available for simulating condensed-phase FTIR spectra, but they typically fall into one of two categories. The first involves running molecular dynamics (MD) simulations and extracting the vibrational frequencies from the Fourier transform of the autocorrelation functions [41,42]. The second approach is the direct calculation of vibrational frequencies and intensities using normal mode analysis. The latter assigns IR bands to specific vibrational modes, which is useful for understanding the effect of local interactions [4,43]. We will use the normal mode analysis approach.
Lumiflavin is a reduced model system that contains the tricyclic isoalloxazine ring common to biomolecules like riboflavin (vitamin B2), flavin mononucleotide (FMN), and flavin adenine dinucleotide (FAD), but where the ribose side chains are replaced by a methyl group (see insets in Figure 1). Recently, we used the polarizable continuum model (PCM) and gas-phase quantum chemical solute–solvent cluster models (QM clusters) to simulate the vibrational spectrum of lumiflavin in solution [34]. These calculations were compared to the FTIR spectrum of FMN in D2O in the 1450–1750 cm−1 range where prominent C=N and C=O stretching frequencies appear. The goal was to understand the effect of hydrogen bonding on those stretching frequencies and to determine whether simple computational models could reproduce the aqueous-phase FTIR spectra. As in that study, we will focus here on four bands: two carbonyl stretches (C2=O and C4=O) and two modes previously assigned to coupled in-plane and out-of-plane C=N stretches (C=Nin and C=Nout). It has been shown through local mode analysis that the ribose and phosphate moieties do not contribute to the IR spectrum in this energy range [4], so only the isoalloxazine group in FMN contributes to those stretching frequencies. As noted in our previous study [34] and again towards the end of this manuscript, those modes are mixed, especially in the case of C=Nout where C=C modes are coupled, but we will keep the labels for consistency with earlier assignments [14].
While the PCM and QM cluster models successfully reproduce the relative frequencies of the prominent stretching modes, there are a few notable differences between the computed and experimental spectra. Experimentally, the C=Nout to C=Nin intensity ratio is around 5:1. The QM cluster models incorrectly predict similar intensities for the two peaks, while the PCM model predicts a ratio that is more in line with the experiment (Figure 1). However, the PCM calculations predict a prominent peak near 1530 cm−1 that is not observed experimentally [34]. These differences are also reflected in the literature [4,18,19,20,21,22,28,29,30,31,32,33,34], where different models can report different relative frequencies and intensities of flavin’s IR bands.
Here, we revisit the effect of solvation on the double-bond stretching vibrational frequencies and intensities of flavin using QM/MM [44,45,46] simulations of lumiflavin in water, using the ONIOM approach [47,48]. The goal is to compare the solvent models and systematically understand which factors influence the band frequencies and intensities. This work will provide guidelines for suitable computational protocols aimed at simulating FTIR difference spectra of flavin-binding proteins.

2. Results and Discussion

Molecular dynamics simulations were carried out for lumiflavin in solution. Snapshots from the MD simulation then served as starting points for B3LYP/6-31+G**/TIP3P QM/MM ONIOM calculations [47]. Vibrational frequencies were computed at the same level of theory after hydrogen atoms were replaced with deuterium for all water molecules and for the exchangeable proton on flavin’s N3. This is done for consistency with the experiments, which were also performed in D2O to avoid bands from intense water-bending vibrations that can overwhelm the flavin bands of interest [34].
It is known that hybrid DFT methods slightly overestimate computed frequencies relative to experiments [49]. To correct for this, the computed spectra were adjusted using a constant scaling factor that was chosen for each model to match the computed νC=N(out) vibrational frequency with the experimental one (1548 cm−1). The scaling factor used for each model is indicated in each of the figures in Section 2. QM/MM vibrational frequencies were computed using several different protocols represented in Figure 2.
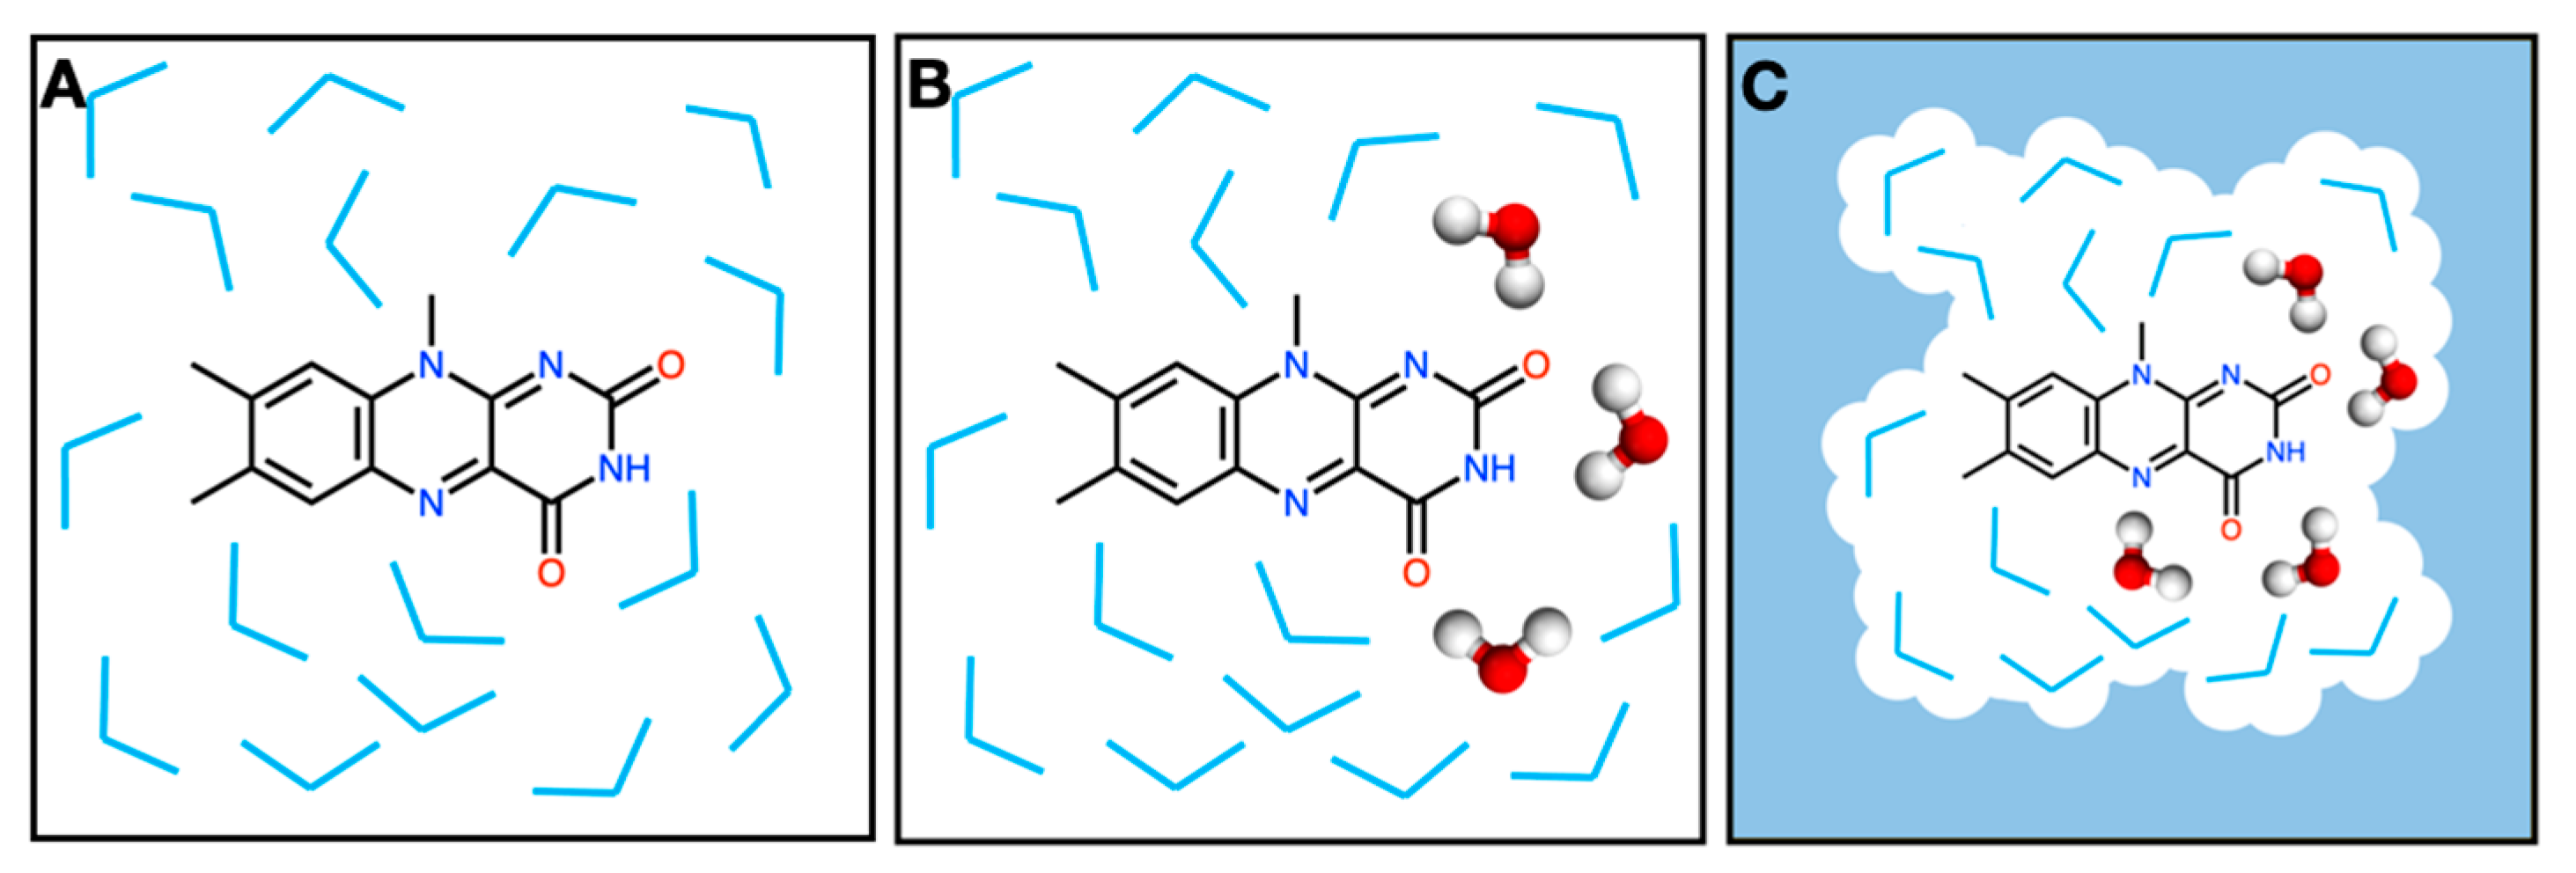
In protocol M1, only the lumiflavin is treated at the QM level of theory while all water molecules are treated at the MM level (Figure 2A). We test the effect of using a larger solvent box size such that there is at least 12 Å from any lumiflavin atom to the edge of the box, instead of the 3 Å used by default (protocol M1-Large). We also tested a charge equilibration method (QEq) for the water molecules [50], which is a variable-charge model, instead of using the fixed-charge TIP3P model (protocol M1-QEq).
In protocol M2, we included some of the water molecules in the QM subsystem (Figure 2B). Since carbonyl peaks are the most sensitive to hydrogen bonding, we included water molecules that are close to the carbonyl oxygen atoms. Specifically, any water molecule with an atom that is within 3.5 Å of the lumiflavin carbonyl oxygen atoms was selected using VMD and included in the QM region [51]. Using this criterion, between 5 and 13 water molecules were treated quantum mechanically in each snapshot. These QM waters are optimized along with the lumiflavin during the ONIOM QM/MM optimization step.
In protocol M3, we account for the long-range effects of solvation implicitly through the ONIOM-PCM approach [50,52]. We used the ONIOM-PCM/X approximation, where the PCM cavity is constructed around the entire QM/MM system and used for both the low-level and high-level calculations (Figure 2C). QM water molecules are also are optimized along with the lumiflavin, just as in M2.
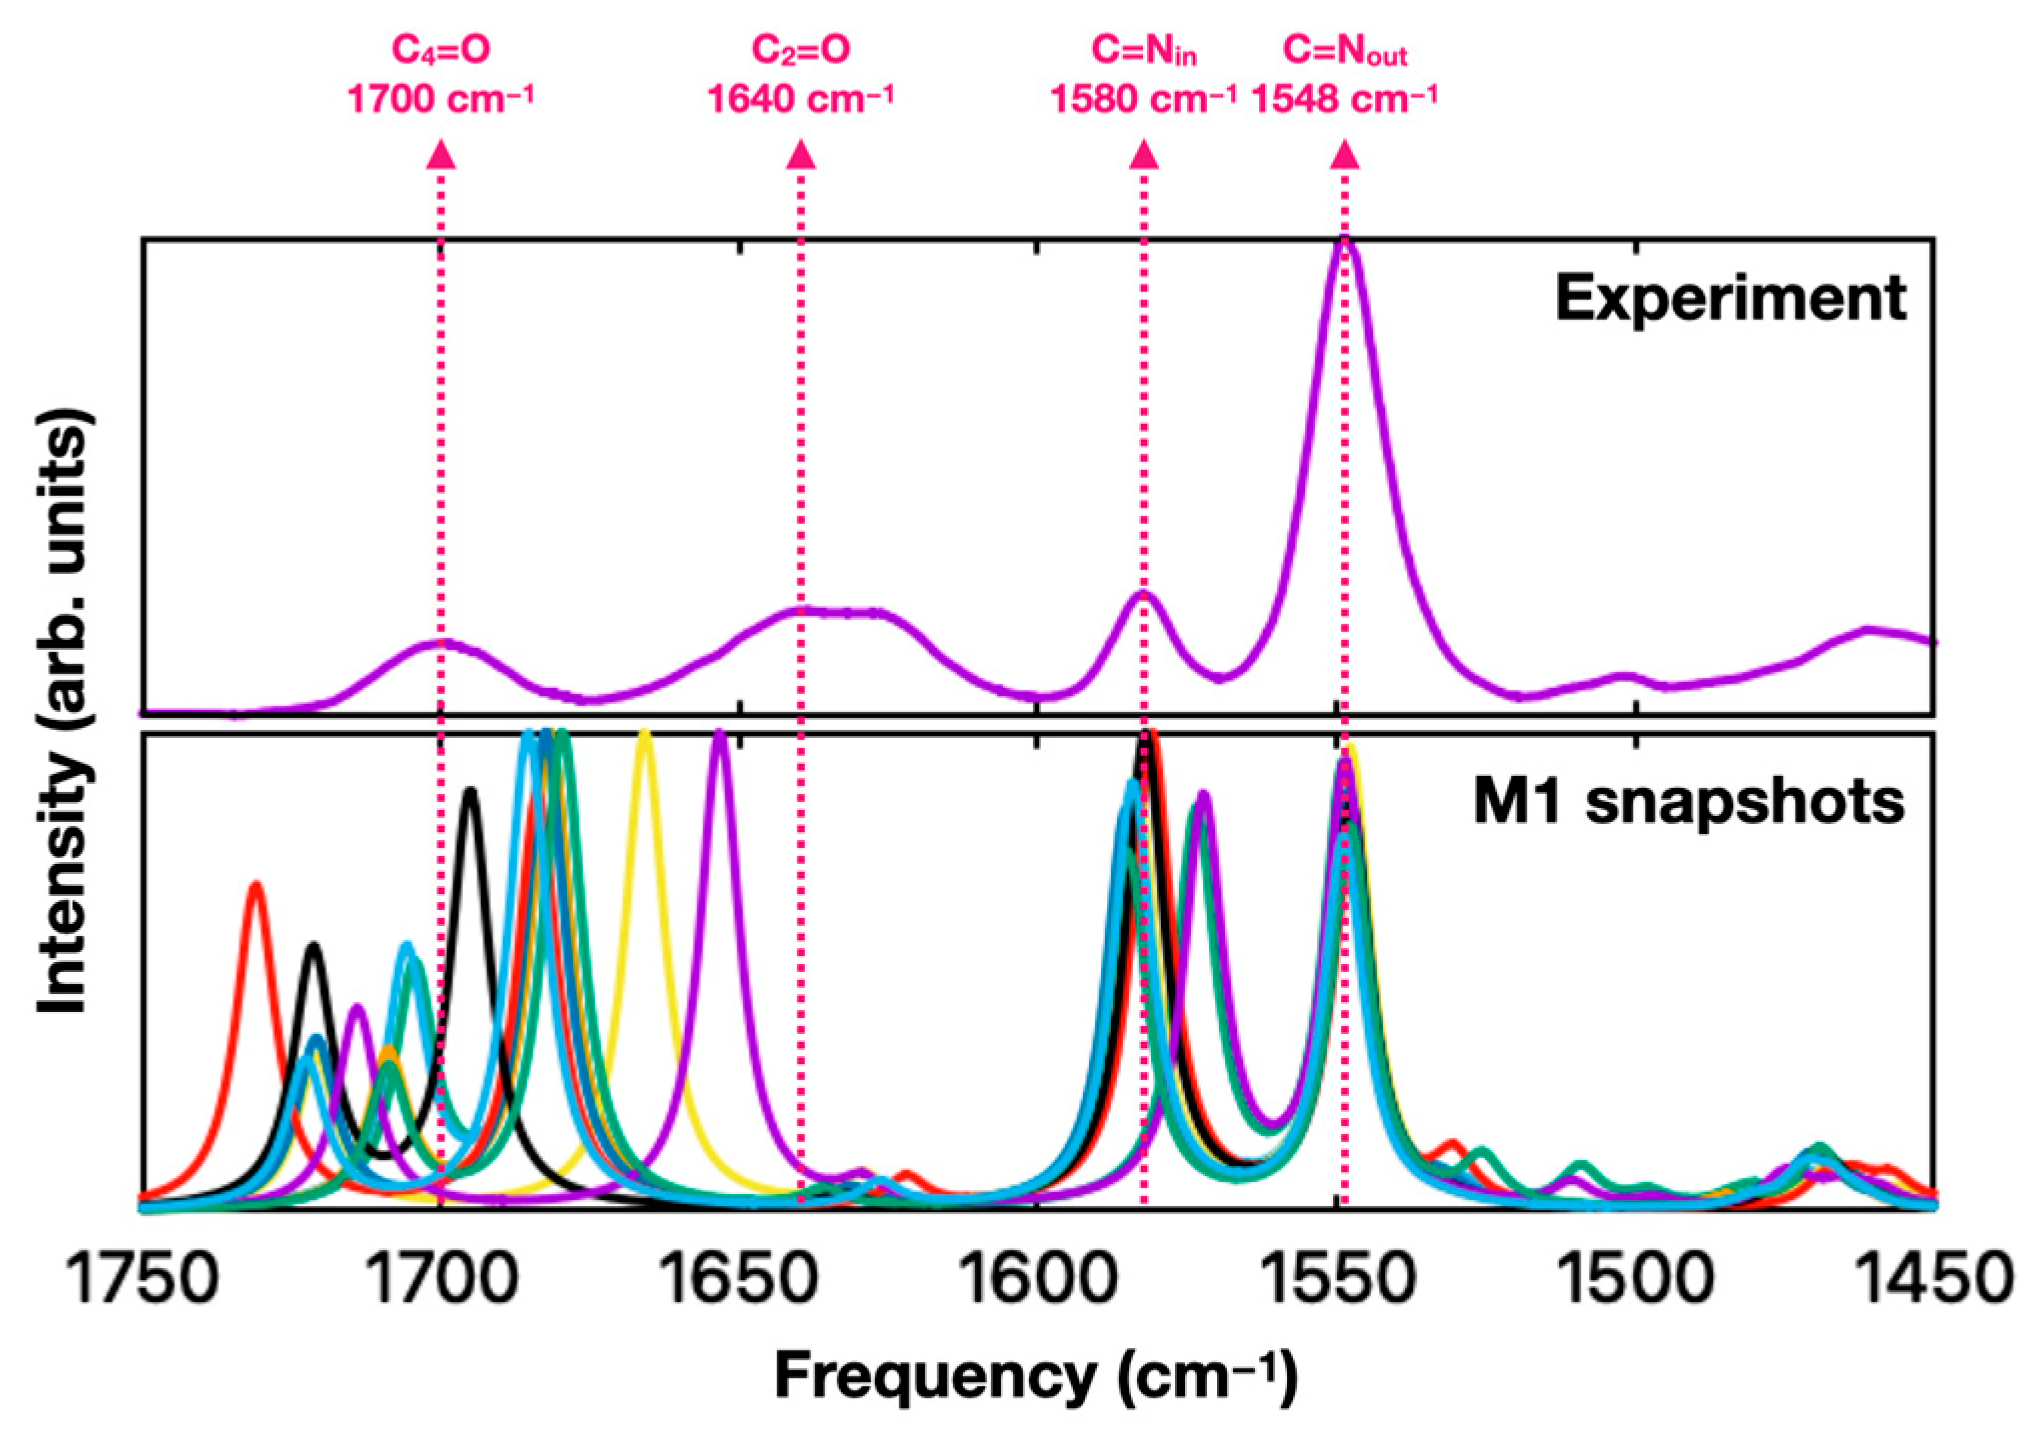
Initially, QM/MM frequency calculations were performed for only a few select QM/MM snapshots obtained from the MD simulations. Figure 3 shows ten simulated FTIR spectra obtained from different snapshots of an MD simulation of lumiflavin in water. “Stick” spectra were calculated using the B3LYP/6-31 + G* ONIOM method and broadened by convolution with 8 cm−1 wide (FWHM) Gaussian functions. There are significant variations between the different snapshots, especially for the carbonyl (C=O) stretching bands that show a strong sensitivity to variations in the water micro-environment. This indicates that a single QM/MM calculation is unlikely to be representative of the average environment. Therefore, the remainder of this work will present and discuss the ensemble result from 100 QM/MM calculations for each protocol.
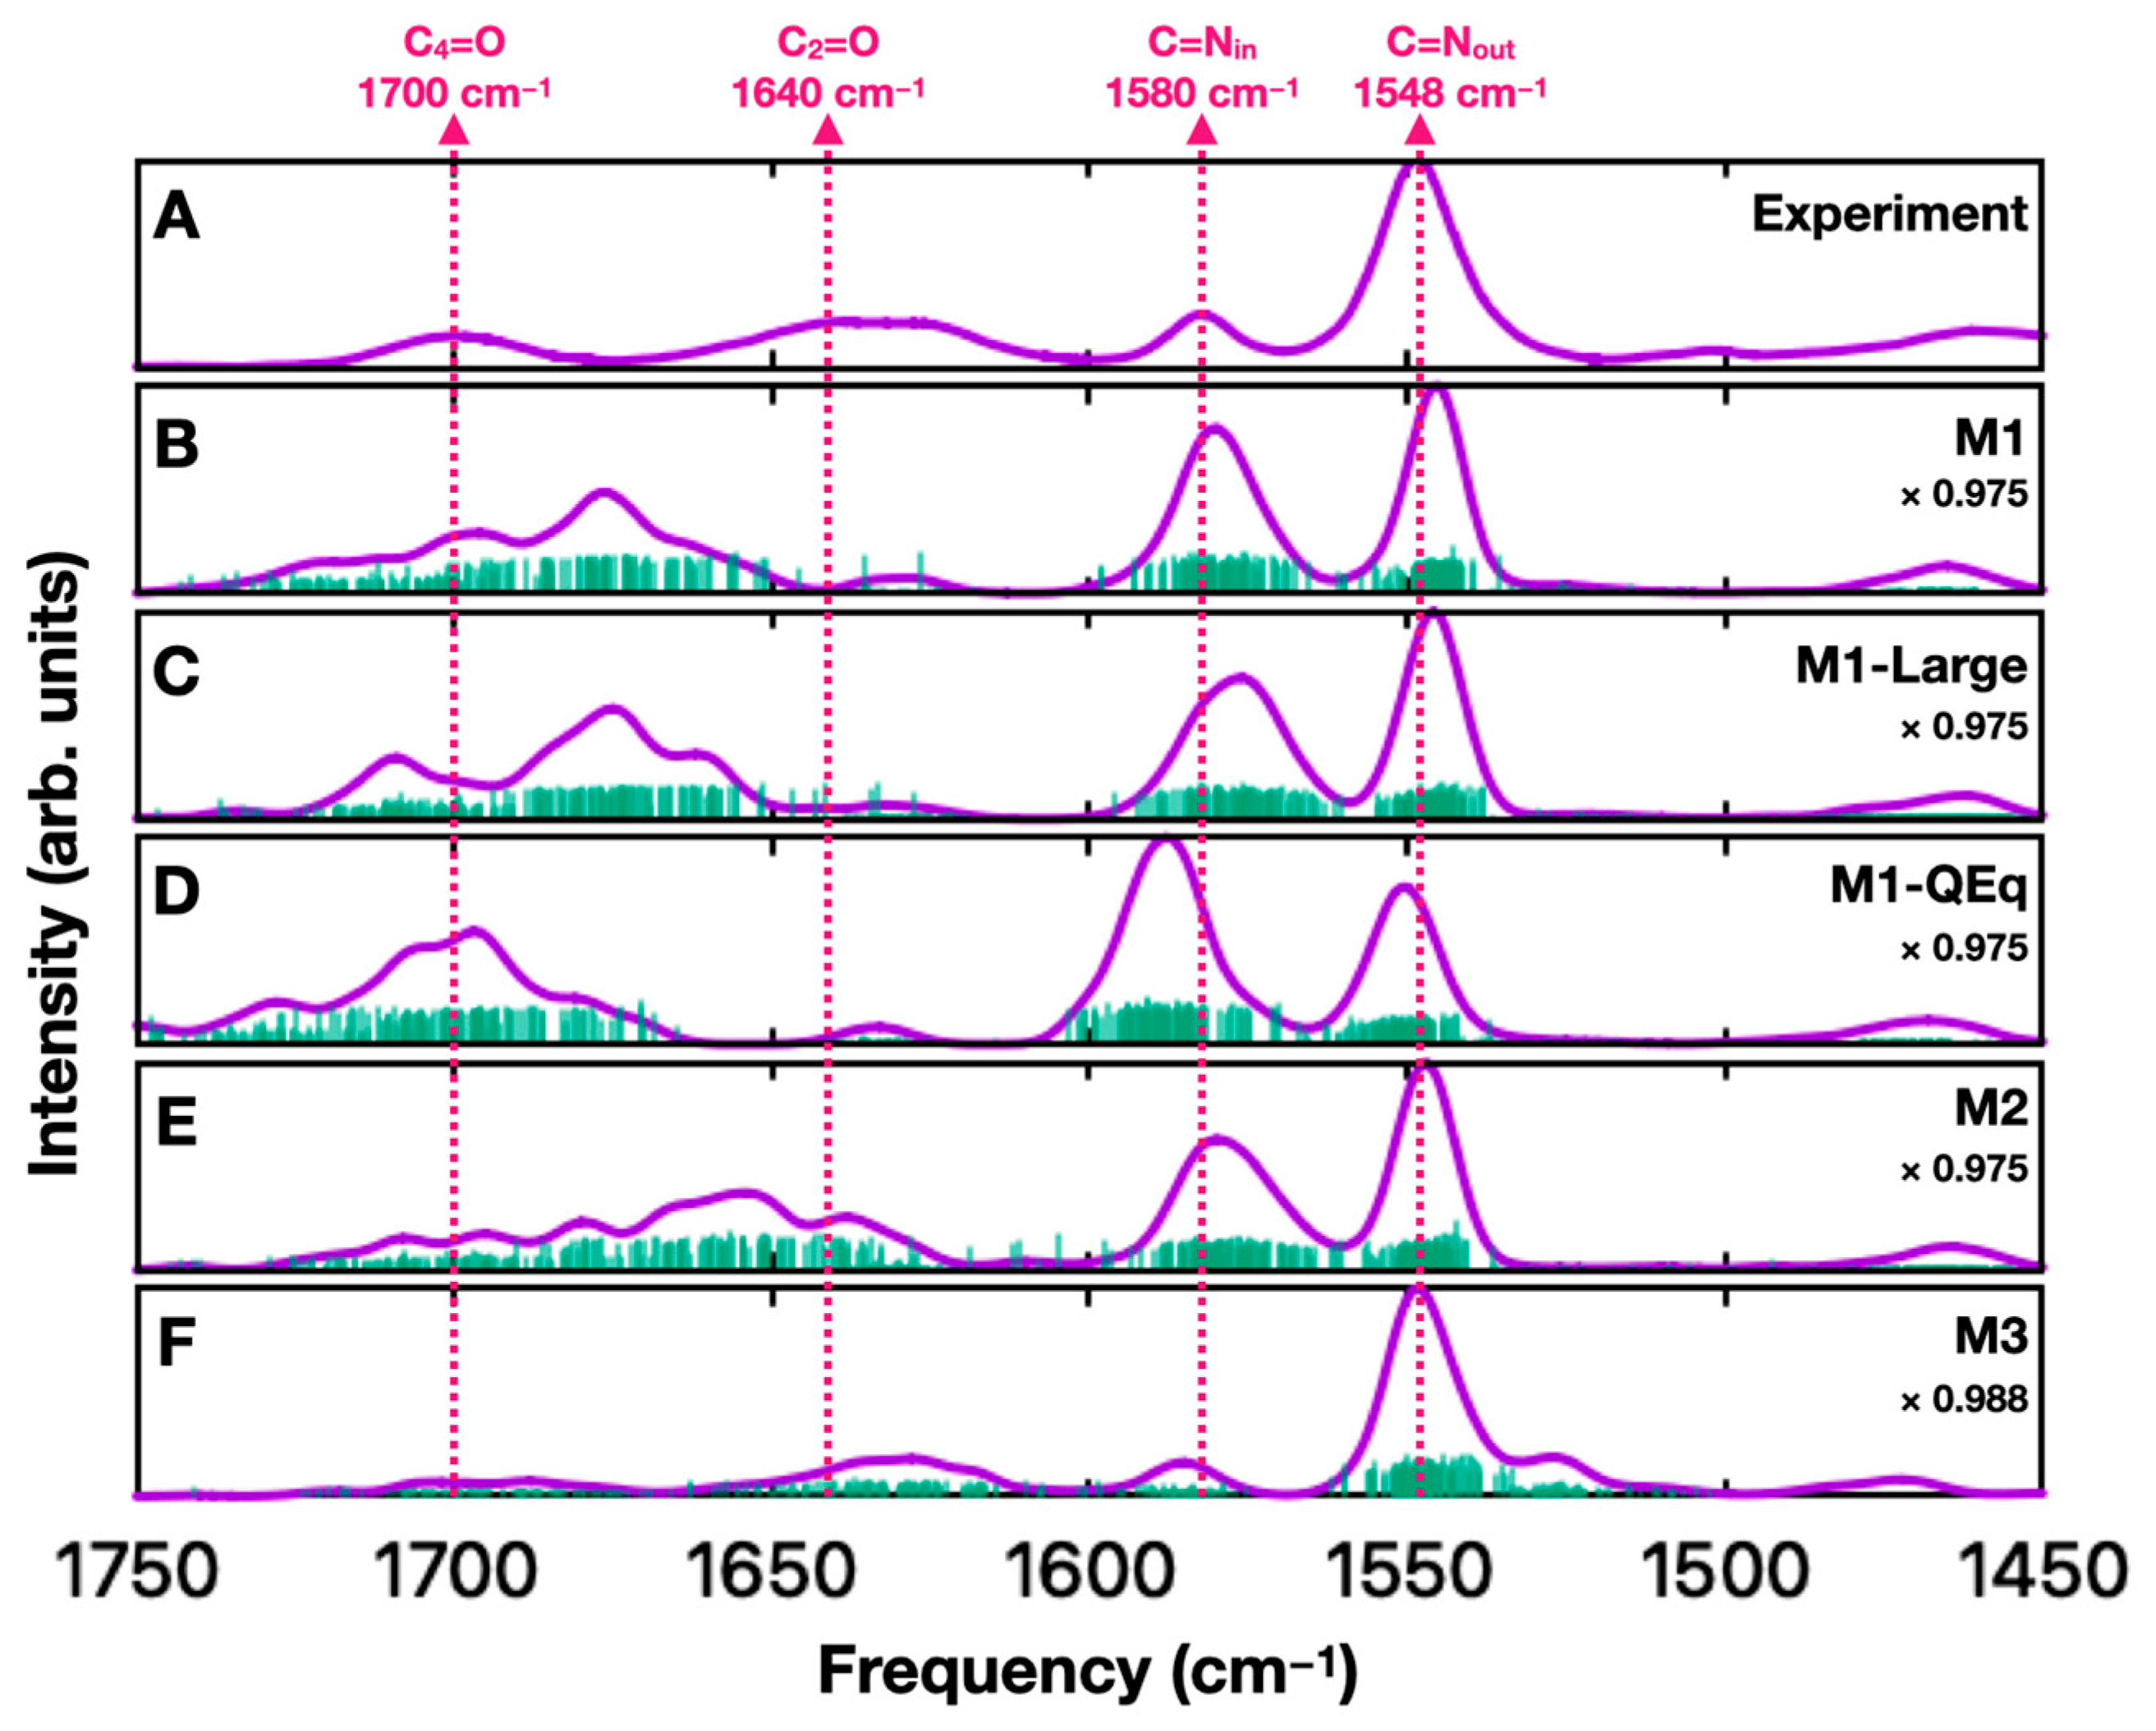
The sum of 100 QM/MM calculations carried out using protocol M1 is shown in Figure 4B. The vibrational frequencies coming from different calculations merge into just a few prominent broad bands. The relative frequencies of the C=N bands in the composite spectrum appear to match well with the experimental data, but the relative intensities are not in line with that observed experimentally. In the case of the C=O bands, neither the calculated frequencies nor intensities appear to match well with the experiment.
Increasing the solvent box size such that the lumiflavin is 12 Å from the edge of the box, instead of 3 Å, had a limited effect on the quality of the calculations (compare panels B and C in Figure 4). Although the spectra in Figure 4B,C are obtained from different MD simulations and therefore different QM/MM structures, the two sets of calculations are highly consistent. This indicates that the disagreement between calculated and experimental spectra is due to a deficiency in the computational approach/model rather than being due to insufficient sampling.
We tested using a charge equilibration method (QEq), which estimates the charge on each of water’s oxygen and hydrogen atoms based on their coordinates. We reasoned that a more flexible charge model may be able to better capture the interactions between lumiflavin and nearby water molecules. While this approach did alter the calculated spectra (compare panels B and D in Figure 4), it arguably made the agreement with the experiment worse.
To improve the description of the hydrogen bonding with lumiflavin’s carbonyl groups, we included a few water molecules in the QM subsystem of the ONIOM calculations. The results are shown in Figure 4E. This did result in some improvement in the agreement between the calculated and experimental spectra, but the experimental C2=O and C4=O bands remain poorly reproduced in the calculation while the C=N stretch band relative intensities still do not match the experiment.
Using a simple QM/MM approach that treats water using point charges did not yield a quantitatively accurate FTIR spectrum for flavin in solution. Even treating water molecules close to the lumiflavin quantum mechanically seems to have only a small effect. Therefore, we decided to consider a hybrid QM cluster/MM/PCM approach using ONIOM-PCM/X (protocol M3). The spectrum calculated using this hybrid method is shown in Figure 4F and is a significant improvement compared to the other models used in this work. Protocol M3 combines favorable features of both the QM cluster and PCM calculations from Figure 1 and captures the relative frequencies and intensities of the four prominent bands more accurately than other protocols tested so far. We note that the broad band labeled as C2=O likely contains two underlying vibrational frequencies (a mix of C2=O and C=Nout) that contribute to the non-Gaussian shape of the band [31,34]. This broadening appears to be reproduced well in Figure 4F. Finally, we find that the prominent band that appears in the PCM calculation in Figure 1 at 1530 cm−1 is now less prominent in the ONIOM-PCM calculations due to being broadened and partially merged with the C=Nout band.
In PCM, the solvent dielectric responds to the presence of the solute with mutual polarization (i.e., the continuum solvent dipoles respond to the electric field of the solute while the solute wave function is updated self-consistently) [53]. Since the PCM cavity is constructed around the entire QM/MM (solute and explicit solvent) system, it introduces a long-range dielectric response. This response has a direct effect on the solute’s wave function but may also affect the solute’s interaction with the QM solvent. Indeed, it appears that the latter may be important; the average O---O distance over 100 snapshots between the closest water molecule to the C2=O carbonyl oxygen is 2.85 Å in protocol M2 but is reduced to 2.77 Å with the introduction of PCM solvation in protocol M3. Similarly, for the C4=O oxygen, the average O---O distance is 2.97 Å in protocol M2 and decreases to 2.90 Å in protocol M3.
To understand why the PCM or ONIOM/PCM results differ from those obtained in cluster or regular ONIOM calculations, we reoptimized the structure and computed vibrational frequencies using PCM solvation with varying dielectric constant ε. We then carried out Potential Energy Distribution (PED) calculations using Vibrational Energy Distribution Analysis (VEDA) version 4.0 [54]. VEDA indicates the extent to which stretching, bending, and torsional motions contribute to specific normal modes.
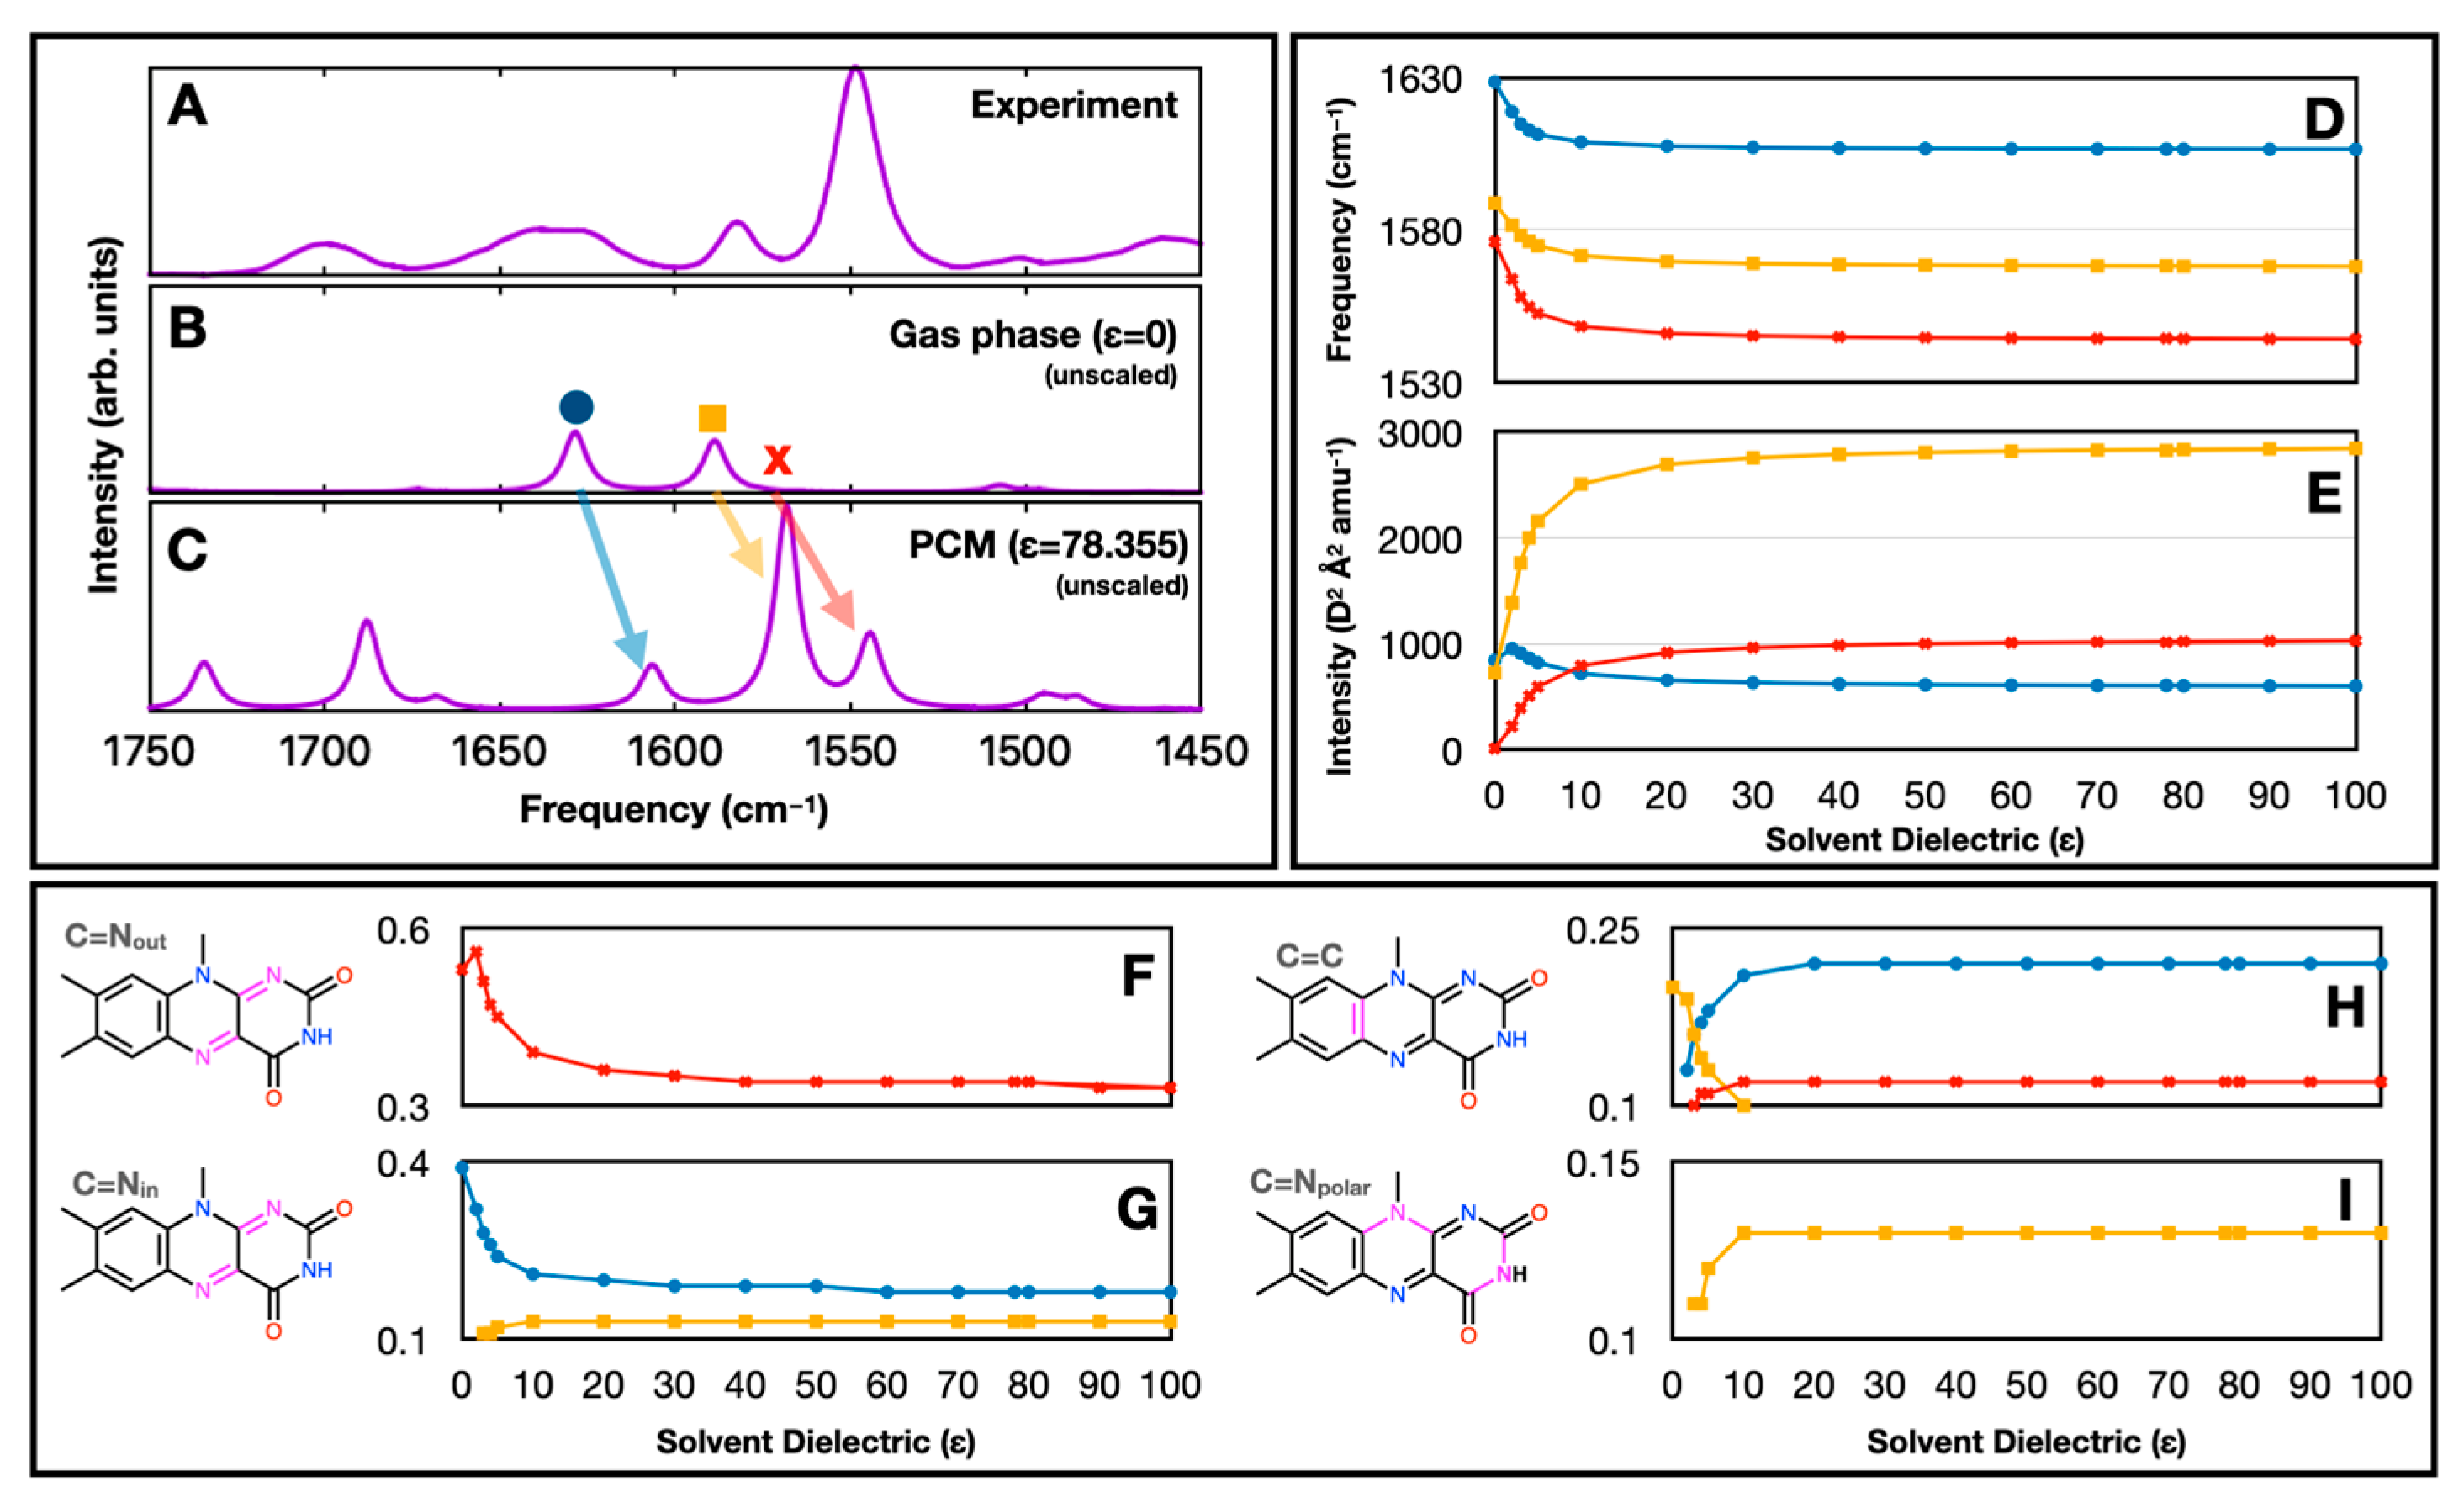
First, in Figure 5B,C, we show unscaled IR spectra in the gas phase and in PCM water (ε = 78.355), respectively. Without scaling, the vibrational frequencies of all the prominent bands in the 1450–1750 cm−1 range downshift upon solvation. We also see that the band near 1580 cm−1 (yellow square, previously labeled C=Nout) becomes significantly more intense in the PCM-calculated spectrum. A nearby band (red x), also near 1580 cm−1 and not visible in the gas-phase-calculated spectrum due to a low intensity, appears as a prominent band in the PCM-calculated spectrum. A third band (blue circle), just above 1600 cm−1, is also downshifted but has a similar intensity in both the gas-phase- and PCM-calculated spectra. In Figure 5D,E, we plot the frequency and intensity, respectively, of those three bands as a function of varying the solvent dielectric constant. To produce this result, we varied the dielectric constant for water from 2 to 100 while keeping all other PCM parameters the same.
Figure 5F–I show the contribution of C=Nout, C=Nin, C=C, and C=Npolar bonds to those vibrations, respectively. The molecular groups are shown in magenta in the lumiflavin molecules in the inset. Here, C=Nout is an out-of-phase combination of N1=C10a and C4a=N5 stretching, while C=Nin is the corresponding in-phase combination. C=C is primarily a C5a=C9a stretch, while C=Npolar is a combination of stretching modes involving the N10 and N3 atoms. We find that there is a strong correlation between the band intensities and their vibrational character. Specifically, the strong increase in the intensity of the band labeled with a yellow square in Figure 5B correlates with an increasing contribution of C=Npolar bonds to the vibration (Figure 5I). The reason for the associated increase in the intensity of the band labeled with a red x in Figure 5B is not clear, but it may be due to some small contribution (<10%) of the same C=Npolar bonds to that normal mode. VEDA 4.0 does not print data on molecular groups that make smaller than a 10% contribution to a normal mode.
In summary, band intensities are related to the mixing of the wave function character of the normal modes (e.g., as in Fermi resonances). This mixing is altered upon solvation, leading to both frequency and intensity changes, which alters the Fermi resonances formed by each band. An increasing dielectric environment mostly downshifts normal modes, but the extent of the downshift is slightly different for each band (Figure 5D). In a lower dielectric environment, normal mode intensities are closer together (Figure 5E). Experimental support for this predicted result may have been obtained from FTIR experiments on several flavin derivatives in KBr disks, where it was found that the two C=N mode intensities were more closely matched [55]. Further FTIR experiments on flavin in different polar solvents (e.g., compare lumiflavin in deuterated water [24], lumiflavin in sucrose [7], and riboflavin in deuterated acetonitrile [56]) also indicate significant intensity variations of the two C=N modes, again supporting our calculated prediction.
Computations by Tavan and co-workers similarly found notable differences in the intensities of the C=N normal modes when comparing lumiflavin in the gas and solvent phases [31]. They were able to reproduce the relative intensities of those bands using QM/MM calculations similar to our M1 protocol, but with a number of variations in the method used. We tested our M1 protocol using the same functional and basis set as they used (BP86/TZVP) but could not reproduce the relative intensities of those bands. Therefore, we attribute the difference in our results to other differences in our protocols.
Here, we looked more closely at the factors that affect the relative intensities of the IR bands in solution. We found that to reproduce the experimental relative intensities, what is needed is a solvent model that correctly reproduces the absolute differences in frequencies of both intense and non-intense bands in the IR spectrum so that Fermi resonances are captured accurately. In our case, the ONIOM QM/MM model was inadequate, unless PCM solvation was also included. This can also be understood directly from the scaling factors: models that reproduced the relative intensities of the two bands (Figure 1 bottom and Figure 4F) had a different scaling factor (0.987–0.988) compared to models that did not reproduce the correct relative intensities (scaling factor 0.975).

3. Materials and Methods

MD simulations were carried out using the AMBER 20 software package [57,58]. Lumiflavin parameters were obtained using GAFF [59] and the Antechamber package [60], which is part of AmberTools. Lumiflavin’s charges were determined using the AM1-BCC method [61]. Those charges and GAFF parameters are only relevant to the initial molecular dynamics since lumiflavin’s structure is later refined at the quantum chemical level of theory. Lumiflavin was solvated in a cubic water box described using the TIP3P force field [62]. The cubic solvent box size was selected such that there was at least 3 Å from any atom of lumiflavin to the edge of the box. The effect of changing this solvent shell size from 3 Å to 12 Å was tested, and it was found that changing the box size did not greatly alter the results. Therefore, calculations discussed in this work were carried out for the 3 Å solvent box model unless specified otherwise. The distance cutoff for electrostatics during the simulations was set at 6 Å for the 3 Å solvent shell and 10 Å for the 12 Å solvent shell.
The solvated system was geometry-optimized using the molecular mechanical force field in two steps; first, only the solvent molecules were optimized, keeping lumiflavin fixed, and then the entire system was optimized. The minimized system was used as a starting point for MD simulations. The system was thermalized to 300 K in the canonical (NVT) ensemble over 2 ns. Then, a 5 ns equilibration was carried out with the isothermal–isobaric (NPT) ensemble at a standard pressure of 1 bar. This was followed by a longer 40 ns NPT simulation used to determine the average volume for the simulation. Finally, a production simulation was carried out for 500 ns using the NVT ensemble. The temperature was kept at 300 K, and the volume was kept at the average determined in the NPT step. The distance cutoff for interactions was reduced by 1 Å during the production simulation stage to speed up the calculations.
Snapshots from the MD simulation served as starting points for QM/MM calculations carried out in Gaussian 16 [63] using ONIOM [49]. Electrostatic embedding was used. Since no periodic boundary conditions were used in the QM calculation, all water molecules were initially kept frozen in their MM positions for each snapshot. However, in each snapshot, flavin was optimized at the DFT level of theory using the B3LYP functional and 6-31 + G** basis set. Generally, the B3LYP hybrid functional theory is a popular, well-tested, and cost-effective method for the calculation of ground-state frequencies when scaled using a constant factor [64,65,66,67,68]. The size of the basis set was tested in a previous study on lumiflavin, and B3LYP/6-31 + G** was found to be reasonable for this system, with limited benefit to using a larger basis set [34].
To reduce the computational cost associated with optimizing hundreds of QM/MM geometries, optimizations were terminated after a maximum of 10 optimization steps. The maximum RMS gradient for all calculations reported in this work is 0.00702 atomic units, compared to Gaussian’s default threshold of 0.000450. Vibrational frequencies were computed at the same level of theory after hydrogen atoms were replaced with deuterium for all water molecules and for the exchangeable proton on flavin’s N3. Computed spectra were adjusted using a constant scaling factor that was chosen for each model to match the computed νC=N(out) vibrational frequency with the experimental one (1548 cm−1). The scaling factor used for each model is indicated in each of the figures in Section 2.
For each computational protocol, 100 snapshots were selected from the last 50 ns of the simulation (at 500 ps intervals). Each of those 100 snapshots was used as a starting point for optimization and frequency calculations with QM/MM. This was done using several different protocols that are represented in Figure 2 and the associated text.

4. Conclusions

To more accurately simulate the main features of an IR spectrum of flavin, including broadening and the correct relative frequencies and intensities, a series of increasingly sophisticated molecular models and computational methods were employed.
In QM/MM calculations for lumiflavin in water, we find that calculations using a single flavin moiety cannot properly represent the ensemble of molecules and solvent configurations around the molecule. Through sampling, we simulated the inhomogeneous broadening of the spectra and provided insights into the intensity changes of specific vibrational modes of lumiflavin due to solvation. Reproducing the relative intensities of bands requires a method and solvation model that correctly reproduce the absolute differences in frequencies of both intense and non-intense bands in the IR spectrum such that Fermi resonances are captured correctly. In our models, a simple point charge description of the solvent is inadequate. We found that for lumiflavin in solution, using a few quantum mechanically treated water molecules nearby as well as a hybrid ONIOM/PCM approach to treat long-range electrostatic effects of the solvent is necessary to simulate the experimental FTIR spectrum. We note also the importance of long-range interactions for simulating other properties in the condensed phase, such as UV–visible spectra and redox or ionization potentials [35,69,70,71,72,73,74,75].
The next step would be to test the computational protocols developed in this study to simulate the FTIR spectrum of flavin embedded in a protein cavity. We expect, however, that due to the lower dielectric environment of a protein, PCM may no longer be necessary to properly capture the relative intensities of IR bands; only a few vibrational frequencies will be affected by specific interactions (e.g., hydrogen bonding) with the protein, compared to a solvent where many frequencies are shifted by a strong dielectric environment. Indeed, ONIOM QM/MM calculations have successfully been shown to reproduce both the relative vibrational frequencies and intensities of quinones in protein binding sites [76].

Author Contributions

Conceptualization, S.G. and G.H.; methodology, D.P.N.L. and S.G.; validation, D.P.N.L. and S.G.; formal analysis, D.P.N.L., S.G. and G.H.; investigation, D.P.N.L.; resources, S.G. and G.H.; data curation, D.P.N.L.; writing—original draft preparation, D.P.N.L. writing—review and editing, S.G. and G.H.; visualization, D.P.N.L. and S.G.; supervision, S.G.; project administration, S.G.; funding acquisition, S.G. and G.H. All authors have read and agreed to the published version of the manuscript.

Funding

This research was funded by the National Science Foundation (NSF) under Grant No. CHE-2047667 (to S.G.) and the U.S. Department of Energy, Office of Science, Office of Basic Energy Sciences, award number DE-SC-0017937 (to G.H.).

Institutional Review Board Statement

Not applicable.

Informed Consent Statement

Not applicable.

Data Availability Statement

Data are contained within the article.

Acknowledgments

We are grateful to Leyla Rohani for help with ONIOM and VEDA calculations. We also thank M. Pabel Kabir for useful discussions and providing data for Figure 1. D.P.N.L. acknowledges a fellowship from the Molecular Basis of Disease Program at Georgia State University. This work used Expanse at SDSC through allocation CHE180027 from the Advanced Cyberinfrastructure Coordination Ecosystem: Services & Support (ACCESS) program, which is supported by National Science Foundation grants #2138259, #2138286, #2138307, #2137603, and #2138296. We also acknowledge Advanced Research Computing Technology and Innovation Core (ARCTIC) resources, which are supported by the NSF Major Research Instrumentation (MRI) grant number CNS-1920024.

Conflicts of Interest

The authors declare no conflicts of interest.

References

  1. Lorenz-Fonfria, V.A. Infrared Difference Spectroscopy of Proteins: From Bands to Bonds. Chem. Rev. 2020, 120, 3466–3576. [Google Scholar] [CrossRef] [PubMed]
  2. Mäntele, W. Reaction-induced infrared difference spectroscopy for the study of protein function and reaction mechanisms. Trends Biochem. Sci. 1993, 18, 197–202. [Google Scholar] [CrossRef] [PubMed]
  3. Thompson, L.M.; Lasoroski, A.; Champion, P.M.; Sage, J.T.; Frisch, M.J.; van Thor, J.J.; Bearpark, M.J. Analytical Harmonic Vibrational Frequencies for the Green Fluorescent Protein Computed with ONIOM: Chromophore Mode Character and Its Response to Environment. J. Chem. Theory Comput. 2014, 10, 751–766. [Google Scholar] [CrossRef] [PubMed]
  4. Huix-Rotllant, M.; Schwinn, K.; Ferré, N. Infrared spectroscopy from electrostatic embedding QM/MM: Local normal mode analysis of infrared spectra of arabidopsis thaliana plant cryptochrome. Phys. Chem. Chem. Phys. 2021, 23, 1666–1674. [Google Scholar] [CrossRef] [PubMed]
  5. Yamada, D.; Kandori, H. FTIR spectroscopy of flavin-binding photoreceptors. Methods Mol. Biol. 2014, 1146, 361–376. [Google Scholar] [CrossRef]
  6. Nishina, Y.; Sato, K.; Setoyama, C.; Tamaoki, H.; Miura, R.; Shiga, K. Intramolecular and intermolecular perturbation on electronic state of FAD free in solution and bound to flavoproteins: FTIR spectroscopic study by using the C=O stretching vibrations as probes. J. Biochem. 2007, 142, 265–272. [Google Scholar] [CrossRef] [PubMed]
  7. Thöing, C.; Pfeifer, A.; Kakorin, S.; Kottke, T. Protonated triplet-excited flavin resolved by step-scan FTIR spectroscopy: Implications for photosensory LOV domains. Phys. Chem. Chem. Phys. 2013, 15, 5916–5926. [Google Scholar] [CrossRef]
  8. Kottke, T.; Batschauer, A.; Ahmad, M.; Heberle, J. Blue-Light-Induced Changes in Arabidopsis Cryptochrome 1 Probed by FTIR Difference Spectroscopy. Biochemistry 2006, 45, 2472–2479. [Google Scholar] [CrossRef]
  9. Ihalainen, J.A.; Gustavsson, E.; Schroeder, L.; Donnini, S.; Lehtivuori, H.; Isaksson, L.; Thöing, C.; Modi, V.; Berntsson, O.; Stucki-Buchli, B.; et al. Chromophore–Protein Interplay during the Phytochrome Photocycle Revealed by Step-Scan FTIR Spectroscopy. J. Am. Chem. Soc. 2018, 140, 12396–12404. [Google Scholar] [CrossRef]
  10. Unno, M.; Sano, R.; Masuda, S.; Ono, T.A.; Yamauchi, S. Light-induced structural changes in the active site of the BLUF domain in AppA by Raman spectroscopy. J. Phys. Chem. B 2005, 109, 12620–12626. [Google Scholar] [CrossRef]
  11. Takahashi, R.; Okajima, K.; Suzuki, H.; Nakamura, H.; Ikeuchi, M.; Noguchi, T. FTIR study on the hydrogen bond structure of a key tyrosine residue in the flavin-binding blue light sensor TePixD from Thermosynechococcus elongatus. Biochemistry 2007, 46, 6459–6467. [Google Scholar] [CrossRef] [PubMed]
  12. Mehlhorn, J.; Steinocher, H.; Beck, S.; Kennis, J.T.; Hegemann, P.; Mathes, T. A set of engineered Escherichia coli expression strains for selective isotope and reactivity labeling of amino acid side chains and flavin cofactors. PLoS ONE 2013, 8, e79006. [Google Scholar] [CrossRef] [PubMed]
  13. Hontani, Y.; Mehlhorn, J.; Domratcheva, T.; Beck, S.; Kloz, M.; Hegemann, P.; Mathes, T.; Kennis, J.T.M. Spectroscopic and Computational Observation of Glutamine Tautomerization in the Blue Light Sensing Using Flavin Domain Photoreaction. J. Am. Chem. Soc. 2023, 145, 1040–1052. [Google Scholar] [CrossRef]
  14. Bonetti, C.; Mathes, T.; Van Stokkum, I.H.; Mullen, K.M.; Groot, M.-L.; Van Grondelle, R.; Hegemann, P.; Kennis, J.T. Hydrogen bond switching among flavin and amino acid side chains in the BLUF photoreceptor observed by ultrafast infrared spectroscopy. Biophys. J. 2008, 95, 4790–4802. [Google Scholar] [CrossRef] [PubMed]
  15. Alexandre, M.T.; van Grondelle, R.; Hellingwerf, K.J.; Kennis, J.T. Conformational heterogeneity and propagation of structural changes in the LOV2/Jα domain from Avena sativa phototropin 1 as recorded by temperature-dependent FTIR spectroscopy. Biophys. J. 2009, 97, 238–247. [Google Scholar] [CrossRef] [PubMed]
  16. Yamamoto, A.; Iwata, T.; Sato, Y.; Matsuoka, D.; Tokutomi, S.; Kandori, H. Light signal transduction pathway from flavin chromophore to the Jα helix of Arabidopsis phototropin1. Biophys. J. 2009, 96, 2771–2778. [Google Scholar] [CrossRef] [PubMed]
  17. Konold, P.E.; Mathes, T.; Weibetaenborn, J.; Groot, M.L.; Hegemann, P.; Kennis, J.T. Unfolding of the C-Terminal Jalpha Helix in the LOV2 Photoreceptor Domain Observed by Time-Resolved Vibrational Spectroscopy. J. Phys. Chem. Lett. 2016, 7, 3472–3476. [Google Scholar] [CrossRef] [PubMed]
  18. Iwata, T.; Nagai, T.; Ito, S.; Osoegawa, S.; Iseki, M.; Watanabe, M.; Unno, M.; Kitagawa, S.; Kandori, H. Hydrogen Bonding Environments in the Photocycle Process around the Flavin Chromophore of the AppA-BLUF domain. J. Am. Chem. Soc. 2018, 140, 11982–11991. [Google Scholar] [CrossRef]
  19. Domratcheva, T.; Grigorenko, B.L.; Schlichting, I.; Nemukhin, A.V. Molecular models predict light-induced glutamine tautomerization in BLUF photoreceptors. Biophys. J. 2008, 94, 3872–3879. [Google Scholar] [CrossRef]
  20. Goings, J.J.; Li, P.F.; Zhu, Q.W.; Hammes-Schiffer, S. Formation of an unusual glutamine tautomer in a blue light using flavin photocycle characterizes the light-adapted state. Proc. Natl. Acad. Sci. USA 2020, 117, 26626–26632. [Google Scholar] [CrossRef]
  21. Rieff, B.; Bauer, S.; Mathias, G.; Tavan, P. DFT/MM description of flavin IR spectra in BLUF domains. J. Phys. Chem. B 2011, 115, 11239–11253. [Google Scholar] [CrossRef] [PubMed]
  22. Wille, G.; Ritter, M.; Friedemann, R.; Mantele, W.; Hubner, G. Redox-triggered FTIR difference spectra of FAD in aqueous solution and bound to flavoproteins. Biochemistry 2003, 42, 14814–14821. [Google Scholar] [CrossRef] [PubMed]
  23. Birss, V.I.; Hinman, A.S.; Mcgarvey, C.E.; Segal, J. In-Situ Ftir Thin-Layer Reflectance Spectroscopy of Flavin Adenine-Dinucleotide at a Mercury Gold Electrode. Electrochim. Acta 1994, 39, 2449–2454. [Google Scholar] [CrossRef]
  24. Iuliano, J.N.; French, J.B.; Tonge, P.J. Vibrational spectroscopy of flavoproteins. Methods Enzymol. 2019, 620, 189–214. [Google Scholar] [CrossRef]
  25. El Khoury, Y.; Van Wilderen, L.J.; Bredenbeck, J. Ultrafast 2D-IR spectroelectrochemistry of flavin mononucleotide. J. Chem. Phys. 2015, 142, 212416. [Google Scholar] [CrossRef]
  26. Zhao, R. Photochemistry, Photophysics and Spectroscopy of Redox States of Flavins Relevant to Photoactive Flavoproteins. Ph.D. Thesis, University of East Anglia, Norwich, UK, 2012. [Google Scholar]
  27. Spexard, M.; Immeln, D.; Thoing, C.; Kottke, T. Infrared spectrum and absorption coefficient of the cofactor flavin in water. Vib. Spectrosc. 2011, 57, 282–287. [Google Scholar] [CrossRef]
  28. Langer, J.; Gunther, A.; Seidenbecher, S.; Berden, G.; Oomens, J.; Dopfer, O. Probing protonation sites of isolated flavins using IR spectroscopy: From lumichrome to the cofactor flavin mononucleotide. Chemphyschem 2014, 15, 2550–2562. [Google Scholar] [CrossRef]
  29. Wolf, M.M.; Schumann, C.; Gross, R.; Domratcheva, T.; Diller, R. Ultrafast infrared spectroscopy of riboflavin: Dynamics, electronic structure, and vibrational mode analysis. J. Phys. Chem. B 2008, 112, 13424–13432. [Google Scholar] [CrossRef]
  30. Kar, R.K.; Borin, V.A.; Ding, Y.; Matysik, J.; Schapiro, I. Spectroscopic Properties of Lumiflavin: A Quantum Chemical Study. Photochem. Photobiol. 2019, 95, 662–674. [Google Scholar] [CrossRef]
  31. Rieff, B.; Mathias, G.; Bauer, S.; Tavan, P. Density functional theory combined with molecular mechanics: The infrared spectra of flavin in solution. Photochem. Photobiol. 2011, 87, 511–523. [Google Scholar] [CrossRef]
  32. Klaumunzer, B.; Kroner, D.; Saalfrank, P. (TD-)DFT calculation of vibrational and vibronic spectra of riboflavin in solution. J. Phys. Chem. B 2010, 114, 10826–10834. [Google Scholar] [CrossRef]
  33. Rieff, B.; Bauer, S.; Mathias, G.; Tavan, P. IR spectra of flavins in solution: DFT/MM description of redox effects. J. Phys. Chem. B 2011, 115, 2117–2123. [Google Scholar] [CrossRef]
  34. Kabir, M.P.; Orozco-Gonzalez, Y.; Hastings, G.; Gozem, S. The effect of hydrogen-bonding on flavin’s infrared absorption spectrum. Spectrochim. Acta A Mol. Biomol. Spectrosc. 2021, 262, 120110. [Google Scholar] [CrossRef]
  35. Kabir, M.P.; Orozco-Gonzalez, Y.; Gozem, S. Electronic spectra of flavin in different redox and protonation states: A computational perspective on the effect of the electrostatic environment. Phys. Chem. Chem. Phys. 2019, 21, 16526–16537. [Google Scholar] [CrossRef]
  36. Gozem, S.; Krylov, A.I. The ezSpectra suite: An easy-to-use toolkit for spectroscopy modeling. Wiley Interdiscip. Rev. Comput. Mol. Sci. 2022, 12, e1546. [Google Scholar] [CrossRef]
  37. Wu, M.; Eriksson, L.A. Absorption Spectra of Riboflavin—A Difficult Case for Computational Chemistry. J. Phys. Chem. A 2010, 114, 10234–10242. [Google Scholar] [CrossRef]
  38. Karasulu, B.; Götze, J.P.; Thiel, W. Assessment of Franck–Condon methods for computing vibrationally broadened UV–Vis absorption spectra of flavin derivatives: Riboflavin, roseoflavin, and 5-thioflavin. J. Chem. Theory Comput. 2014, 10, 5549–5566. [Google Scholar] [CrossRef]
  39. Davari, M.D.; Kopka, B.; Wingen, M.; Bocola, M.; Drepper, T.; Jaeger, K.-E.; Schwaneberg, U.; Krauss, U. Photophysics of the LOV-based fluorescent protein variant iLOV-Q489K determined by simulation and experiment. J. Phys. Chem. B 2016, 120, 3344–3352. [Google Scholar] [CrossRef]
  40. Climent, T.; González-Luque, R.; Merchán, M.; Serrano-Andrés, L. Theoretical insight into the spectroscopy and photochemistry of isoalloxazine, the flavin core ring. J. Phys. Chem. A 2006, 110, 13584–13590. [Google Scholar] [CrossRef]
  41. Thomas, M.; Brehm, M.; Fligg, R.; Vöhringer, P.; Kirchner, B. Computing vibrational spectra from ab initio molecular dynamics. Phys. Chem. Chem. Phys. 2013, 15, 6608–6622. [Google Scholar] [CrossRef] [PubMed]
  42. Nonella, M.; Mathias, G.; Tavan, P. Infrared spectrum of p-benzoquinone in water obtained from a QM/MM hybrid molecular dynamics simulation. J. Phys. Chem. A 2003, 107, 8638–8647. [Google Scholar] [CrossRef]
  43. Schwinn, K.; Ferré, N.; Huix-Rotllant, M. Efficient analytic second derivative of electrostatic embedding QM/MM energy: Normal mode analysis of plant cryptochrome. J. Chem. Theory Comput. 2020, 16, 3816–3824. [Google Scholar] [CrossRef] [PubMed]
  44. Groenhof, G. Introduction to QM/MM simulations. Methods Mol. Biol. 2013, 924, 43–66. [Google Scholar] [CrossRef]
  45. Senn, H.M.; Thiel, W. QM/MM methods for biomolecular systems. Angew. Chem. Int. Ed. 2009, 48, 1198–1229. [Google Scholar] [CrossRef] [PubMed]
  46. Warshel, A.; Levitt, M. Theoretical studies of enzymic reactions: Dielectric, electrostatic and steric stabilization of the carbonium ion in the reaction of lysozyme. J. Mol. Biol. 1976, 103, 227–249. [Google Scholar] [CrossRef]
  47. Dapprich, S.; Komáromi, I.; Byun, K.S.; Morokuma, K.; Frisch, M.J. A new ONIOM implementation in Gaussian98. Part I. The calculation of energies, gradients, vibrational frequencies and electric field derivatives1Dedicated to Professor Keiji Morokuma in celebration of his 65th birthday.1. J. Mol. Struct. Theochem. 1999, 461–462, 1–21. [Google Scholar] [CrossRef]
  48. Chung, L.W.; Sameera, W.; Ramozzi, R.; Page, A.J.; Hatanaka, M.; Petrova, G.P.; Harris, T.V.; Li, X.; Ke, Z.; Liu, F. The ONIOM method and its applications. Chem. Rev. 2015, 115, 5678–5796. [Google Scholar] [CrossRef] [PubMed]
  49. Palivec, V.; Kopecky, V., Jr.; Jungwirth, P.; Bour, P.; Kaminsky, J.; Martinez-Seara, H. Simulation of Raman and Raman optical activity of saccharides in solution. Phys. Chem. Chem. Phys. 2020, 22, 1983–1993. [Google Scholar] [CrossRef]
  50. Rappé, A.K.; Bormann-Rochotte, L.M.; Wiser, D.C.; Hart, J.R.; Pietsch, M.A.; Casewit, C.J.; Skiff, W.M. APT a next generation QM-based reactive force field model. Mol. Phys. 2007, 105, 301–324. [Google Scholar] [CrossRef]
  51. Humphrey, W.; Dalke, A.; Schulten, K. VMD: Visual molecular dynamics. J. Mol. Graph. 1996, 14, 33–38. [Google Scholar] [CrossRef]
  52. Vreven, T.; Mennucci, B.; da Silva, C.O.; Morokuma, K.; Tomasi, J. The ONIOM-PCM method: Combining the hybrid molecular orbital method and the polarizable continuum model for solvation. Application to the geometry and properties of a merocyanine in solution. J. Chem. Phys. 2001, 115, 62–72. [Google Scholar] [CrossRef]
  53. Herbert, J.M. Dielectric continuum methods for quantum chemistry. Wiley Interdiscip. Rev. Comput. Mol. Sci. 2021, 11, e1519. [Google Scholar] [CrossRef]
  54. Jamróz, M.H. Vibrational Energy Distribution Analysis (VEDA): Scopes and limitations. Spectrochim. Acta Part A Mol. Biomol. Spectrosc. 2013, 114, 220–230. [Google Scholar] [CrossRef]
  55. Abe, M.; Kyogoku, Y.; Kitagawa, T.; Kawano, K.; Ohishi, N.; Takai-Suzuki, A.; Yagi, K. lnfrared spectra and molecular association of lumiflavin and riboflavin derivatives. Spectrochim. Acta Part A Mol. Spectroscopy 1986, 42, 1059–1068. [Google Scholar] [CrossRef]
  56. Martin, C.B.; Tsao, M.-L.; Hadad, C.M.; Platz, M.S. The Reaction of Triplet Flavin with Indole. A Study of the Cascade of Reactive Intermediates Using Density Functional Theory and Time Resolved Infrared Spectroscopy. J. Am. Chem. Soc. 2002, 124, 7226–7234. [Google Scholar] [CrossRef]
  57. Salomon-Ferrer, R.; Case, D.A.; Walker, R.C. An overview of the Amber biomolecular simulation package. WIREs Comput. Mol. Sci. 2013, 3, 198–210. [Google Scholar] [CrossRef]
  58. Case, D.A.; Cheatham III, T.E.; Darden, T.; Gohlke, H.; Luo, R.; Merz, K.M., Jr.; Onufriev, A.; Simmerling, C.; Wang, B.; Woods, R.J. The Amber biomolecular simulation programs. J. Comput. Chem. 2005, 26, 1668–1688. [Google Scholar] [CrossRef]
  59. Wang, J.; Wolf, R.M.; Caldwell, J.W.; Kollman, P.A.; Case, D.A. Development and testing of a general amber force field. J. Comput. Chem. 2004, 25, 1157–1174. [Google Scholar] [CrossRef]
  60. Wang, J.; Wang, W.; Kollman, P.A.; Case, D.A. Automatic atom type and bond type perception in molecular mechanical calculations. J. Mol. Graph. Model. 2006, 25, 247–260. [Google Scholar] [CrossRef] [PubMed]
  61. Jakalian, A.; Jack, D.B.; Bayly, C.I. Fast, efficient generation of high-quality atomic charges. AM1-BCC model: II. Parameterization and validation. J. Comput. Chem. 2002, 23, 1623–1641. [Google Scholar] [CrossRef] [PubMed]
  62. Jorgensen, W.L.; Chandrasekhar, J.; Madura, J.D.; Impey, R.W.; Klein, M.L. Comparison of simple potential functions for simulating liquid water. J. Chem. Phys. 1983, 79, 926–935. [Google Scholar] [CrossRef]
  63. Frisch, M.J.; Trucks, G.W.; Schlegel, H.B.; Scuseria, G.E.; Robb, M.A.; Cheeseman, J.R.; Scalmani, G.; Barone, V.; Petersson, G.A.; Nakatsuji, H.; et al. Gaussian 16 Rev. C.01; Wallingford, CT, USA, 2016. [Google Scholar]
  64. Demichelis, R.; Civalleri, B.; Ferrabone, M.; Dovesi, R. On the performance of eleven DFT functionals in the description of the vibrational properties of aluminosilicates. Int. J. Quantum Chem. 2010, 110, 406–415. [Google Scholar] [CrossRef]
  65. Neugebauer, J.; Reiher, M.; Hess, B.A. Coupled-cluster Raman intensities: Assessment and comparison with multiconfiguration and density functional methods. J. Chem. Phys. 2002, 117, 8623–8633. [Google Scholar] [CrossRef]
  66. Halls, M.D.; Velkovski, J.; Schlegel, H.B. Harmonic frequency scaling factors for Hartree-Fock, S-VWN, B-LYP, B3-LYP, B3-PW91 and MP2 with the Sadlej pVTZ electric property basis set. Theor. Chem. Acc. 2001, 105, 413–421. [Google Scholar] [CrossRef]
  67. Jimenez-Hoyos, C.A.; Janesko, B.G.; Scuseria, G.E. Evaluation of range-separated hybrid density functionals for the prediction of vibrational frequencies, infrared intensities, and Raman activities. Phys. Chem. Chem. Phys. 2008, 10, 6621–6629. [Google Scholar] [CrossRef] [PubMed]
  68. Zvereva, E.E.; Shagidullin, A.R.; Katsyuba, S.A. Ab initio and DFT predictions of infrared intensities and Raman activities. J. Phys. Chem. A 2011, 115, 63–69. [Google Scholar] [CrossRef] [PubMed]
  69. Tazhigulov, R.N.; Gurunathan, P.K.; Kim, Y.; Slipchenko, L.V.; Bravaya, K.B. Polarizable embedding for simulating redox potentials of biomolecules. Phys. Chem. Chem. Phys. 2019, 21, 11642–11650. [Google Scholar] [CrossRef]
  70. Karnaukh, E.A.; Bravaya, K.B. The redox potential of a heme cofactor in Nitrosomonas europaea cytochrome c peroxidase: A polarizable QM/MM study. Phys. Chem. Chem. Phys. 2021, 23, 16506–16515. [Google Scholar] [CrossRef]
  71. Tazhigulov, R.N.; Bravaya, K.B. Free energies of redox half-reactions from first-principles calculations. J. Phys. Chem. Lett. 2016, 7, 2490–2495. [Google Scholar] [CrossRef]
  72. Provorse Long, M.R.; Isborn, C.M. Combining explicit quantum solvent with a polarizable continuum model. J. Phys. Chem. B 2017, 121, 10105–10117. [Google Scholar] [CrossRef]
  73. Ikonnikov, E.; Paolino, M.; Garcia-Alvarez, J.; Orozco-Gonzalez, Y.; Granados, C.; Röder, A.; Léonard, J.; Olivucci, M.; Haacke, S.; Kornilov, O. Photoelectron Spectroscopy of Oppositely Charged Molecular Switches in the Aqueous Phase: Theory and Experiment. J. Phys. Chem. Lett. 2023, 14, 6061–6070. [Google Scholar] [CrossRef] [PubMed]
  74. Dratch, B.D.; Orozco-Gonzalez, Y.; Gadda, G.; Gozem, S. Ionic atmosphere effect on the absorption spectrum of a flavoprotein: A reminder to consider solution ions. J. Phys. Chem. Lett. 2021, 12, 8384–8396. [Google Scholar] [CrossRef] [PubMed]
  75. Barrozo, A.; Xu, B.; Gunina, A.O.; Jacobs, M.I.; Wilson, K.; Kostko, O.; Ahmed, M.; Krylov, A.I. To be or not to be a molecular ion: The role of the solvent in photoionization of arginine. J. Phys. Chem. Lett. 2019, 10, 1860–1865. [Google Scholar] [CrossRef] [PubMed]
  76. Makita, H.; Rohani, L.; Zhao, N.; Hastings, G. Quinones in the A1 binding site in photosystem I studied using time-resolved FTIR difference spectroscopy. Biochim. Biophys. Acta (BBA)-Bioenerg. 2017, 1858, 804–813. [Google Scholar] [CrossRef]
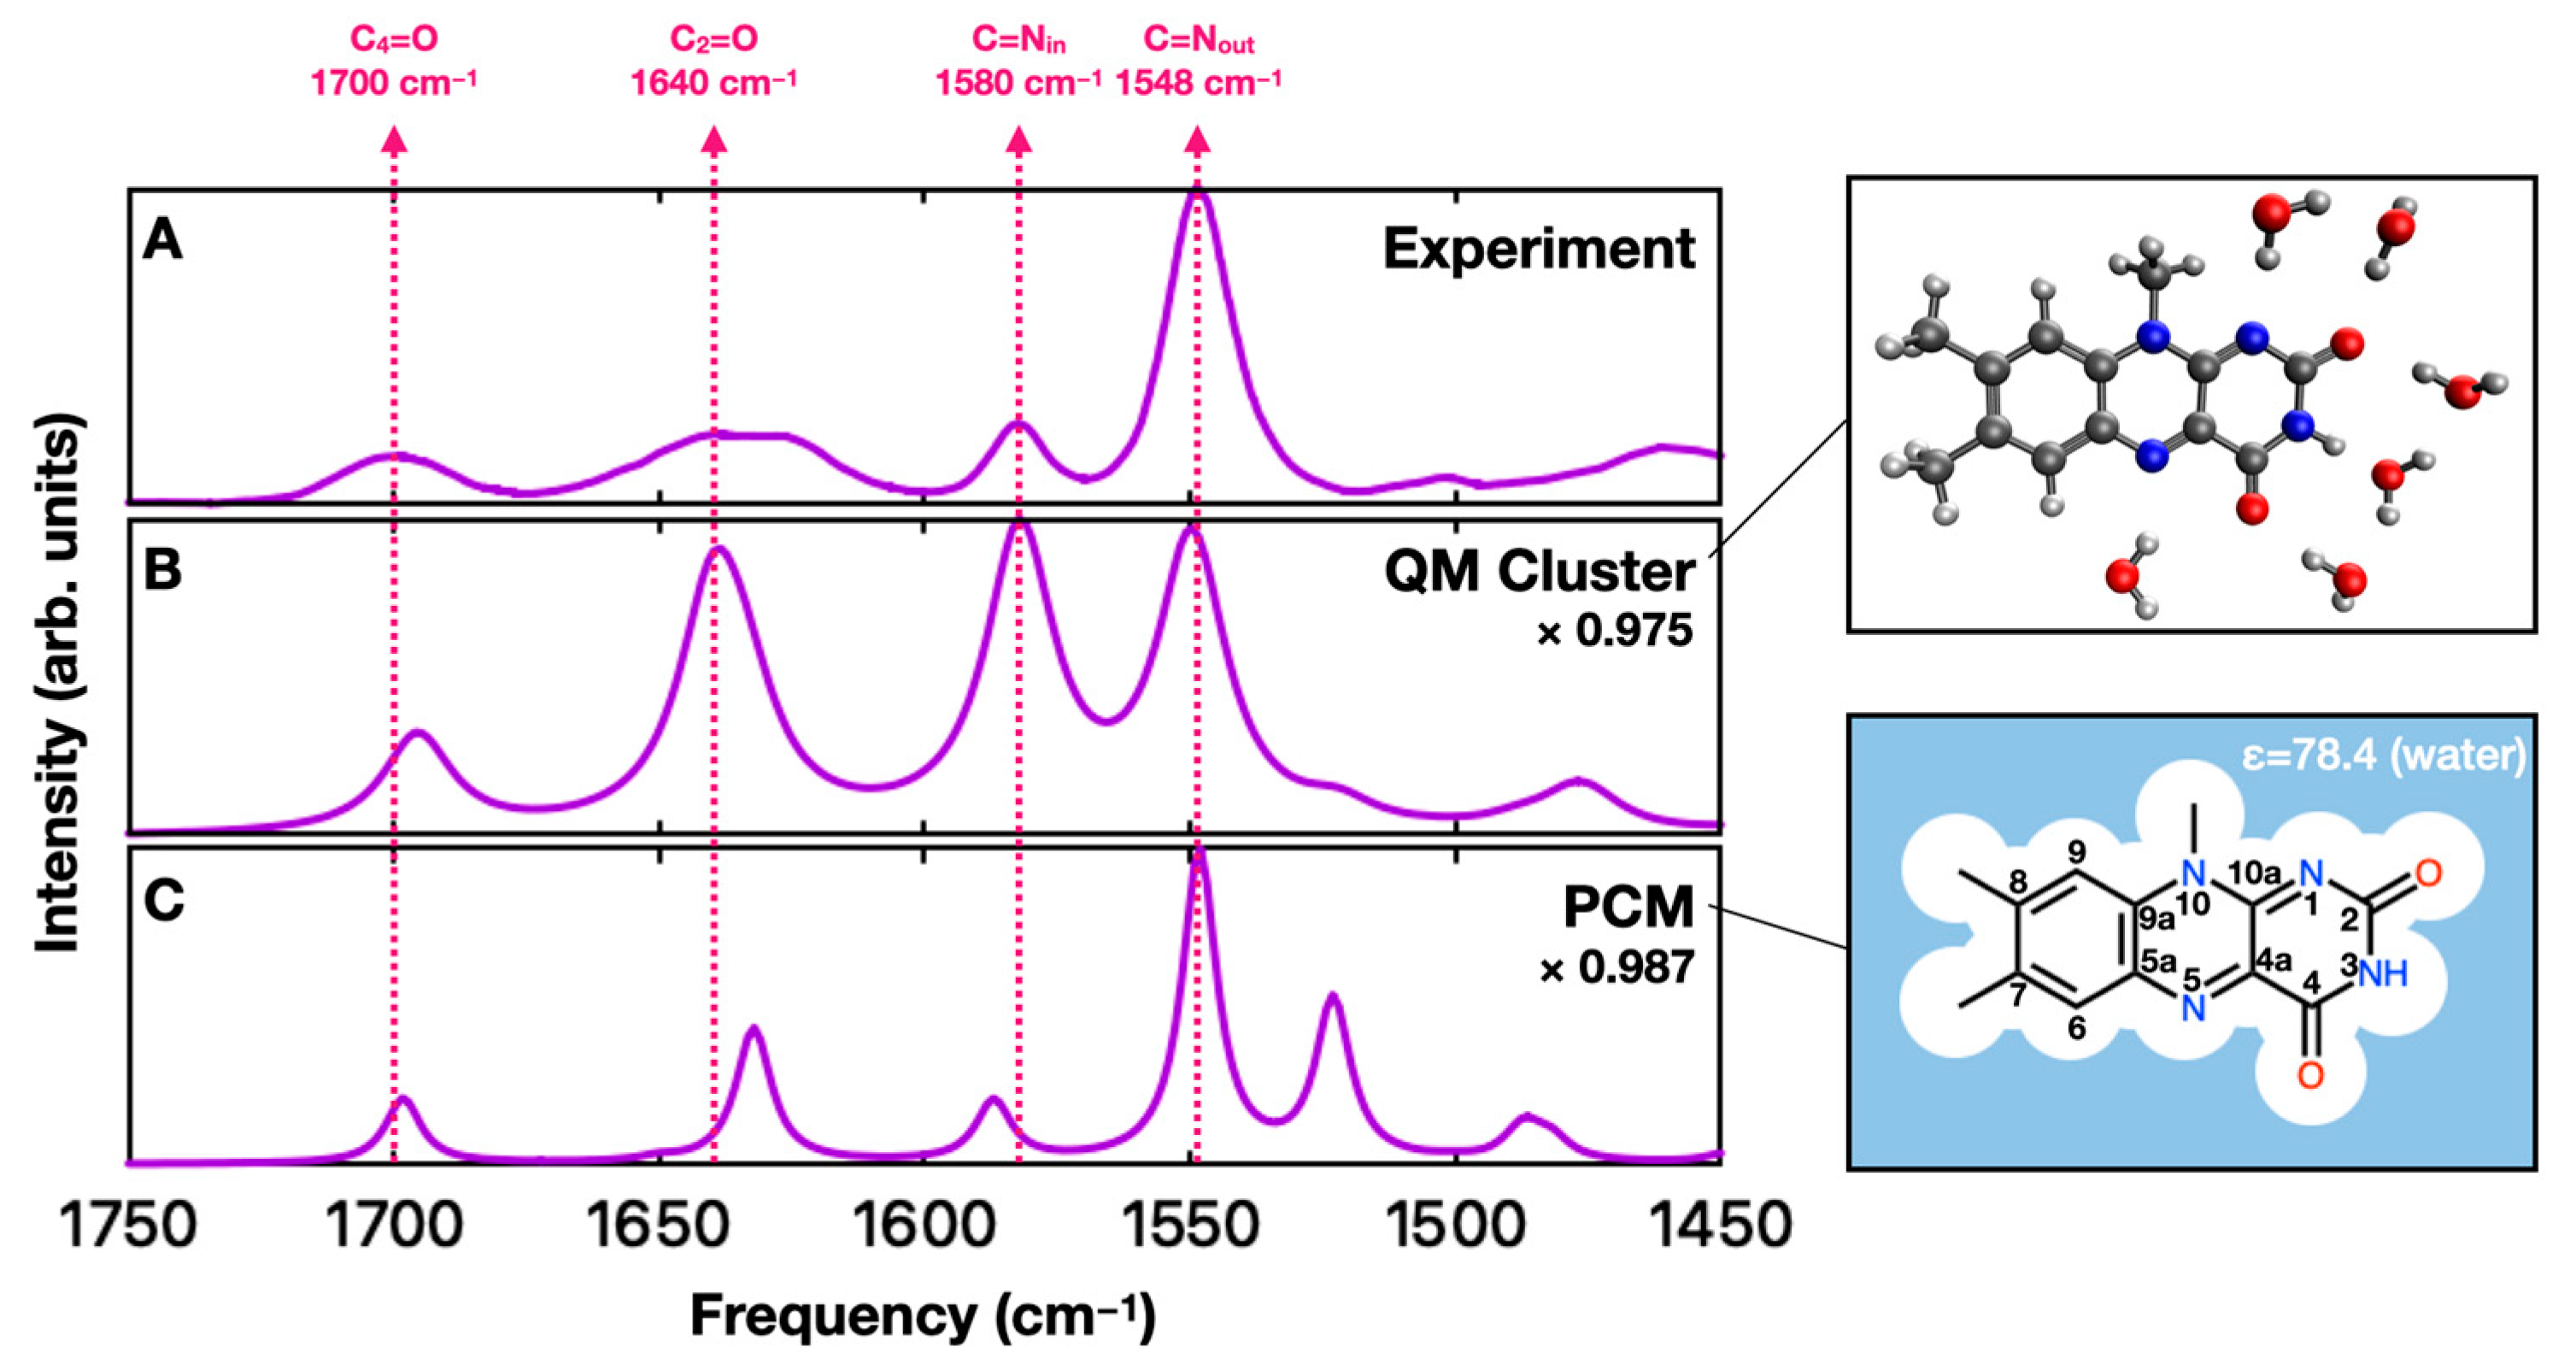
Figure 1. (A) Experimental FTIR spectrum for FMN in D2O in the 1450–1750 cm−1 region from Ref. [24]. (B,C) Calculated infrared spectra for lumiflavin obtained using a QM cluster (B) and PCM (C) solvent model from Ref. [34]. The constant scaling factor used to match the experimental C=Nout frequency is shown for each calculation. Dashed lines indicate peak positions in the experimental spectra. The insets (right side) are schemes of the molecular model used in calculations. Carbon, nitrogen, oxygen, and hydrogen atoms are represented using grey, blue, red, and white, respectively.
Molecules 29 00520 g001
Figure 2. QM/MM protocols used. (A) Protocol M1: Only the lumiflavin is treated at the QM level of theory. Water molecules are all treated at the MM level and kept frozen in the structure obtained from MD. (B) Protocol M2: Water molecules that are within 3.5 Å of the lumiflavin carbonyl oxygen atoms are included in the QM region and optimized. The remaining water molecules are treated at the MM level. (C) Protocol M3: The ONIOM-PCM/X approach is also used to solvate the QM/MM system implicitly. See text for more details.
Molecules 29 00520 g002
Figure 3. (Top) Experimental FTIR spectrum for FMN in D2O, in the 1450–1750 cm−1 region (reproduced from Figure 1A) [24]. (Bottom) Overlay of ten IR spectra computed for lumiflavin using protocol M1. The ten spectra, shown using different colors, are obtained starting from different snapshots of an MD simulation. Each spectrum shown here is normalized using a constant scaling factor to match the experimental C=Nout frequency. Dashed lines indicate peak positions in the experimental spectra.
Molecules 29 00520 g003
Figure 4. (A) Experimental FTIR spectrum for FMN in D2O, in the 1450–1750 cm−1 region (reproduced from Figure 1A) [24]. Panels (B–F) show the combination of 100 FTIR spectra computed for lumiflavin using protocols M1, M1-Large, M1-QEq, M2, and M3, respectively. The 100 spectra are obtained starting from different snapshots of an MD simulation. Frequencies and intensities from individual calculations are indicated as impulse lines in green. These lines are convolved with an 8 cm−1 wide (FWHM) Gaussian function and then summed to give the final computed spectrum (purple). Frequency scaling factors are indicated for each model. Dashed lines indicate peak positions in the experimental spectra.
Molecules 29 00520 g004
Figure 5. (A) Experimental FTIR spectrum of FMN in D2O [24]. (B,C) Computed FTIR spectra for lumiflavin in the gas phase (B) and in PCM (C). No scaling is used for the calculated frequencies, so the PCM- and gas-phase-calculated spectra can be compared directly. (D,E) A plot of how the frequencies (D) and intensities (E) of the three modes labeled as a blue circle, yellow square, and red x in panel (B) change as a function of the solvent dielectric constant. (FI) VEDA-calculated fractional contributions of specific bond stretching coordinates to the three normal modes, as a function of solvent dielectric. The stretching bonds involved are colored in magenta in the insets.
Molecules 29 00520 g005
Disclaimer/Publisher’s Note: The statements, opinions and data contained in all publications are solely those of the individual author(s) and contributor(s) and not of MDPI and/or the editor(s). MDPI and/or the editor(s) disclaim responsibility for any injury to people or property resulting from any ideas, methods, instructions or products referred to in the content.