
Effect of Gas Composition on Surfactant Injectivity in a Surfactant-Alternating-Gas Foam Process


Abstract
:1. Introduction
2. Results and Discussion
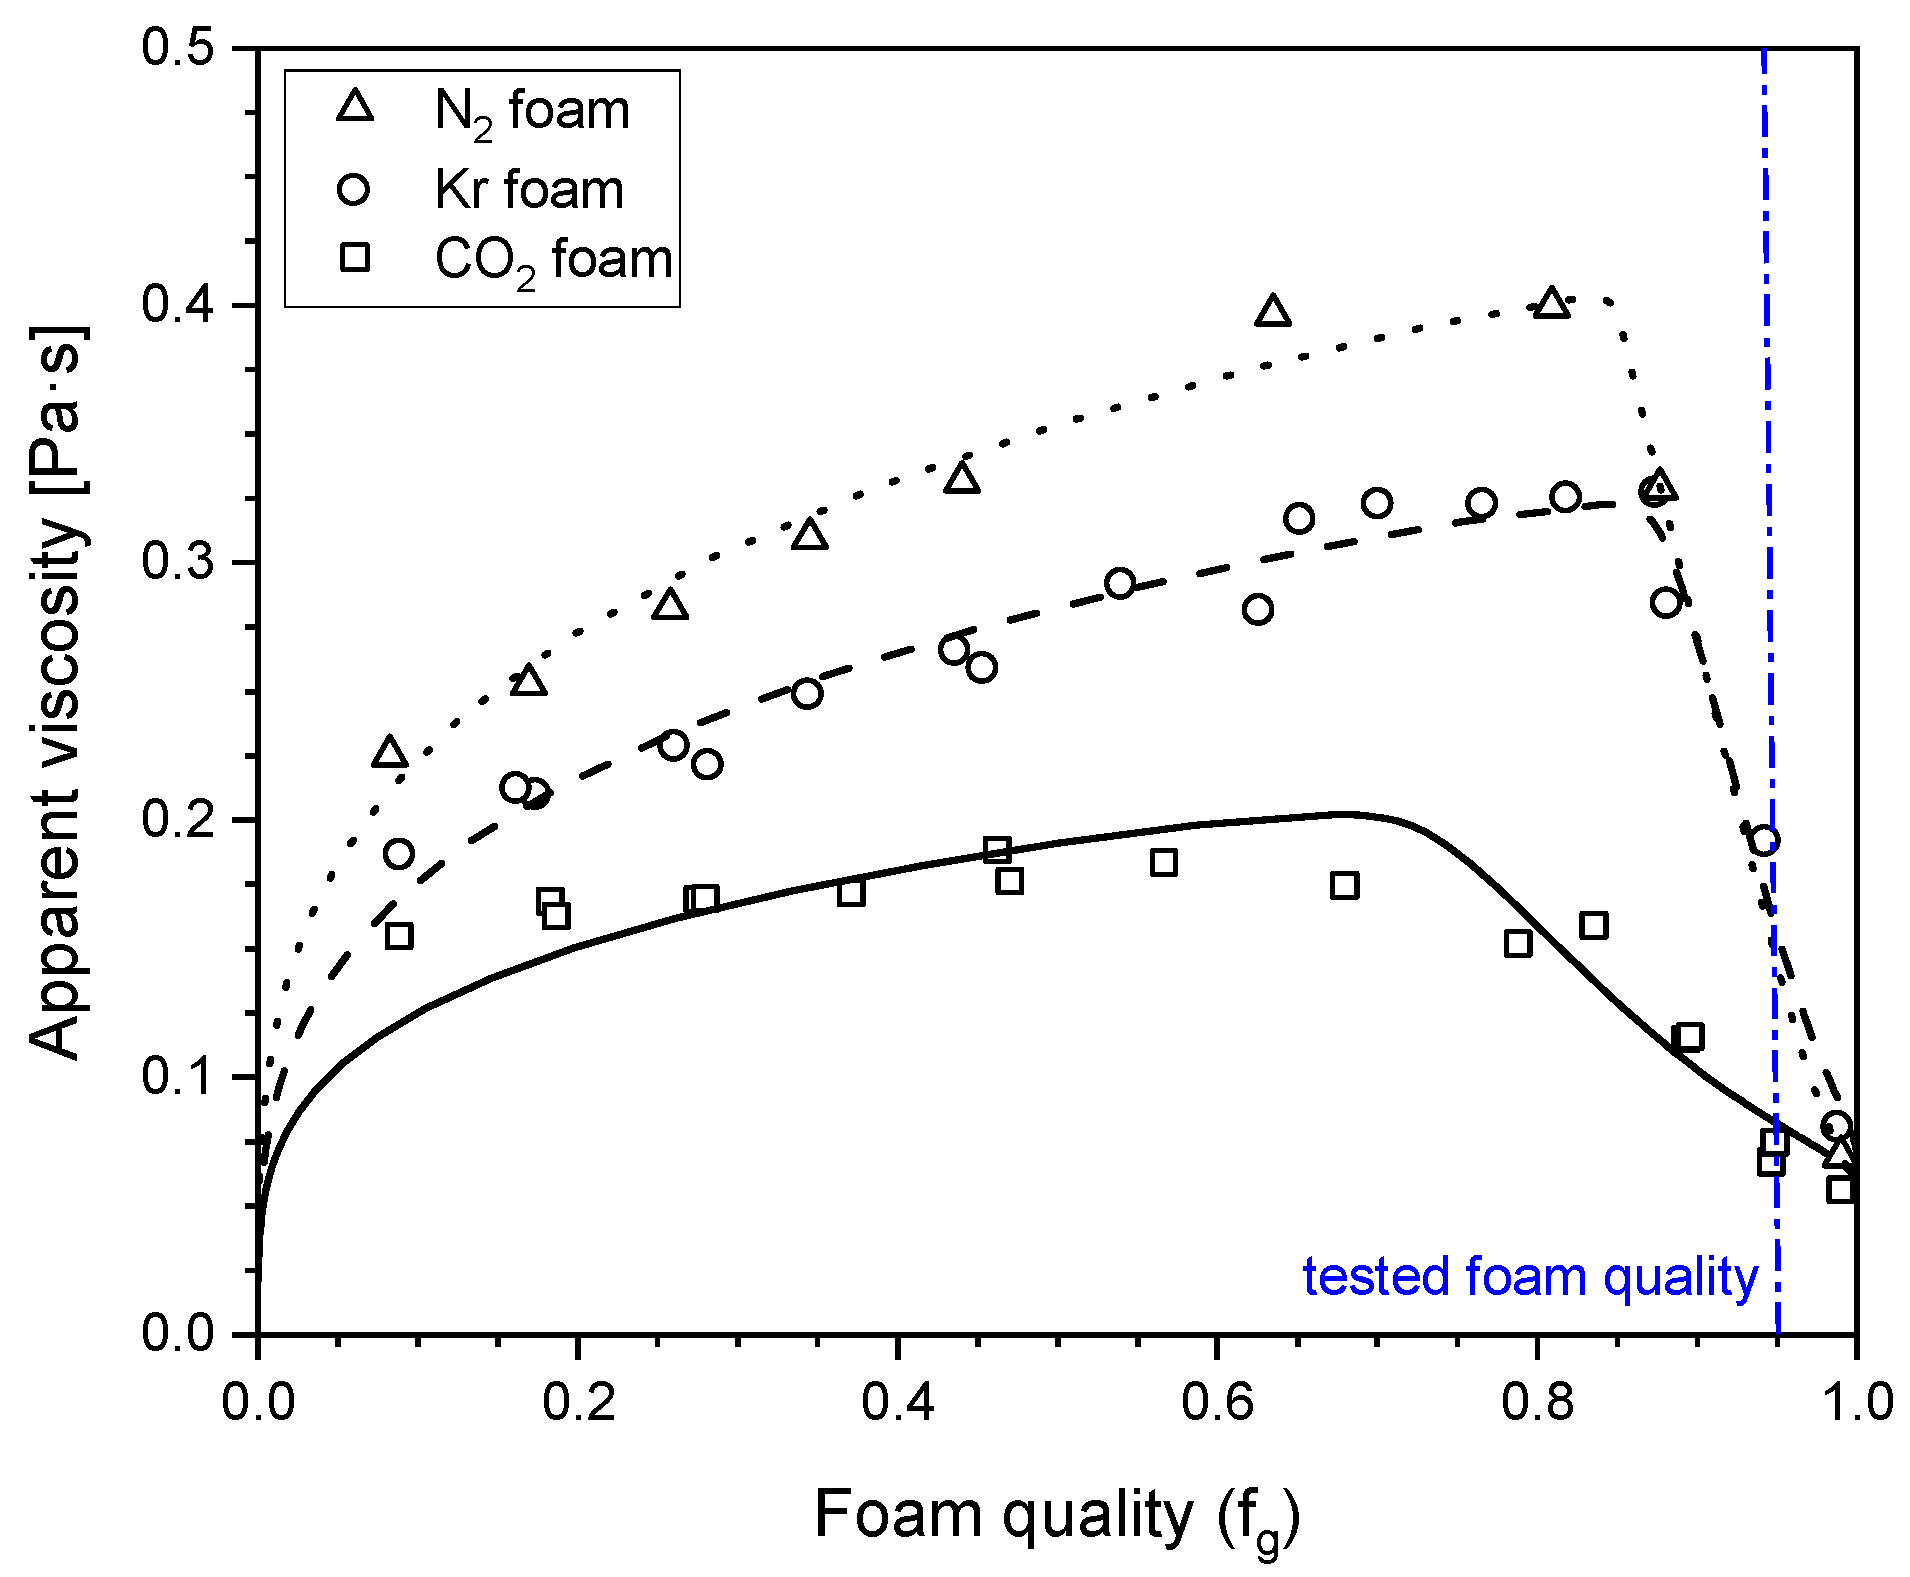
2.1. Influence of Gas Composition on Steady-State Foam Strength
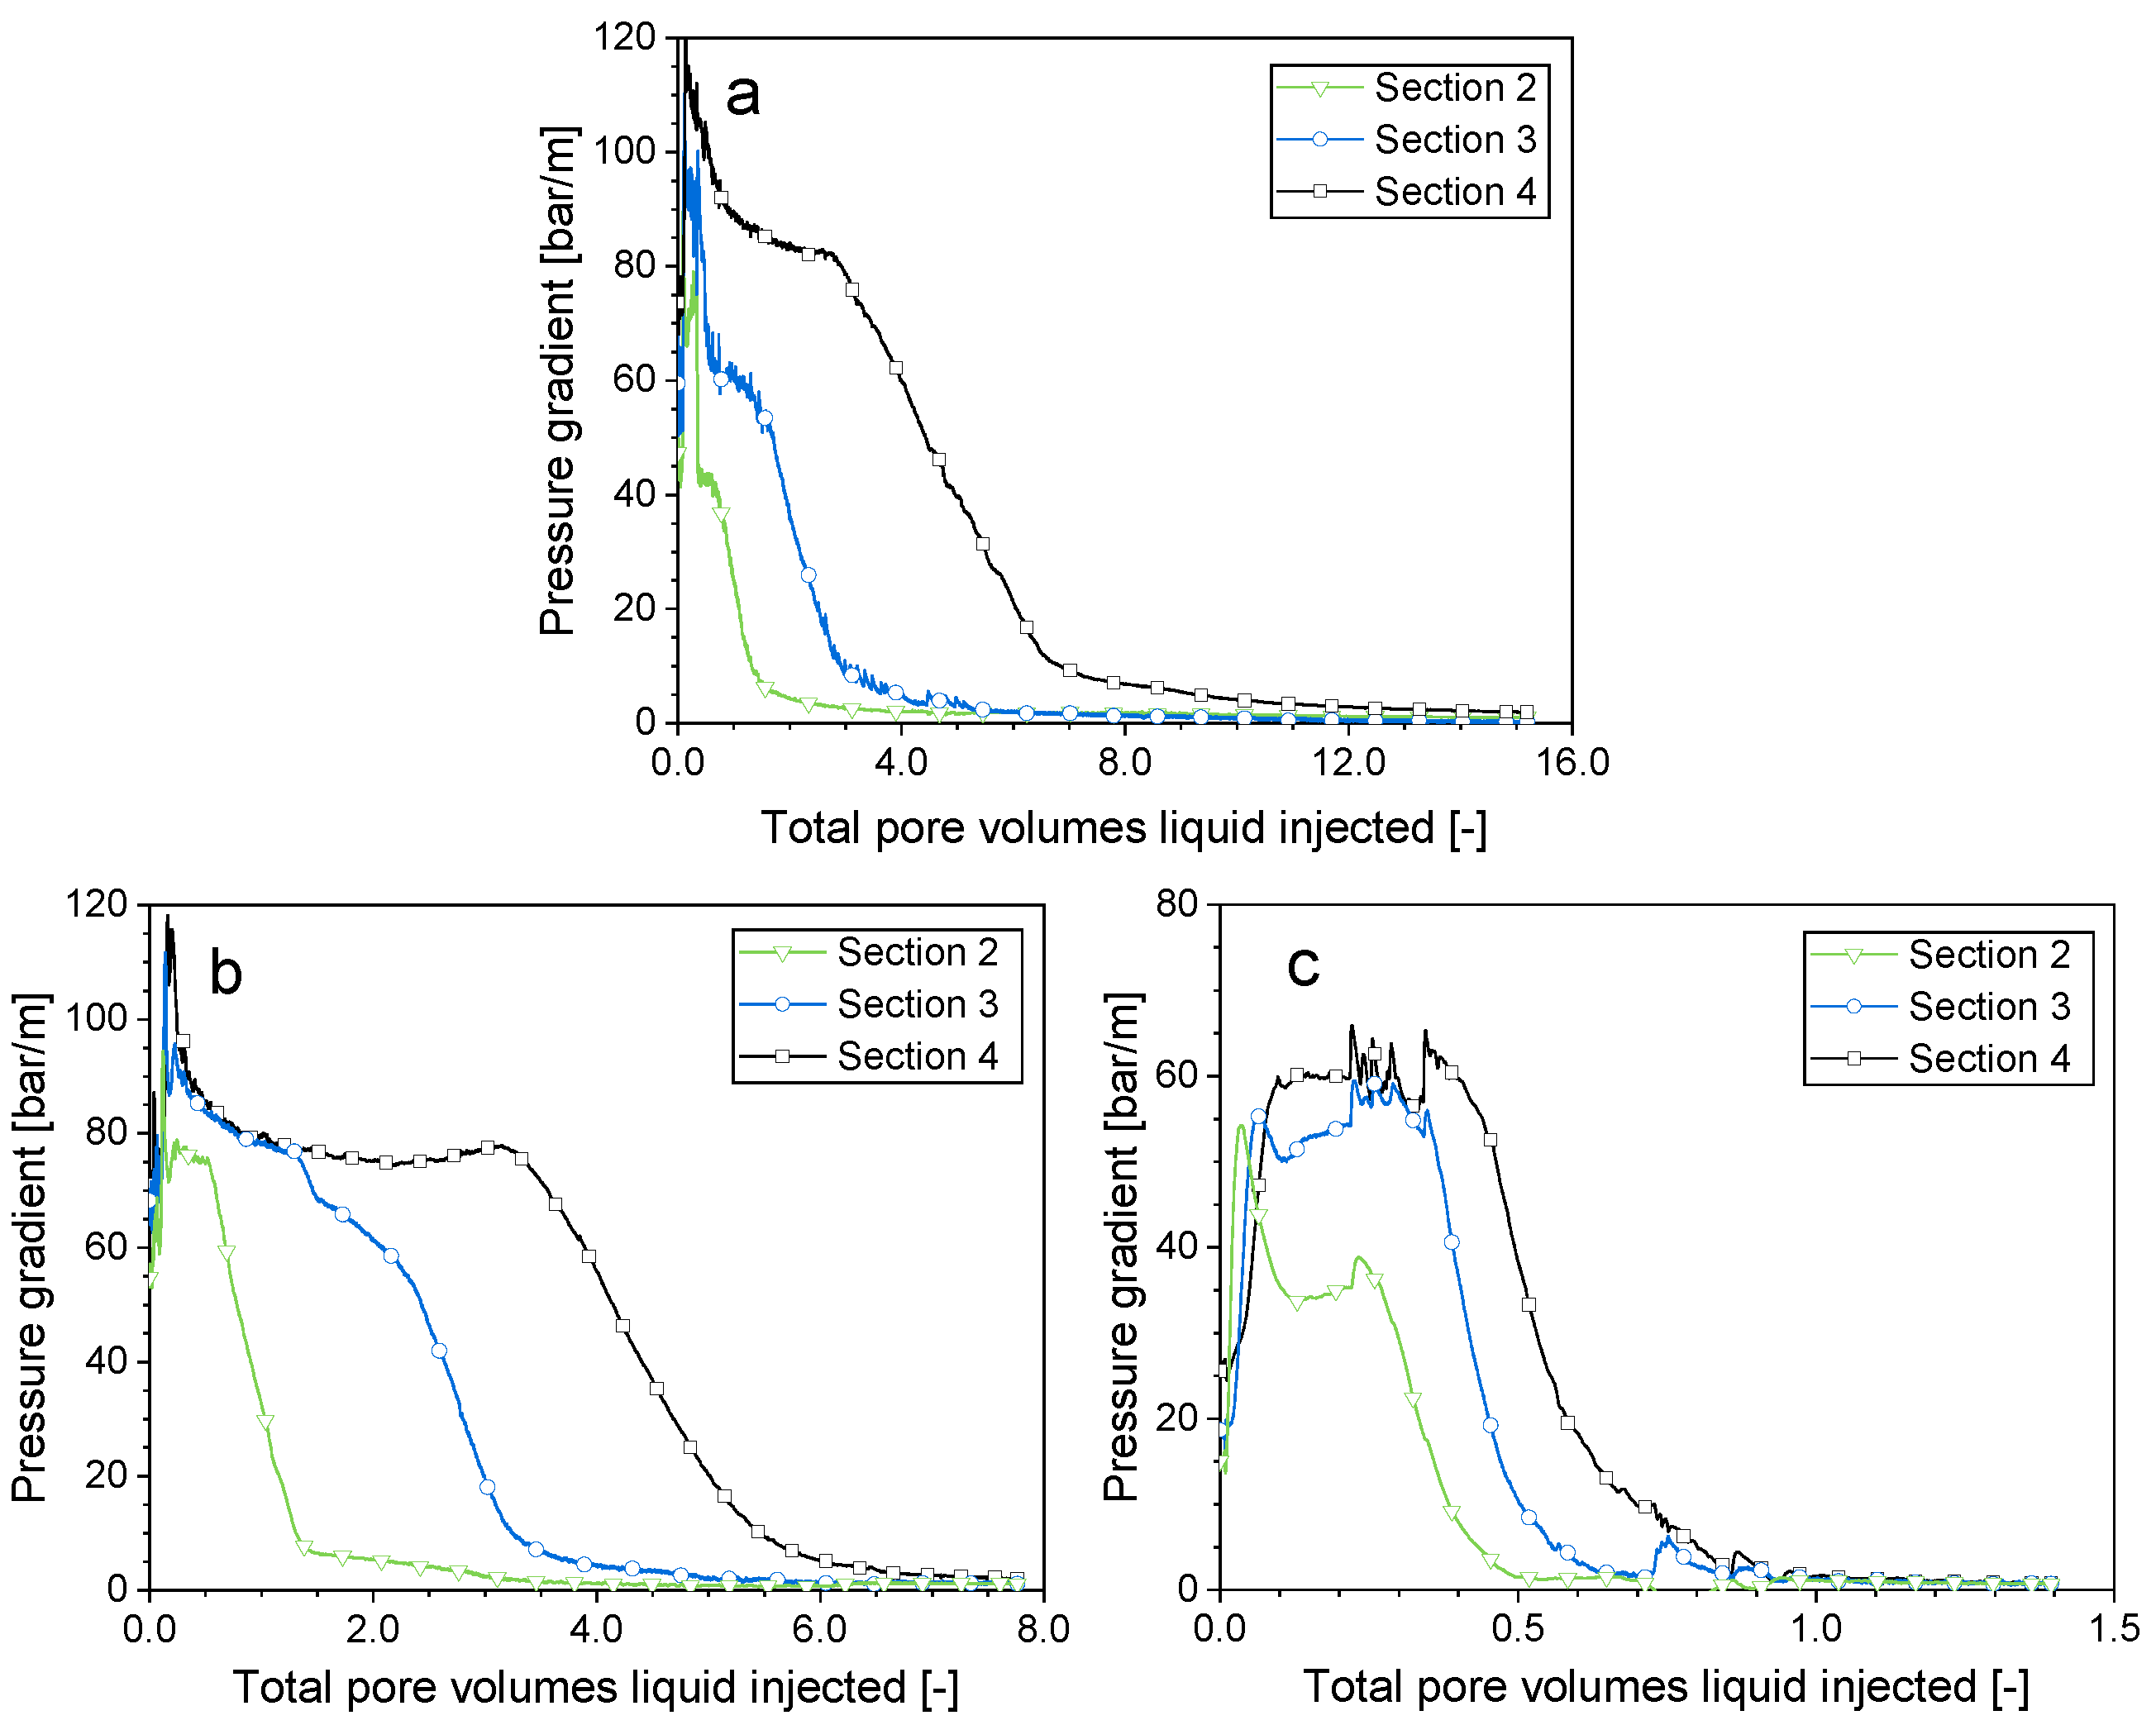
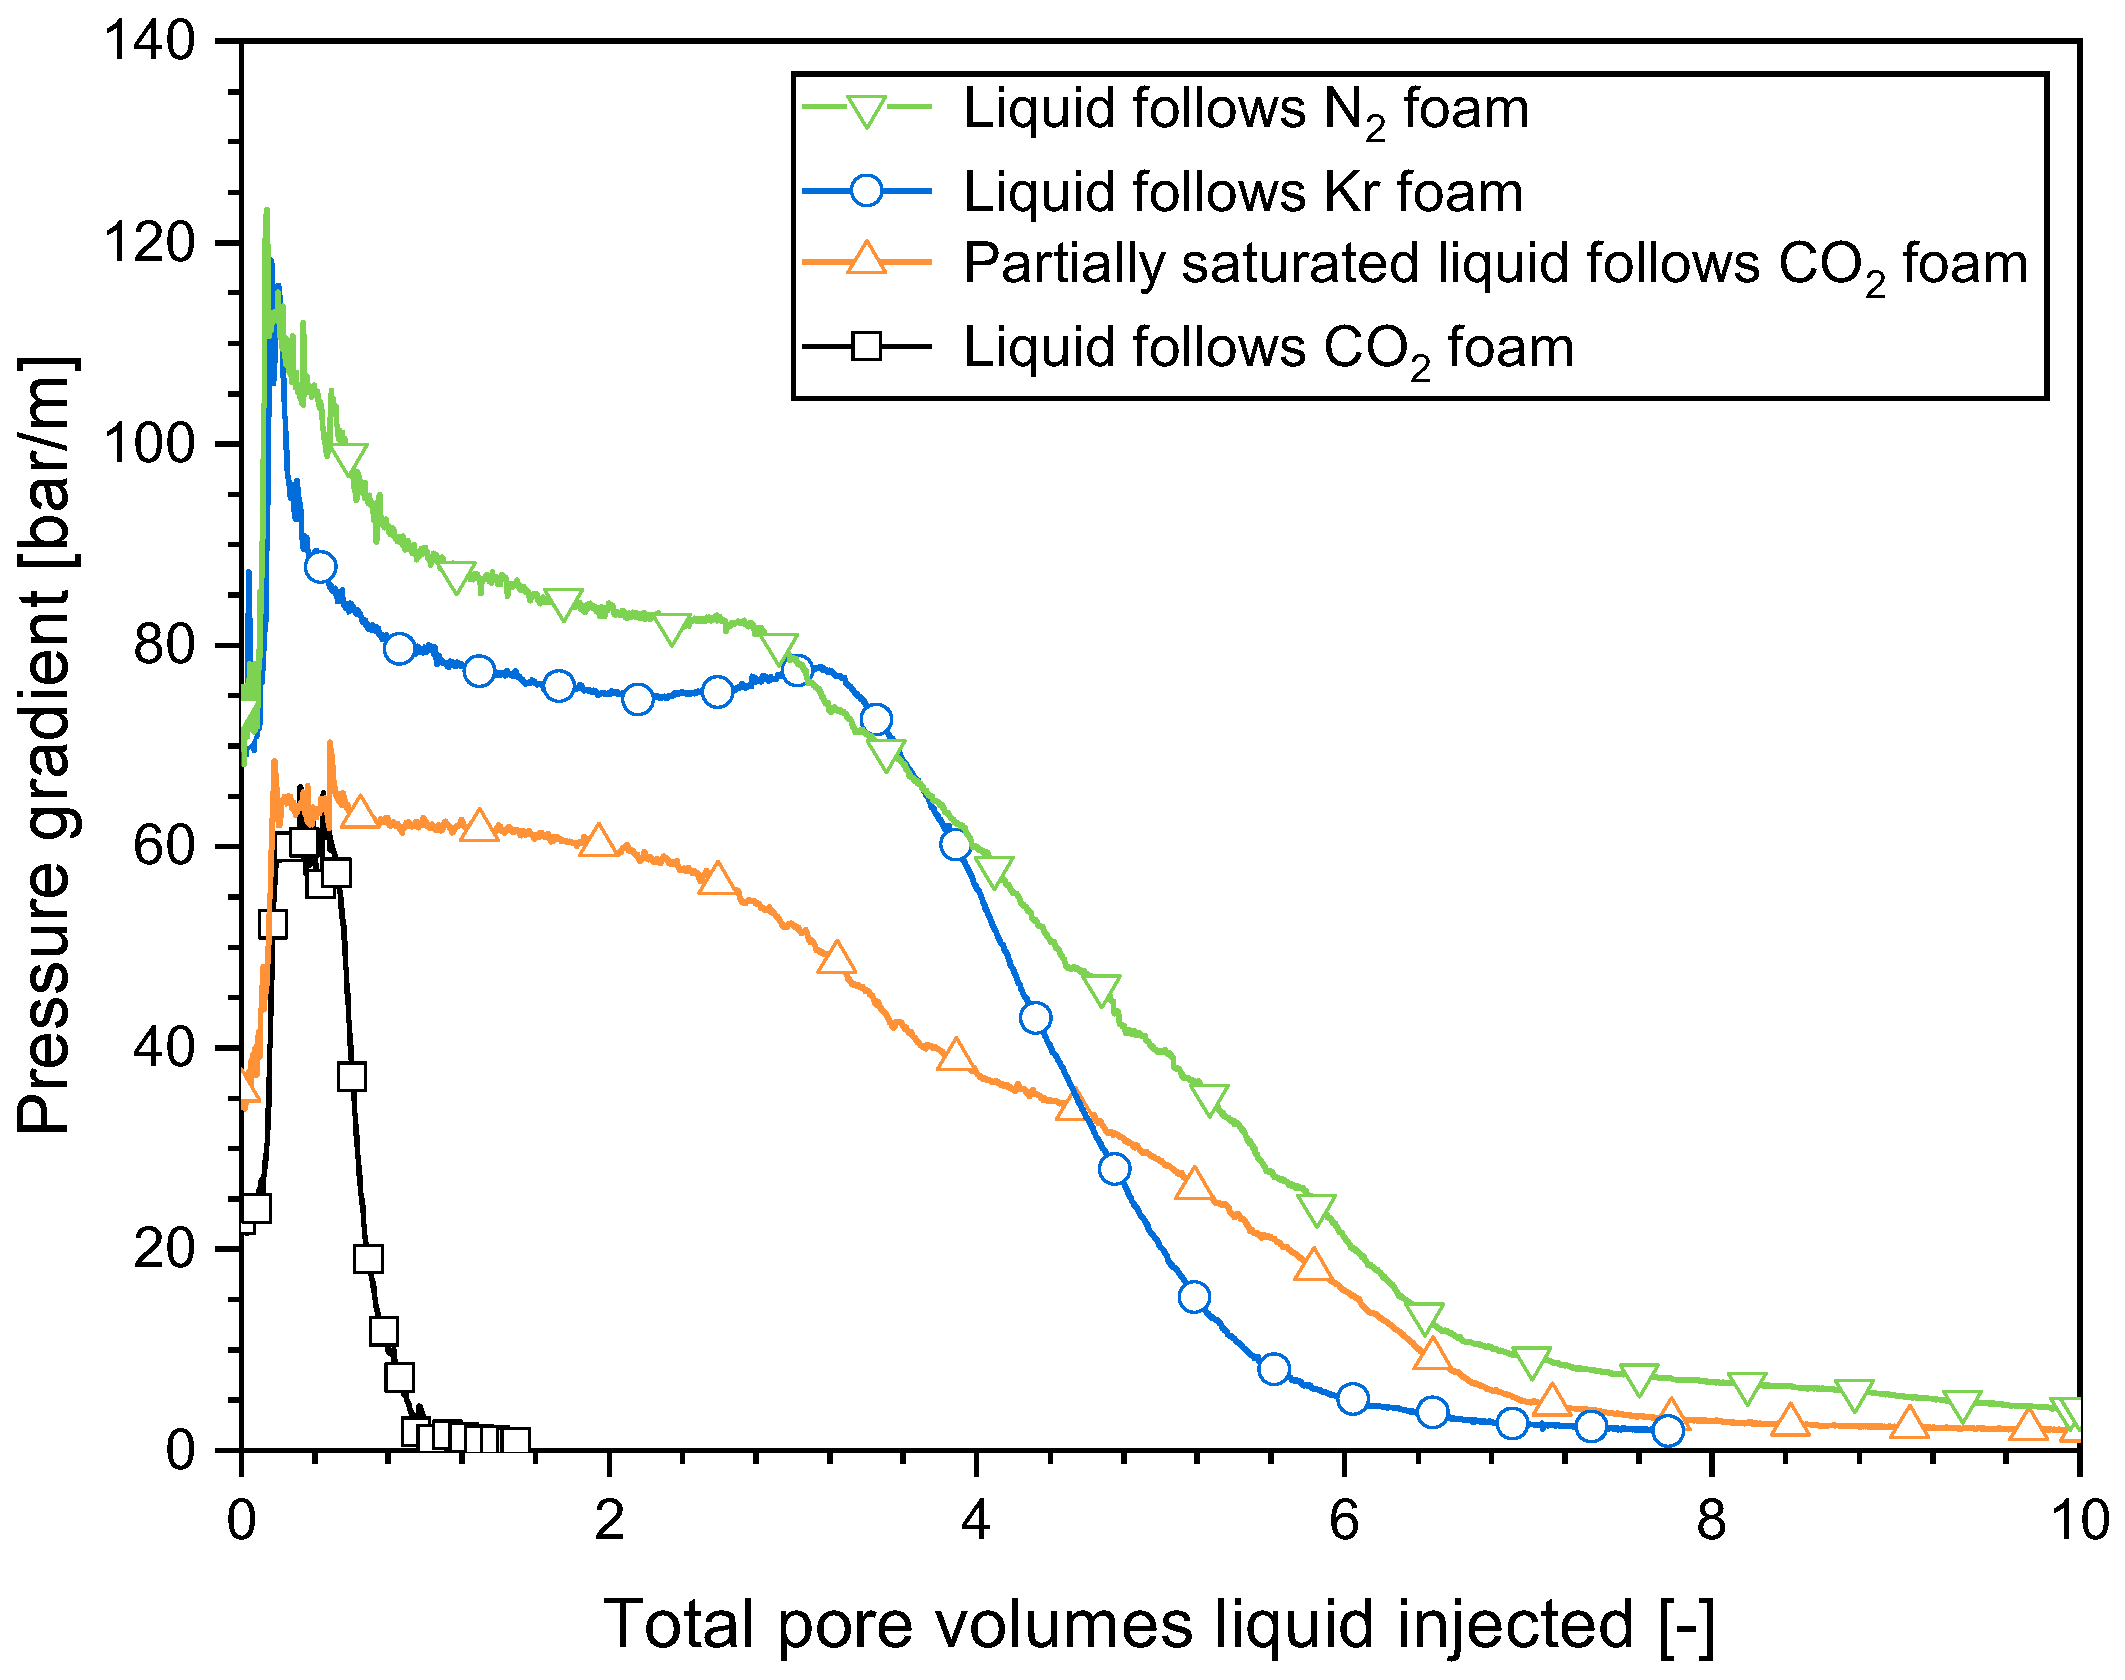
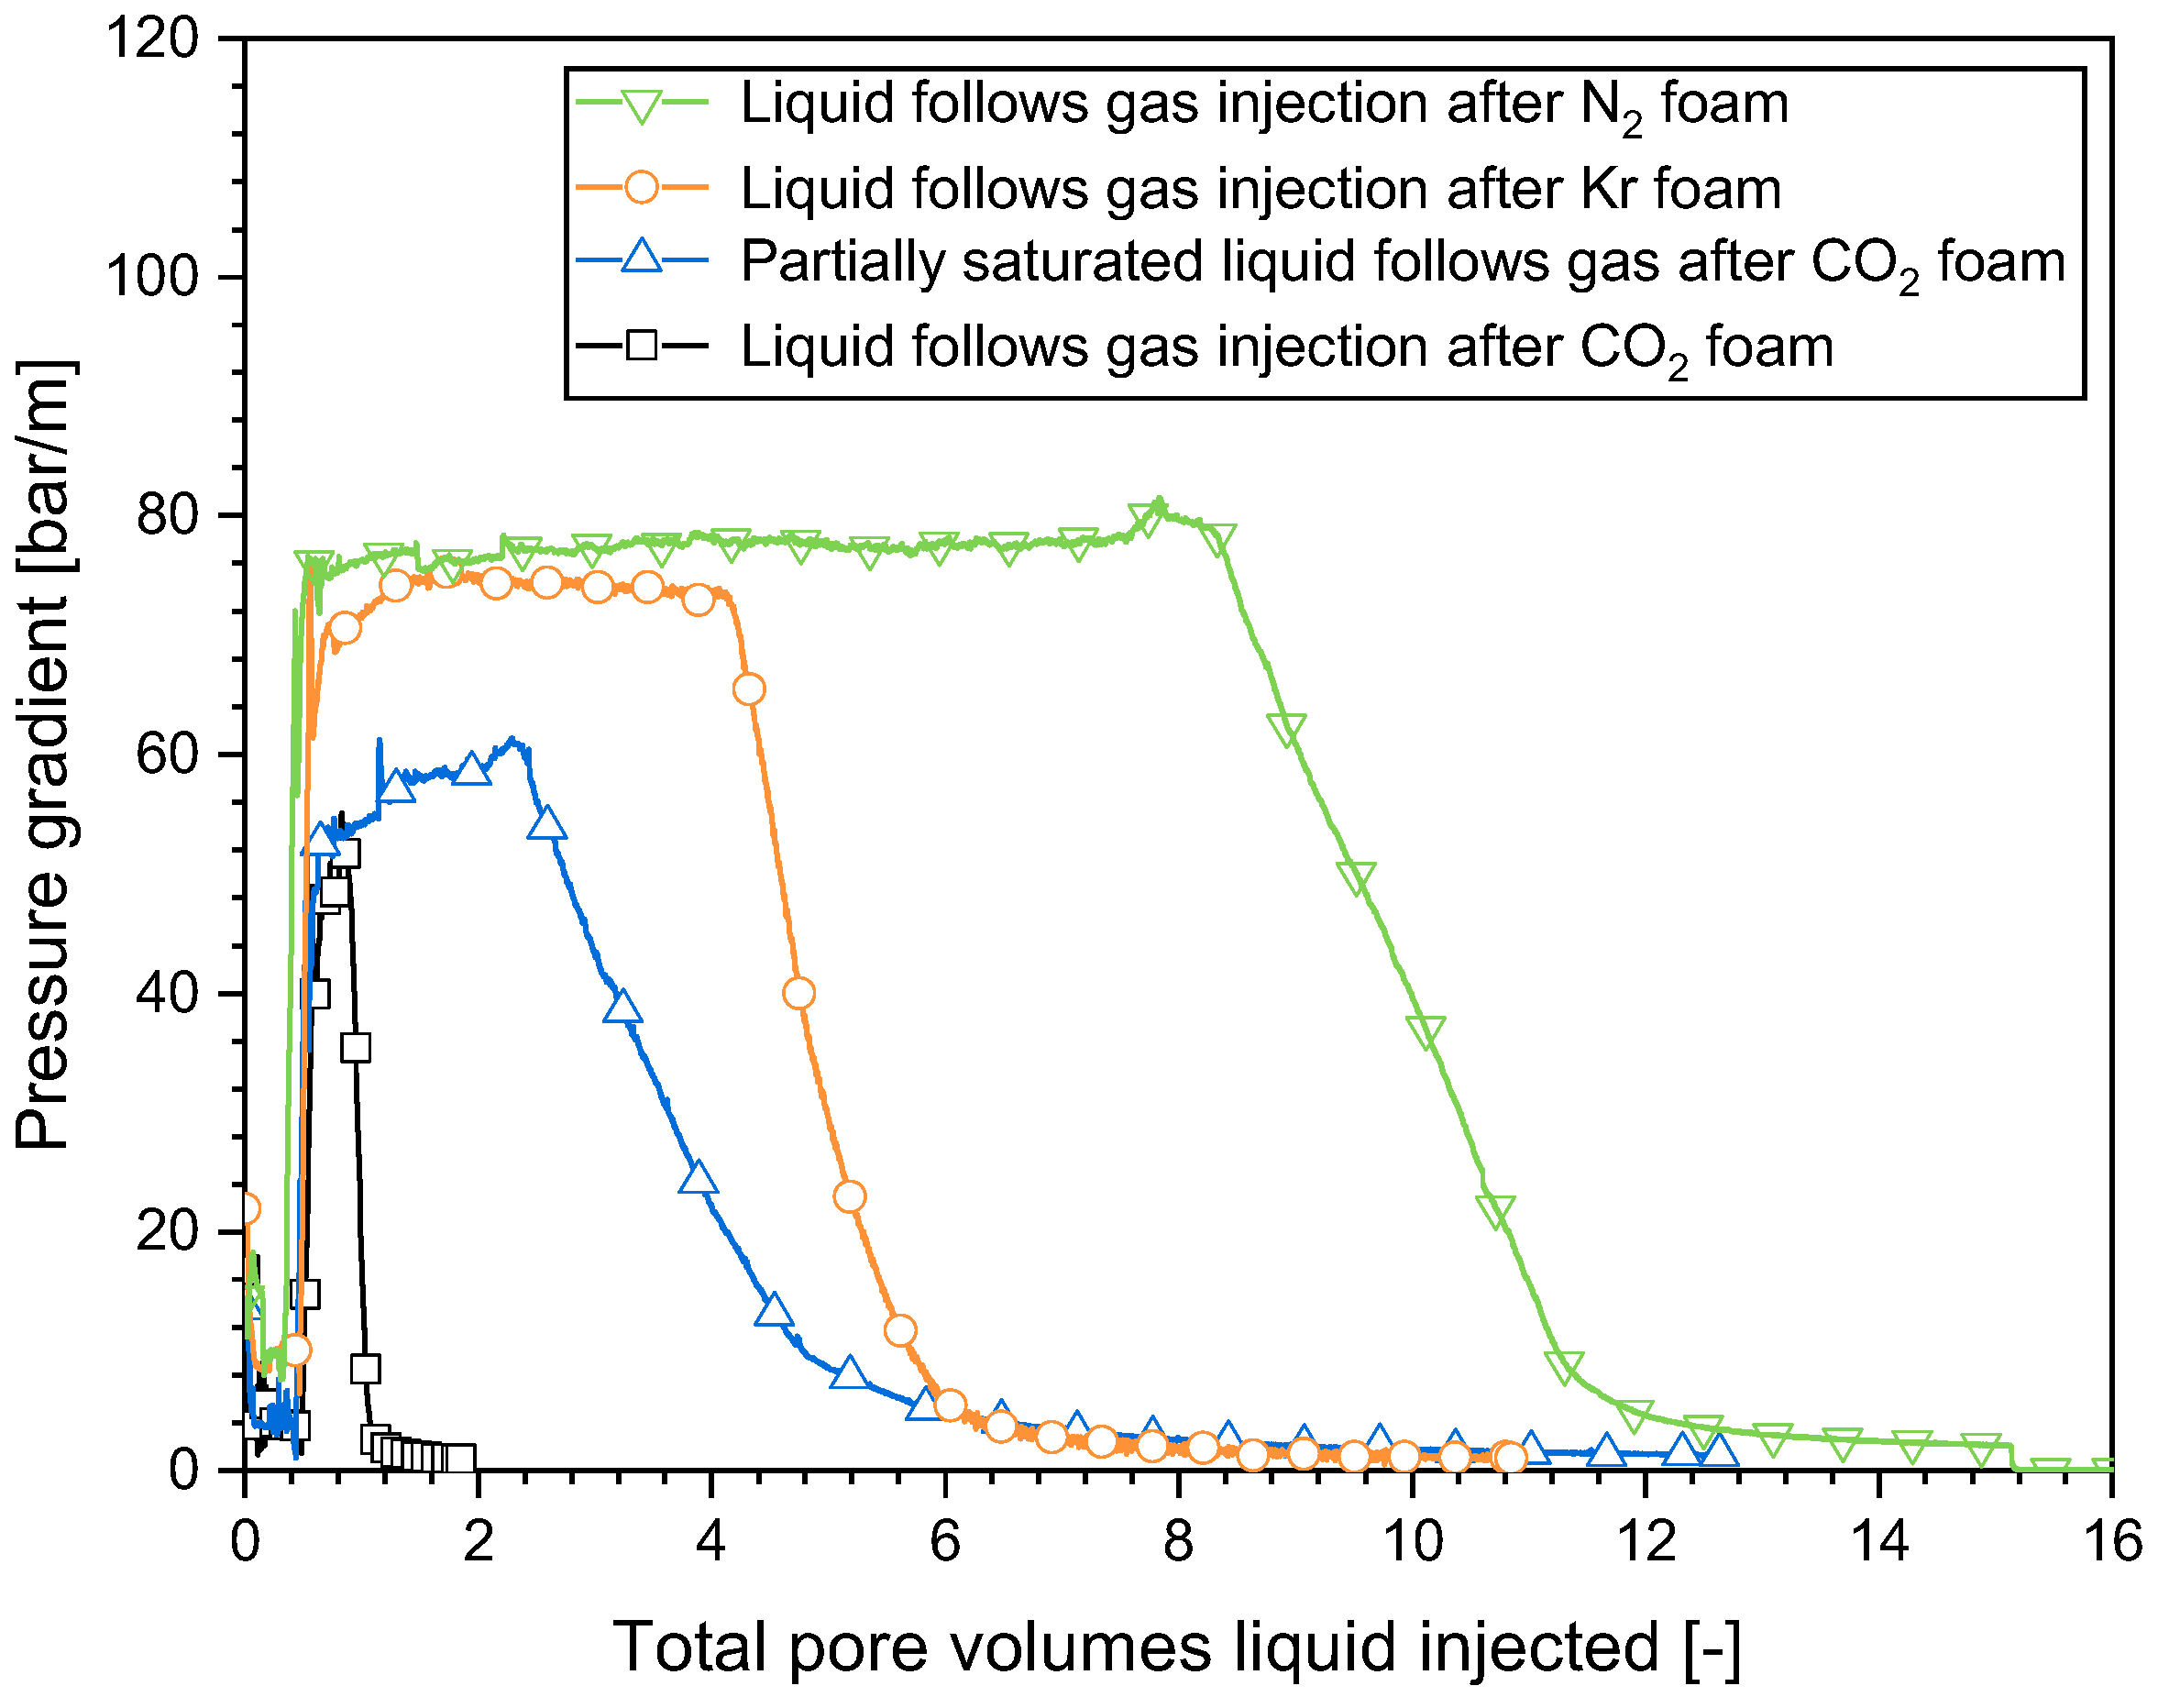
2.2. Impact of the Gas Composition on the Surfactant Solution Injectivity Directly Following Foam
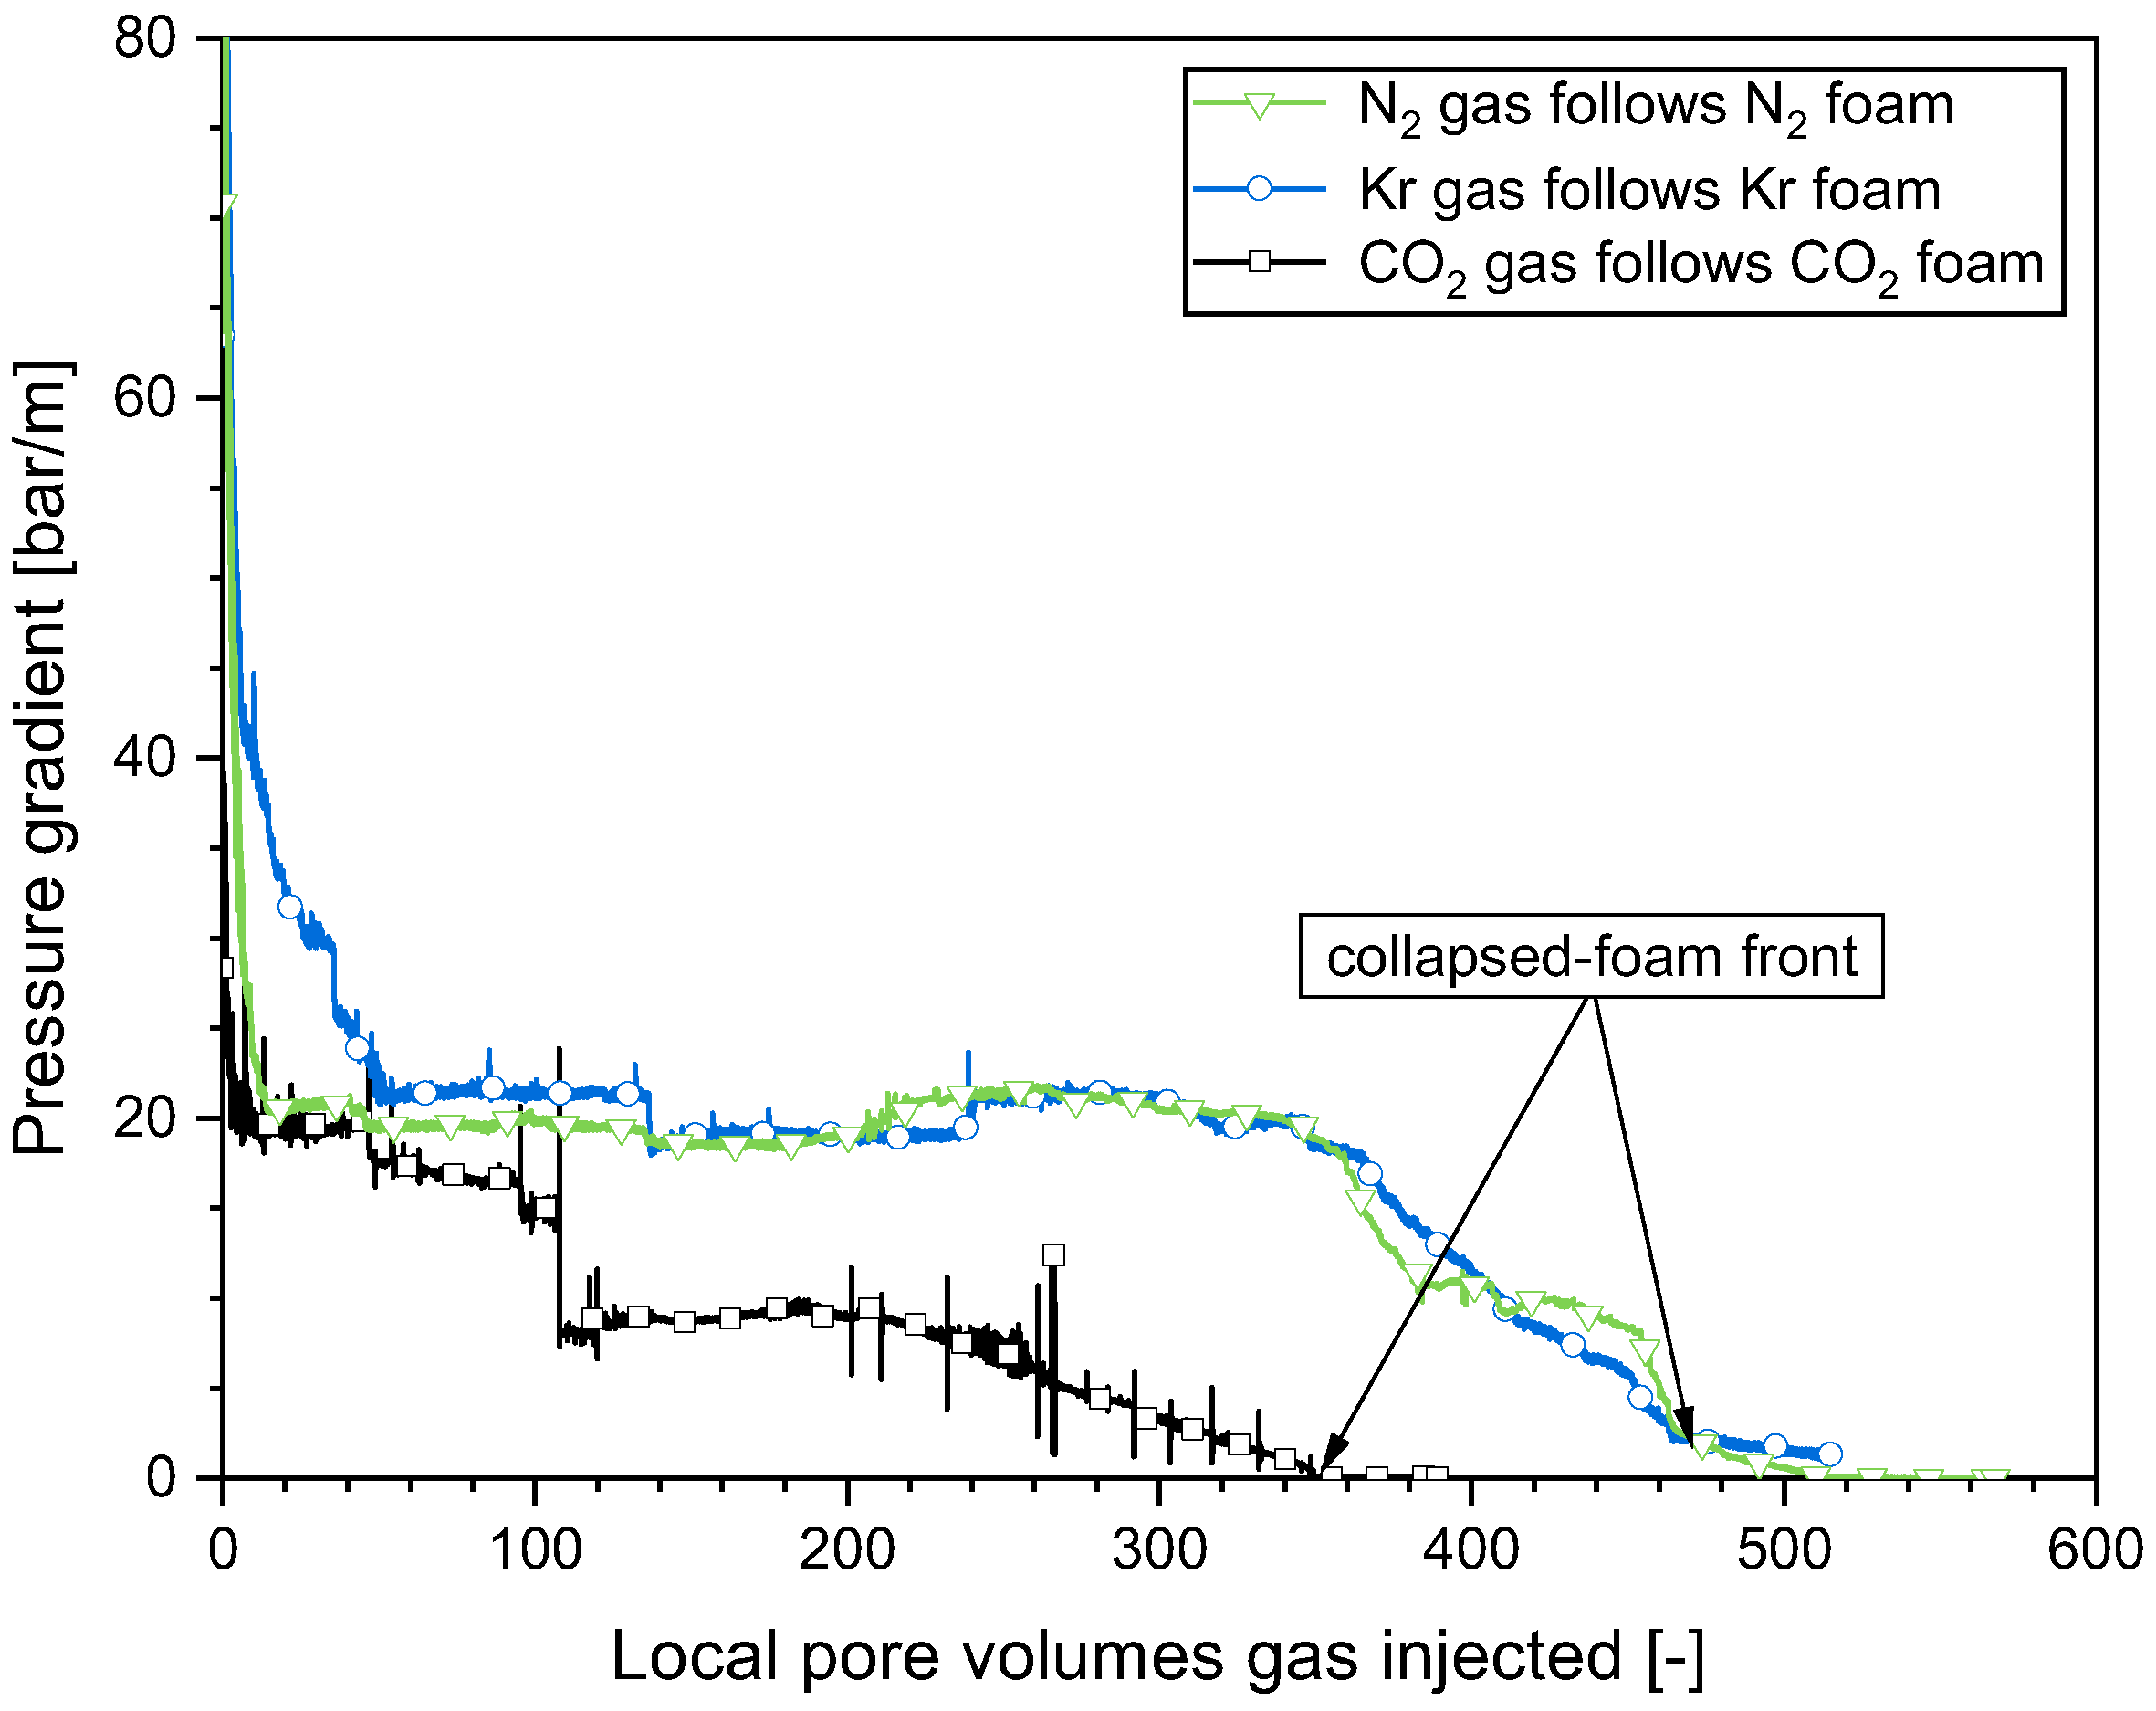
2.3. Impact of the Gas Composition on the Foam Collapse during Gas Injection
2.4. Impact of the Gas Composition on Surfactant Solution Injectivity in a SAG Foam Process
3. Materials and Methods
3.1. Experimental Materials and Apparatus
3.1.1. Materials
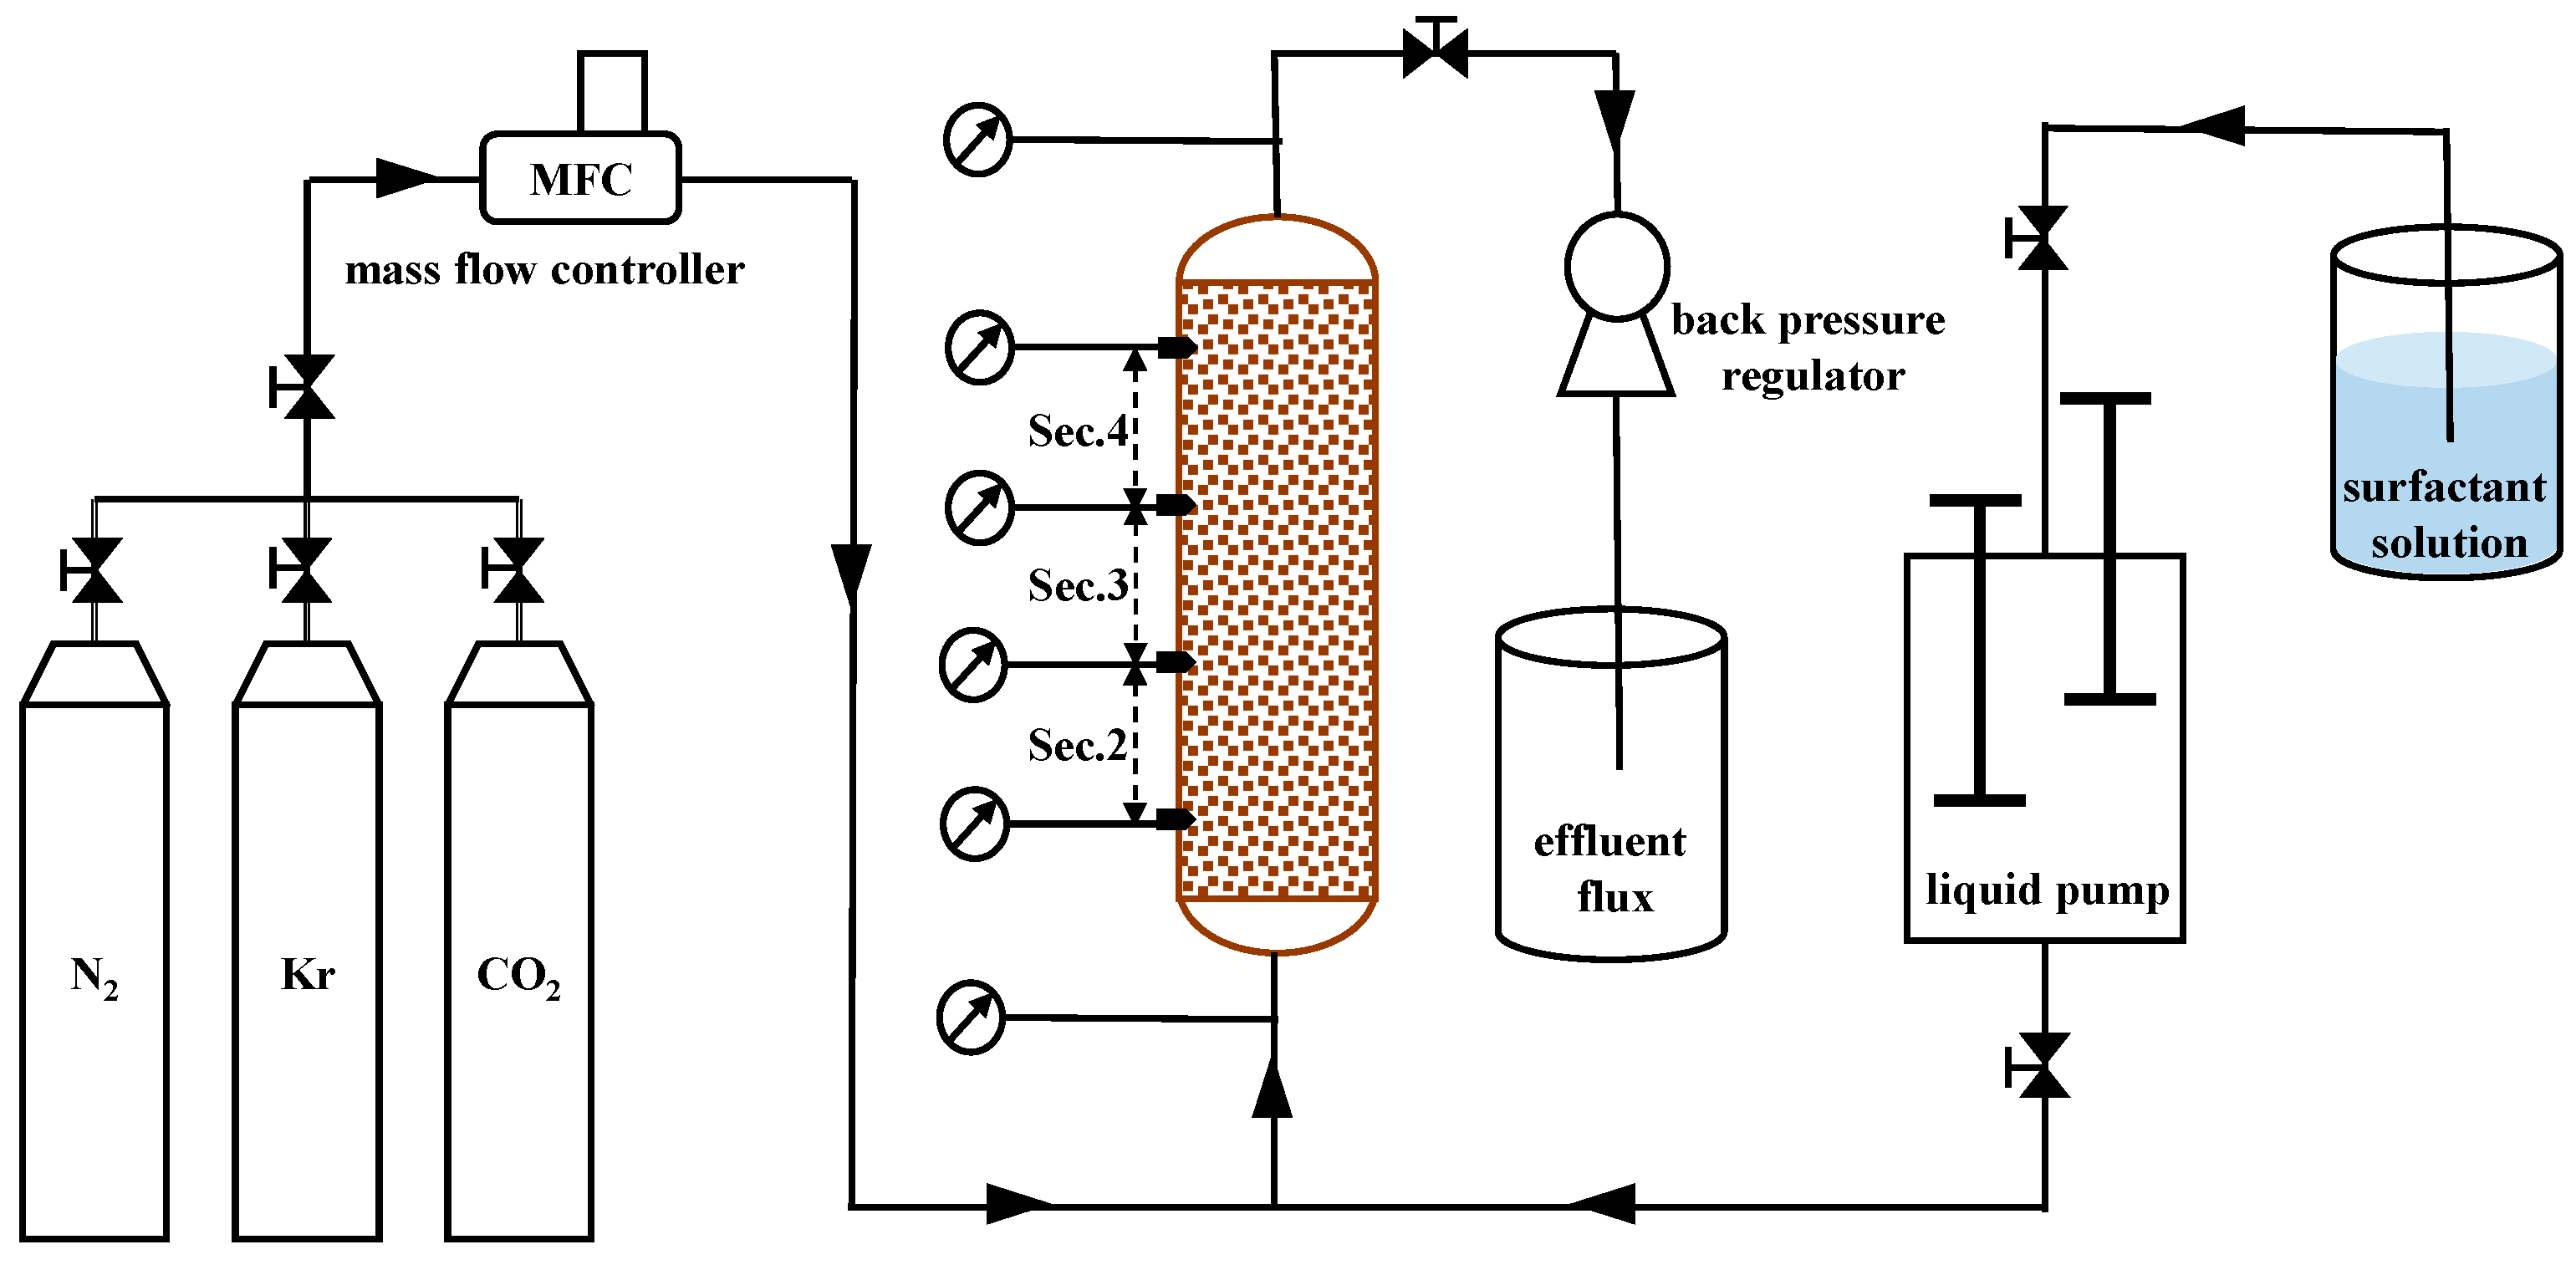
3.1.2. Apparatus
3.2. Experimental Method
4. Conclusions
- The strength of steady-steady foam was significantly influenced by the gas composition. In the high-quality regime, the apparent viscosities of N2 and Kr foam were close to each other and lower for CO2 foam.
- For all the gases tested, the flow pattern remained similar when the surfactant solution injection followed the foam injection. The initial surfactant solution injectivity was extremely poor. The pressure gradient plateau was heavily impacted by the initial strength of the foam. For stronger foam, the pressure gradient plateau during the surfactant solution injection was higher. The formation and evolution of liquid fingers, as well as the increase in surfactant solution injectivity, were primarily influenced by the solubility of gas in water. A higher gas solubility and a resulting greater gas dissolution capacity led to a faster decline in the pressure gradient (i.e., an increase in surfactant solution injectivity).
- The pattern of behavior observed during the gas injection in the SAG process was consistent for all the gases investigated in this study. The leading edge of the collapsed-foam zone advanced slowly from the entrance to the exit, resulting in a greater gas injectivity and a significant enhancement in subsequent surfactant solution injectivity. The velocity of the advancing front where the foam collapsed was dominated by the solubility of water in gas. The greater the water solubility in the gas, the swifter the advance of the collapsed-foam front.
- In a SAG process, surfactant solution injection involves the initial liquid filling of the collapsed-foam area produced by gas injection with a high level of mobility, and the subsequent penetration of the liquid through the weakened-foam area by fingering. This phenomenon occurred with all the gases studied here. Gas dissolution in the liquid was essential for the creation of liquid fingers and the increase in surfactant solution injectivity.
Author Contributions
Funding
Institutional Review Board Statement
Informed Consent Statement
Data Availability Statement
Acknowledgments
Conflicts of Interest
References
- Kovscek, A.R.; Radke, C.J. Fundamentals of foam transport in porous media. In Foams: Fundamentals and Applications in the Petroleum Industry; Schramm, L.L., Ed.; American Chemical Society: Washington, DC, USA, 1994; pp. 115–163. [Google Scholar]
- Sun, Q.; Li, Z.; Li, S.; Jiang, L.; Wang, J.; Wang, P. Utilization of surfactant-stabilized foam for enhanced oil recovery by adding nanoparticles. Energy Fuels 2014, 28, 2384–2394. [Google Scholar] [CrossRef]
- Atteia, O.; Estrada, E.D.C.; Bertin, H. Soil flushing: A review of the origin of efficiency variability. Rev. Environ. Sci. Bio/Technol. 2013, 12, 379–389. [Google Scholar] [CrossRef]
- Davarzani, H.; Aranda, R.; Colombano, S.; Laurent, F.; Bertin, H. Modeling and monitoring of foam propagation in highly permeable porous media under lateral water flow. Adv. Water Resour. 2022, 166, 104225. [Google Scholar] [CrossRef]
- Føyen, T.; Brattekås, B.; Fernø, M.A.; Barrabino, A.; Holt, T. Increased CO2 storage capacity using CO2-foam. Int. J. Greenh. Gas Control 2020, 96, 103016. [Google Scholar] [CrossRef]
- Sæle, A.; Graue, A.; Alcorn, Z.P. Unsteady-state CO2 foam injection for increasing enhanced oil recovery and carbon storage potential. Adv. Geo-Energy Res. 2022, 6, 472–481. [Google Scholar] [CrossRef]
- Mukherjee, J.; Nguyen, Q.P.; Scherlin, J.M.; Vanderwal, P.; Rozowski, R. CO2 foam pilot in Salt Creek Field, Natrona County, WY: Phase III: Analysis of pilot performance. In Proceedings of the SPE Improved Oil Recovery Conference, Tulsa, OK, USA, 11–13 April 2016. [Google Scholar]
- Skauge, A.; Aarra, M.G.; Surguchev, L.; Martinsen, H.A.; Rasmussen, L. Foam-assisted WAG: Experience from Snorre field. In Proceedings of the SPE/DOE Improved Oil Recovery Symposium, Tulsa, OK, USA, 13–17 April 2002. [Google Scholar]
- Stone, H.L. Vertical conformance in an alternating water miscible gas flood. In Proceedings of the SPE Annual Technical Conference and Exhibition, New Orleans, LA, USA, 26–29 September 1982. [Google Scholar]
- Farajzadeh, R.; Andrianov, A.; Zitha, P.L.J. Investigation of immiscible and miscible foam for enhancing oil recovery. Ind. Eng. Chem. Res. 2009, 49, 1910–1919. [Google Scholar] [CrossRef]
- de Paula, F.F.; Igreja, I.; Quinelato, T.; Chapiro, G. A numerical investigation into the influence of the surfactant injection technique on the foam flow in heterogeneous porous media. Adv. Water Resour. 2023, 171, 104358. [Google Scholar] [CrossRef]
- Kuehne, D.L.; Ehman, D.I.; Emanuel, A.S.; Magnani, C.F. Design and evaluation of a nitrogen-foam field trial. J. Pet. Technol. 1990, 42, 504–512. [Google Scholar] [CrossRef]
- Martinsen, H.A.; Vassenden, F. Foam-assisted water alternating gas (FAWAG) process on Snorre. In Proceedings of the European IOR Symposium, Brighton, UK, 18–20 August 1999. [Google Scholar]
- Awan, A.R.; Teigland, R.; Kleppe, J. A survey of North Sea enhanced-oil-recovery projects initiated during the Years 1975 to 2005. SPE Res. Eval. Eng. 2008, 11, 497–512. [Google Scholar] [CrossRef]
- Rossen, W.R.; Farajzadeh, R.; Hirasaki, G.J.; Amirmoshiri, M. Potential and challenges of foam-assisted CO2 sequestration. In Proceedings of the SPE Improved Oil Recovery Conference, Tulsa, OK, USA, 25–29 April 2022. [Google Scholar]
- Gong, J.; Vincent Bonnieu, S.; Kamarul Bahrim, R.Z.; Che Mamat, C.A.N.B.; Tewari, R.D.; Groenenboom, J.; Farajzadeh, R.; Rossen, W.R. Modelling of liquid injectivity in surfactant-alternating-gas foam enhanced oil recovery. SPE J. 2019, 24, 1123–1138. [Google Scholar] [CrossRef]
- Gong, J.; Vincent Bonnieu, S.; Kamarul Bahrim, R.Z.; Che Mamat, C.A.N.B.; Tewari, R.D.; Mahamad Amir, M.I.; Groenenboom, J.; Farajzadeh, R.; Rossen, W.R. Injectivity of multiple gas and liquid slugs in SAG foam EOR: A CT scan study. SPE J. 2020, 25, 895–906. [Google Scholar] [CrossRef]
- Aarra, M.G.; Ormehaug, P.A.; Skauge, A.; Masalmeh, S.K. Experimental study of CO2-and methane-foam using carbonate core material at reservoir conditions. In Proceedings of the SPE Middle East Oil and Gas Show and Conference, Manama, Bahrain, 25–28 September 2011. [Google Scholar]
- Pang, Z.; Liu, H.; Zhu, L. A laboratory study of enhancing heavy oil recovery with steam flooding by adding nitrogen foams. J. Pet. Sci. Eng. 2015, 128, 184–193. [Google Scholar] [CrossRef]
- Wang, J.; Liu, H.; Ning, Z.; Zhang, H. Experimental research and quantitative characterization of nitrogen foam blocking characteristics. Energy Fuels 2012, 26, 5152–5163. [Google Scholar] [CrossRef]
- Khatib, Z.I.; Hirasaki, G.J.; Falls, A.H. Effects of capillary pressure on coalescence and phase mobilities in foams flowing through porous media. SPE Reserv. Eng. 1988, 3, 919–926. [Google Scholar] [CrossRef]
- Osterloh, W.T.; Jante, M.J. Effects of gas and liquid velocity on steady-state foam flow at high temperature. In Proceedings of the SPE/DOE Enhanced Oil Recovery Symposium, Tulsa, OK, USA, 22–24 April 1992. [Google Scholar]
- Alvarez, J.M.; Rivas, H.; Rossen, W.R. A unified model for steady-state foam behavior at high and low foam qualities. SPE J. 2001, 6, 325–333. [Google Scholar] [CrossRef]
- Sander, R. Compilation of Henry’s law constants (version 4.0) for water as solvent. Atmos. Chem. Phys. 2015, 15, 4399–4981. [Google Scholar] [CrossRef]
- Duan, Z.; Sun, R.; Zhu, C.; Chou, I. An improved model for the calculation of CO2 solubility in aqueous solutions containing Na+, K+, Ca2+, Mg2+, Cl−, and SO42−. Mar. Chem. 2006, 98, 131–139. [Google Scholar] [CrossRef]
- Falls, A.; Hirasaki, G.; Patzek, T.W.; Gauglitz, D.A.; Miller, D.D.; Ratulowski, T. Development of a mechanistic foam simulator: The population balance and generation by snap-off. SPE Reserv. Eval. Eng. 1988, 3, 884–892. [Google Scholar] [CrossRef]
- Ziabakhsh-Ganji, Z.; Kooi, H. An Equation of State for thermodynamic equilibrium of gas mixtures and brines to allow simulation of the effects of impurities in subsurface CO2 storage. Int. J. Greenh. Gas Control 2012, 11, S21–S34. [Google Scholar] [CrossRef]
- Apaydin, O.G.; Kovscek, A.R. Surfactant concentration and end effects on foam flow in porous media. Transp. Porous Media 2001, 43, 511–536. [Google Scholar] [CrossRef]


| Gas | Solubility (mol/kg H2O) |
|---|---|
| N2 | 0.01 |
| Kr | 0.03 |
| CO2 | 0.37 |
Disclaimer/Publisher’s Note: The statements, opinions and data contained in all publications are solely those of the individual author(s) and contributor(s) and not of MDPI and/or the editor(s). MDPI and/or the editor(s) disclaim responsibility for any injury to people or property resulting from any ideas, methods, instructions or products referred to in the content. |
© 2023 by the authors. Licensee MDPI, Basel, Switzerland. This article is an open access article distributed under the terms and conditions of the Creative Commons Attribution (CC BY) license (https://creativecommons.org/licenses/by/4.0/).
Share and Cite
Gong, J.; Wang, Y.; Tewari, R.D.; Kamarul Bahrim, R.-Z.B.; Rossen, W. Effect of Gas Composition on Surfactant Injectivity in a Surfactant-Alternating-Gas Foam Process. Molecules 2024, 29, 100. https://doi.org/10.3390/molecules29010100
Gong J, Wang Y, Tewari RD, Kamarul Bahrim R-ZB, Rossen W. Effect of Gas Composition on Surfactant Injectivity in a Surfactant-Alternating-Gas Foam Process. Molecules. 2024; 29(1):100. https://doi.org/10.3390/molecules29010100
Chicago/Turabian StyleGong, Jiakun, Yuan Wang, Raj Deo Tewari, Ridhwan-Zhafri B. Kamarul Bahrim, and William Rossen. 2024. "Effect of Gas Composition on Surfactant Injectivity in a Surfactant-Alternating-Gas Foam Process" Molecules 29, no. 1: 100. https://doi.org/10.3390/molecules29010100
APA StyleGong, J., Wang, Y., Tewari, R. D., Kamarul Bahrim, R.-Z. B., & Rossen, W. (2024). Effect of Gas Composition on Surfactant Injectivity in a Surfactant-Alternating-Gas Foam Process. Molecules, 29(1), 100. https://doi.org/10.3390/molecules29010100