Article

Hexamethyldisiloxane Removal from Biogas Using a Fe3O4–Urea-Modified Three-Dimensional Graphene Aerogel

1
Hebei Key Laboratory of Inorganic Nano-Materials, College of Chemistry and Material Sciences, Hebei Normal University, Shijiazhuang 050024, China
2
Hebei Key Laboratory of Animal Physiology, Biochemistry and Molecular Biology, College of Life Sciences, Hebei Normal University, Shijiazhuang 050024, China
3
College of Chemical Technology, Shijiazhuang University, Shijiazhuang 050035, China
*
Authors to whom correspondence should be addressed.
Molecules 2023, 28(18), 6622; https://doi.org/10.3390/molecules28186622
Submission received: 2 August 2023 / Revised: 6 September 2023 / Accepted: 12 September 2023 / Published: 14 September 2023
(This article belongs to the Special Issue Porous Organic Materials: Design and Applications)

Abstract

:
Volatile methyl siloxanes (VMS), which are considered to be the most troublesome impurities in current biogas-cleaning technologies, need to be removed. In this study, we fabricated a series of Fe3O4–urea-modified reduced graphene-oxide aerogels (Fe3O4–urea–rGOAs) by using industrial-grade graphene oxide as the raw material. A fixed-bed dynamic adsorption setup was built, and the adsorption properties of the Fe3O4–urea–rGOAs for hexamethyldisiloxane (L2, as a VMS model pollutant) were studied. The properties of the as-prepared samples were investigated by employing various characterization techniques (SEM, TEM, FTIR, XRD, Raman spectroscopy, and N2 adsorption/desorption techniques). The results showed that the Fe3O4–urea–rGOA–0.4 had a high specific surface area (188 m2 g−1), large porous texture (0.77 cm3 g−1), and the theoretical maximum adsorption capacity for L2 (146.5 mg g−1). The adsorption capacity considerably increased with a decrease in the bed temperature of the adsorbents, as well as with an increase in the inlet concentration of L2. More importantly, the spent Fe3O4–urea–rGOA adsorbent could be readily regenerated and showed an excellent adsorption performance. Thus, the proposed Fe3O4–urea–rGOAs are promising adsorbents for removing the VMS in biogas.

1. Introduction

Biogas produced via the anaerobic digestion of organic matter in landfill and sewage plants is a promising alternative to fossil-fuel-based energy [1]. The primary components of biogas are 50–70% CH4 and 30–50% CO2, and the minor components consist of NH3, H2S, halogenated compounds, and volatile methyl siloxanes (VMS) [2,3,4]; in particular, VMSs are considered to be the most troublesome in current biogas-cleaning and -upgrading technologies [5]. In recent years, however, VMSs have become widespread in different types of biogas due to the extensive use of polydimethicone in the formulation of personal care products, industrial lubricants, glues, paints, and detergents [6]. The presence of VMSs will decrease the practical applicability of biogas; this occurs because they will be converted into microcrystalline silica during combustion, thus damaging engine devices (i.e., pistons, cylinders, and valves) and inhibiting heat conduction as well as lubrication [6,7]. Thus, the VMS must be removed from biogas prior to use.
Cryogenic condensation, biological technology, catalytic processes, membrane separation, absorption, and adsorption are the most common approaches used to remove the VMS from biogas [6,7,8,9,10,11,12,13,14]. Among the reported methods for the removal of VMS, adsorption has been found to be one of the most effective due to its high efficiency, facile operation, and strong economic feasibility [15,16]. Several adsorbents have been commercially used or explored under development, including activated carbons, silica gels, alumina, molecular sieves, and polymer resins, etc. [12,17,18,19,20,21,22]. While these adsorbents have many attractive properties, such as being simple to use, a high adsorption capacity, and a low cost, their poor cycle performances have limited their commercial applications [23]. Therefore, the exploration of novel material materials as VMS adsorbents with a high adsorption potential and excellent recycling performance is quite necessary.
A reduced graphene oxide aerogel (rGOA) with a three-dimensional porous network structure is formed by the cross-linked stacking of graphene sheets. Zheng et al. [24,25] prepared a series of micro/narrow mesoporous reduced graphene oxide aerogels under hydrothermal conditions by using VC and amine as reducing agents. These aerogels exhibited a good adsorption performance for L2, as well as an excellent cycling stability [24,25]; however, the increase in the specific surface area of the rGOA and the regulation of the pore size were restricted. Therefore, finding new ways of improving the texture properties of rGOAs has continued to attract attention. Recently, many researchers have revealed that a metal oxide-modified rGOA can exhibit good texture features (such as porosity and specific surface area) due to the synergistic effect between the interconnected three-dimensional pores of the rGOA and the rich porous structure of the metal oxide [26,27]. Fe3O4 has become an ideal metal oxide for the preparation of a modified rGOA due to its advantages of being widely sourced, environmentally friendly, and low cost [28]. Li et al. [29] prepared Fe3O4–rGOA via a one-step chemical reduction method, making the microwave absorption performance of the composite material significantly higher than that of Fe3O4 and reduced graphene alone. Vinoshkumar et al. [30] prepared Fe3O4–rGOA via a hydrothermal method, which is an effective photocatalytic material and has good degradation activity for methylene blue dyes. As of now, the aerogels based on reduced graphene oxide reported in the literature are applied in many fields, such as catalysis [31], conduction [32], gas purification [33,34], electromagnetic wave absorbing [35,36,37], and the adsorption of dyes in water [29,30]. Remarkably, we provide a new aerogel modification method for the removal of VMS. Based on the urea reduced graphene oxide aerogel prepared by Zheng et al. [24], we introduced Fe3O4 in order to obtain a larger specific surface area and more suitable pore structure for L2 adsorption. According to the structure–activity relationship, the adsorption mechanism was further explored.
To identify the good adsorption performance of Fe3O4–urea–rGOA for VMS, a series of Fe3O4–urea–rGOAs was produced with industrial-grade graphene oxide (IGGO) as the raw material, Fe(NO3)3·9H2O as the metal oxide precursor, and urea as the reducing agent via a one-step hydrothermal method. The synthesized samples were evaluated through dynamic breakthrough experiments with highly volatile hexamethyldisiloxane (L2) as a model pollutant. Based on SEM, TEM, XRD, BET, FTIR, and Raman characterization, the relationship between the structure and adsorption properties of the Fe3O4–urea–rGOA was revealed, and the mechanism of the self-assembly of the graphene sheets/Fe3O4 induced by Fe3+ was clarified. Furthermore, the influential factors on the adsorption capacity were investigated, and adsorption–desorption tests were also carried out on the best Fe3O4–urea–rGOA adsorbent. The fabricated Fe3O4–urea–rGOAs showed high hydrophobicity and textural properties, indicating that they have great potential for VMS removal.

2. Results and Discussion

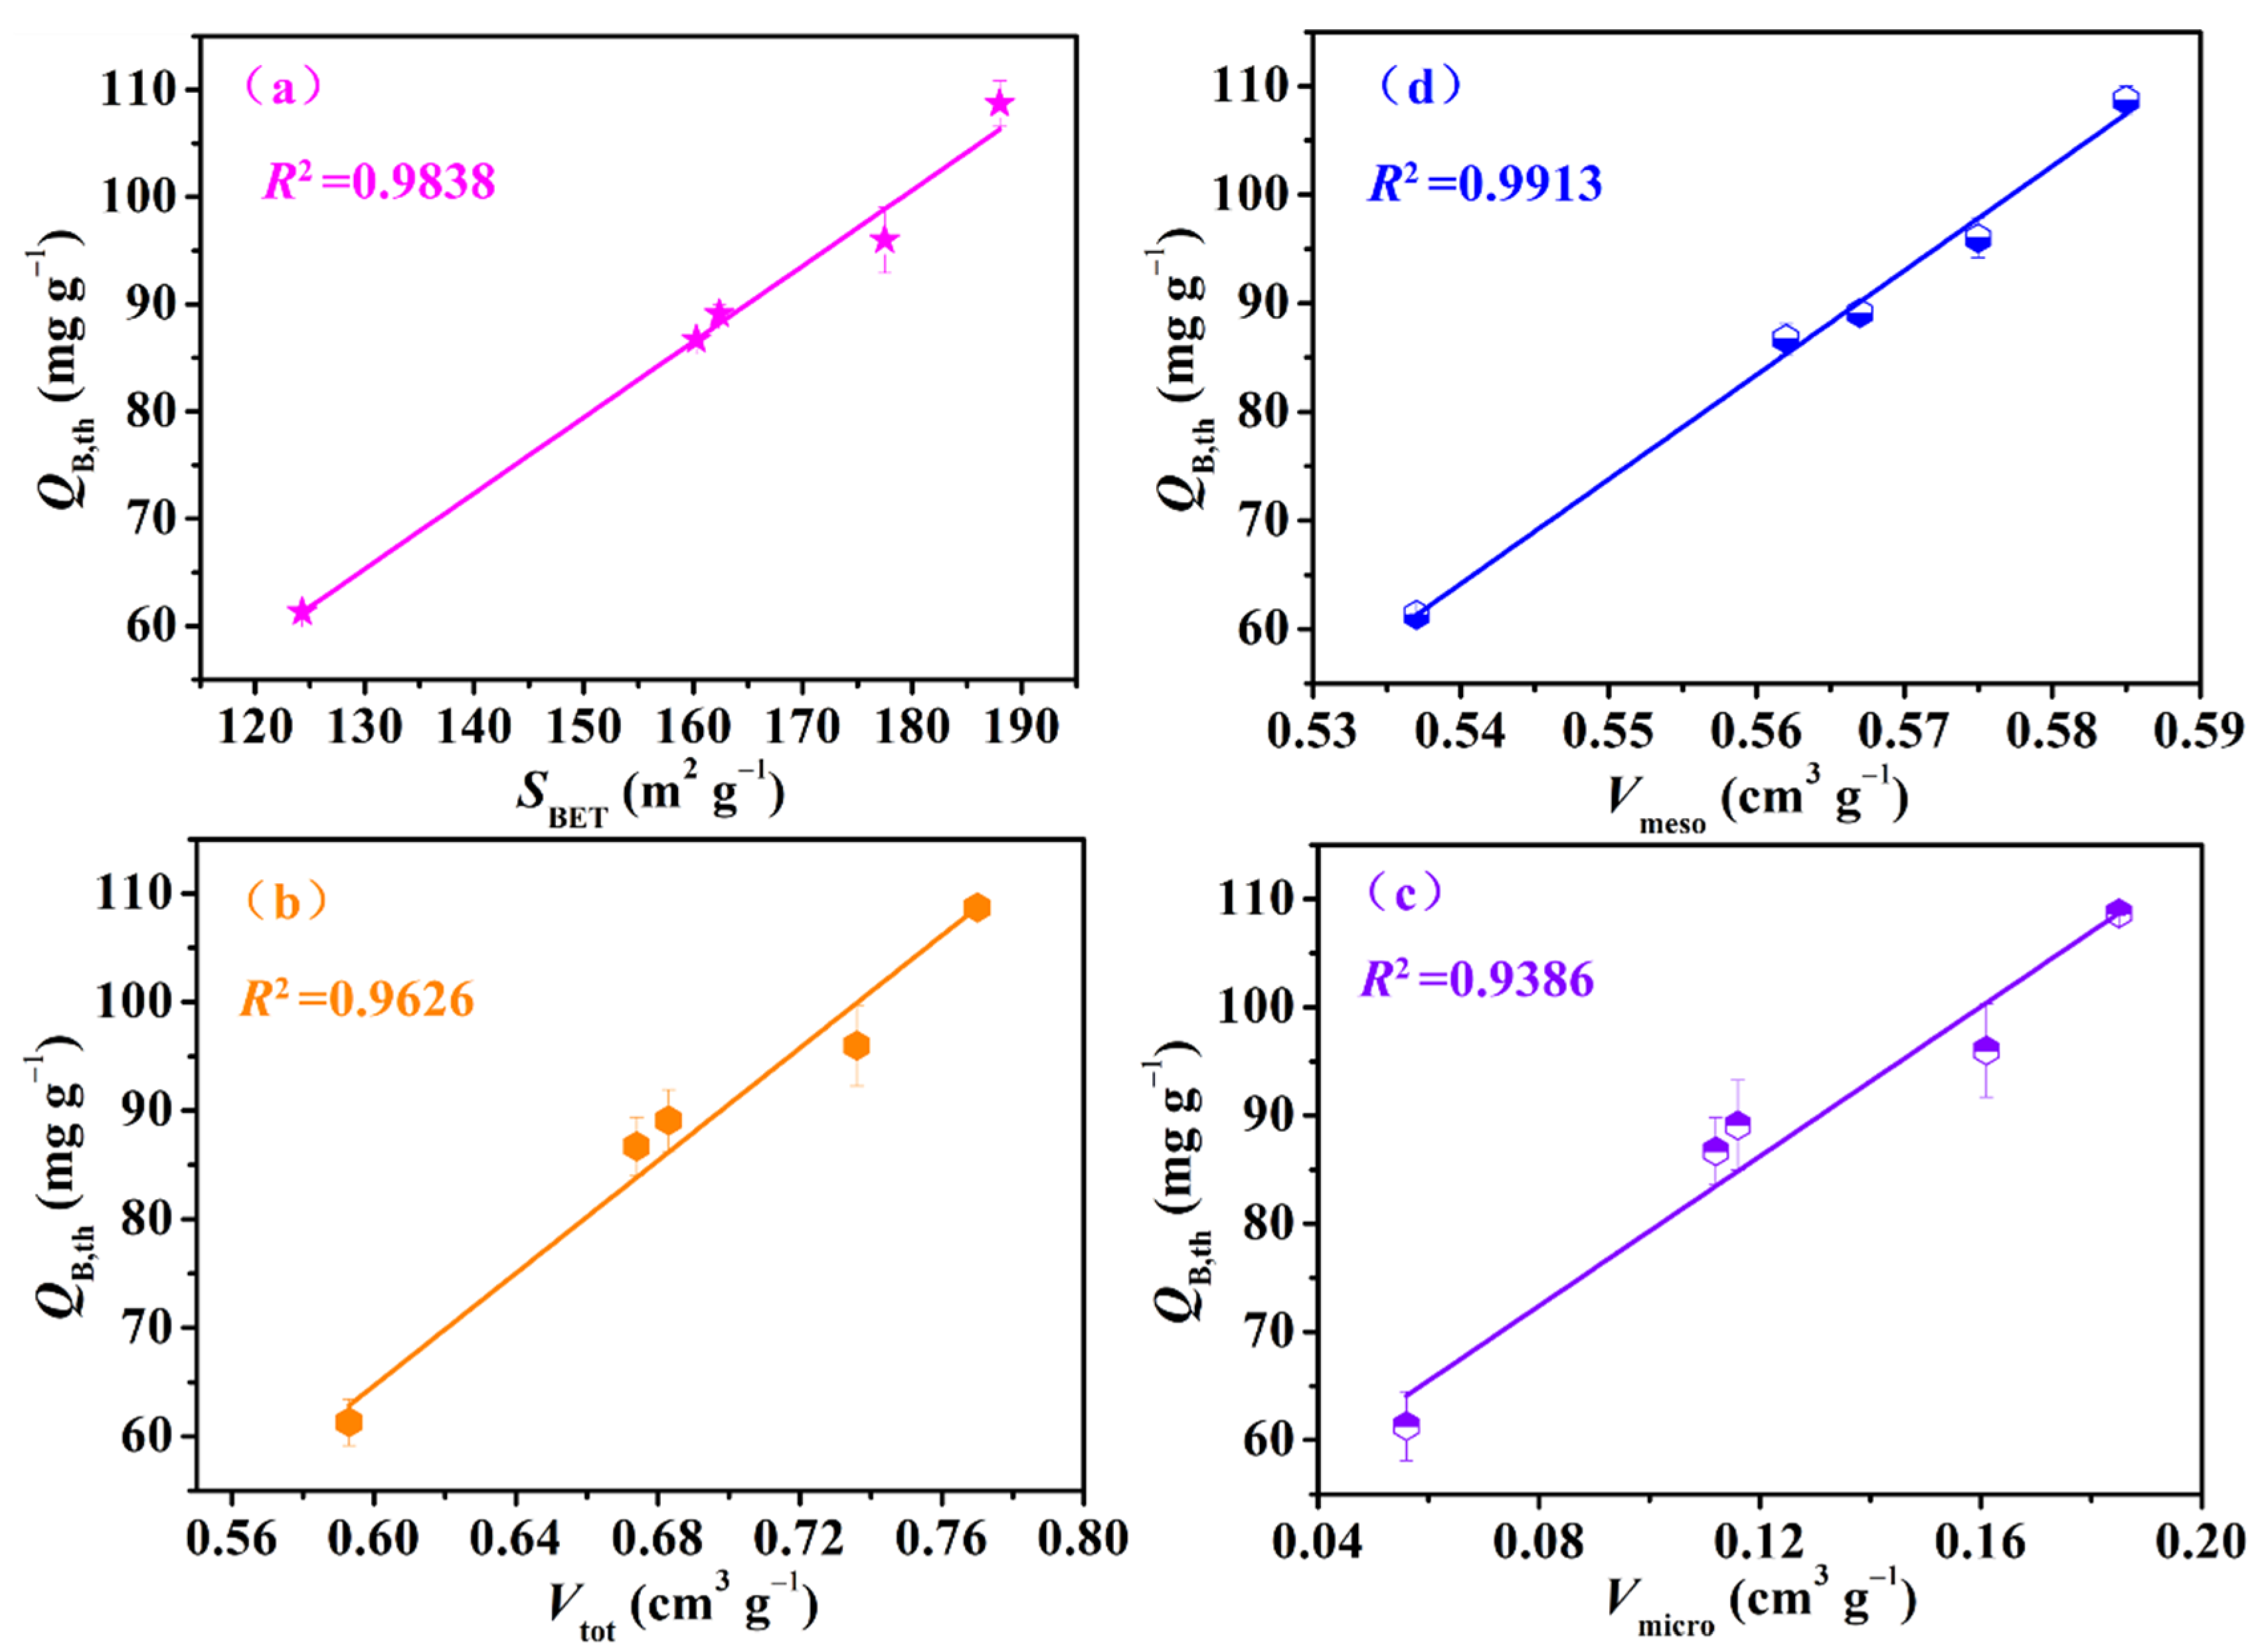
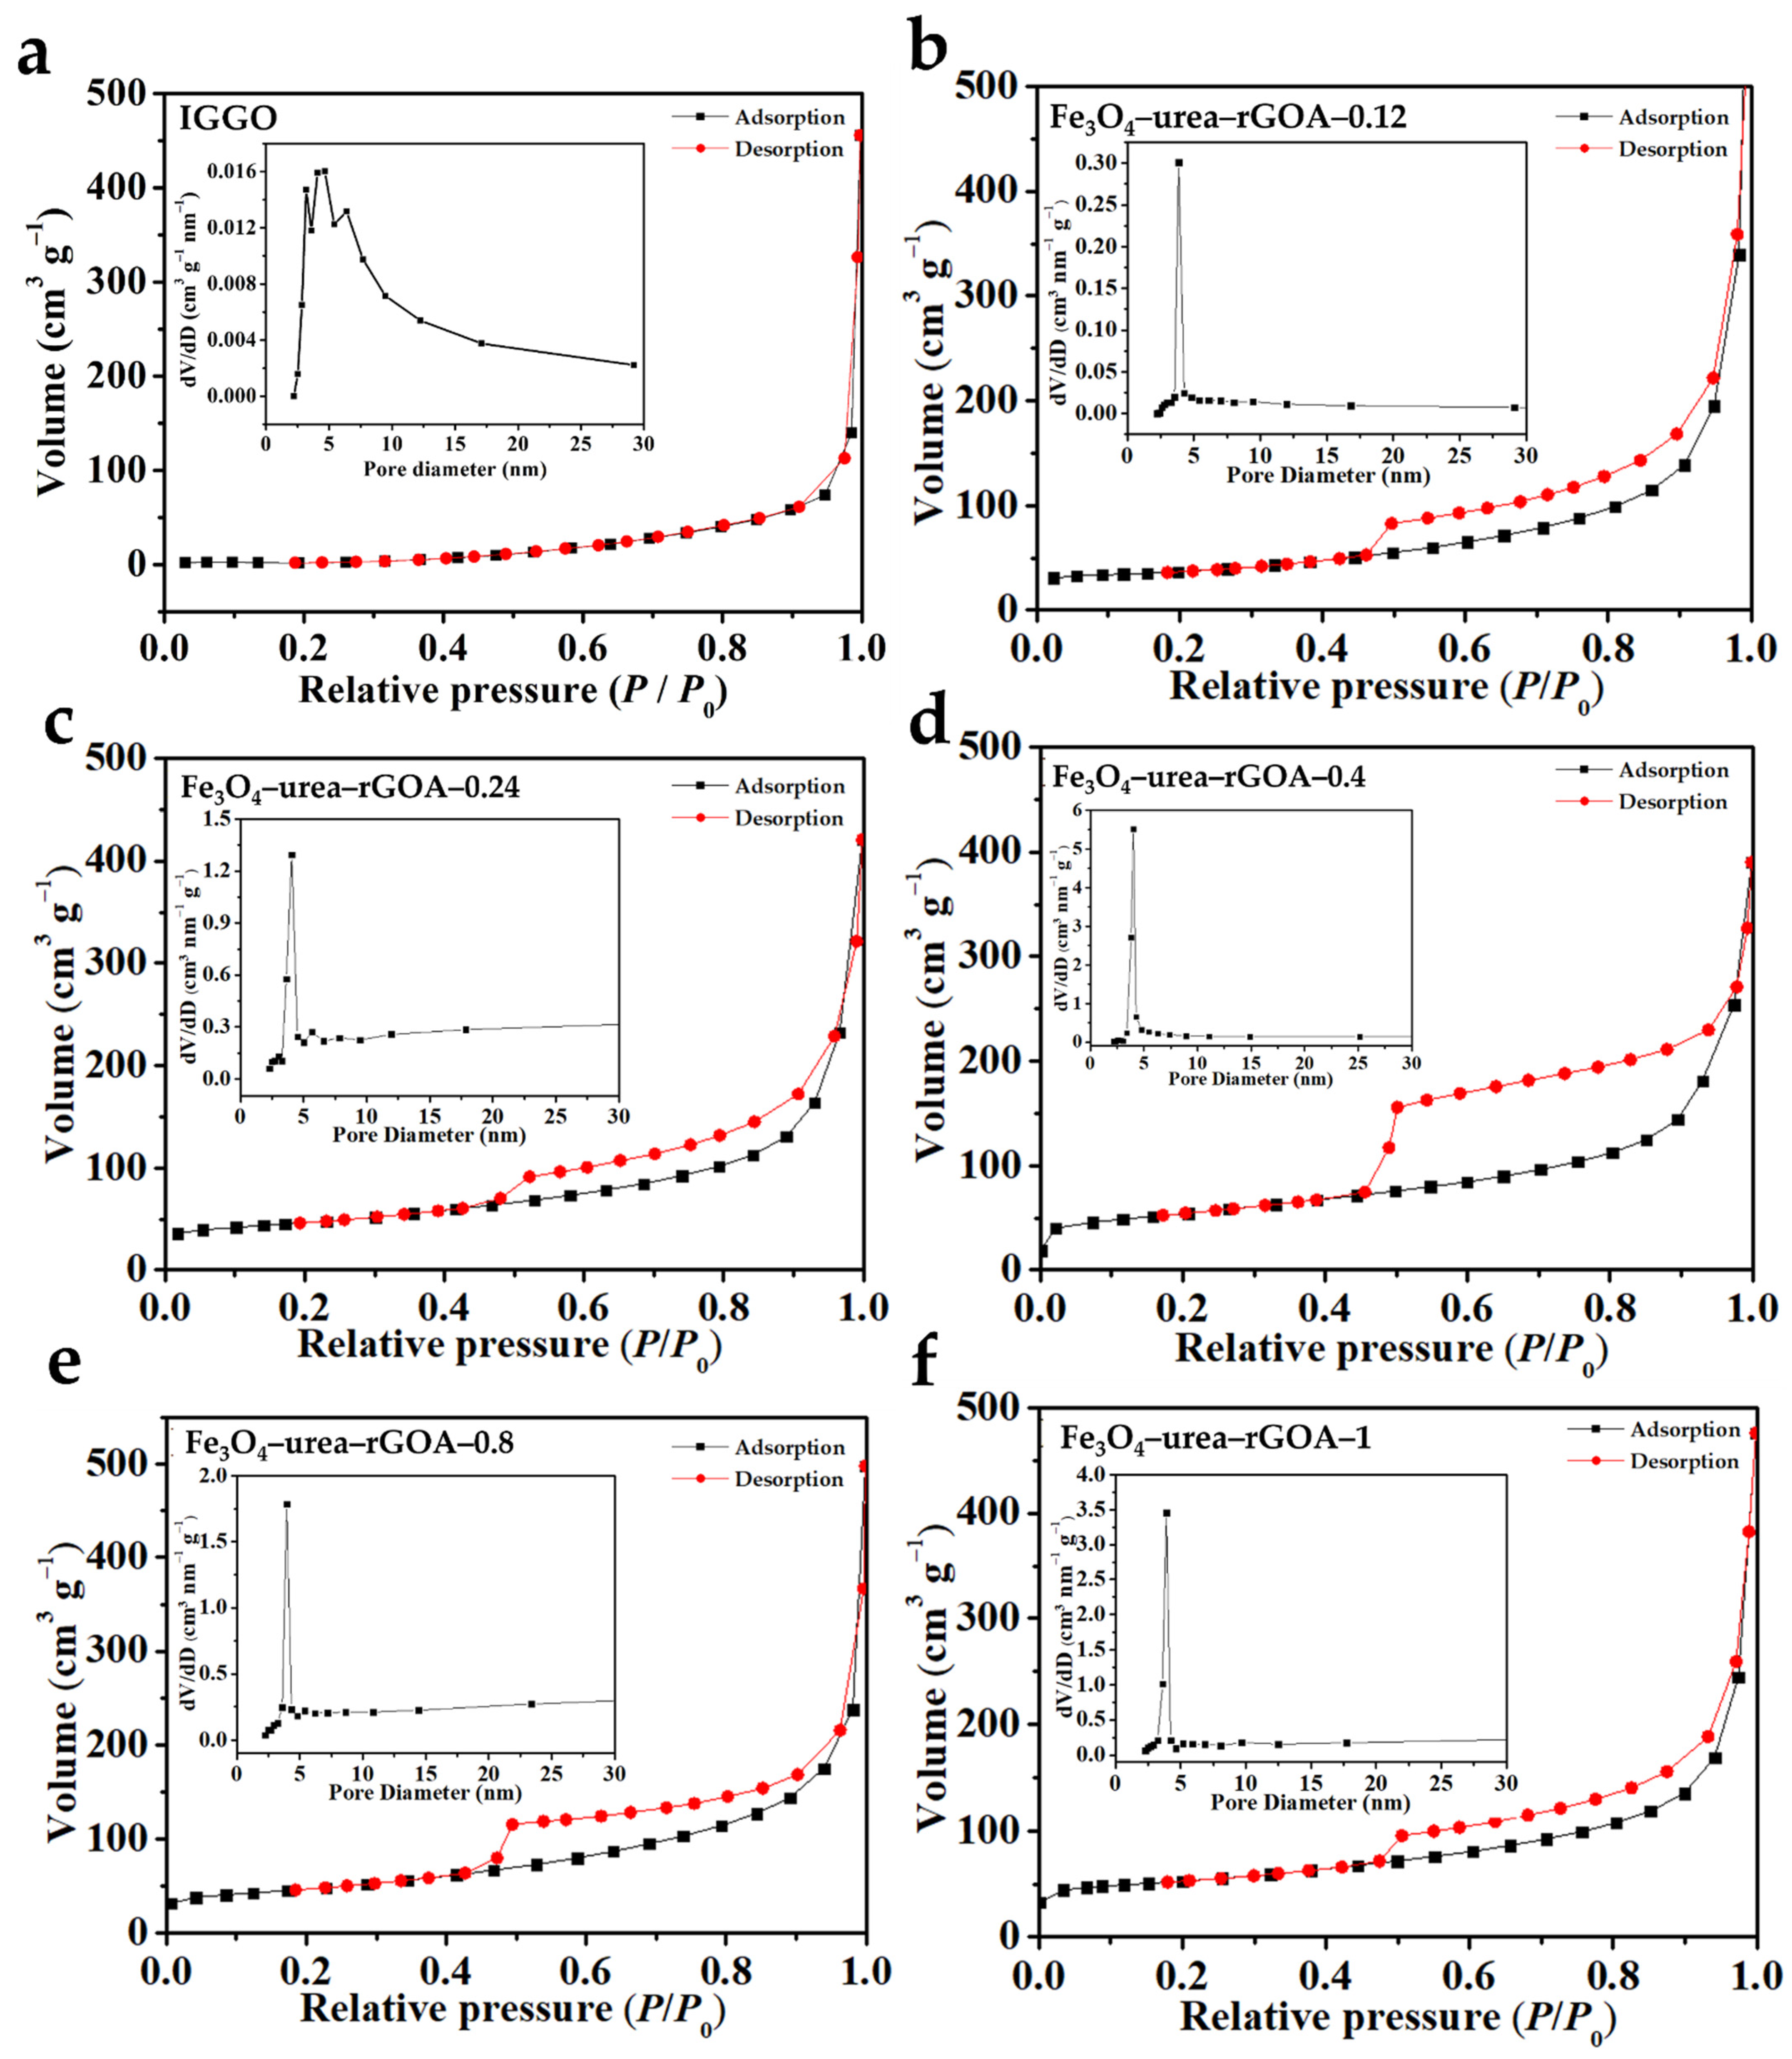
2.1. Effects of Modifier Fe(NO3)3·9H2O on Texture Properties

Digital photos of the Fe3O4–urea–reduced graphene oxide hydrogels (Fe3O4–urea–rGOHs) are shown in Figure S1. It can be seen that the Fe3O4–urea–rGOHs all show an overall macroscopic shape, which suggests that, under the action of reduction-induced self-assembly, the formation of hydrogels was promoted [38]. The N2 adsorption–desorption isotherms of IGGO and the Fe3O4–urea–rGOAs are shown in Figure 1. According to the IUPAC classification method [39], the adsorption and desorption isotherms of N2 on the six samples were type I and type IV, respectively, and the adsorption of the monolayer in the low-relative-pressure region reflected the phenomenon of micropore filling. With an increase in the relative pressure, multilayer adsorption appeared, and adsorption hysteresis appeared above a relative pressure of 0.4, reflecting mesoporous capillary condensation. Moreover, from a shape analysis of the hysteresis loops, the Fe3O4–urea–rGOAs were H3-type hysteresis loops, and the shapes of their holes were slit and crack holes, which were speculated to be formed due to the collaborative self-assembly process of Fe3O4 and graphene sheets [26]. According to IUPAC rules, IGGO showed type III isotherms and did not have hysteresis loops, from which it can be inferred that IGGO has a relatively non-porous/macroporous structure. As shown in Table 1, the pore structure parameters of IGGO and the Fe3O4–urea–rGOAs are listed. The BET specific surface areas of the IGGO, Fe3O4–urea–rGOA–0.12, Fe3O4–urea–rGOA–0.24, Fe3O4–urea–rGOA–0.4, Fe3O4–urea–rGOA–0.8, and Fe3O4–urea–rGOA–1 samples were found to be 7, 124, 160, 188, 177, and 162 m2 g−1, respectively. With an increase in Fe3+ loading, Fe3O4–urea–rGOA provided a large number of effective channels, making the BET specific surface area and total pore volume gradually increase, reaching 188 m2 g−1 and 0.77 cm3 g−1, respectively; however, with a continuous increase in Fe3+, the number of micropores in the complex Fe3O4–urea–rGOAs reduced, resulting in a decrease in the BET specific surface area and total pore volume [40,41]. In addition, it can be determined from the pore size distribution that the pore size was mainly in the range from 2 to 5 nm, which is a micro/narrow mesoporous range that is most suitable for L2 removal and is the main contribution to increasing the specific surface area.

2.2. Characterization of Adsorbents

Figure 2a–d show the SEM and TEM images of IGGO and Fe3O4–urea–rGOA–0.4. Compared to IGGO, Fe3O4–urea–rGOA–0.4 exhibited an abundant three–dimensional network structure and more fissured pores. Moreover, it can be seen that the Fe3O4 spherical small particles were evenly distributed in the graphene lamellar structure, which may have increased the roughness of the graphene aerogel surface and thus enlarged the specific surface area of the graphene aerogel [40]. The XRD testing results of IGGO and Fe3O4–urea–rGOA–0.4 are shown in Figure 2e. After hydrothermal reduction, the graphene (002) diffraction peak can be seen at 24.5°, and the diffraction peaks of Fe3O4–urea–rGOA–0.4 appeared at 30.6°, 35.9°, 43.4°, 52.1°, 57.3°, and 62.9°, corresponding to the crystal planes (200), (311), (400), (422), (511), and (400) of Fe3O4, respectively. This being the case, the above-mentioned results suggest that the Fe3O4 nanoparticles were successfully combined with graphene sheets [42]. The FTIR spectrum of IGGO showed a number of absorption peaks (Figure 2f). The significant broad peaks were located at 3441 cm−1 for the stretching vibration of O–H in the adsorbed–state H2O, C–OH groups, and –COOH groups [43]. The absorption peak at 2927 cm−1 was attributed to the –C–H stretching vibration, [44] and that at 1727 cm−1 was due to the C=O stretching vibration in carboxyl. The peaks appearing at 1443 and 1623 cm−1 were attributed to the C=C vibration of the graphene skeleton [45]. There was a strong absorption peak at 1050 cm−1, which belonged to the stretching vibration of the epoxy group C–O–C [45]. After hydrothermal reduction, in the FTIR spectrum of Fe3O4–rGOA–0.4, the disappearance of the 1727 cm−1 peak and the appearance of the 3750 cm−1 peak were partly due to the possible decarboxylation reaction of the carboxyl group at 800 °C and partly due to C=O being reduced to C–OH moieties that were free [24]. The C=C stretching frequency intensity at 1623 cm−1 was decreased and the C–O–C stretching frequency intensity at 1050 cm−1 was weakened. Moreover, two new peaks that appeared at 1580 and 1115 cm−1 were attributed to the C=N and C–N–C stretching vibrations, respectively [46]. The appearance of another peak in the region of 1670 cm−1 can be attributed to the formation of an amide bond via the reaction of urea with the –COOH groups [47]. The above results reveal that the oxygen–containing groups were reduced, epoxy rings were opened via the addition of –NH–CO–NH2, with subsequent tautomerization to –N=C–OH–NH2, and that some N atoms were doped into the graphene sheet [24,46]. Furthermore, the shoulder between 1580 cm−1 and 1623 cm−1, as well as the band at 585 cm−1, could be due to the Fe–O stretching vibration in Fe3O4, indicating that Fe3O4 was successfully anchored on the graphene sheet, which is consistent with the XRD results [42]. In Figure 2f, the Raman spectra of the IGGO and Fe3O4–rGOA–0.4 samples are given. The ratio of the intensities of the D and G peaks (ID/IG) was in the order of IGGO (0.86) < Fe3O4–rGOA–0.4 (1.20), indicating that the defects of Fe3O4–rGOA–0.4 were relatively high, which is presumed to be due to a large number of sp3 hybrid carbon atom defects caused by the urea hydrothermal reduction process [45]. Moreover, a small peak at 588 cm−1 could be due to the Raman spectrum of Fe3O4 [27]. This indicates that Fe3O4 and rGOA were successfully combined, which is consistent with the results of previous studies.
According to the above experimental results, we propose a possible working mechanism, as shown in Figure 3. Based on the synergic self-assembly effect induced by Fe3+, the two assembly processes of Fe3O4 and urea reduction were carried out simultaneously and promoted each other. The Fe3O4 nanoparticles were successfully anchored on the layer of reduced graphene oxide. Meanwhile, the N atoms were successfully doped into the graphene structure, resulting in defects on the graphene sheets, and urea also acted as a crosslinker and reducing agent. According to the literature [48,49], all of the above synergies are beneficial to the formation of a large specific surface area and micro/narrow mesoporous pores, which are the most suitable for L2 removal.

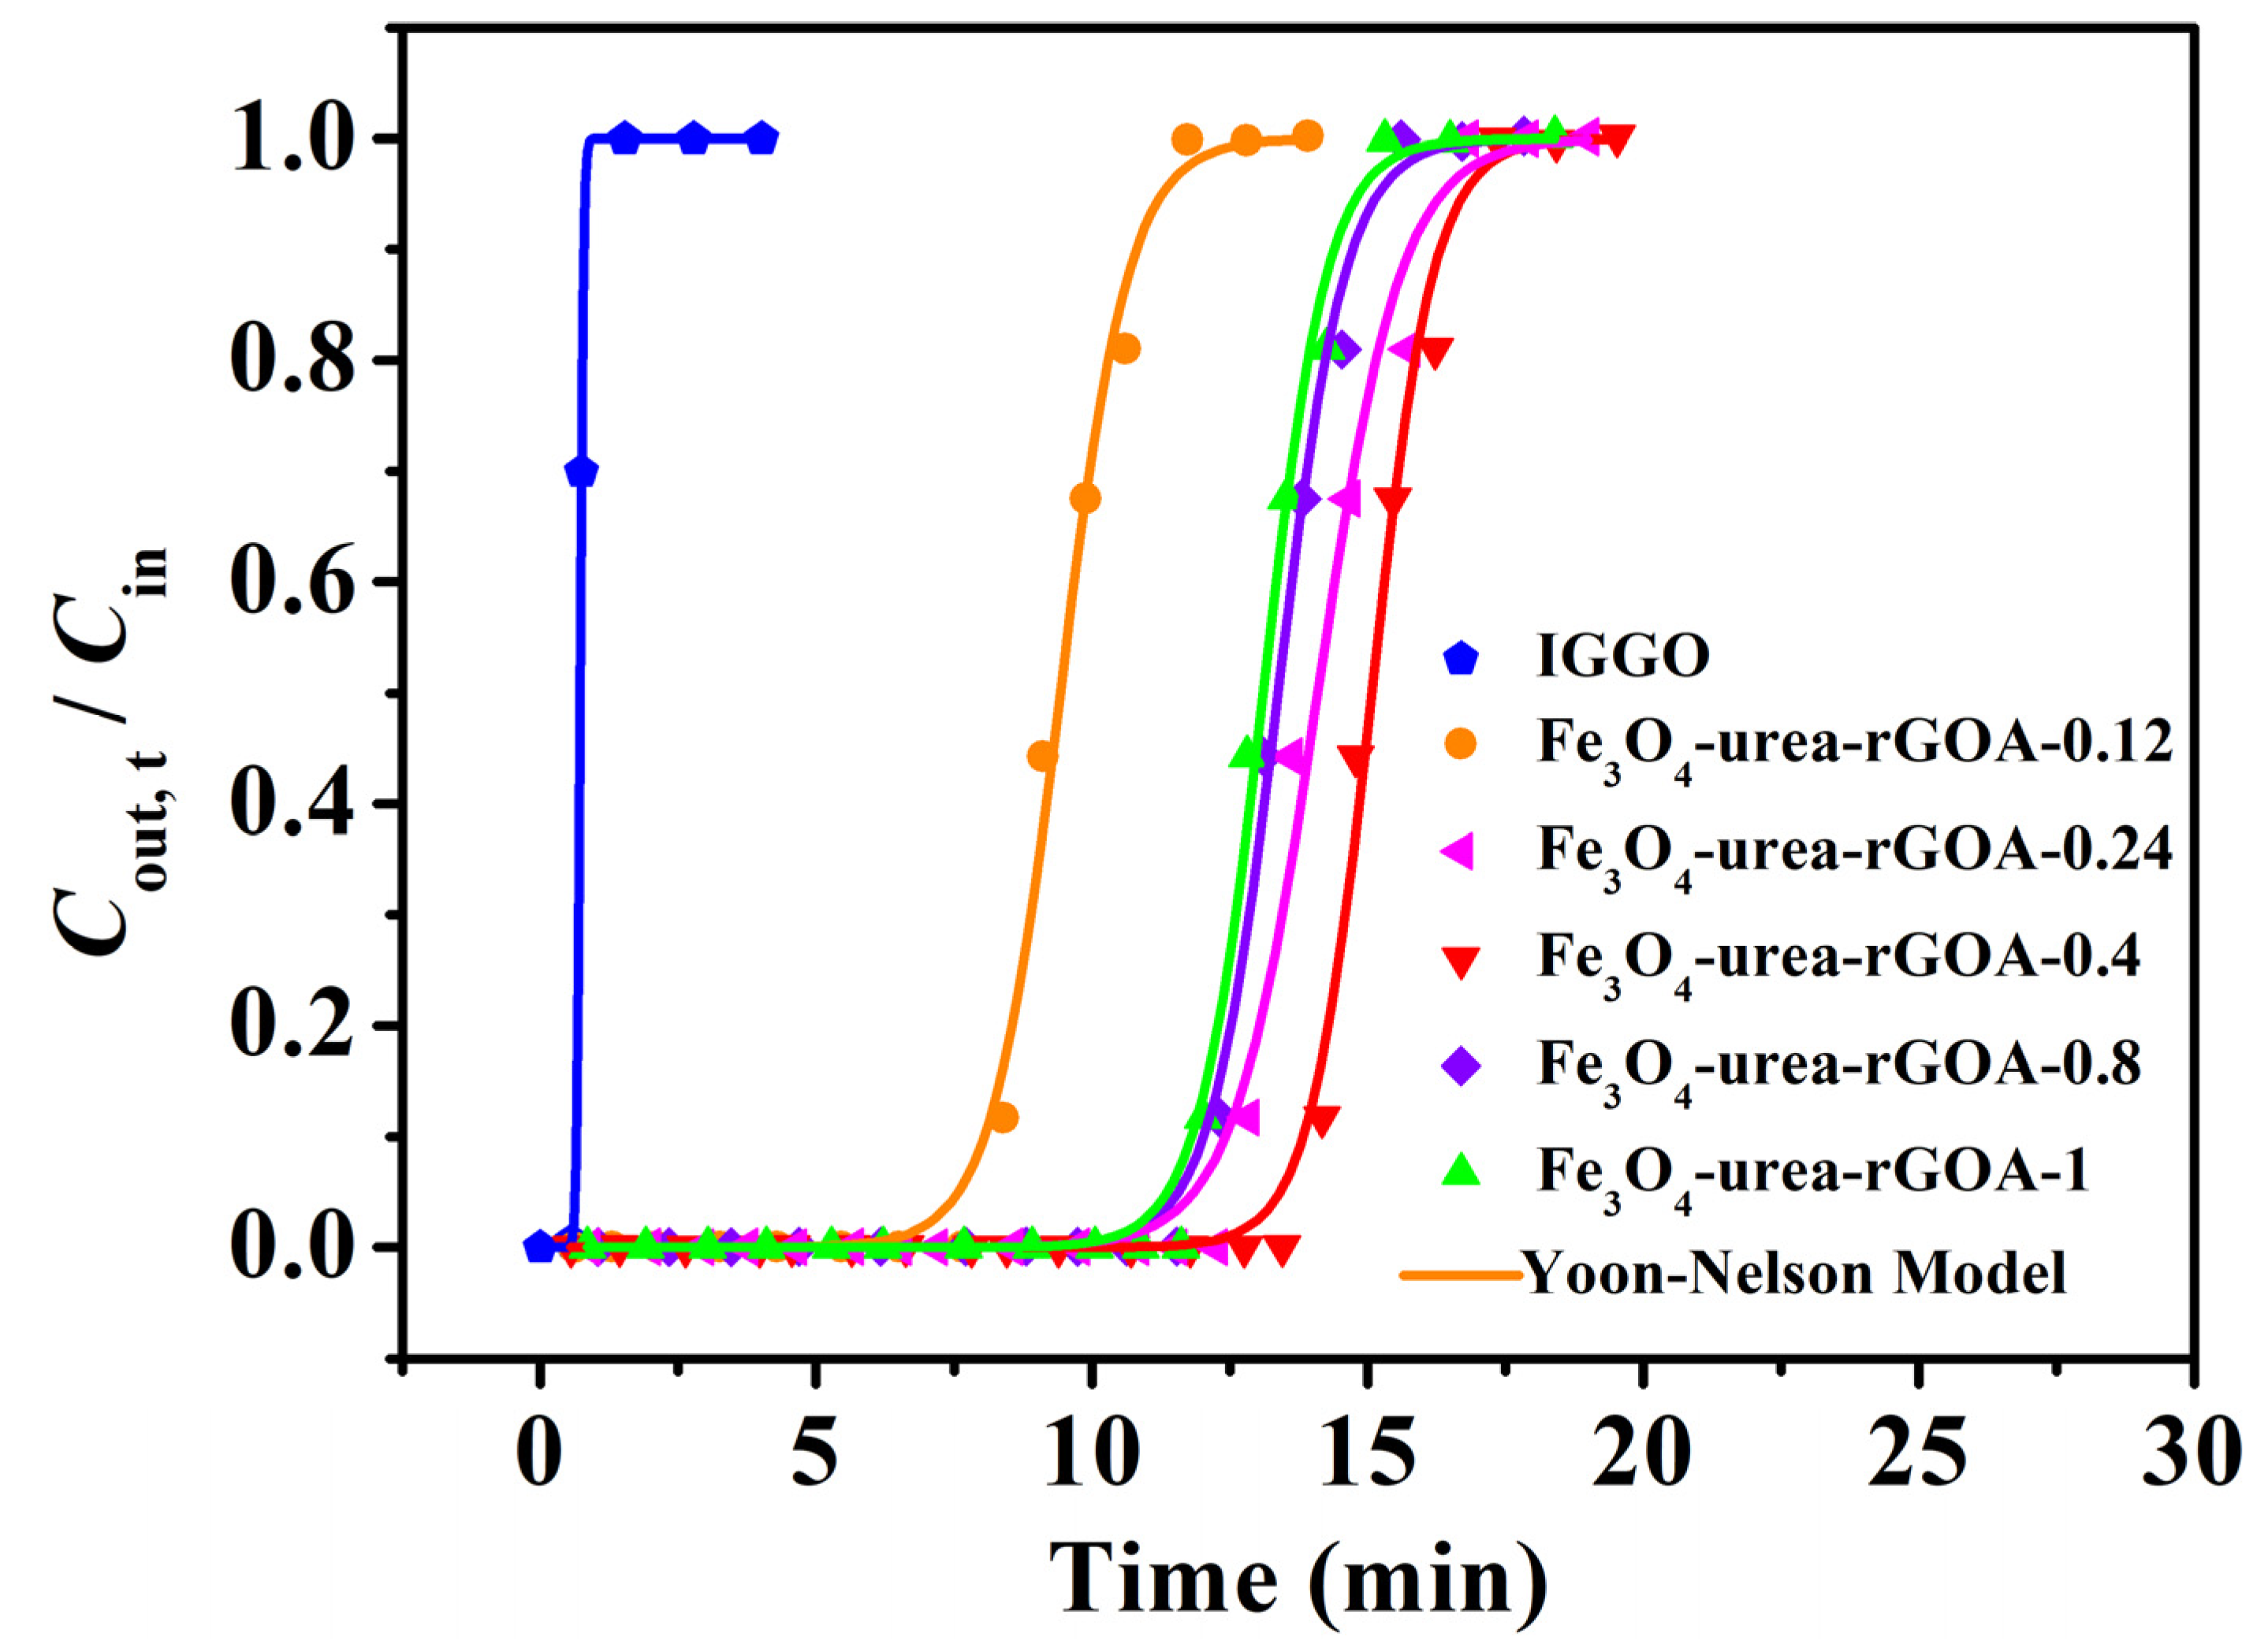
2.3. Comparison of Dynamic Adsorption Performances

The breakthrough adsorption curves (represented by the Cout,t/Cin~t relationship curve), obtained by using the Yoon–Nelson model for IGGO and Fe3O4–urea–rGOAs, are shown in Figure 4. The experimental conditions were as follows: T = 25 °C, Cin = 14.62 mg L−1, and Vg = 50 mL min−1. The calculated model parameters and adsorption experiment results are summarized in Table 2. The results demonstrated the following: (1) The L2 breakthrough curves for IGGO and the Fe3O4–urea–rGOAs were S–shaped, and experienced three stages of plateau–penetration–equilibrium with an extension in time, which is in line with the typical characteristics of gas–solid adsorption behavior. (2) These dynamic adsorption data can be well described with the Yoon–Nelson model equation (correlation coefficient R2 > 0.99). Therefore, in our later discussions, we chose the theoretical parameter values (tB,th, QB,th, and Qm,th) via this model to analyze the adsorption performances of the Fe3O4–urea–rGOAs. (3) With an increase in the mass of Fe(NO3)3·9H2O, the adsorption performance of the Fe3O4–urea–rGOAs to L2 first increased and then decreased. The order of the adsorption properties of the Fe3O4–urea–rGOAs for L2 was as follows: Fe3O4–urea–rGOA–0.4 > Fe3O4–urea–rGOA–0.24 > Fe3O4–urea–rGOA–0.8 > Fe3O4–urea–rGOA–1 > Fe3O4–urea–rGOA–0.12 > IGGO. Among them, the tB,th, QB,th, and Qm,th values of Fe3O4–urea–rGOA–0.4 were 13.88 min, 101.5 mg g−1, and 112.4 mg g−1, respectively, exhibiting the best adsorption capacity of L2. (4) In order to reveal the structure–activity relationship between the texture and adsorption properties of the Fe3O4–urea–rGOAs, correlational analyses for QB,th with each of the SBET, Vmeso, Vtot, and Vmicro separately were performed for the Fe3O4–urea–rGOAs, and a linear simulation was performed using the y = a + bx equation, as shown in Figure 5a–d. The relevant parameters simulated by the equation are shown in Table 3. The R2 of the QB,thSBET, QB,thVmeso, QB,thVtot, and QB,thVmicro linear fitting were 0.9838, 0.9913, 0.9626, and 0.9386, respectively. Therefore, the specific surface area and pore volume were the main influencing factors of L2 adsorption, and, moreover, the correlation between Vmeso and QB,th was slightly greater than that of Vmicro. It has been reported that the molecular kinetic diameter of L2 is 1.044 nm [17], and when the pore size is two to four times that of the adsorbent molecule diameter, it is favorable for adsorption [17]. According to the experimental results, the prepared aerogels had a pore size ranging from 2 nm to 5 nm, which is the most suitable pore structure for absorbing L2. Therefore, the adsorption of L2 is mainly microporous and mesoporous. It can thus be inferred that capillary condensation and micropore filling were the main adsorption mechanisms of L2 on the Fe3O4–urea–rGOA–0.4 [14,24,41], and the schematic diagram of the adsorption mechanism is as shown in Figure S2.

2.4. Effect of Process Conditions on Adsorption

There were many factors affecting the adsorption process [50,51]. Therefore, it is interesting to explore the influence of different Fe3O4–urea–rGOA–0.4 bed temperatures (T) and L2 inlet concentrations (Cin) on the adsorption. The change curve of QB,th with Cin is shown in Figure 6a. In a low-concentration range, QB,th increased with a greater Cin. When Cin reached a certain concentration, QB,th maintained equilibrium. It has been reported that when the adsorption force of an L2 molecule and the coverage of an adsorption site reach equilibrium, the adsorption capacity reaches a stable value under the corresponding conditions [52,53]. Therefore, it is appropriate to control the inlet concentration of L2 in the range from 25 mg L−1 to 40 mg L−1. Figure 6b shows the breakthrough curve of the adsorption of L2 with Fe3O4–urea–rGOA–0.4 fitted by the Yoon–Nelson model at various bed temperatures (0–55 °C). In addition, the calculated model parameters and theoretical metrics (tB,th, QB,th, and Qm,th) based on the experimental data are listed in Table 4. When Cin was 14.62 mg L−1 and Vg was 50 mL min−1 at 0 °C, the maximum penetration adsorption capacity of L2 on Fe3O4–urea–rGOA–0.4 was 146.5 mg g−1. It can be seen that, with an increase in bed temperature, tB,th, QB,th, and Qm,th all decreased, indicating that the L2 adsorption process in the Fe3O4–urea–rGOA–0.4-filled bed was exothermic, which could further support the idea that the primary adsorption mechanisms of L2 are capillary condensation and micropore filling [14,24,41].

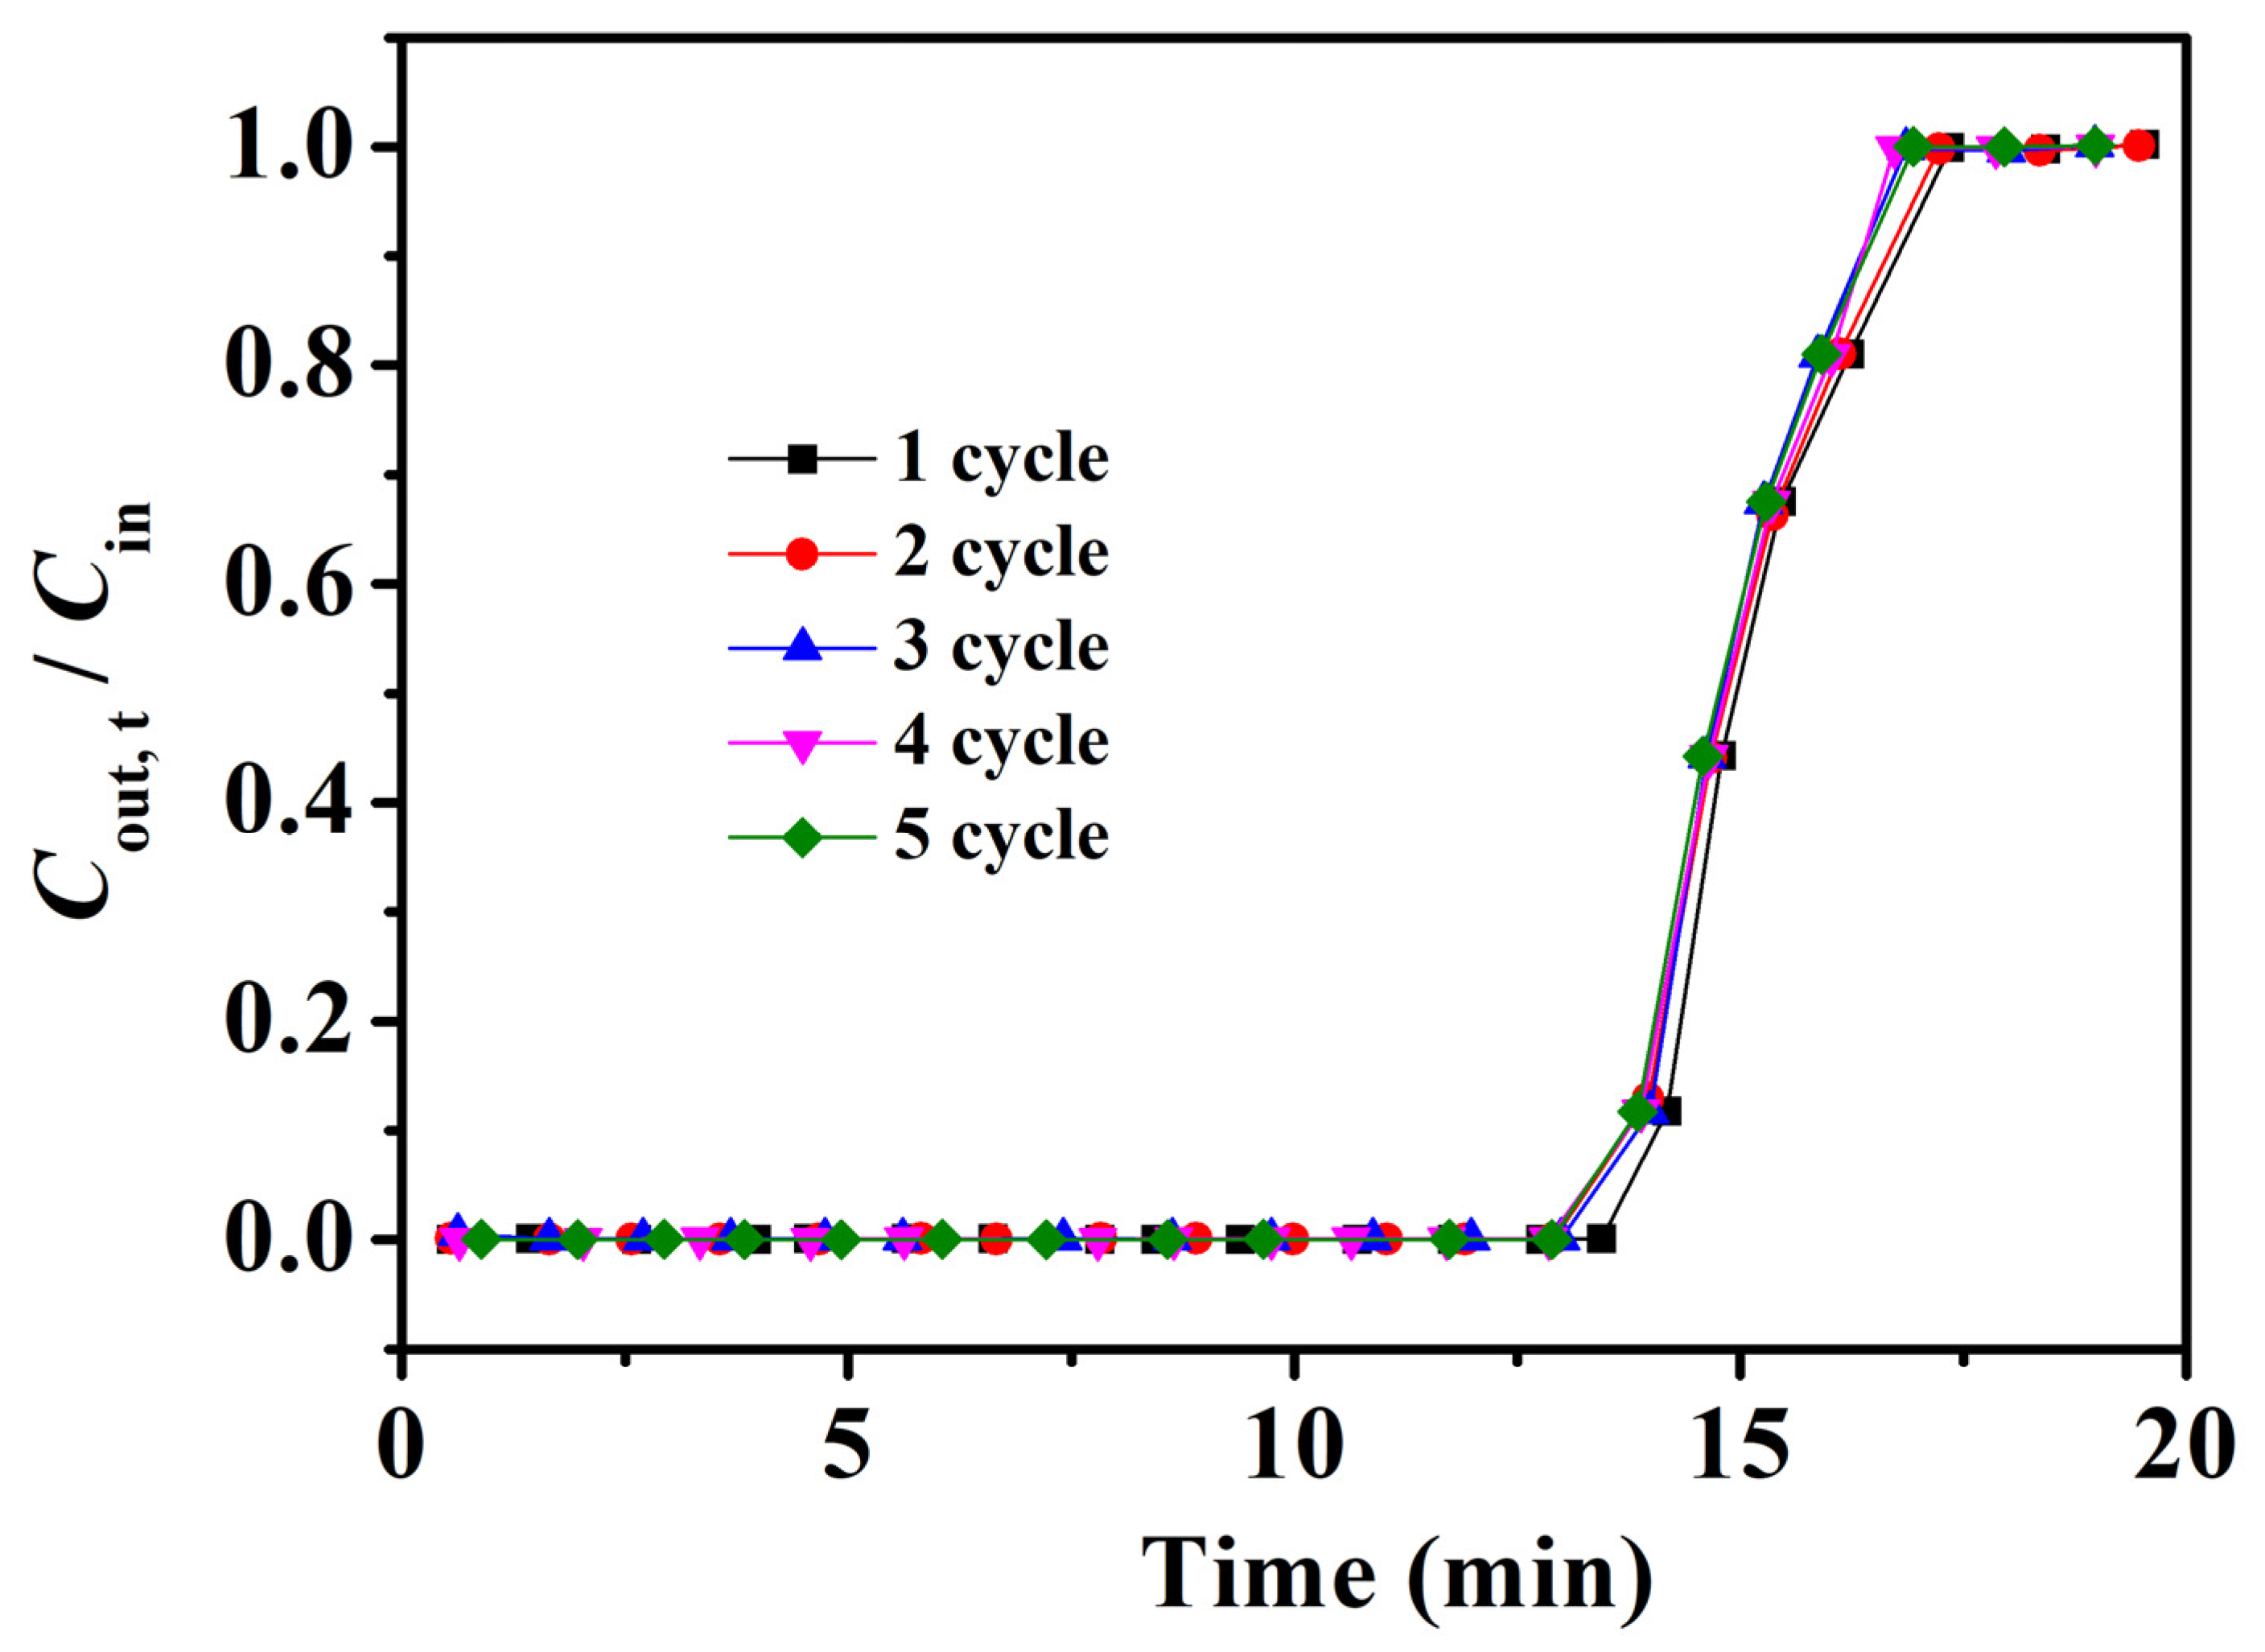
2.5. Recycling Performance of Fe3O4–Urea–rGOA–0.4

The recovery performance of adsorbents is an important factor with which to evaluate their practical application. Therefore, Fe3O4–urea–rGOA–0.4, after the adsorption of L2, was regenerated after being treated in an 80 °C water bath for 30 min, and repeated for five adsorption–desorption cycles. Thus, the experimental results of these five cycles are shown in Figure 7. As can be shown, the adsorption breakthrough curves of Fe3O4–urea–rGOA–0.4 on L2 basically coincided after five cycles of adsorption/regeneration treatment, indicating that Fe3O4–urea–rGOA–0.4 had a good recycling performance, which has prospects for industrial application. As can be seen from Table S1, although the adsorption properties were slightly lower than those of other porous carbon materials [41,54,55,56], Fe3O4–urea–rGOA–0.4 could be regenerated under a normal pressure and lower heating temperature with a more than 99% regeneration efficiency.

3. Materials and Methods

3.1. Materials and Chemicals

IGGO powder in the range from 10 to 50 μm was purchased from Suzhou Hengqiu Technology Co. (Suzhou, China). Fe(NO3)3·9H2O (analytical grade, Aladdin Industrial Corporation, Shanghai, China), urea (CH4N2O, analytical grade, Tianjin Yongda Chemical Reagent Co., Ltd., Tianjin, China), and deionized (DI) water were used for the preparation of the Fe3O4–urea–rGOAs. Hydrochloric acid (HCl, 99%) was purchased from Beijing Chemical Reagent Co. (Beijing, China). Hexamethyldisiloxane (L2; 99%, Aladdin Co., Ltd., Shanghai, China) was used as a representative model polluting gas of siloxane impurities in biogas.

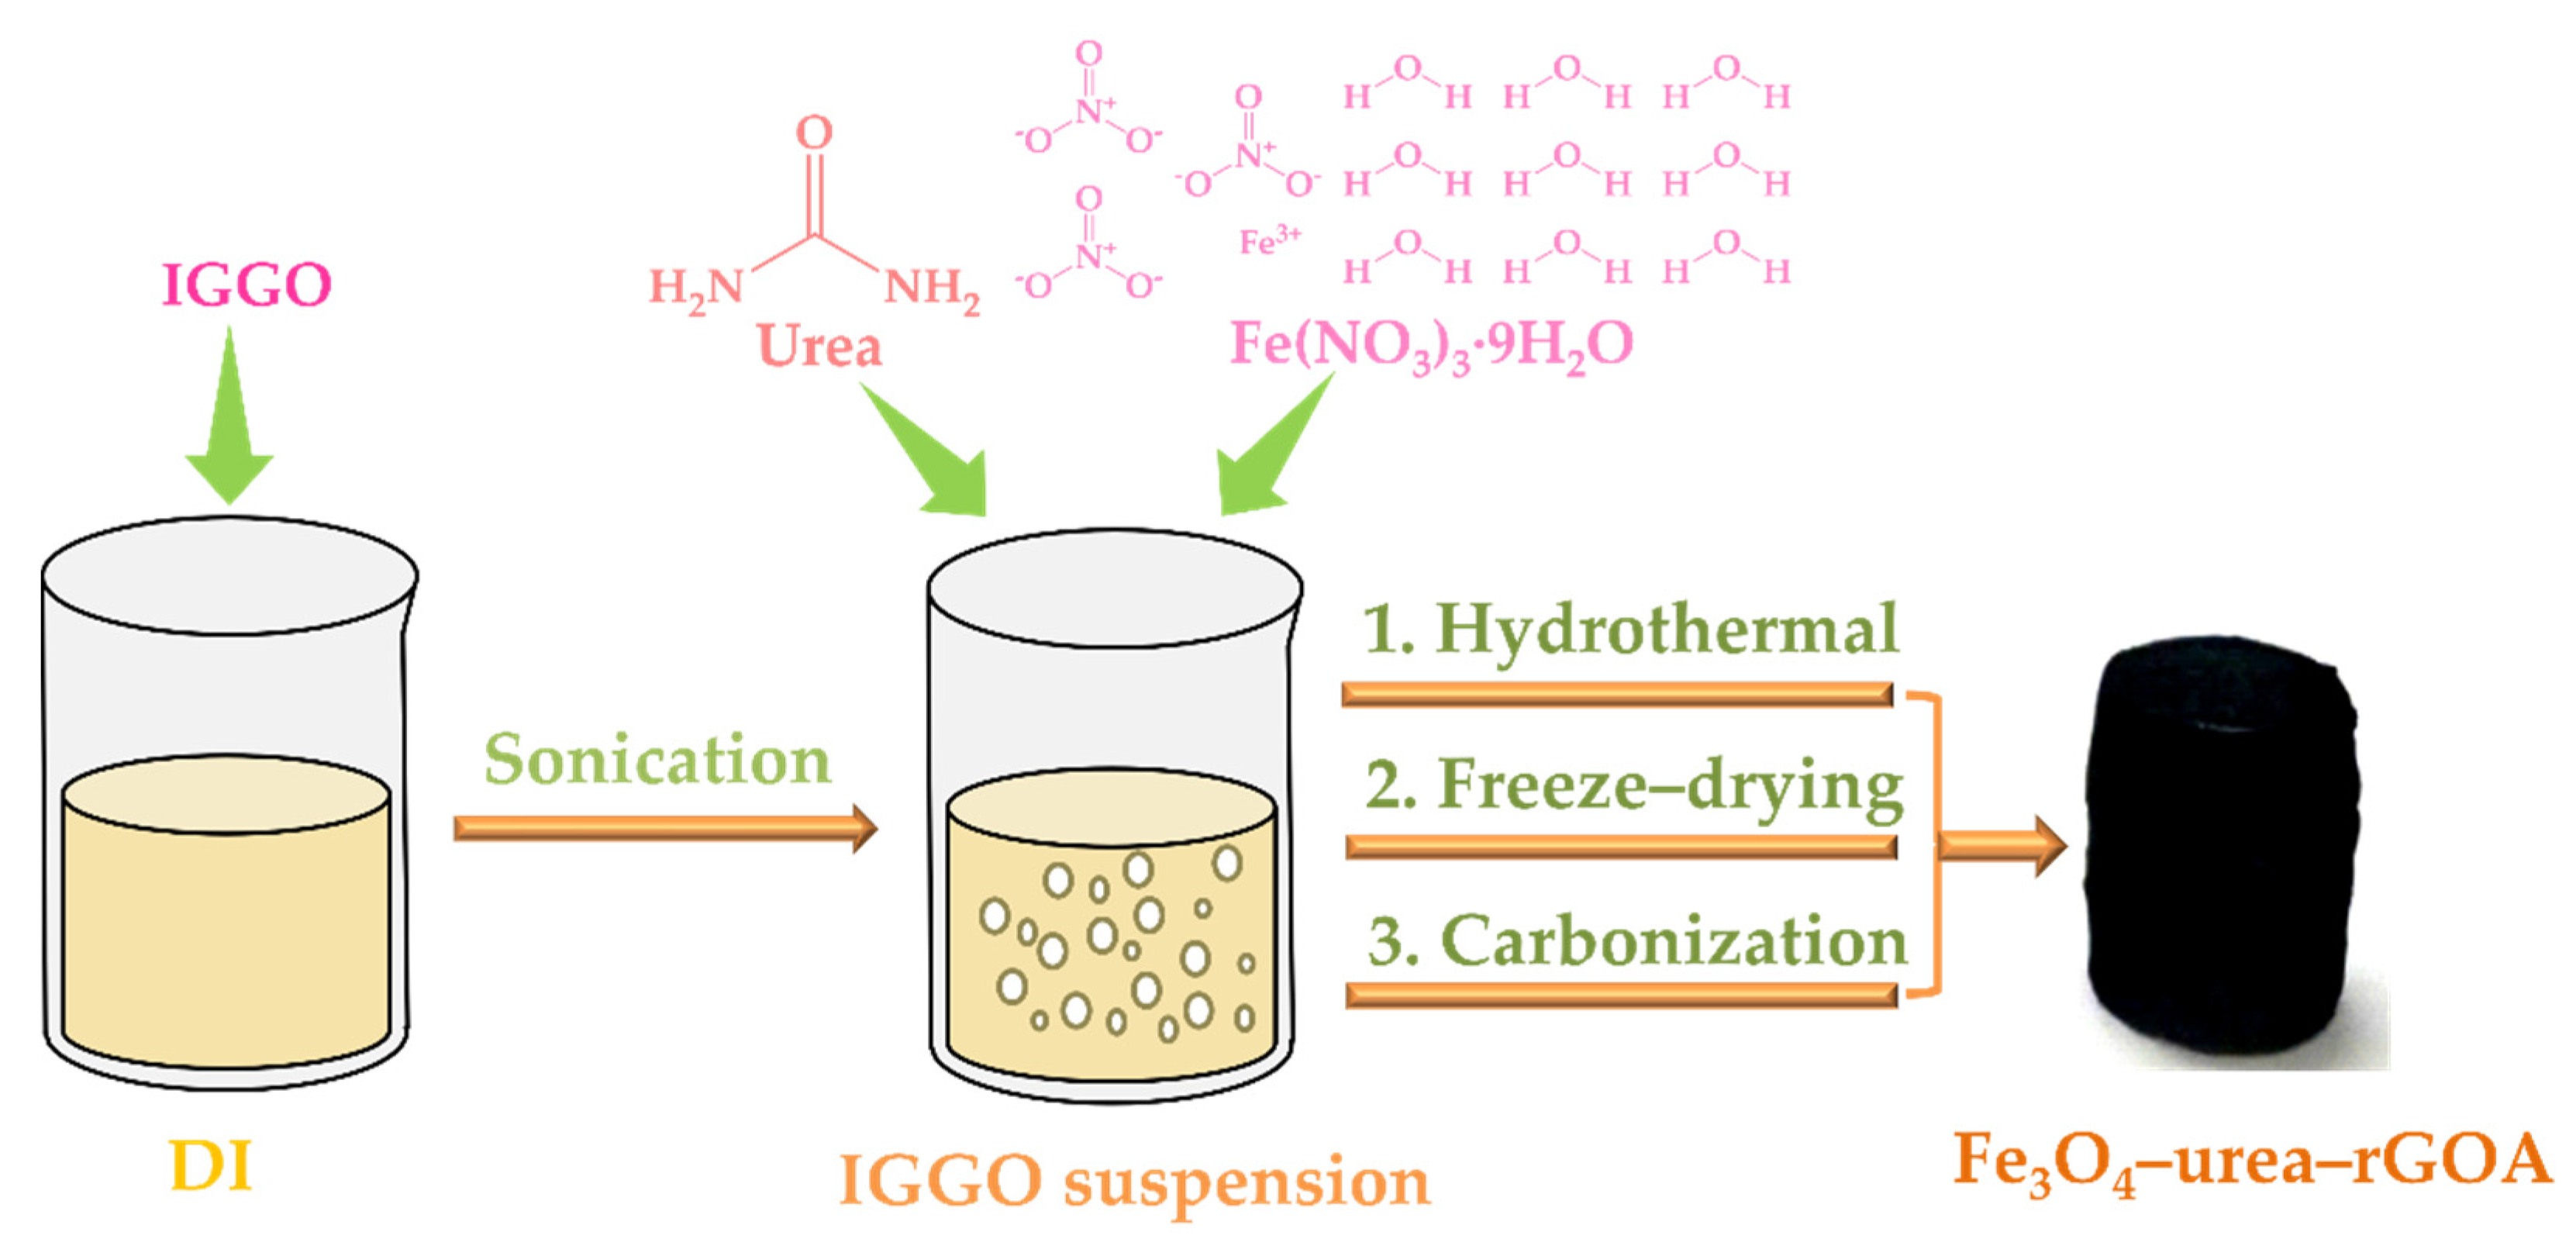
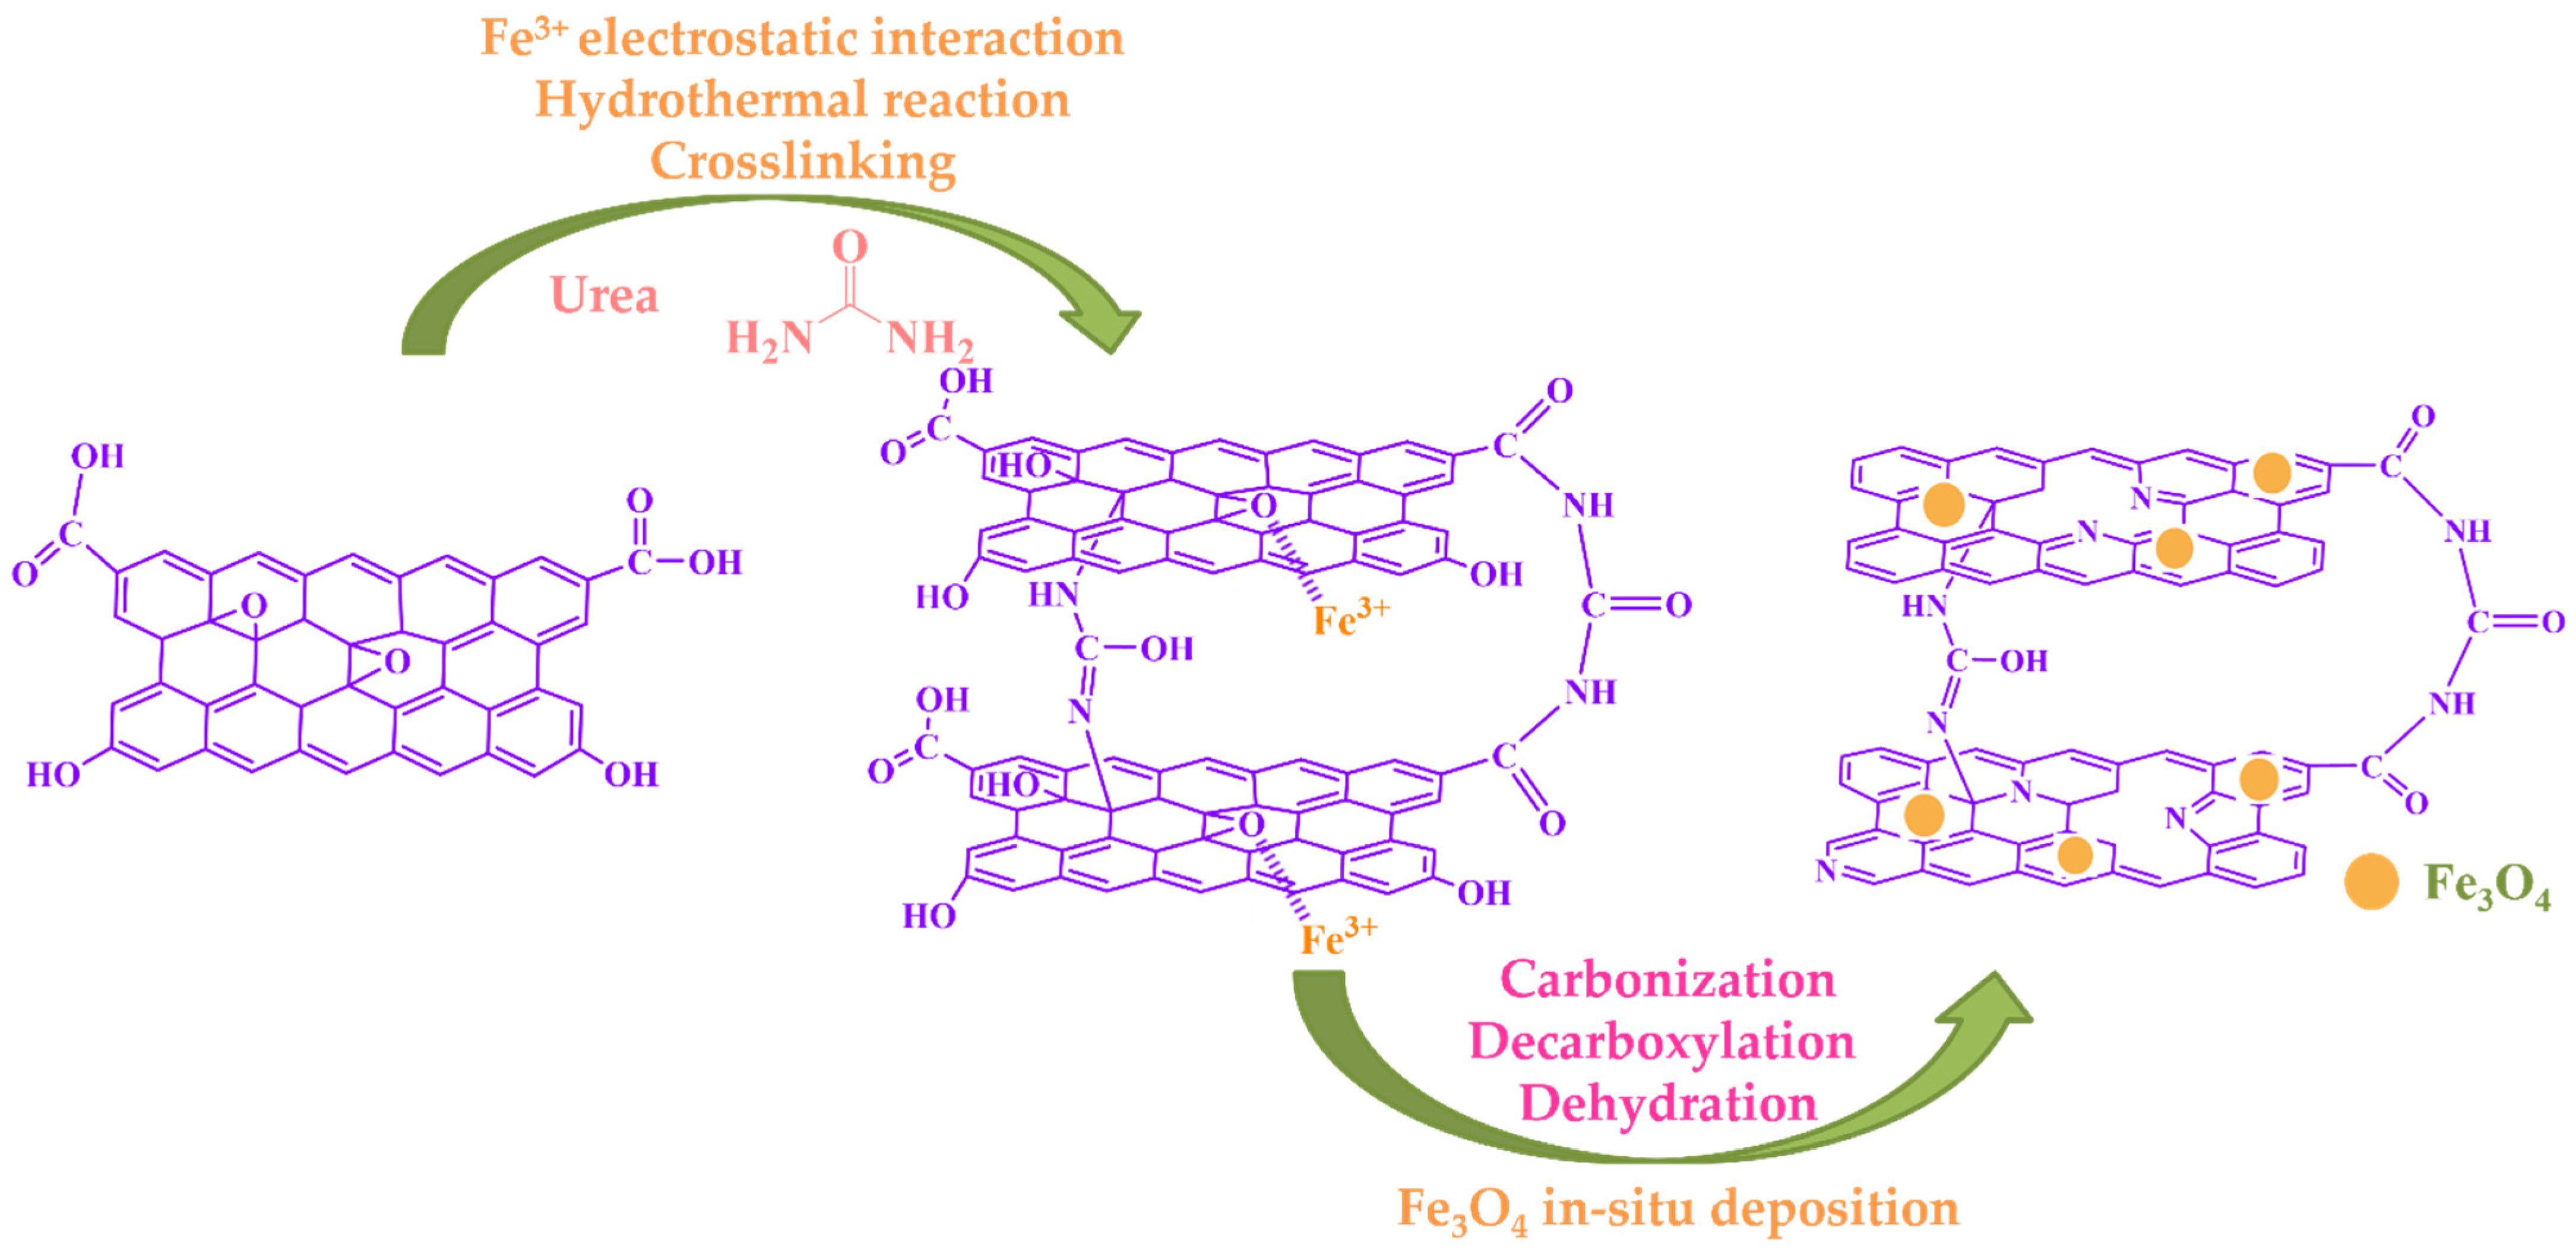
3.2. Preparation of Fe3O4–Urea–rGOAs

The schematic construction procedures of the Fe3O4–urea–rGOAs are described in Figure 8. The method used to acquire the Fe3O4–urea–rGOAs was generally divided into four steps, as described below:
Step 1: The preparation of IGGO dispersion. An amount of 0.24 g of IGGO was dispersed in 60 mL of deionized water via ultrasonic treatment for 30 min to obtain an IGGO suspension (4 mg mL−1).
Step 2: Hydrogel preparation. The dispersion solution was added to with a certain mass of Fe(NO3)3·9H2O and 0.20 g of urea (molar ratios of 0.09, 0.18, 0.30, 0.60, and 0.74), and then ultrasonic treatment was performed. After 60 min of ultrasound, the dispersion solution was transferred to a 100 mL reactor for a hydrothermal reaction at 180 °C for 8 h, acquiring the Fe3O4–urea-modified reduced graphene oxide hydrogel.
Step 3: Lyophilization and carbonization. The Fe3O4–urea–rGOHs were immersed in a solvent of ethanol for 12 h. Next, the Fe3O4–urea–rGOHs were cooled at −18 °C for 12 h, and then freeze–dried at −46 °C for 24 h. Finally, the Fe3O4–urea–rGOA sample was achieved via heating in a tube furnace at 800 °C in a N2 atmosphere for 2 h.
Step 4: Concentration adjustment. The same method was used to synthesize five different IGGO/Fe(NO3)3·9H2O mass ratios (1:0.12, 1:0.24, 1:0.4, 1:0.8, and 1:1) and denoted as Fe3O4–urea–rGOA–0.12, Fe3O4–urea–rGOA–0.24, Fe3O4–urea–rGOA–0.4, Fe3O4–urea–rGOA–0.8, and Fe3O4–urea–rGOA–1.

3.3. Adsorption Experiments of L2 Gas

The removal performances of IGGO and the Fe3O4–urea–rGOAs for an L2 gas stream were measured using a fixed-bed dynamic adsorption setup. The full experimental setup and related details of the methods are described in the published literature [24,25]. For each test, 0.10 g of Fe3O4–urea–rGOA was used and the experimental parameters were T = 25 °C, an L2 inlet concentration of 14.62 mg L−1, and Vg = 50 mL min−1. The continuous adsorption of L2 on the IGGO and Fe3O4–urea–rGOA packed-bed column was studied in terms of the breakthrough curves, which were expressed by plotting Cout,t/Cin vs. adsorption time. We employed the following three metrics to evaluate the adsorbent performance: the breakthrough time (tB, defined as the time when Cout,t/Cin ≈ 0.05, min); the breakthrough adsorption capacity (QB, representing the adsorption capacity at time tB, mg g−1); and the saturated adsorption capacity (Qm, defined as the adsorption capacity when Cout, t/Cin ≈ 1, mg g−1). The QB and Qm values for an independent adsorption test were found using Equation (1):
Q t = V g C in m 0 t ( 1 C out ,   t C in ) d t
In addition to the physical quantities mentioned above, m is the mass of the adsorbent (g) and Vg is the flow rate of the L2 gas (L min−1).

3.4. Model for the Breakthrough Curves

The measured dynamic data of the L2 gas can be predicted via the Yoon–Nelson model, which is a semi-empirical model. The Yoon–Nelson model is represented via Equation (2):
C out ,   t C in = 1 1 + exp K YN τ t × 100
where KYN is the Yoon–Nelson constant and τ is the time required for retaining 50% of the initial adsorbate.

3.5. Regeneration of the Spent Fe3O4–Urea–rGOAs

When the adsorption of the adsorbents was saturated, it was necessary to regenerate it to achieve the cyclic adsorption of the spent Fe3O4–urea–rGOA. The adsorption tubes were placed in a water bath (80 °C) and blown with 100 mL min−1 of N2 for 30 min. Five consecutive adsorption/desorption cycles were repeated in the same manner.

3.6. Characterization

The SEM images were performed using a field emission scanning electron microscope (SEM, Hitachi S4800, Chiyoda City, Japan) at an accelerating voltage of 15 kV. Photos were taken of different samples using a field emission transmission electron microscope (TEM, H-7650, Hitachi, Tokyo, Japan) at 150 kV. The structures were characterized by using a D8 Advance X-ray diffractometer equipped with Cu Kα radiation (XRD, λ = 0.154 nm, Bruker, Bremen, Germany). FTIR spectroscopy was performed by using an FTIR spectrometer (IR Tracer–100, Shimadzu, Nagoya, Japan) in the region of 4000~500 cm−1. The Raman spectroscopy measurements were carried out using a Raman spectrometer (XploRA PLUS, Horiba, Japan) with a 514 nm laser. The nitrogen (N2) adsorption–desorption isotherms of IGGO and the Fe3O4–urea–rGOAs were collected at 77 K on a Kubo × 1000 surface area and pore size analyzer (Beijing Builder, Beijing, China). The BET surface area (SBET) was determined through the Brunauer–Emmett–Teller (BET) theory, and the pore volumes were processed through Barrett–Joyner–Halenda (BJH) models. The concentration of L2 in the gas stream was analyzed using a Fuli Analytical Instrument 9790 gas chromatograph equipped with a flame ionization detector (GC–FID, Chengde, China).

4. Conclusions

A series of Fe3O4–urea–rGOAs was prepared by controlling the amount of Fe3O4 precursor and urea, through which the dynamic adsorption behaviors of the hexamethyldisiloxane (L2) impurity gas in biogas were investigated. The synergistic effect between the rich porous structure of Fe3O4 and the interconnected three-dimensional pores of the rGOA greatly enlarged the specific surface area and pore volume of the rGOA. Thus, Fe3O4–urea–rGOA–0.4 exhibited the highest SBET (188 m2 g−1), Vmicro (0.19 cm3 g−1), Vmeso (0.58 cm3 g−1), and Vtot (0.77 cm3 g−1). QB,th showed an excellent linear relationship with SBET (R2 = 0.9838) and Vmeso (R2 = 0.9931), indicating that both SBET and Vmeso were important parameters influencing the adsorption of L2 and that the main adsorption mechanisms were capillary condensation and micropore filling. Moreover, it turned out that a lower temperature and higher inlet concentration could improve the siloxane adsorption level of Fe3O4–urea–rGOA–0.4. Regeneration could be achieved by heating in a water bath at 80 ℃ for 30 min, and after five cycles, the recycling efficiency was 99%. As expected, a high adsorption capacity and excellent cycling properties made Fe3O4–urea–rGOA–0.4 a promising adsorbent for VMS removal in industrial applications.

Supplementary Materials

The following supporting information can be downloaded at: https://www.mdpi.com/article/10.3390/molecules28186622/s1, Figure S1: Photographs of the Fe3O4–urea–rGOHs. Figure S2: The schematic diagram of the adsorption mechanism of L2 on the Fe3O4–urea–rGOAs. Table S1: Adsorption and regeneration capacities of different porous carbon materials for VMS.

Author Contributions

This work was carried out with collaboration between all authors. S.L. and X.H. performed the experimental investigation. S.L. and Y.Z. performed the data curation and the analysis and wrote the first draft of the manuscript. Z.M. performed the project administration and the funding acquisition. All authors have read and agreed to the published version of the manuscript.

Funding

This work was financially supported by the National Natural Science Foundation of China (22176049) and the Natural Science Foundation of Hebei Province (B2021205022).

Institutional Review Board Statement

Not applicable.

Informed Consent Statement

Not applicable.

Data Availability Statement

Data is contained within the article. The data presented in this study are available.

Conflicts of Interest

The authors declare no conflict of interest.

Sample Availability

Samples of the compounds are not available from the authors.

References

  1. De Arespacochaga, N.; Valderrama, C.; Raich–Montiu, J.; Crest, M.; Mehta, S.; Cortina, J.L. Understanding the effects of the origin, occurrence, monitoring, control, fate and removal of siloxanes on the energetic valorization of sewage biogas—A review. Renew. Sust. Energy Rev. 2015, 52, 366–381. [Google Scholar]
  2. Rucker, C.; Kummerer, K. Environmental chemistry of organosiloxanes. Chem. Rev. 2015, 115, 466–524. [Google Scholar] [PubMed]
  3. Chuah, C.Y.; Goh, K.; Yang, Y.; Gong, H.; Li, W.; Karahan, H.E.; Guiver, M.D.; Wang, R.; Bae, T.H. Harnessing filler materials for enhancing biogas separation membranes. Chem. Rev. 2018, 118, 8655–8769. [Google Scholar] [PubMed]
  4. Gao, R.; Cheng, S.; Li, Z. Research progress of siloxane removal from biogas. Int. J. Agric. Biol. Eng. 2017, 10, 30–39. [Google Scholar]
  5. Pascual, C.; Cantera, S.; Lebrero, R. Volatile siloxanes emissions: Impact and sustainable abatement perspectives. Trends Biotechnol. 2021, 39, 1245–1248. [Google Scholar]
  6. Rivera-Montenegro, L.; Valenzuela, E.I.; González-Sánchez, A.; Muñoz, R.; Quijano, G. Volatile Methyl siloxanes as key biogas pollutants: Occurrence, impacts and treatment technologies. Bioenergy Res. 2022, 16, 801–816. [Google Scholar]
  7. Shen, M.; Zhang, Y.; Hu, D.; Fan, J.; Zeng, G. A review on removal of siloxanes from biogas: With a special focus on volatile methylsiloxanes. Environ. Sci. Pollut. Res. 2018, 25, 30847–30862. [Google Scholar]
  8. Alves, C.M.A.C.; Abreu, F.O.M.S.; Araújo, R.S.; Oliveira, M.L.M. Recent advances in siloxanes removal from biogas and their efficiency: A short review. Chem. Pap. 2022, 77, 1–9. [Google Scholar]
  9. Piechota, G. Removal of siloxanes from biogas upgraded to biomethane by Cryogenic Temperature Condensation System. J. Clean. Prod. 2021, 308, 127404. [Google Scholar]
  10. Papat, S.C.; Deshusses, M.A. Biological removal of siloxanes from landfill and digester gases: Opportunities and challenges. Environ. Sci. Technol. 2008, 42, 8510–8515. [Google Scholar]
  11. Ajhar, M.; Bannwarth, S.; Stollenwerk, K.-H.; Spalding, G.; Yüce, S.; Wessling, M.; Melin, T. Siloxane removal using silicone–rubber membranes. Sep. Purif. Technol. 2012, 89, 234–244. [Google Scholar] [CrossRef]
  12. Sigot, L.; Ducom, G.; Benadda, B.; Labouré, C. Adsorption of octamethylcyclotetrasiloxane on silica gel for biogas purification. Fuel 2014, 135, 205–209. [Google Scholar] [CrossRef]
  13. Yang, L.; Corsolini, S.I. Online removal of volatile siloxanes in solid-state anaerobic digester biogas using a biofilter and an activated carbon filter. J. Environ. Chem. Eng. 2019, 7, 103284. [Google Scholar] [CrossRef]
  14. Hou, X.; Zheng, Y.; Ma, X.; Liu, Y.; Ma, Z. The effects of hydrophobicity and textural properties on hexamethyldisiloxane adsorption in reduced graphene oxide aerogels. Molecules 2021, 26, 1130. [Google Scholar] [CrossRef] [PubMed]
  15. Elwell, A.C.; Elsayed, N.H.; Kuhn, J.N.; Joseph, B. Design and analysis of siloxanes removal by adsorption from landfill gas for waste–to–energy processes. Waste Manag. 2018, 73, 189–196. [Google Scholar] [CrossRef]
  16. Yu, M.; Gong, H.; Chen, Z.; Zhang, M. Adsorption characteristics of activated carbon for siloxanes. J. Environ. Chem. Eng. 2013, 1, 1182–1187. [Google Scholar] [CrossRef]
  17. Wang, G.; Li, N.; Xing, X.; Sun, Y.; Zhang, Z.; Hao, Z. Gaseous adsorption of hexamethyldisiloxane on carbons: Isotherms, isosteric heats and kinetics. Chemosphere 2020, 247, 125862. [Google Scholar] [CrossRef]
  18. Molino, G.; Gandiglio, M.; Fiorilli, S.; Lanzini, A.; Drago, D.; Papurello, D. Design and performance of an adsorption bed with activated carbons for biogas purification. Molecules 2022, 27, 7882. [Google Scholar] [CrossRef]
  19. Sigot, L.; Ducom, G.; Germain, P. Adsorption of octamethylcyclotetrasiloxane (D4) on silica gel (SG): Retention mechanism. Micropor. Mesopor. Mater. 2015, 213, 118–124. [Google Scholar] [CrossRef]
  20. Jiang, T.; Zhong, W.; Jafari, T.; Du, S.; He, J.; Fu, Y.-J.; Singh, P.; Suib, S.L. Siloxane D4 adsorption by mesoporous aluminosilicates. Chem. Eng. J. 2016, 289, 356–364. [Google Scholar] [CrossRef]
  21. Zhong, W.; Jiang, T.; Jafari, T.; Poyraz, A.S.; Wu, W.; Kriz, D.A.; Du, S.; Biswas, S.; Thompson Pettes, M.; Suib, S.L. Modified inverse micelle synthesis for mesoporous alumina with a high D4 siloxane adsorption capacity. Micropor. Mesopor. Mater. 2017, 239, 328–335. [Google Scholar] [CrossRef]
  22. Jung, H.; Lee, D.-Y.; Jurng, J. Low-temperature regeneration of novel polymeric adsorbent on decamethylcyclopentasiloxane (D5) removal for cost–effective purification of biogases from siloxane. Renew. Energy 2017, 111, 718–723. [Google Scholar] [CrossRef]
  23. Cabrera-Codony, A.; Santos-Clotas, E.; Ania, C.O.; Martín, M.J. Competitive siloxane adsorption in multicomponent gas streams for biogas upgrading. Chem. Eng. J. 2018, 344, 565–573. [Google Scholar] [CrossRef]
  24. Zheng, Y.; Hou, X.; Liu, Y.; Ma, Z. Hexamethyldisiloxane removal from biogas using reduced graphene-oxide aerogels as adsorbents. Renew. Energy 2021, 178, 153–161. [Google Scholar] [CrossRef]
  25. Zheng, Y.; Hou, X.; Ma, X.; Hao, Z.; Ma, Z. Vitamin C-assisted fabrication of aerogels from industrial graphene oxide for gaseous hexamethyldisiloxane adsorption. Appl. Sci. 2021, 11, 8486. [Google Scholar] [CrossRef]
  26. Hu, J.; Shi, Z.; Wang, X.; Qiao, H.; Huang, H. Silver–modified porous 3D nitrogen-doped graphene aerogel: Highly efficient oxygen reduction electrocatalyst for Zn–Air battery. Electrochim. Acta 2019, 302, 216–224. [Google Scholar] [CrossRef]
  27. Wuamprakhon, P.; Krittayavathananon, A.; Ma, N.; Phattharasupakun, N.; Maihom, T.; Limtrakul, J.; Sawangphruk, M. Layered manganese oxide nanosheets coated on N-doped graphene aerogel for hydrazine detection: Reaction mechanism investigated by in situ electrochemical X-ray absorption spectroscopy. J. Electroanal. Chem. 2018, 808, 124–132. [Google Scholar] [CrossRef]
  28. Ranku, M.N.; Uwaya, G.E.; Fayemi, O.E. Electrochemical detection of dopamine at Fe3O4/SPEEK modified electrode. Molecules 2021, 26, 5357. [Google Scholar] [CrossRef]
  29. Li, J.; Ji, H.; Xu, Y.; Zhang, J.; Yan, Y. Three–dimensional graphene supported Fe3O4 coated by polypyrrole toward enhanced stability and microwave absorbing properties. J. Mater. Res. Technol. 2020, 9, 762–772. [Google Scholar] [CrossRef]
  30. Vinodhkumar, G.; Wilson, J.; Inbanathan, S.S.R.; Potheher, I.V.; Ashokkumar, M.; Peter, A.C. Solvothermal synthesis of magnetically separable reduced graphene oxide/Fe3O4 hybrid nanocomposites with enhanced photocatalytic properties. Phys. B Condens. Matter 2020, 580, 411752. [Google Scholar] [CrossRef]
  31. Lu, K.-Q.; Xin, X.; Zhang, N.; Tang, Z.-R.; Xu, Y.-J. Photoredox catalysis over graphene aerogel–supported composites. J. Mater. Chem. A 2018, 6, 4590–4604. [Google Scholar] [CrossRef]
  32. Cheng, S.; Guo, X.; Tan, P.; Yan, B.; Lin, M.; Cai, J.; Zhang, Y.; Cai, W.; Zhang, X.-A. A graphene aerogel with reversibly tunable thermal resistance for battery thermal management. J. Mater. Chem. A 2023, 11, 17779–17786. [Google Scholar] [CrossRef]
  33. Li, J.; Li, X.; Zhang, X.; Zhang, J.; Duan, Y.; Li, X.; Jiang, D.; Kozawa, T.; Naito, M. Development of graphene aerogels with high strength and ultrahigh adsorption capacity for gas purification. Mater. Des. 2021, 208, 109903. [Google Scholar] [CrossRef]
  34. Castaldo, R.; Avolio, R.; Cocca, M.; Errico, M.E.; Lavorgna, M.; Šalplachta, J.; Santillo, C.; Gentile, G. Hierarchically porous hydrogels and aerogels based on reduced graphene oxide, montmorillonite and hyper–crosslinked resins for water and air remediation. Chem. Eng. J. 2022, 430, 133162. [Google Scholar] [CrossRef]
  35. Shu, R.; Yang, X.; Zhao, Z. Fabrication of core-shell structure NiFe2O4@SiO2 decorated nitrogen–doped graphene composite aerogels towards excellent electromagnetic absorption in the Ku band. Carbon 2023, 210, 118047. [Google Scholar] [CrossRef]
  36. Xu, J.; Shu, R.; Wan, Z.; Shi, J. Construction of three–dimensional hierarchical porous nitrogen-doped reduced graphene oxide/hollow cobalt ferrite composite aerogels toward highly efficient electromagnetic wave absorption. J. Mater. Sci. Technol. 2023, 132, 193–200. [Google Scholar] [CrossRef]
  37. Shu, R.; Xu, J.; Shi, J. Construction of nitrogen-doped graphene-based ternary magnetic composite aerogel towards excellent electromagnetic absorption in the Ku-band. J. Alloys Compd. 2023, 956, 170349. [Google Scholar] [CrossRef]
  38. Wu, L.; Qin, Z.; Zhang, L.; Meng, T.; Yu, F.; Ma, J. CNT-enhanced amino-functionalized graphene aerogel adsorbent for highly efficient removal of formaldehyde. New J. Chem. 2017, 41, 2527–2533. [Google Scholar] [CrossRef]
  39. Sing, K.S.W.; Everett, D.H.; Haul, R.A.W.; Moscou, L.; Pierotti, R.A.; Rouquérol, J.; Siemieniewska, T. Reporting physisorption data for gas/solid systems—with special reference to the determination of surface area and porosity. Pure Appl. Chem. 1985, 57, 603–619. [Google Scholar] [CrossRef]
  40. Wang, Y.; Berthon-Fabry, S. One-pot synthesis of Fe-N-containing carbon aerogel for oxygen reduction reaction. Electrocatalysis 2020, 12, 78–90. [Google Scholar] [CrossRef]
  41. Meng, Z.; Hou, X.; Liu, Y.; Ma, Z.; Shen, H. Facile fabrication of iron–modified biochar as a renewable adsorbent for efficient siloxane (L2) removal. J. Environ. Chem. Eng. 2021, 9, 105799. [Google Scholar] [CrossRef]
  42. Bagheri, S.; Esrafili, A.; Kermani, M.; Mehralipour, J.; Gholami, M. Performance evaluation of a novel rGO–Fe0/Fe3O4–PEI nanocomposite for lead and cadmium removal from aqueous solutions. J. Mol. Liq. 2020, 320, 114422. [Google Scholar] [CrossRef]
  43. Kaur, A.; Kaur, J.; Singh, R.C. Graphene aerogel based room temperature chemiresistive detection of hydrogen peroxide: A key explosive ingredient. Sens. Actuators A 2018, 282, 97–113. [Google Scholar] [CrossRef]
  44. Rahmani, Z.; Rashidi, A.M.; Kazemi, A.; Samadi, M.T.; Rahmani, A.R. N-doped reduced graphene oxide aerogel for the selective adsorption of oil pollutants from water: Isotherm and kinetic study. J. Ind. Eng. Chem. 2018, 61, 416–426. [Google Scholar] [CrossRef]
  45. Ren, X.; Guo, H.; Feng, J.; Si, P.; Zhang, L.; Ci, L. Synergic mechanism of adsorption and metal–free catalysis for phenol degradation by N–doped graphene aerogel. Chemosphere 2018, 191, 389–399. [Google Scholar] [CrossRef] [PubMed]
  46. Wang, B.; Han, Y.; Chen, S.; Zhang, Y.; Li, J.; Hong, J. Construction of three–dimensional nitrogen–doped graphene aerogel (NGA) supported cobalt catalysts for Fischer-Tropsch synthesis. Catal. Today 2020, 355, 10–16. [Google Scholar] [CrossRef]
  47. Zhu, Y.; Yan, L.; Xu, M.; Li, Y.; Song, X.; Yin, L. Difference between ammonia and urea on nitrogen doping of graphene quantum dots. Colloids Surf. A 2021, 610, 125703. [Google Scholar] [CrossRef]
  48. Zhang, B.; Zhao, R.; Sun, D.; Li, Y.; Wu, T. Sustainable fabrication of graphene oxide/manganese oxide composites for removing phenolic compounds by adsorption-oxidation process. J. Clean. Prod. 2019, 215, 165–174. [Google Scholar] [CrossRef]
  49. Cong, H.P.; Ren, X.C.; Wang, P.; Yu, S.H. Macroscopic multifunctional graphene–based hydrogels and aerogels by a metal ion induced self–assembly process. ACS Nano 2012, 6, 2693–2703. [Google Scholar] [CrossRef]
  50. Liu, Y.; Gao, Z.; Ji, X.; Wang, Y.; Zhang, Y.; Sun, H.; Li, W.; Wang, L.; Duan, J. Efficient adsorption of tebuconazole in aqueous solution by calcium modified water hyacinth–based biochar: Adsorption kinetics, mechanism and feasibility. Molecules 2023, 28, 3478. [Google Scholar] [CrossRef]
  51. Wang, G.; Zhang, Z.; Hao, Z. Recent advances in technologies for the removal of volatile methylsiloxanes: A case in biogas purification process. Crit. Rev. Environ. Sci. Technol. 2019, 49, 2257–2313. [Google Scholar] [CrossRef]
  52. Wang, Z.; Muhammad, Y.; Tang, R.; Lu, C.; Yu, S.; Song, R.; Tong, Z.; Han, B.; Zhang, H. Dually organic modified bentonite with enhanced adsorption and desorption of tetracycline and ciprofloxacine. Sep. Purif. Technol. 2021, 274, 119059. [Google Scholar] [CrossRef]
  53. Darwish, A.A.A.; Rashad, M.; Al-Aoh, H.A. Methyl orange adsorption comparison on nanoparticles: Isotherm, kinetics, and thermodynamic studies. Dyes Pigment. 2019, 160, 563–571. [Google Scholar] [CrossRef]
  54. Finocchio, E.; Montanari, T.; Garuti, G.; Pistarino, C.; Federici, F.; Cugino, M.; Busca, G. Purification of biogases from siloxanes by adsorption: On the regenerability of activated carbon sorbents. Energy Fuel 2009, 23, 4156–4159. [Google Scholar] [CrossRef]
  55. Gislon, P.; Galli, S.; Monteleone, G. Siloxanes removal from biogas by high surface area adsorbents. Waste Manag. 2013, 33, 2687–2693. [Google Scholar] [CrossRef] [PubMed]
  56. Cabrera-Codony, A.; Gonzalez-Olmos, R.; Martin, M.J. Regeneration of siloxane–exhausted activated carbon by advanced oxidation processes. J. Hazard. Mater. 2015, 285, 501–508. [Google Scholar] [CrossRef]
Figure 1. N2 adsorption–desorption isotherm (77 K) and the corresponding pore size distribution (inset) of IGGO (a), Fe3O4–urea–rGOA–0.12 (b), Fe3O4–urea–rGOA–0.24 (c), Fe3O4–urea–rGOA–0.4 (d), Fe3O4–urea–rGOA–0.8 (e), and Fe3O4–urea–rGOA–1 (f).
Molecules 28 06622 g001
Figure 2. SEM and TEM of IGGO (a,b), SEM and TEM of Fe3O4–urea–rGOA–0.4 (c,d), XRD patterns of IGGO and Fe3O4–urea–rGOA–0.4 (e), FTIR spectra of IGGO and Fe3O4–urea–rGOA–0.4 (f), and Raman spectra of IGGO and Fe3O4–urea–rGOA–0.4 (g).
Molecules 28 06622 g002
Figure 3. Proposed mechanism of urea reduction, crosslinking, and Fe3O4 deposition.
Molecules 28 06622 g003
Figure 4. Breakthrough adsorption fitted curves of the IGGO and Fe3O4–urea–rGOAs for L2.
Molecules 28 06622 g004
Figure 5. Relationship curves between QB,thSBET (a), QB,thVmeso (b), QB,thVtot (c), and QB,thVmicro (d) for the Fe3O4–urea–rGOAs.
Molecules 28 06622 g005
Figure 6. The relationship between adsorption capacity and L2 inlet concentration (a) and the breakthrough curves for Fe3O4–urea–rGOA–0.4 by Yoon–Nelson model (b).
Molecules 28 06622 g006
Figure 7. Breakthrough curves for L2 of Fe3O4–urea–rGOA–0.4 in five cycles of adsorption/desorption.
Molecules 28 06622 g007
Figure 8. Schematic diagram of the preparation process of Fe3O4–urea–rGOA.
Molecules 28 06622 g008
Table 1. Texture properties of samples.
SamplesSBET
(m2 g−1)
Vtot
(cm3 g−1)
Vmicro
(cm3 g−1)
Vmeso
(cm3 g−1) a
Daver
(nm)
IGGO70.230.010.2213.18
Fe3O4–urea–rGOA–0.121240.590.060.535.02
Fe3O4–urea–rGOA–0.241600.670.110.564.95
Fe3O4–urea–rGOA–0.41880.770.190.583.94
Fe3O4–urea–rGOA–0.81780.740.160.584.88
Fe3O4–urea–rGOA–11620.680.120.564.95
a Vmeso = VtotVmicro.
Table 2. Adsorption parameters of IGGO and Fe3O4–urea–rGOAs for L2.
AdsorbentsExperimentalModel
tB/
min
QB/
mg g−1
Qm/
mg g−1
tB,th/
min
QB,th/
mg g−1
Qm,th/
mg g−1
KYNτ/
min
R2
IGGO0.533.95.80.654.85.234.060.720.9999
Fe3O4–urea–rGOA–0.128.0058.469.47.6055.668.71.599.420.9945
Fe3O4–urea–rGOA–0.2411.9487.298.211.6084.897.71.6313.380.9962
Fe3O4–urea–rGOA–0.413.77100.5110.913.88101.5112.41.7715.070.9945
Fe3O4–urea–rGOA–0.812.4891.2103.811.8686.7102.71.3114.100.9906
Fe3O4–urea–rGOA–111.7385.796.311.4883.995.41.7013.100.9946
Table 3. The statistical parameters of curves between QB,thSBET, QB,thVmeso, QB,thVtot, and QB,thVmicro for the Fe3O4–urea–rGOAs.
Statistical ParametersQB,thSBETQB,thVmesoQB,thVtotQB,thVmicro
Number of Points5555
Equationy = a + bx
Residual Sum of Squares14.68707.865633.874755.5914
Standard Deviation1.91621.40232.91013.7280
R-Square0.98380.99130.96260.9386
InterceptValue−27.6825−455.2833−87.062545.3823
Standard Error7.499425.424217.27125.7807
SlopeValue0.7141961.8600253.7942341.0927
Standard Error0.0457544.964424.892643.2595
Table 4. Influence of the temperature on the adsorption of L2 over Fe3O4–urea–rGOA–0.4 a.
TermValuetB,th/
min
QB,th/
mg g−1
Qm,th/
mg g−1
KYNτ/
min
R2
T/°C0 18.08132.2146.51.143120.660.9982
1016.28119.0131.81.190118.750.9979
1514.97109.4121.31.170517.490.9989
2513.88101.5112.41.281416.180.9963
3512.9594.7105.02.078614.370.9981
a Cin = 14.62 mg L−1, m = 0.10 g, and Vg = 50 mL min−1.
Disclaimer/Publisher’s Note: The statements, opinions and data contained in all publications are solely those of the individual author(s) and contributor(s) and not of MDPI and/or the editor(s). MDPI and/or the editor(s) disclaim responsibility for any injury to people or property resulting from any ideas, methods, instructions or products referred to in the content.

