Abstract
Trans-p-hydroxycinnamic acid and its esters in the leaves of Ligustrum robustum might be a new resource to prevent diabetes and its complications. In the present study, a new HPLC-UV method using hydrolyzation with sodium hydroxide for quantitation of trans-p-hydroxycinnamic acid and total trans-p-hydroxycinnamic acid esters in the leaves of L. robustum was developed, since it was difficult and troublesome to analyze no less than 34 trans-p-hydroxycinnamic acid esters by usual HPLC. The extract of L. robustum was hydrolyzed with sodium hydroxide at 80 °C for 2 h, and then, hydrochloride was added. HPLC analysis was performed in reverse phase mode using a C-18 column, eluting with methanol-0.1% acetic acid aqueous solution (40:60, v/v) in isocratic mode at a flow rate of 1.0 mL·min−1 and detecting at 310 nm. The linear range for trans-p-hydroxycinnamic acid was 11.0–352.0 μg·mL−1 (r2 = 1.000). The limit of detection and limit of quantification were 2.00 and 6.07 μg·mL−1, respectively. The relative standard deviations of intra-day and inter-day variabilities for trans-p-hydroxycinnamic acid were less than 2%. The percentage recovery of trans-p-hydroxycinnamic acid was 103.3% ± 1.1%. It is the first HPLC method using hydrolyzation for quantification of many carboxylic esters. Finally, the method was used successfully to determine trans-p-hydroxycinnamic acid and total trans-p-hydroxycinnamic acid esters in various extracts of the leaves of L. robustum. The 60–70% ethanol extracts of L. robustum showed the highest contents of free trans-p-hydroxycinnamic acid (3.96–3.99 mg·g−1), and the 50–80% ethanol extracts of L. robustum displayed the highest contents of total trans-p-hydroxycinnamic acid esters (202.6–210.6 mg·g−1). The method can be applied also to the quality control of the products of L. robustum.
1. Introduction
Ligustrum robustum (Roxb.) Blume, a plant of Oleaceae, is distributed widely in Southwest China, Burma, Vietnam, India, and Cambodia [1]. The leaves of L. robustum have been used as Ku-Ding-Cha, a functional tea to clear heat and remove toxins, in Southwest China for near 2000 years [2,3]. Additionally, L. robustum was served as a folk medicine to deal with diabetes, obesity, hypertension, and so on [3,4].
In the previous phytochemical studies [2,5,6,7,8,9,10,11,12,13,14,15,16,17], about 90 chemical constituents, including trans-p-hydroxycinnamic acid, 34 trans-p-hydroxycinnamic acid esters (Figure 1), flavonoid glycosides, lignan glycosides, and other compositions, were isolated and identified from the leaves of L. robustum.
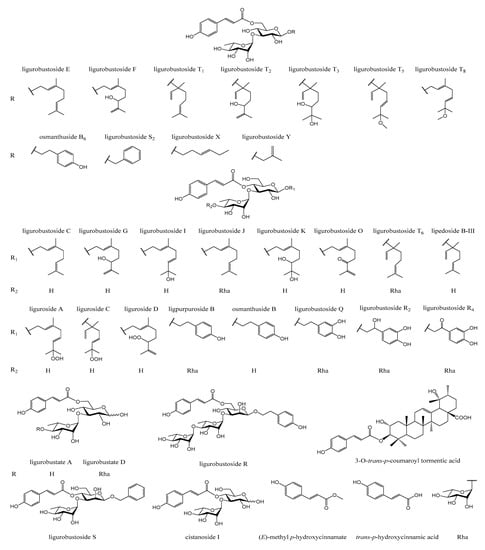
Figure 1.
Structures of trans-p-hydroxycinnamic acid and its esters isolated from the leaves of L. robustum.
In our previous biological investigations [14,15,16,17], the chemical compositions isolated from the leaves of L. robustum were tested, and the results showed that (1) trans-p-hydroxycinnamic acid displayed stronger α-glucosidase inhibitory activity than the positive control acarbose; (2) trans-p-hydroxycinnamic acid and several trans-p-hydroxycinnamic acid esters displayed no weaker fatty acid synthase (FAS) inhibitory activities than the positive control orlistat; (3) trans-p-hydroxycinnamic acid and a lot of trans-p-hydroxycinnamic acid esters revealed stronger 2,2′-azino-bis(3-ethylbenzthiazoline-6-sulphonic acid) ammonium salt (ABTS) radical scavenging effects than the positive control L-(+)-ascorbic acid and revealed moderate α-amylase inhibitory activities. What is more, trans-p-hydroxycinnamic acid esters might be hydrolyzed with catalysis of carboxylesterase or gastric acid in vivo [18,19] and release trans-p-hydroxycinnamic acid, meaning that trans-p-hydroxycinnamic acid esters are the prodrugs of trans-p-hydroxycinnamic acid. In addition, it was reported that natural products with inhibitory activities on α-glucosidase, α-amylase, and FAS as well as an antioxidant effect might be a new resource to prevent diabetes and its complications, which affected nearly 10.5% of the population in the world and led to serious mortality [17]. Therefore, trans-p-hydroxycinnamic acid and its esters isolated from L. robustum might be a novel resource for preventing diabetes and its complications.
It was significant to analyze the contents of trans-p-hydroxycinnamic acid and its esters in the leaves of L. robustum. Some HPLC methods for the simultaneous determination of trans-p-hydroxycinnamic acid and several other compositions have been published [20,21,22], but the quantitative analytical method for trans-p-hydroxycinnamic acid and its esters in the leaves of L. robustum has not been reported so far. HPLC is a common and accurate method to simultaneously analyze several compositions [20,21,22], but it was difficult and troublesome to determine 34 trans-p-hydroxycinnamic acid esters by usual HPLC. In addition, there might be other unknown trans-p-hydroxycinnamic acid esters in the leaves of L. robustum. In the present study, thus, a new HPLC-UV method using hydrolyzation with sodium hydroxide for quantitation of trans-p-hydroxycinnamic acid and total trans-p-hydroxycinnamic acid esters in the leaves of L. robustum was developed and validated. Moreover, the proposed method was applied successfully to the determination and comparison of trans-p-hydroxycinnamic acid and total trans-p-hydroxycinnamic acid esters in various extracts of the leaves of L. robustum.
2. Results and Discussion
2.1. Method Development
2.1.1. Optimization of the Chromatographic Conditions
The raw powder of the dried leaves of L. robustum was extracted with 70% (v/v) ethanol (25 mL·g−1) under reflux for 1 h. And the trans-p-hydroxycinnamic acid esters in the extracting solution of L. robustum were hydrolyzed with sodium hydroxide at 80 °C for 2 h. In order to quantify the free trans-p-hydroxycinnamic acid in the original extracting solution and the potential trans-p-hydroxycinnamic acid (including the free trans-p-hydroxycinnamic acid in the original extracting solution and the trans-p-hydroxycinnamic acid released from the trans-p-hydroxycinnamic acid esters) in the hydrolyzed extracting solution of L. robustum, several chromatographic items were considered. The first factor was the stationary phase. When using C-18 column (4.6 mm × 250 mm, 5 μm) or C-8 column (4.6 mm × 250 mm, 5 μm), eluting with methanol-0.1% acetic acid aqueous solution (40:60, v/v) and detecting at 310 nm, the resolution value of trans-p-hydroxycinnamic acid from other compositions was more than 1.5 and 1.2, respectively. The second factor was the mobile phase. Methanol, acetonitrile, and ultrapure water in different volumes were tried, and methanol–water (40:60, v/v), without glacial acetic acid, showed acceptable resolution value but with tailed peak. Consequently, glacial acetic acid was added to improve the resolution and peak shape. Furthermore, the UV detector was successfully applied for the detection of the compositions, and the wavelength of 310 nm gave the maximum sensitivity at 30 °C (Supplementary Figure S1). Generally, the optimal HPLC performance (Figure 2) was observed when using C-18 column (4.6 mm × 250 mm, 5 μm), eluting with methanol-0.1% acetic acid aqueous solution (40:60, v/v) at a flow rate of 1.0 mL·min−1, and detecting at 310 nm.
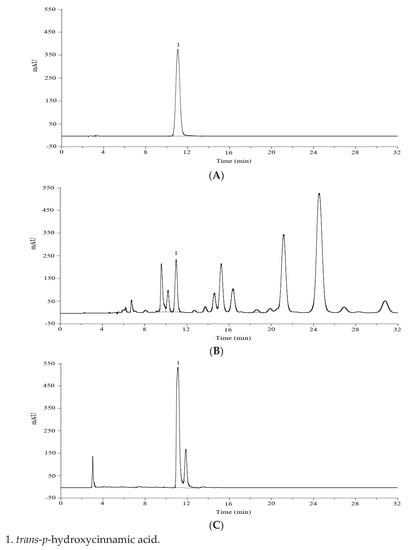
Figure 2.
HPLC chromatograms of trans-p-hydroxycinnamic acid (A),
the original extract of L. robustum (B), and the hydrolyzed extract of L. robustum (C).
2.1.2. Optimization of the Hydrolyzed Conditions of Trans-p-Hydroxycinnamic Acid Esters
The hydrolyzed conditions of trans-p-hydroxycinnamic acid esters in the extracting solution of L. robustum were optimized by single factor test with the content of potential trans-p-hydroxycinnamic acid as the index. The first factor was the catalyst of hydrolyzation. The extracting solution of L. robustum was hydrolyzed with different catalysts (hydrochloride, sodium hydroxide) at 80 °C for 2 h; then, the catalyst was neutralized, and trans-p-hydroxycinnamic acid sodium salt was transformed into trans-p-hydroxycinnamic acid. The content of potential trans-p-hydroxycinnamic acid in the hydrolyzed extracting solution was analyzed by HPLC at the optimal chromatographic conditions. As shown in Table 1, the content of potential trans-p-hydroxycinnamic acid hydrolyzed with sodium hydroxide (66.0 ± 0.5 mg·g−1) was higher than those hydrolyzed with hydrochloride (62.0 ± 0.5 mg·g−1). The second factor was incubation temperature. The extracting solution of L. robustum was hydrolyzed with sodium hydroxide at 30–90 °C for 2 h; then, hydrochloride was added, and trans-p-hydroxycinnamic acid sodium salt was transformed into trans-p-hydroxycinnamic acid. The content of potential trans-p-hydroxycinnamic acid hydrolyzed at 80 °C (66.2 ± 0.5 mg·g−1) was the highest (Table 1). The third factor was period of incubation. The extracting solution of L. robustum was hydrolyzed with sodium hydroxide at 80 °C for 1–6 h; then, hydrochloride was added, and trans-p-hydroxycinnamic acid sodium salt was transformed into trans-p-hydroxycinnamic acid. The content of potential trans-p-hydroxycinnamic acid hydrolyzed for 2 h (66.0 ± 0.5 mg·g−1) was the highest (Table 1). Therefore, the optimal hydrolyzed conditions were as follows: 1 mL sodium hydroxide aqueous solution (1 M) was added into 1 mL the extracting solution of L. robustum and incubated at 80 °C for 2 h, and then, 1 mL hydrochloride (1 M) solution was added (Figure 3).

Table 1.
The results of hydrolyzation of trans-p-hydroxycinnamic acid esters in the extract of L. robustum.
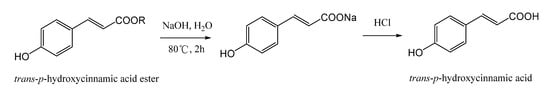
Figure 3.
Hydrolyzation of trans-p-hydroxycinnamic esters.
2.1.3. Calculation of the Total Concentration of Trans-p-hydroxycinnamic Esters in the Extracting Solution of L. robustum
The total concentration of trans-p-hydroxycinnamic esters (Ct,
µmol·mL−1) in the extracting solution of L. robustum was calculated with the following equation:
Ct = Cp − Cf
Cp (µmol·mL−1): The concentration of potential trans-p-hydroxycinnamic acid (molecular weight: 164.16) in the hydrolyzed extracting solution of L. robustum. It was calculated as Cp (µg·mL−1)/164.16.
Cf (µmol·mL−1): The concentration of free trans-p-hydroxycinnamic acid in the original extracting solution of L. robustum. It was calculated as Cf (µg·mL−1)/164.16.
Osmanthuside B (molecular weight: 592.59) was considered as a representation of trans-p-hydroxycinnamic acid esters because of its moderate molecular weight and high content (49.6 mg·g−1) in the leaves of L. robustum. Consequently, Ct (µg·mL−1) might be calculated approximatively as Ct (µmol·mL−1) × 592.59.
In order to overcome some drawbacks of the usual HPLC method, such as the analysis of the compositions lacking chromophore groups, chemical derivatization with appropriate reagents before HPLC-UV analysis is generally used [23]. Therefore, to deal with the difficulty and trouble of the determination of no less than 34 trans-p-hydroxycinnamic acid esters by usual HPLC, these esters were hydrolyzed with sodium hydroxide before HPLC-UV analysis in the present study. This method was simple and rapid, which greatly simplified the analytical process. Nevertheless, the shortcoming of the method is that the total content of the trans-p-hydroxycinnamic acid esters is clear, but the specific content of every ester is not clear.
2.2. Method Validation
2.2.1. Specificity
The peak of trans-p-hydroxycinnamic acid (retention time 10.89
±
0.02 min) was clearly identified in the chromatogram of the standard solution (Figure 2A), while a main peak was also confirmed at the same retention time in the chromatograms of the original extract of L. robustum (Figure 2B) and the hydrolyzed extract of L. robustum (Figure 2C). The resolutions between trans-p-hydroxycinnamic acid and other compositions in the real samples were more than 1.5 (Figure 2). In addition, the purity factors of the peak of trans-p-hydroxycinnamic acid in Figure 2B,C were 978.45 and 951.87, respectively. These data demonstrated that the other components in the real samples hardly interfered with the peak of trans-p-hydroxycinnamic acid, reflecting the specificity of the method.
2.2.2. Linearity and Calibration Curve
The calibration curve for trans-p-hydroxycinnamic acid was obtained by external standard method, using six concentrations of the standard, with three injections per concentration (Supplementary Table S1). The chromatogram peak areas were plotted against the corresponding concentrations of the standard solutions to establish the calibration curve (Supplementary Figure S2), and linear regression equation was calculated by the least squares method. This HPLC method showed linear regression at concentrations from 11.0 to 352.0
μg·mL−1
, and the determination coefficient (r2) was 1.000 (Table 2), indicating excellent linearity.
Table 2.
Results of regression equation, determination coefficient, linear range, LOD, and LOQ for trans-p-hydroxycinnamic acid by HPLC.
2.2.3. Limit of Detection and Limit of Quantification
The standard deviation of the Y-intercept in the regression equation was used as the residual standard deviation [24]. Consequently, the limit of detection (LOD) and limit of quantification (LOQ) were 2.00 and 6.07 μg·mL−1, respectively (Table 2).
2.2.4. Precision
In order to validate the precision of this HPLC-UV method, the hydrolyzed extract of L. robustum was determined at three different concentrations, and the relative standard deviations (RSD) were calculated from the results of repeated measurements for each concentration. The measurement was performed three times in the same day to obtain the intra-day variability and carried out three times in three different days to give the inter-day variability. The RSDs of intra-day and inter-day variabilities for trans-p-hydroxycinnamic acid were less than 2% (Table 3), indicating that the precision of this method was in accordance with the criterion recommended by the International Council for Harmonisation of Technical Requirements for Pharmaceuticals for Human Use (ICH) guidelines [24].
Table 3.
Intra-day and inter-day variabilities for trans-p-hydroxycinnamic acid.
2.2.5. Accuracy
To evaluate the accuracy of this analytical method, a recovery experiment was performed in triplicate at three concentration levels. The extracting solution of L. robustum, which was spiked with 50%, 100%, or 150% of its native amount of potential trans-p-hydroxycinnamic acid, was hydrolyzed with sodium hydroxide. The potential trans-p-hydroxycinnamic acid in the hydrolyzed solution was analyzed. And the percentage recovery was calculated. As showed in Table 4, the percentage recovery of trans-p-hydroxycinnamic acid was 103.3% ± 1.1%, indicating that the interference of the small peak overlapping slightly with the trans-p-hydroxycinnamic acid peak (Figure 2C) was little, and the accuracy of the method was acceptable.
Table 4.
Results of accuracy validation for trans-p-hydroxycinnamic acid.
2.2.6. System Suitability Parameters
The soundness of the method was tested by recording the parameters of the system suitability, and the results for trans-p-hydroxycinnamic acid in Figure 2B,C are presented in Table 5.
2.2.7. Robustness
The robustness is the ability of a method to remain unaffected by slight and deliberate changes in the experimental conditions. The robustness of the analytical method was assessed by testing the influence of slight changes in column temperature (30 ± 5 °C), flow rate (1.0 ± 0.2 mL·min−1), mobile phase composition (40% ± 2% methanol), and wavelength (310 ± 2 nm). The RSD of the peak area of trans-p-hydroxycinnamic acid was found to be in the range of 0.55–0.98% (Table 6). In all cases, the RSD was less than 2%, indicating the robustness of the optimized method [25].
Table 6.
Results of robustness validation for trans-p-hydroxycinnamic acid.
2.3. Quantification of Trans-p-Hydroxycinnamic Acid and Total Trans-p-Hydroxycinnamic Acid Esters in Various Extracts of L. robustum
The dried leaves (10.00 g) of L. robustum were extracted with 90 mL ethanol aqueous solution (30%, 40%, 50%, 60%,70%, 80%, v/v) under reflux for 60 min, and the contents of trans-p-hydroxycinnamic acid and total trans-p-hydroxycinnamic acid esters in the extracts were determined by the above developed and validated method. The results are presented in Table 7. The 60–70% ethanol extracts of L. robustum showed the highest contents of free trans-p-hydroxycinnamic acid (3.96–3.99 mg·g−1), while the 30% ethanol extract of L. robustum showed the lowest content of free trans-p-hydroxycinnamic acid (2.26 mg·g−1). In addition, the 50–80% ethanol extracts of L. robustum displayed the highest contents of total trans-p-hydroxycinnamic acid esters (202.6–210.6 mg·g−1), while the 30% ethanol extract of L. robustum displayed the lowest content of total trans-p-hydroxycinnamic acid esters (125.8 mg·g−1). Taken together, 60–70% ethanol was the optimal extraction solvent for trans-p-hydroxycinnamic acid and its esters.
Table 7.
Quantification of trans-p-hydroxycinnamic acid and total trans-p-hydroxycinnamic acid esters in the extracts of L. robustum depending on extraction solvent.
2.4. Similarity of HPLC Chromatograms
3. Materials and Methods
3.1. Chemicals and Reagents
Methanol (HPLC) was afforded by Saimo Fisher Scientific Co., Ltd. (Shanghai, China). Ethanol (AR) was purchased from Chengdu Kelong Chemical Co., Ltd. (Chengdu, China). Glacial acetic acid, sodium hydroxide, and hydrochloride (AR) were acquired from Shanghai Aladdin Biochemical Technology Co., Ltd. (Shanghai, China). The standard of trans-p-hydroxycinnamic acid (>98% purity) was isolated and identified in our laboratory from the leaves of L. robustum, as previously described [14]. Ultrapure water was obtained from an ultra-pure water purifier system (Chengdu Yuechun Scientific Co., Ltd., Chengdu, China).
3.2. Plant Material
The leaves of L. robustum (Ku-Ding-Cha), which were collected in August 2021 and dried at 100–120 °C for 1 h, were purchased from Junlian Qing-Shan-Lu-Shui Tea Co., Ltd. (Yibin, China). The material was crushed by hand before extraction (≤0.5 cm).
3.3. Hydrolyzation of Extracting Solution and Preparation of Solutions
Standard solution of trans-p-hydroxycinnamic acid: the stock solution of trans-p-hydroxycinnamic acid was diluted with 40% (v/v) methanol to obtain 6 standard solutions at 11.0, 22.0, 44.0, 88.0, 176.0, and 352.0 μg·mL−1 and filtered through a 0.45 μm PTFE syringe filter (Millipore, Billerica, MA, USA) before HPLC analysis.
Test solution of original extract: the original extracting solution of L. robustum was diluted with 40% (v/v) methanol and percolated using a 0.45 μm PTFE syringe filter prior to HPLC measurement.
Test solution of hydrolyzed extract: 1 mL sodium hydroxide aqueous solution (1 M) and 1 mL the extracting solution of L. robustum were mixed and incubated at 80 °C for 2 h [26], and then, 1 mL hydrochloride (1 M) solution was added. After it cooled down to room temperature, the above mixture solution was transferred to 10 mL volumetric flask, and the volume was filled with 40% (v/v) methanol. The diluted solution was filtered with a 0.45 μm PTFE syringe filter prior to HPLC determination.
3.4. HPLC Determination of Trans-p-Hydroxycinnamic Acid and Total Trans-p-Hydroxycinnamic Acid Esters
HPLC analysis was performed on a LC-20AT HPLC system (Shimadzu Corporation, Kyoto, Japan) with a SPD-20A UV-VIS detector and a binary pump. The standard solution or test solution (20 μL) was injected onto a Phenomenex Luna C18(2) 100A column (4.6 mm × 250 mm, 5 μm) thermostated at 30 °C. The components were eluted with methanol-0.1% acetic acid aqueous solution (40:60, v/v) at a flow rate of 1.0 mL·min−1 in isocratic mode [21]. The signals at 310 nm were monitored. The results were processed in LabSolutions Analysis Station (Shimadzu Corporation, Kyoto, Japan).
3.5. HPLC Validation
The analytical method was validated for specificity, linearity, LOD, LOQ, precision, accuracy, system suitability, and robustness according to the relevant ICH guidelines [24].
3.5.1. Specificity
To assess the specificity of the analytical method and exclude interference from other components in the real samples, the retention times for the real samples and the standard reference were compared. In addition, the resolutions between trans-p-hydroxycinnamic acid and other compositions in the real samples and the peak purity of trans-p-hydroxycinnamic acid were determined.
3.5.2. Linearity
The standard solutions of trans-p-hydroxycinnamic acid at different concentrations (11.0–352.0 μg·mL−1) were introduced to the HPLC system in triplicate. The calibration curve of trans-p-hydroxycinnamic acid was drawn by plotting the peak areas against the corresponding concentrations. The determination coefficient (r2) of the regression equation was obtained to validate the linearity.
3.5.3. LOD and LOQ
The LOD value was calculated as 3.3 σ/S, while the LOQ value was calculated as 10 σ/S, in which σ was the residual standard deviation of the regression equation, and S was the calibration curve slope.
3.5.4. Precision
In order to validate the precision of the analytical method, the hydrolyzed extract of L. robustum at three different concentrations (66.0, 132.0, 264.0 μg·mL−1) was used to evaluate the intra-day and inter-day variabilities. The standard solutions were analyzed in triplicate in the same day to obtain the intra-day variability and measured three times in three different days to give the inter-day variability.
3.5.5. Accuracy
In order to validate the accuracy of the analytical method, the recovery of trans-p-hydroxycinnamic acid was determined by the standard addition method. Trans-p-hydroxycinnamic acid standard (1.3, 2.6 or 3.9 mg) was added into 1 mL the extracting solution of L. robustum which contained 2.64 mg potential trans-p-hydroxycinnamic acid and then hydrolyzed with sodium hydroxide. The potential trans-p-hydroxycinnamic acid in the hydrolyzed solution was analyzed by the HPLC method. And the percentage recovery of trans-p-hydroxycinnamic acid was obtained from the results.
3.5.6. System Suitability
System suitability test was carried out to verify the system, method and column performance. The original extract of L. robustum and the hydrolyzed extract of L. robustum were analyzed in triplicate. The retention time, resolution, tailing factor, theoretical plates, and injection precision for trans-p-hydroxycinnamic acid were calculated by LabSolutions Analysis Station.
3.5.7. Robustness
The robustness of the HPLC-UV method was verified by applying minor and deliberate changes in the experimental conditions, including column temperature (30 ± 5 °C), flow rate (1.0 ± 0.2 mL·min−1), mobile phase composition (40% ± 2% methanol), and wavelength (310 ± 2 nm) [27]. One parameter was changed at a time by keeping all other parameters at the optimized level. The RSD of the peak area of trans-p-hydroxycinnamic acid was calculated.
3.6. Similarity of HPLC Chromatograms
A newly improved extent similarity method was used to calculate the similarity index of HPLC chromatograms [28], and the similarity of HPLC chromatogram A with HPLC chromatogram B was calculated by following equation:
ai: The peak area of the i common peak in HPLC chromatogram A.
bi: The peak area of the i common peak in HPLC chromatogram B.
n: The amount of the common peaks in HPLC chromatograms A and B.
3.7. Statistical Analyses
Statistical analyses were carried out on GraphPad Prism 5.01. Every sample was determined in triplicate. The results are recorded as mean ± standard deviation (SD). Difference of means between groups was analyzed by one-way analysis of variance (ANOVA) on statistical package SPSS 25.0. The difference between groups was believed to be significant when p < 0.05.
4. Conclusions
In the present study, a new optimized HPLC-UV method for the quantification of trans-p-hydroxycinnamic acid and total trans-p-hydroxycinnamic acid esters in the leaves of L. robustum was developed and validated in accordance with ICH guidelines. Because it was difficult and troublesome to analyze no less than 34 trans-p-hydroxycinnamic acid esters by usual HPLC, these esters were hydrolyzed with sodium hydroxide, and then, the potential trans-p-hydroxycinnamic acid was determined by HPLC-UV. The above analytical method was simple and rapid, which simplified greatly the analytical process. Additionally, the methodology validation, including specificity, linearity, LOD, LOQ, precision, accuracy, system suitability, and robustness, showed that the new HPLC-UV method was acceptable. To the best of our knowledge, it is the first HPLC method using hydrolyzation for quantification of many carboxylic esters. Finally, the novel method was used successfully to measure the contents of trans-p-hydroxycinnamic acid and total trans-p-hydroxycinnamic acid esters in various extracts of the leaves of L. robustum. The similarity of the HPLC chromatogram of the original extract of L. robustum with the HPLC chromatogram of the hydrolyzed extract of L. robustum was 0.103. The method can also be applied to the quality control of the products of L. robustum.
Supplementary Materials
The following supporting information can be downloaded at: https://www.mdpi.com/article/10.3390/molecules28145309/s1, Table S1: The concentrations and peak areas of trans-p-hydroxycinnamic acid standard; Figure S1: UV spectrum of trans-p-hydroxycinnamic acid; Figure S2: Calibration curve for trans-p-hydroxycinnamic acid.
Author Contributions
Conceptualization, S.-H.L.; methodology, S.-H.L. and X.-N.L.; formal analysis, S.-H.L. and X.-N.L.; investigation, X.-N.L., X.-J.N., R.C., X.-X.L. and S.-H.L.; data curation, S.-H.L.; writing—original draft preparation, S.-H.L. and X.-N.L.; writing—review and editing, X.-X.L.; supervision, S.-H.L.; funding acquisition, S.-H.L. All authors have read and agreed to the published version of the manuscript.
Funding
This study was funded by the Guangxi Natural Science Foundation Project (grant number: 2020GXNSFAA297129), Guangxi Science and Technology Base and Talents Special Project (grant number: Guike AD21075006), and Youjiang Medical University for Nationalities Science Research Project (grant number: yy2021sk004).
Institutional Review Board Statement
Not applicable.
Informed Consent Statement
Not applicable.
Data Availability Statement
The data presented in this study are available in Supplementary Materials.
Acknowledgments
The authors are obliged to Ying Li, Jin-Ling Nong, and Yan-Fang Su, College of Pharmacy, Youjiang Medical University for Nationalities, for some help in the work.
Conflicts of Interest
The authors declare no conflict of interest. The funders had no role in the design of the study; in the collection, analyses, or interpretation of data; in the writing of the manuscript; or in the decision to publish the results.
Sample Availability
Not available.
References
- Lau, K.M.; He, Z.D.; Dong, H.; Fung, K.P.; But, P.P.-H. Anti-oxidative, anti-inflammatory and hepato-protective effects of Ligustrum robustum. J. Ethnopharmacol. 2002, 83, 63–71. [Google Scholar] [CrossRef]
- He, Z.D.; Lau, K.M.; But, P.P.-H.; Jiang, R.W.; Dong, H.; Ma, S.C.; Fung, K.P.; Ye, W.C.; Sun, H.D. Antioxidative glycosides from the leaves of Ligustrum robustum. J. Nat. Prod. 2003, 66, 851–854. [Google Scholar] [CrossRef]
- Zhu, F.; Cai, Y.Z.; Sun, M.; Ke, J.X.; Lu, D.Y.; Corke, H. Comparison of major phenolic constituents and in vitro antioxidant activity of diverse kudingcha genotypes from Ilex kudingcha, Ilex cornuta, and Ligustrum robustum. J. Agric. Food Chem. 2009, 57, 6082–6089. [Google Scholar] [CrossRef]
- Yang, R.M.; Liu, F.; He, Z.D.; Ji, M.; Chu, X.X.; Kang, Z.Y.; Cai, D.Y.; Gao, N.N. Anti-obesity effect of total phenylpropanoid glycosides from Ligustrum robustum Blume in fatty diet-fed mice via up-regulating leptin. J. Ethnopharmacol. 2015, 169, 459–465. [Google Scholar] [CrossRef] [PubMed]
- Li, L.; Peng, Y.; Xu, L.J.; Wu-Lan, T.N.; Shi, R.B.; Xiao, P.G. Chemical constituents from Ligustrum robustum Bl. Biochem. Syst. Ecol. 2010, 38, 398–401. [Google Scholar] [CrossRef]
- Li, L.; Peng, Y.; Liu, Y.; Xu, L.J.; Guo, N.; Shi, R.B.; Xiao, P.G. Two new phenethanol glycosides from Ligustrum robustum. Chin. Chem. Lett. 2011, 22, 326–329. [Google Scholar] [CrossRef]
- Tian, J.; Zhang, H.J.; Sun, H.D.; Pan, L.T.; Yao, P.; Chen, D.Y. Monoterpenoid glycosides from Ligustrum robustum. Phytochemistry 1998, 48, 1013–1018. [Google Scholar] [CrossRef]
- Tian, J.; Sun, H.D. New monoterpenoid glycosides from Ligustrum robustum. Chin. J. Appl. Environ. Biol. 1999, 5, 501–506. [Google Scholar]
- Yu, Z.L.; Zeng, W.C. Antioxidant, antibrowning, and cytoprotective activities of Ligustrum robustum (Roxb.) Blume extract. J. Food Sci. 2013, 78, 1354–1362. [Google Scholar] [CrossRef]
- Yu, Z.L.; Gao, H.X.; Zhang, Z.; He, Z.; He, Q.; Jia, L.R.; Zeng, W.C. Inhibitory effects of Ligustrum robustum (Roxb.) Blume extract on α-amylase and α-glucosidase. J. Funct. Foods 2015, 19, 204–213. [Google Scholar] [CrossRef]
- Ito, H.; Otsuki, A.; Mori, H.; Li, P.; Kinoshita, M.; Kawakami, Y.; Tsuji, H.; Fang, D.Z.; Takahashi, Y. Two new monoterpene glycosides from Qing Shan Lu Shui tea with inhibitory effects on leukocyte-type 12-lipoxygenase activity. Molecules 2013, 18, 4257–4266. [Google Scholar] [CrossRef]
- Kawakami, Y.; Otsuki, A.; Mori, Y.; Kanzaki, K.; Suzuki-Yamamoto, T.; Fang, D.Z.; Ito, H.; Takahashi, Y. Involvement of the hydroperoxy group in the irreversible inhibition of leukocyte-type 12-lipoxygenase by monoterpene glycosides contained in the Qing Shan Lu Shui tea. Molecules 2019, 24, 304. [Google Scholar] [CrossRef] [PubMed]
- Zhao, N.; Zhang, Z.-W.; Li, C.-C.; Yang, R.-M.; Pan, R.-L. Chemical constituents of alcoholic extract from Ligustrum robustum (Roxb.) Blume. Mod. Chin. Med. 2018, 20, 540–544. [Google Scholar]
- Lu, S.-H.; Zuo, H.-J.; Shi, J.-X.; Li, C.-R.; Li, Y.-H.; Wang, X.; Li, L.-R.; Huang, J. Two new glycosides from the leaves of Ligustrum robustum and their antioxidant activities and inhibitory effects on α-glucosidase and α-amylase. S. Afr. J. Bot. 2019, 125, 521–526. [Google Scholar] [CrossRef]
- Lu, S.-H.; Huang, J.; Zuo, H.-J.; Zhou, Z.-B.; Yang, C.-Y.; Huang, Z.-L. Monoterpenoid glycosides from the leaves of Ligustrum robustum and their bioactivities. Molecules 2022, 27, 3709. [Google Scholar] [CrossRef]
- Lu, S.-H.; Zuo, H.-J.; Huang, J.; Chen, R.; Pan, J.-P.; Li, X.-X. Phenylethanoid and phenylmethanoid glycosides from the leaves of Ligustrum robustum and their bioactivities. Molecules 2022, 27, 7390. [Google Scholar] [CrossRef]
- Lu, S.-H.; Zuo, H.-J.; Huang, J.; Li, W.-N.; Huang, J.-L.; Li, X.-X. Chemical constituents from the leaves of Ligustrum robustum and their bioactivities. Molecules 2023, 28, 362. [Google Scholar] [CrossRef]
- You, Q.-D. Drug metabolism. In Medicinal Chemistry, 8th ed.; People’s Medical Publishing House: Beijing, China, 2016; pp. 46–62. ISBN 978-7-117-22151-1. [Google Scholar]
- Zhang, Y.-T.; Sun, Y.-M.; Zhang, J.-H.; Huo, Y.; Li, X.; Li, W.-B.; Zhao, A.-P.; Wang, R. Interaction between gut microbiota and drugs. Chin. Pharm. Bull. 2020, 36, 1650–1655. [Google Scholar]
- Kang, X.R.; Wang, Q.H.; Ao, S.; Moxiyele; Bao, W.L.; Zhao, C.L. HPLC analysis of 16 compounds from Artemisia ordosica. Chin. Herb. Med. 2023, 15, 337–342. [Google Scholar] [CrossRef]
- Chelly, S.; Chelly, M.; Salah, H.B.; Athmouni, K.; Bitto, A.; Sellami, H.; Kallel, C.; Bouaziz-Ketata, H. HPLC-DAD analysis, antioxidant and protective effects of Tunisian Rhanterium suaveolens against acetamiprid induced oxidative stress on mice erythrocytes. Chem. Biodivers. 2019, 16, e1900428. [Google Scholar] [CrossRef]
- Al-Huqail, A.A.; Behiry, S.I.; Salem, M.Z.M.; Ali, H.M.; Siddiqui, M.H.; Salem, A.Z.M. Antifungal, antibacterial, and antioxidant activities of Acacia Saligna (Labill.) H. L. Wendl. flower extract: HPLC analysis of phenolic and flavonoid compounds. Molecules 2019, 24, 700. [Google Scholar] [CrossRef]
- Pencheva, D.; Teneva, D.; Denev, P. Validation of HPLC method for analysis of gamma-amino butyric and glutamic acids in plant foods and medicinal plants. Molecules 2023, 28, 84. [Google Scholar] [CrossRef] [PubMed]
- Kim, T.H.; Shin, H.Y.; Park, S.Y.; Kim, H.; Chung, D.K. Development and validation of a method for determining the quercetin-3-O-glucuronide and ellagic acid content of common evening primrose (Oenothera biennis) by HPLC-UVD. Molecules 2021, 26, 267. [Google Scholar] [CrossRef]
- Attimarad, M.; Venugopala, K.N.; Sreeharsha, N.; Chohan, M.S.; Shafi, S.; Nair, A.B.; Pottathil, S. A rapid HPLC method for the concurrent determination of several antihypertensive drugs from binary and ternary formulations. Separations 2021, 8, 86. [Google Scholar] [CrossRef]
- Duncan, L.F.; Wang, G.Q.; Ilyichova, O.V.; Scanlon, M.J.; Heras, B.; Abbott, B.M. The fragment-based development of a benzofuran hit as a new class of Escherichia coli DsbA inhibitors. Molecules 2019, 24, 3756. [Google Scholar] [CrossRef] [PubMed]
- Naseef, H.; Moqadi, R.; Qurt, M. Development and validation of an HPLC method for determination of antidiabetic drug alogliptin benzoate in bulk and tablets. J. Anal. Methods Chem. 2018, 2018, 1902510. [Google Scholar] [CrossRef]
- Wang, S.-H.; Cao, X.-L.; Song, S.-S.; Long, L.-M. Development of certified reference materials for Xinyang Maojian tea grading based on HPLC fingerprints of flavor components. Food Sci. 2019, 40, 293–301. [Google Scholar] [CrossRef]
Disclaimer/Publisher’s Note: The statements, opinions and data contained in all publications are solely those of the individual author(s) and contributor(s) and not of MDPI and/or the editor(s). MDPI and/or the editor(s) disclaim responsibility for any injury to people or property resulting from any ideas, methods, instructions or products referred to in the content. |
© 2023 by the authors. Licensee MDPI, Basel, Switzerland. This article is an open access article distributed under the terms and conditions of the Creative Commons Attribution (CC BY) license (https://creativecommons.org/licenses/by/4.0/).