Article

Influence of Al2O3 Overlayers on Intermolecular Interactions between Metal Oxide Bound Molecules

Department of Chemistry and Biochemistry, Florida State University, Tallahassee, FL 32306-4390, USA
*
Author to whom correspondence should be addressed.
Molecules 2023, 28(12), 4835; https://doi.org/10.3390/molecules28124835
Submission received: 1 May 2023 / Revised: 2 June 2023 / Accepted: 14 June 2023 / Published: 17 June 2023

Abstract

:
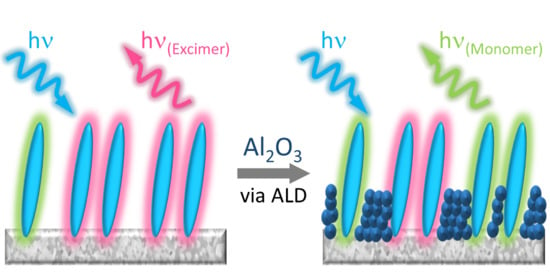
Intermolecular interactions on inorganic substrates can have a critical impact on the electrochemical and photophysical properties of the materials and subsequent performance in hybrid electronics. Critical to the intentional formation or inhibition of these processes is controlling interactions between molecules on a surface. In this report, we investigated the impact of surface loading and atomic-layer-deposited Al2O3 overlayers on the intermolecular interactions of a ZrO2-bound anthracene derivative as probed by the photophysical properties of the interface. While surface loading density had no impact on the absorption spectra of the films, there was an increase in excimer features with surface loading as observed by both emission and transient absorption. The addition of ALD overlayers of Al2O3 resulted in a decrease in excimer formation, but the emission and transient absorption spectra were still dominated by excimer features. These results suggest that ALD may provide a post-surface loading means of influencing such intermolecular interactions.

Graphical Abstract

1. Introduction

Strong intermolecular interactions, especially with large aromatic molecules, can result in emergent multi-molecular phenomena such as aggregation [1], excimer formation [2], triplet–triplet annihilation (TTA) [3], singlet fission [4], and charge transfer [5], among others. These interactions can occur in solution, particularly at high concentrations, but are typically amplified in the solid state when molecules are adsorbed or chemically bound to a surface [6]. Sometimes these interactions are detrimental, as is the case in dye-sensitized devices when bimolecular non-radiative decay pathways or excimer emission outcompetes excited state electron injection [7,8,9]. However, intermolecular interactions can be beneficial when broadened absorption [1], photon upconversion via TTA (TTA-UC) [10,11], and singlet fission [12,13,14] are used to increase solar energy conversion efficiencies.
Critical to the intentional formation or inhibition of these processes is controlling interactions between molecules on a surface. Historically this has been achieved through changing the solvent [15], metal oxide pre-treatments [16], adding molecular steric bulk [17,18], shifting the position of surface binding groups [19,20], using inert co-adsorbants [21,22,23], or varying the surface loading density [15].
Here we describe our effort using metal oxide overlayers generated via atomic layer deposition (ALD) to influence intermolecular interactions on a metal oxide surface. ALD typically involves alternating cycles of a transition metal precursor and oxidant for the self-limiting generation of uniform metal oxide layers [21]. Previously, it has been shown that low-temperature ALD is sufficiently gentle for the growth of metal oxide layers on molecule functionalized metal oxide surfaces [22,23]. This results in increased stability [24], improved catalytic activity [25], inhibited lateral hole hopping [26], and enhanced solar cell performance [22,23]. Here we use ALD to deposit aluminum oxide (Al2O3) on a ZrO2 surface functionalized with phosphonated 9,10-bis(phenylethynyl)anthracene (A in Figure 1) to investigate the impact of Al2O3 deposition on the photophysical properties and intermolecular interactions at a dye–metal oxide interface.

2. Results and Discussion

2.1. Surface Loading

2.1.1. A on ZrO2

The dye–metal oxide system of interest for this study is ((anthracene-9,10-diylbis(ethyne-2,1-diyl))bis(4,1-phenylene))bis(phosphonic acid) (A) bound to a mesoporous ZrO2 surface (ZrO2-A) as depicted in Figure 1. A was selected as the chromophore because it was previously prepared in our lab for use in an upconversion solar cell [3]. Additionally, derivatives of the 9,10-bis(phenylethynyl)anthracene chromophores are known to undergo a variety of intermolecular processes including TTA-UC [3], singlet fission [4,27], and excimer formation [2,27]. ZrO2 was selected as the metal oxide substrate, as opposed to the more common TiO2 because its relatively high conduction band allows the investigation of the excited state dynamics in the absence of competitive electron injection into the substrate [28,29]. The preparation of mesoporous ZrO2 films is described in Section 3.2.
Dye loading was achieved by soaking the ZrO2 films in DMSO solutions of A at 90 °C. The surface coverage (Γ) with respect to loading time and concentration was monitored using UV-Vis spectroscopy and the results are shown in Figure S1. Γ was calculated using Equation (1) [30],
Γ = (Aabs)/ε(λ))/1000
where A and ε are the absorbance and extinction coefficient (7084 cm2 mol−1, Figure S2) for A at 475 nm, respectively. From fitting the concentration dependent isotherms [31], a maximum surface coverage (Γmax) of 240 nmol cm−2 was obtained for soaking in 250 µM A. For subsequent studies, the 100%, 50%, and 10% A-loaded films were obtained by soaking ZrO2 in a 250 µM DMSO solution of A for 5 min, 30 min, and 24 h, respectively, at 90 °C.

2.1.2. Zn(OAc)2 Treatment

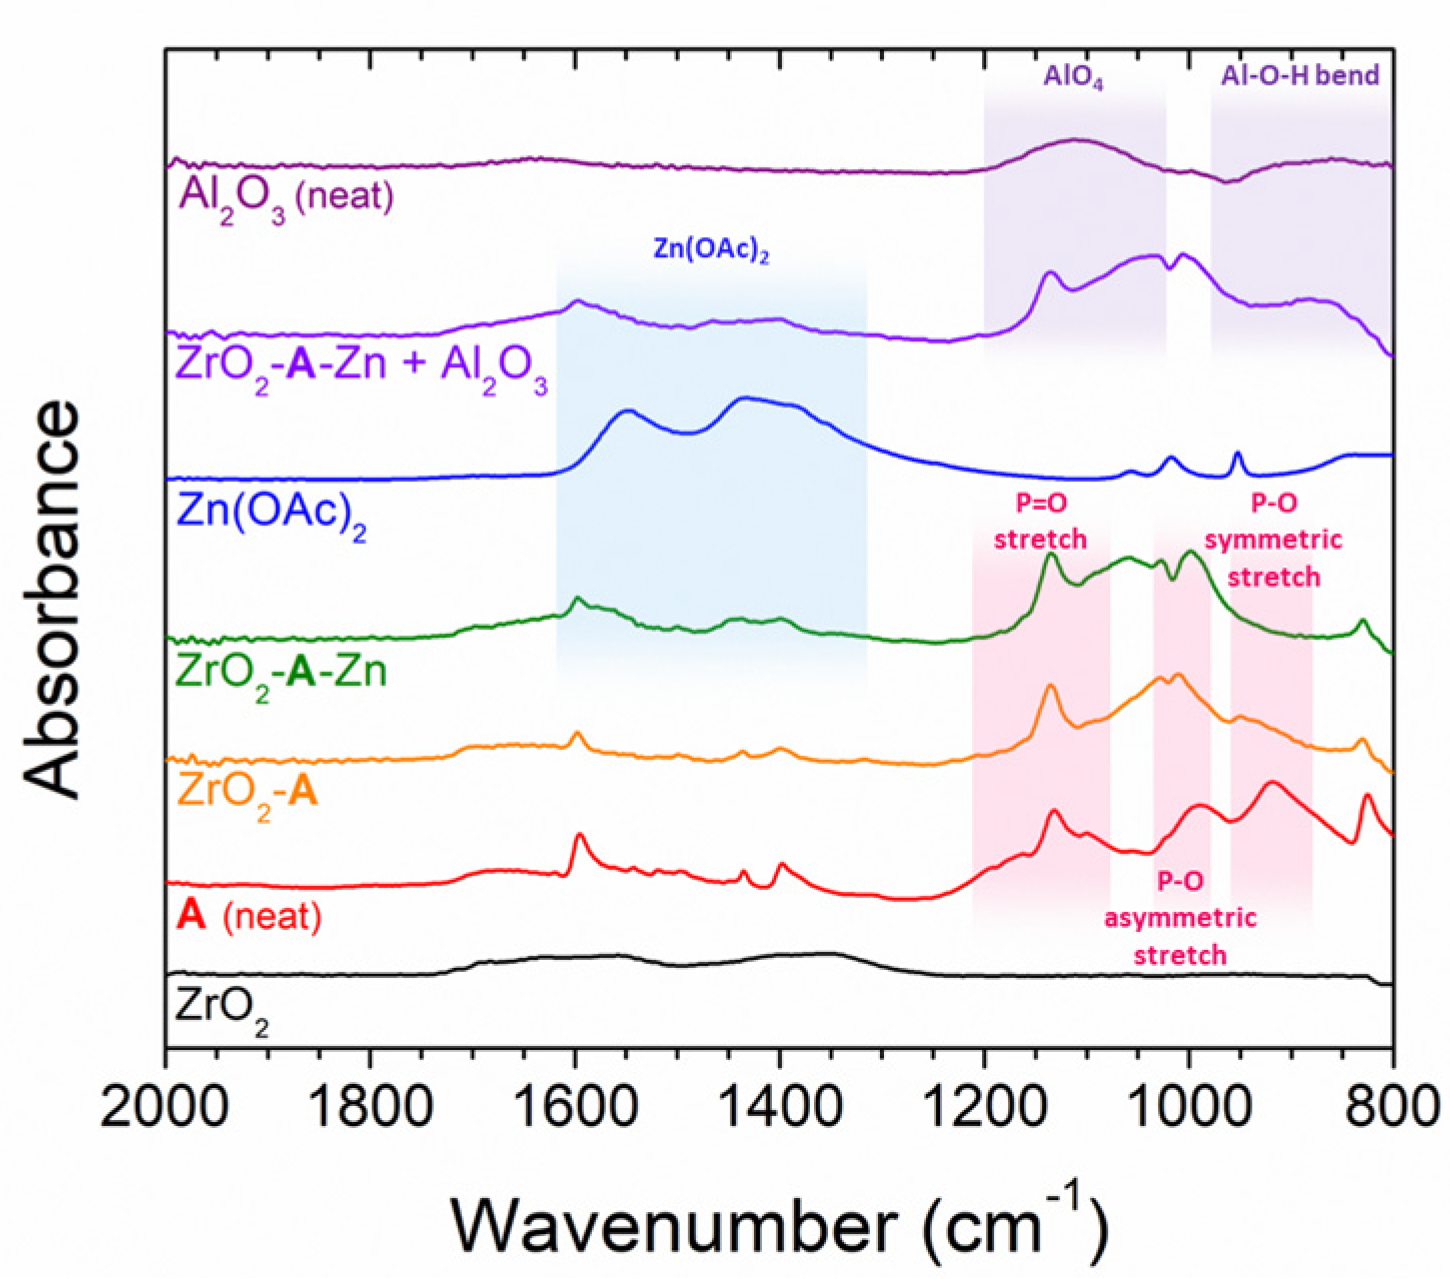
Trimethyl aluminum (TMA) from ALD treatments is known to react with hydroxyl groups of both the metal oxide surface and the phosphonate groups of surface bound molecules [32,33]. To hinder any possible reaction between TMA and A, we “capped” A using a Zn(OAc)2 treatment. That is, ZrO2-A slides were soaked in a 0.5 µM solution of Zn(OAc)2 in methanol for 2 h and the coordination was monitored using ATR-IR (Figure 2).
The ATR-IR spectrum of ZrO2-A has spectral contributions from both ZrO2 and A. The decrease in amplitude of the 1180 cm−1 and 920 cm−1 peaks of neat A is attributed to one of the two geometrically opposed phosphonate groups binding to the ZrO2 surface [34,35]. Following treatment of ZrO2-A with Zn(OAc)2 there is a shift of the 1010 cm−1 peak to 1000 cm−1 and a further decrease in the 920 cm−1 peak of A, as well as new contribution of acetate features at 1550 cm−1 and 1430 cm−1. These observations are consistent with the coordination of zinc acetate to the non-surface bound PO3H2 group of A (i.e., ZrO2-A-Zn) [34]. It is important to note that previous work has shown that zinc coordination has minimal impact on the photophysical properties of ZrO2-A [3].

2.1.3. Al2O3 Overlayers

Al2O3 overlayers were deposited on ZrO2-A-Zn via ALD using alternating cycles of TMA and water (see Section 3.3 for details). Following ALD treatment of ZrO2-A-Zn the ATR-IR spectrum of the film (ZrO2-A-Zn + ALD in Figure 2) exhibits an additional AlO4 stretching feature at 880 cm−1 and Al-O-H bending feature at 1115 cm−1 that are consistent with the formation of Al2O3 [36]. The amplitude of the Al2O3 related IR features increase with increase with increasing cycles of ALD (Figure S4). Similarly, as measured by X-ray fluorescence (XRF), the amount of Al relative to Zr and Zn increases with increasing cycles of ALD (Figure S3, Table S1). Ten and twenty-five cycles of ALD were somewhat arbitrarily chosen for subsequent studies as to partially and completely surround A-Zn in Al2O3 as depicted in Figure 1. The height of the Al2O3 layers, relative to the molecule, is estimated from the well-established growth rate of 1.0–1.3 Å per cycle of TMA/H2O at 100 °C [37,38,39,40,41]. However, these deposition rates are for planar surfaces not functionalized with a molecule. However, the actual deposition rate and Al2O3 height in the ZrO2-A-Zn films is not known. Nevertheless, it can be concluded from ATR-IR and X-ray fluorescence (XRF) measurements that (1) Al2O3 is being formed and (2) the amount increases with the number of ALD cycles (Figures S3 and S4, Table S1). With that said, the above thickness estimate is not unreasonable, as related work with 80 cycles of TMA/H2O on dye-functionalized mesoporous metal oxide used TEM shows the expected overlayer thickness [42] and uniform distribution of Al2O3 in the mesoporous films [43].

2.2. Photophysical Properties of ZrO2-A

Prior to investigating the impact of ALD on film photophysics, we measured the surface loading dependence on the absorption and emission properties of ZrO2-A in acetonitrile. ZrO2-A films with 100%, 50%, and 10% loading of A were compared with the properties of A in DMSO (i.e., sol’n).
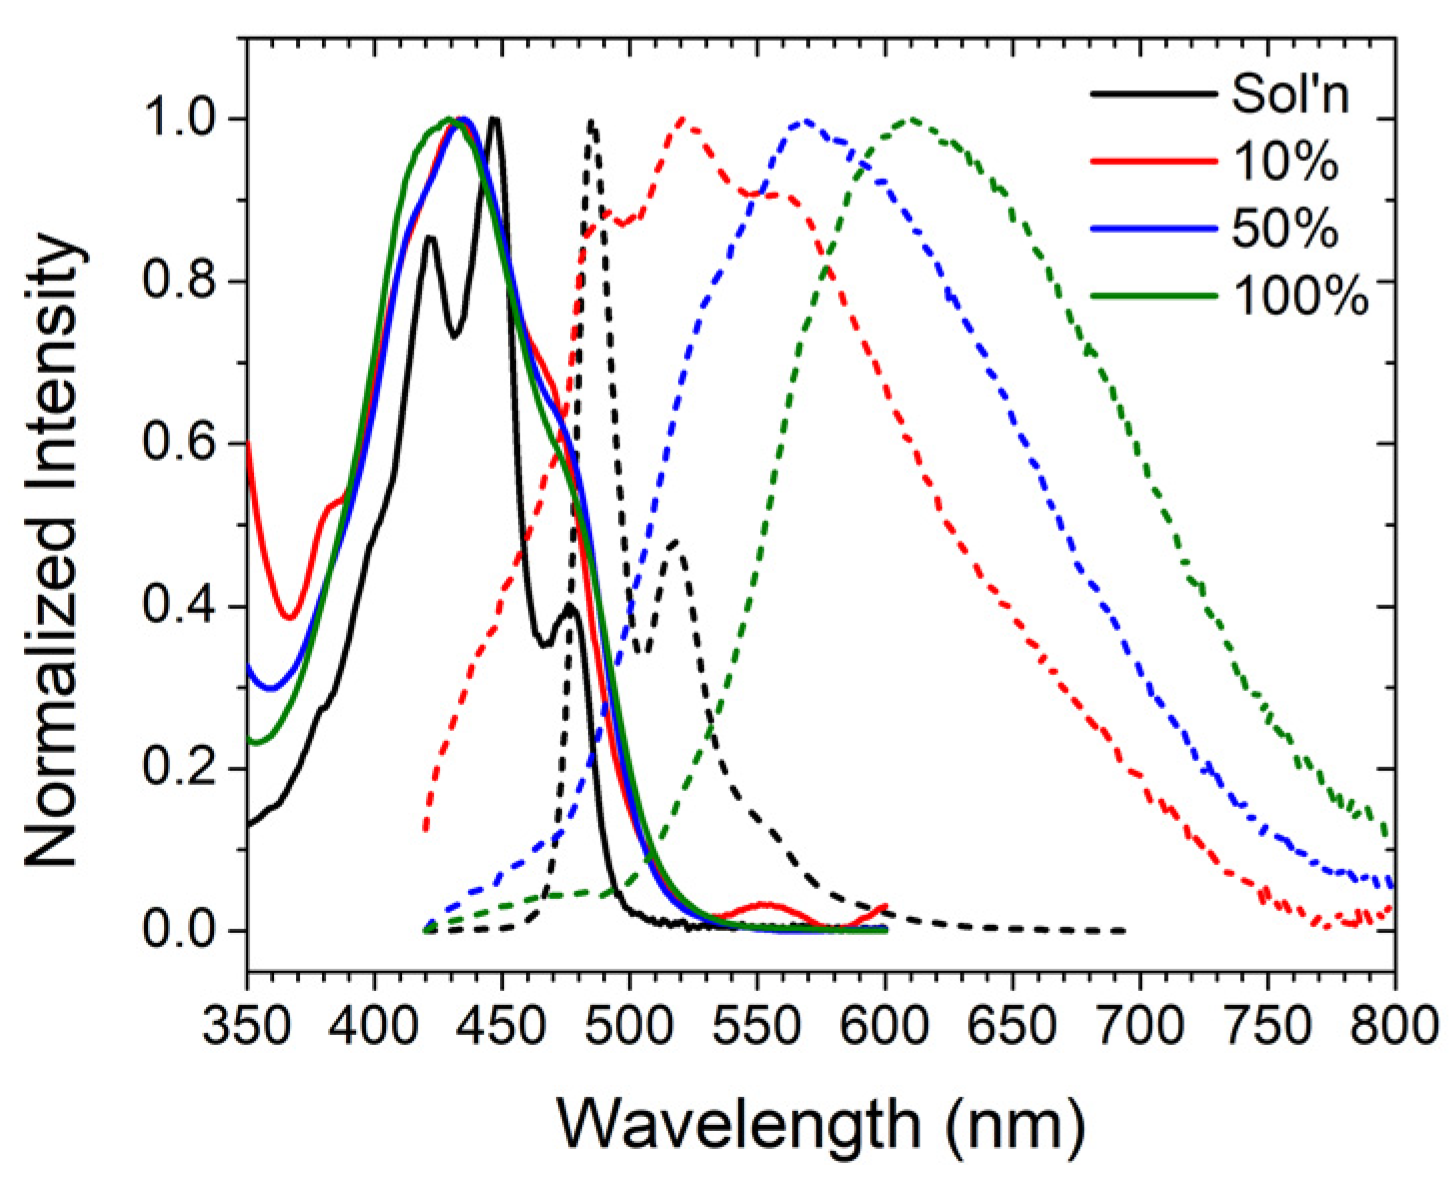
In contrast to the structured absorption observed for A in solution, there is notable peak broadening when bound to ZrO2. This behavior is common at dye–metal oxide interfaces and is typically attributed to inhomogeneous broadening due to variations in the local environment on the surface [44]. It is notable that there is minimal change in the energy of absorption and the spectra were similar regardless of surface loading (Figure 3).
Emission from A in solution is also highly structured with a maximum at 485 nm that is consistent with emission from the singlet excited state of 9,10-bis(phenylethynyl)anthracene [45]. For the 10%-loaded ZrO2-A sample, the 485 nm emission peak and vibrational structure are observed but are accompanied by a broad lower energy emission band from 500–800 nm. This new emission band becomes increasingly prominent for the 50%- and 100%-loaded films, with the latter being almost exclusively lower-energy emissions, with a peak at 610 nm. This feature has been observed previously for other solid-state bis(phenylethynyl)anthracene samples, and is attributed to excimer emission [27,46]. Interestingly, one would expect a homogeneously distributed 10%-loaded ZrO2-A film to exhibit only single molecule emission (i.e., with the molecules spaced out) but the presence of both monomer and excimer emission suggests a surface composed of both isolated A molecules and regions of at least two directly adjacent A molecules even with the most dilute sample measured here (i.e., 10% ZrO2-A).
The emission decay kinetics were monitored using time-correlated single photon counting, and the results are shown in Figure S6. Emission kinetics from A in DMSO were fit with a single exponential decay equation giving a lifetime of 2.6 ns at all wavelengths.
Likely due to inhomogeneities of the films as well as the multicomponent nature of the samples, decay kinetics from ZrO2-A could not be fit with a single exponential function. Similarly attempts at global analysis (i.e., singular value decomposition) failed to converge or provided physically unrealistic results. Consequently, the decays were fit with a biexponential function with the amplitude (Ax) and lifetimes (τx) of each component as well as the weighted average lifetime (τw) summarized in Table 1. The 10%-loaded ZrO2-A film exhibits lifetimes of 3.7 ns at 500 nm and 10.4 ns at 600 nm, which are dominated by monomer and excimer emission, respectively. At increased surface loading, the lifetime increases, likely due to the increased contribution from the slower, low energy peak. These results are consistent with previous surface loading concentration dependent excimer formation in pyrenes [47,48,49,50].
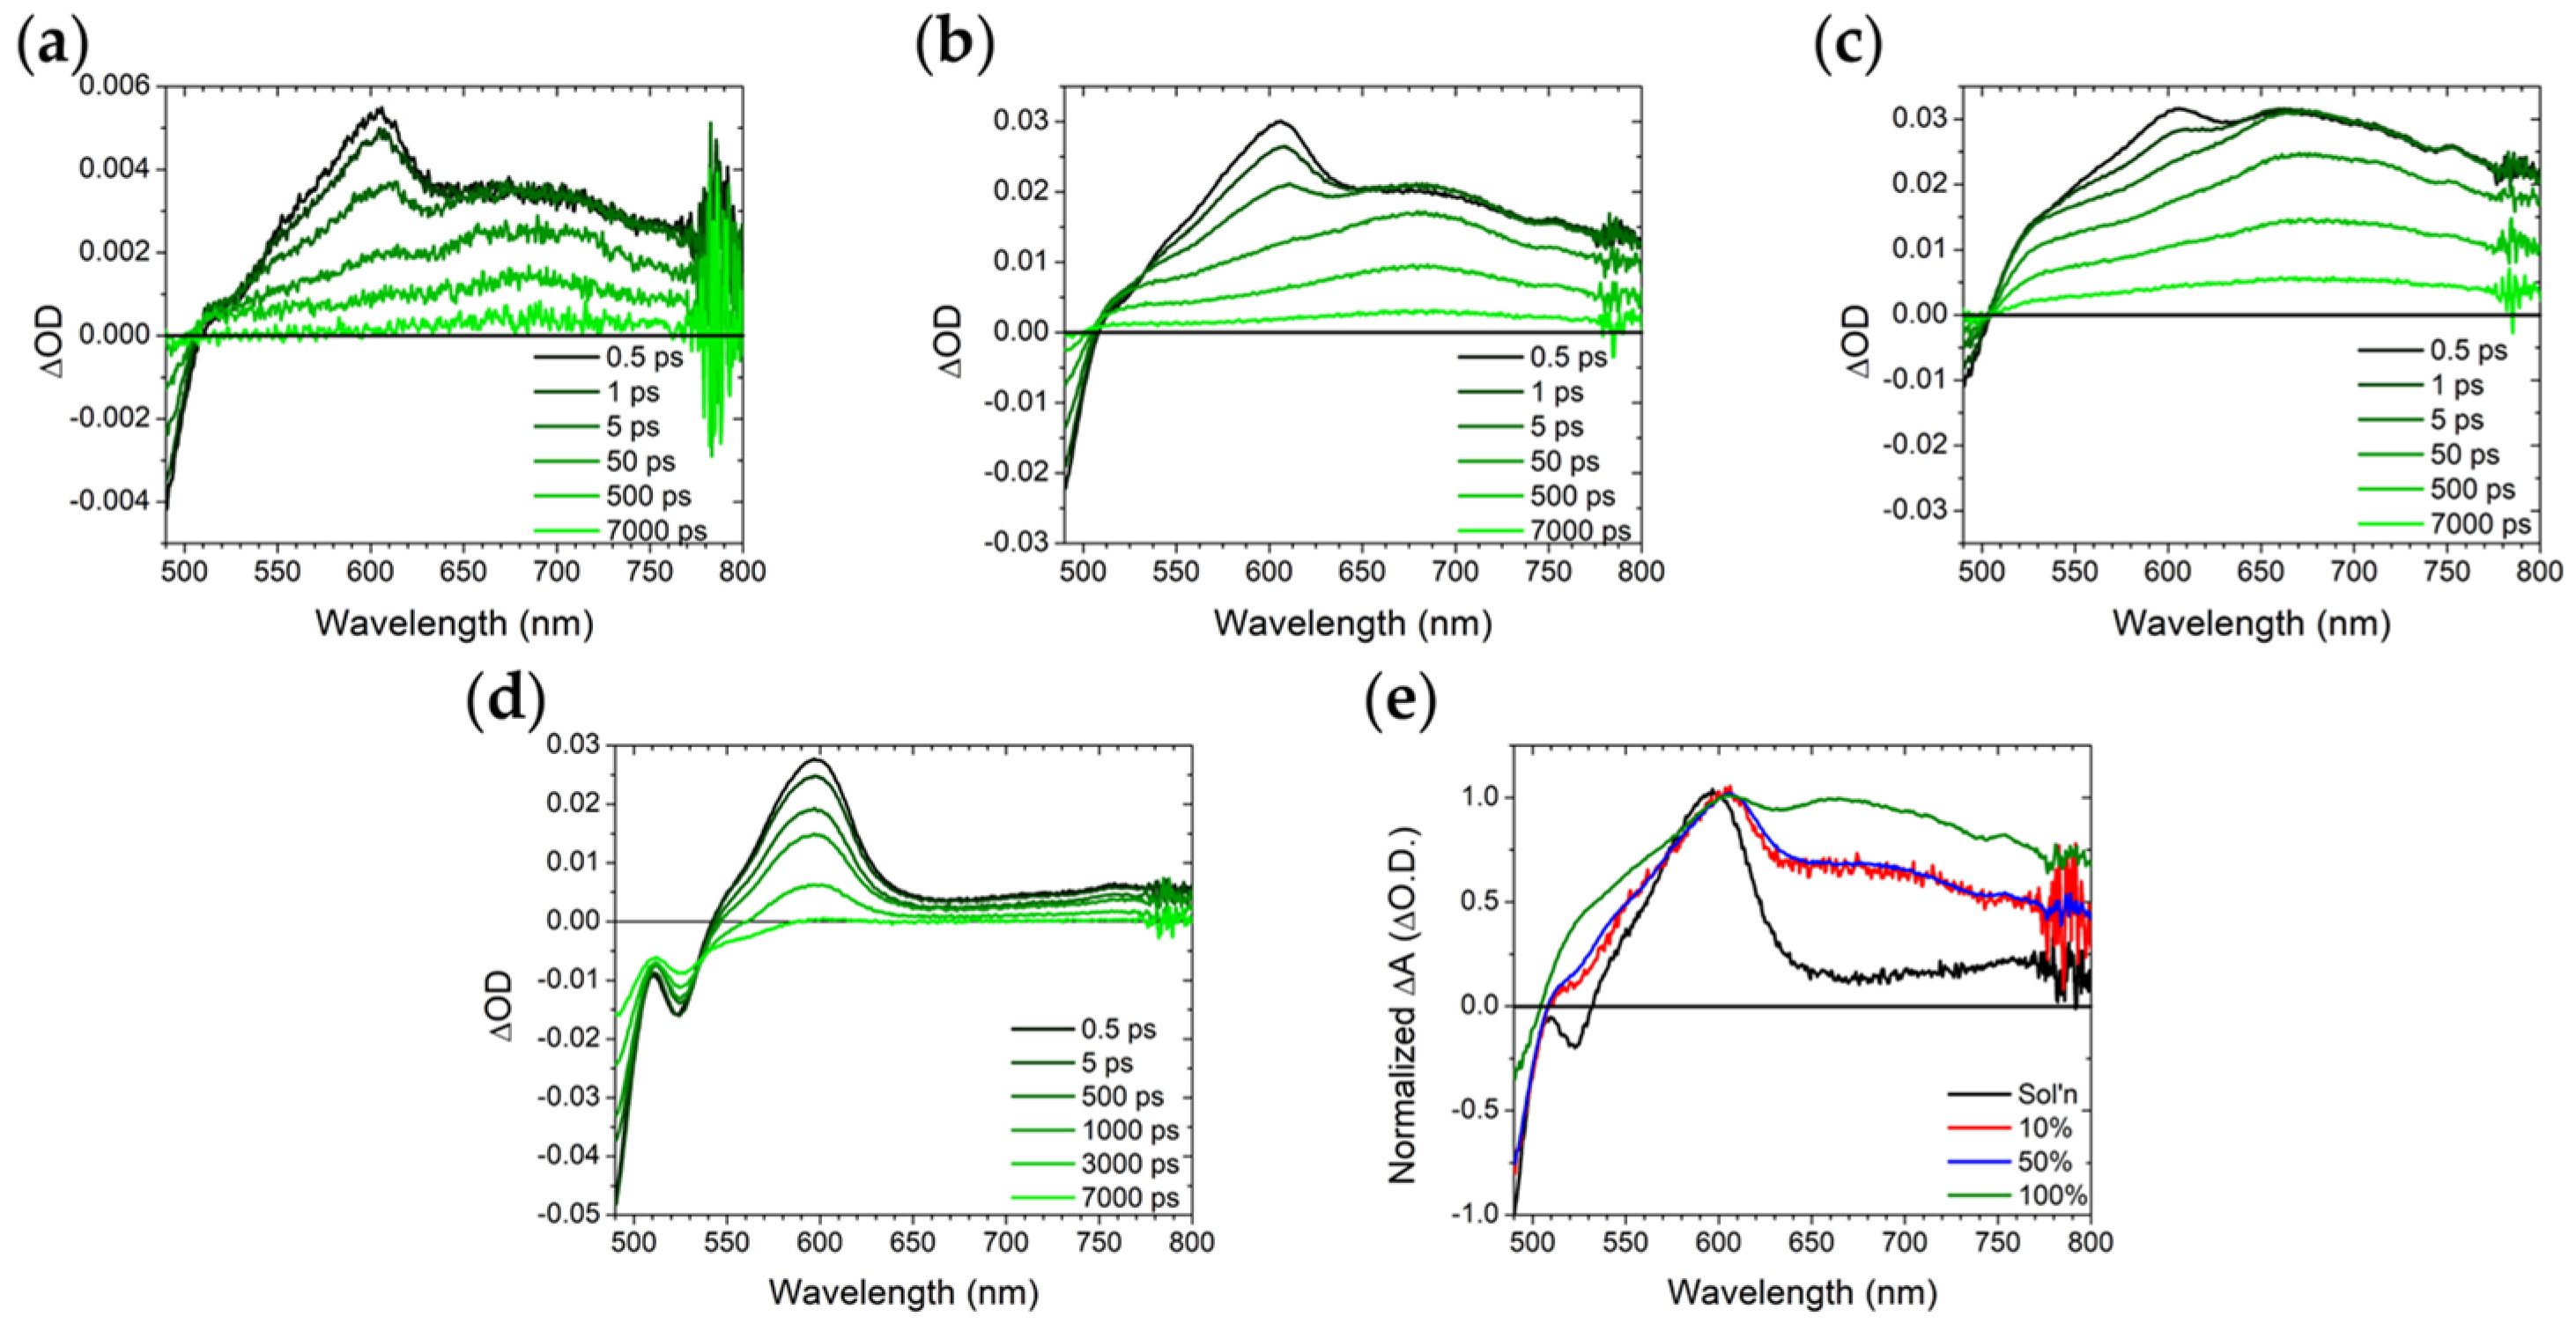
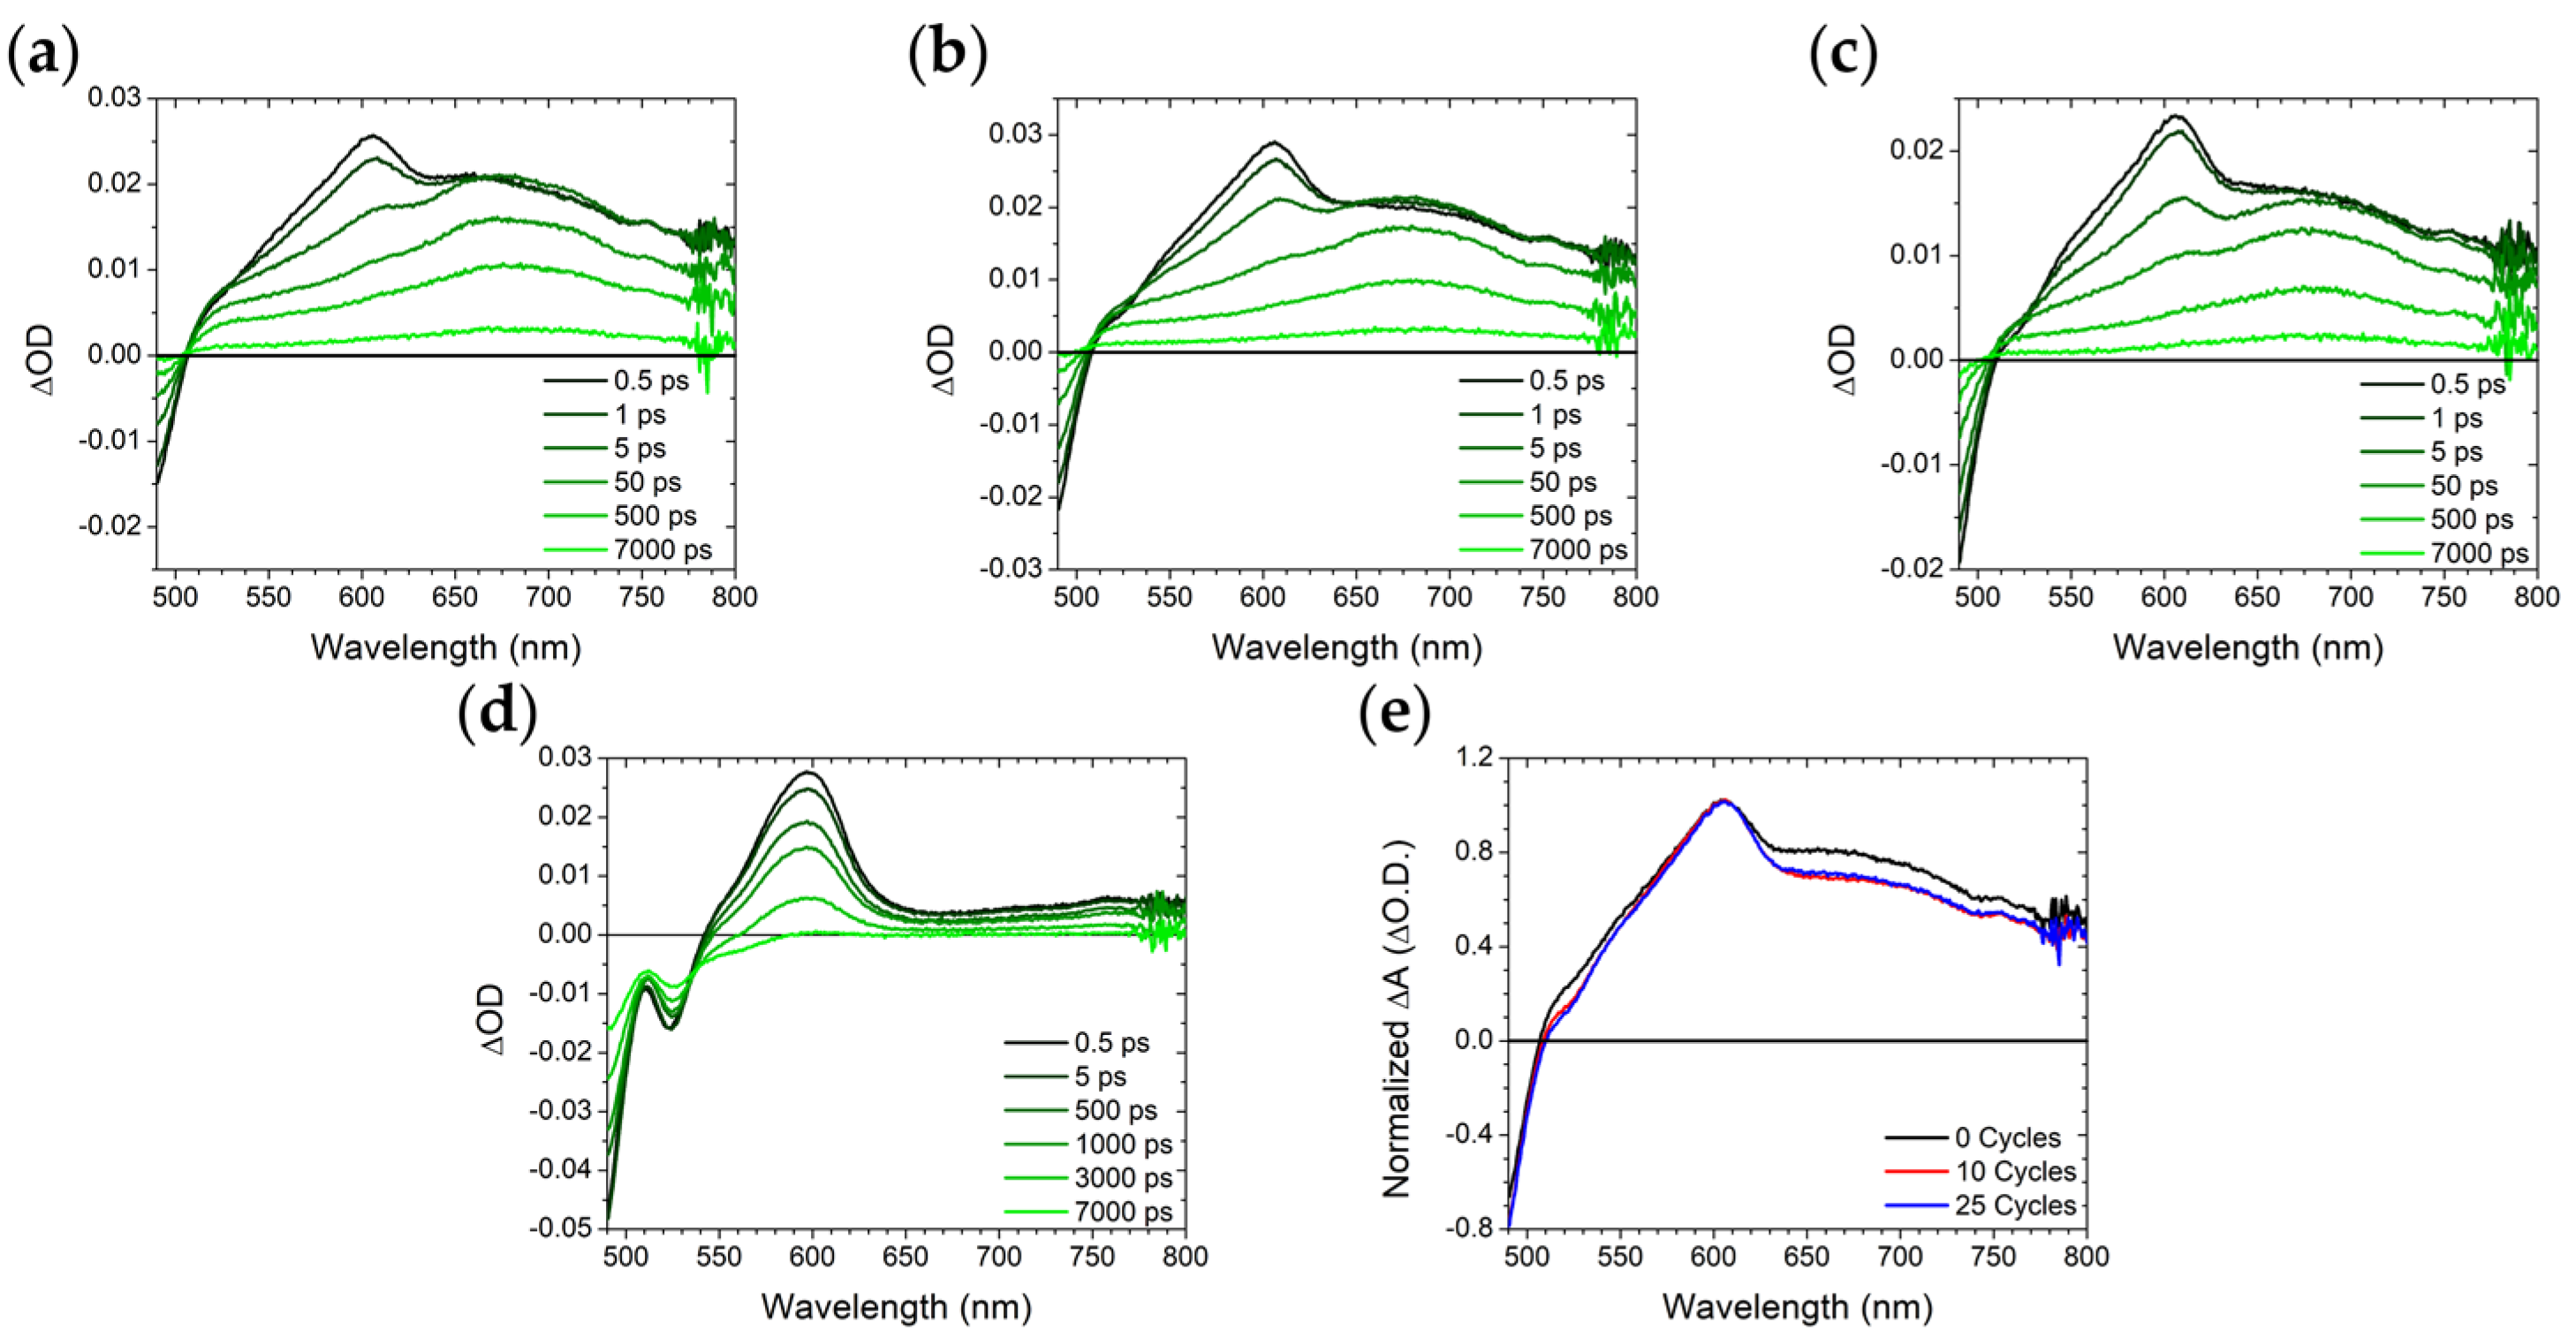
The sub 7 ns excited-state dynamics for the samples were measured using transient absorption spectroscopy and the results are shown in Figure 4 with fitting parameters summarized in Table S2. For A in solution (Figure 4d), there is a ground state bleach below 540 nm and an excited state absorption (ESA) centered at 610 nm which has previously been assigned to the singlet excited state of 9,10-bis(phenylethynyl)anthracene [2,3]. The lifetime of these features (1.8 ns) is in reasonable agreement with the emission decay kinetics for the same sample (2.6 ns) further supporting the assignment.
When bound to the surface, all ZrO2-A exhibit the same ~610 nm ESA but also a new, broad ESA centered at ~670 nm (Figure 4a–c) that decays on comparable time scales as the excimer emission described above (5–10 ns). Myong et al. observed similar transient absorption features for a silyl-derivatized 9,10-bis(phenylethynyl)anthracene on an Al2O3 surface and attributed it to excimer formation [2]. For all three ZrO2-A samples there is a rapid decrease in the 610 nm monomer feature in <50 ps and a plateau followed by slow decay of >7 ns for the 670 nm excimer peak. The amplitude of the excimer peak, relative to monomer (Figure 4e), is highest on the 100%-loaded ZrO2-A samples, further highlighting the surface loading dependence on excimer formation.

2.3. ZrO2-A-Zn with Al2O3

With the ZrO2-A photophysics established, we sought to understand the impact of Al2O3 overlayers on 50%- and 100%-loaded ZrO2-A-Zn samples. The samples were treated with 10 and 25 ALD cycles of TMA/H2O as described in Section 3.3. Interestingly, for the 100%-loaded ZrO2-A samples, the ALD treatment had minimal impact on the steady-state and time-resolved properties of the films (Figures S8–S11, Tables S3 and S4). Presumably either the high loading of A hinders the deposition of Al2O3, or deposition occurs but there are high-density regions of A that are largely uninfluenced by Al2O3 elsewhere. Given that the ATR-IR data support the formation of Al2O3, even on the 100%-loaded film, we are inclined to believe the latter. Regardless of the cause, we will focus the discussion below on the impact of ALD overlayers on the properties of the 50%-loaded ZrO2-A-Zn films.
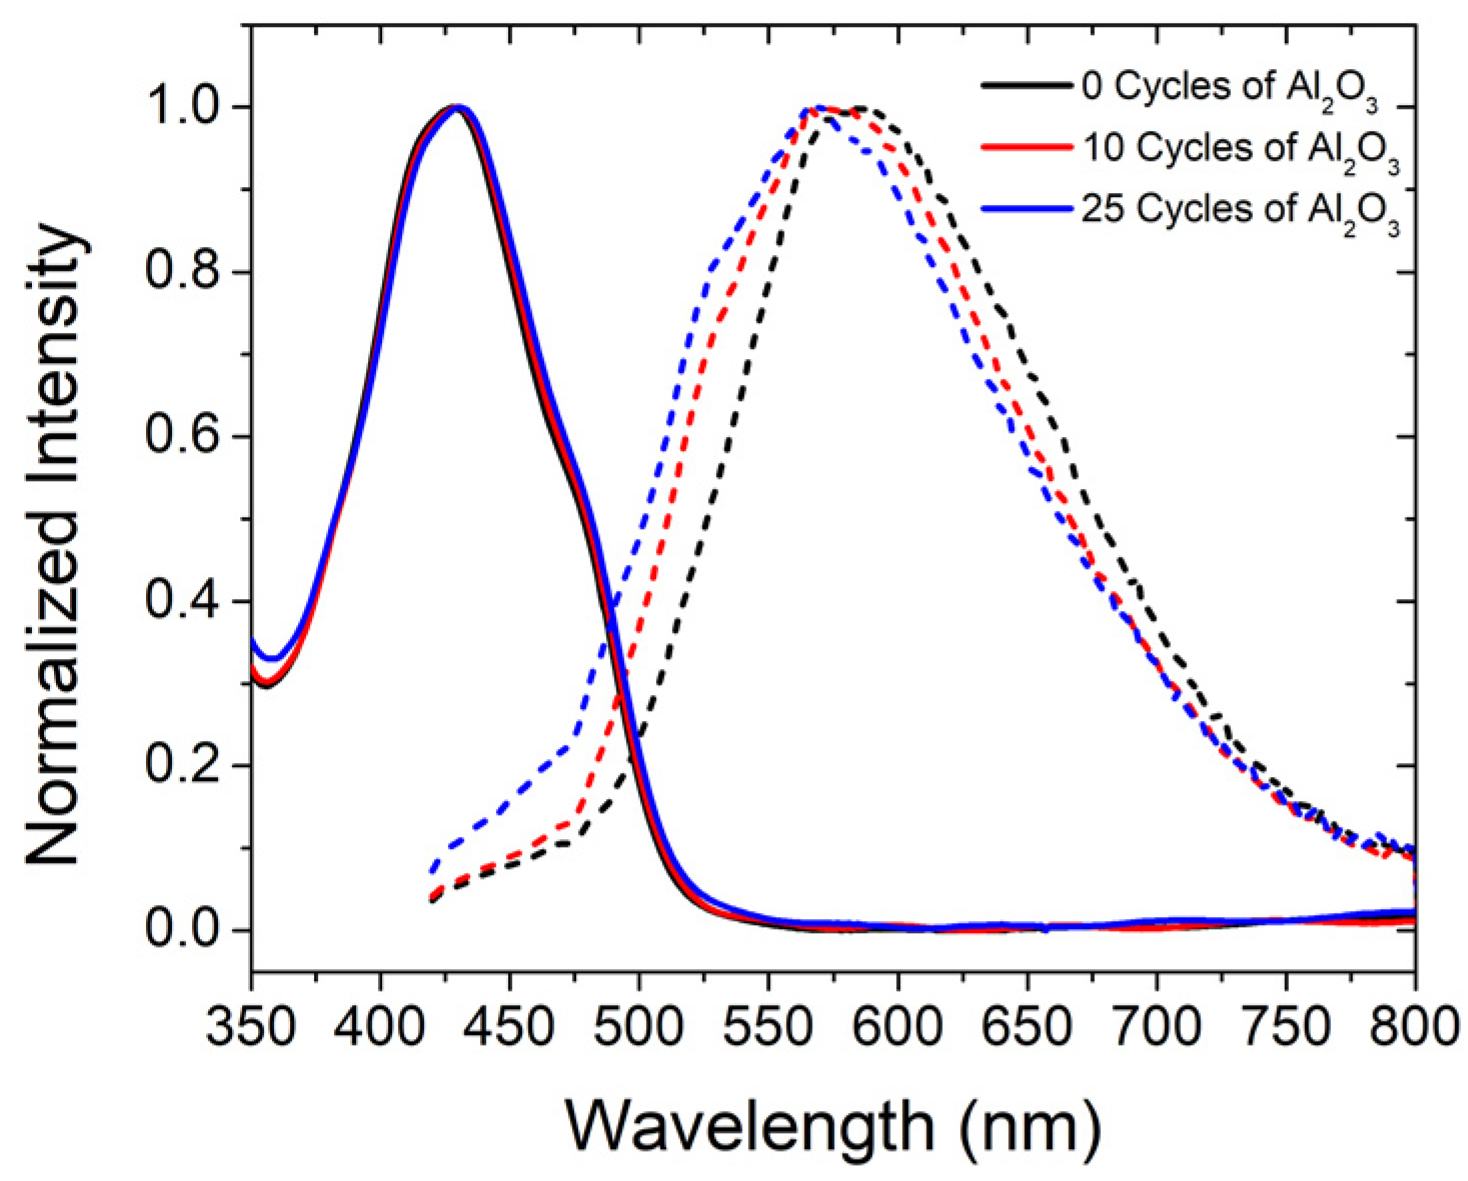
The absorption and emission spectra of 50%-loaded ZrO2-A-Zn films with 0, 10, and 25 cycles of TMA/H2O are shown in Figure 5. ALD treatment had minimal impact on the amplitude or energy of the films’ absorption spectra. In contrast, with increasing ALD cycles, we see a larger contribution from the high energy side of the spectrum. The larger, high-energy contribution is accompanied by subtle vibrational features that are consistent with an increase in monomer emission at ~500 nm like that observed in for A in solution. Time resolved emission decays and fitting parameters are provided in Figure S12 and Table S5. Presumably due to the continued dominance of the excimer emission, ALD had minimal impact on the excited state decay kinetics.
Transient absorption measurements were performed on 50%-loaded ZrO2-A-Zn samples with 0, 10, and 25 cycles of TMA/H2O, and the results are shown in Figure 6 with fitting parameters summarized in Table S6. Similar to the untreated film (Figure 6a), the 10 and 25 cycle samples (Figure 6b,c) exhibit monomer and excimer ESA peaks at 610 and 670 nm, respectively. However, the relative amplitude of the excimer peak (Figure 6e) decreases for the ALD-treated films relative to the untreated film. The decrease in excimer ESA intensity combined with increased presence of monomer emission suggests that following ALD treatment, the deposition of Al2O3 plays at least some role in hindering excited state intermolecular interactions between surface bound A molecules. However, because it has minimal impact on the 100%-loaded samples and the 50%-loaded samples are still dominated by excimeric excited states, only a small fraction of the intermolecular interactions are impacted.

2.4. Photostability

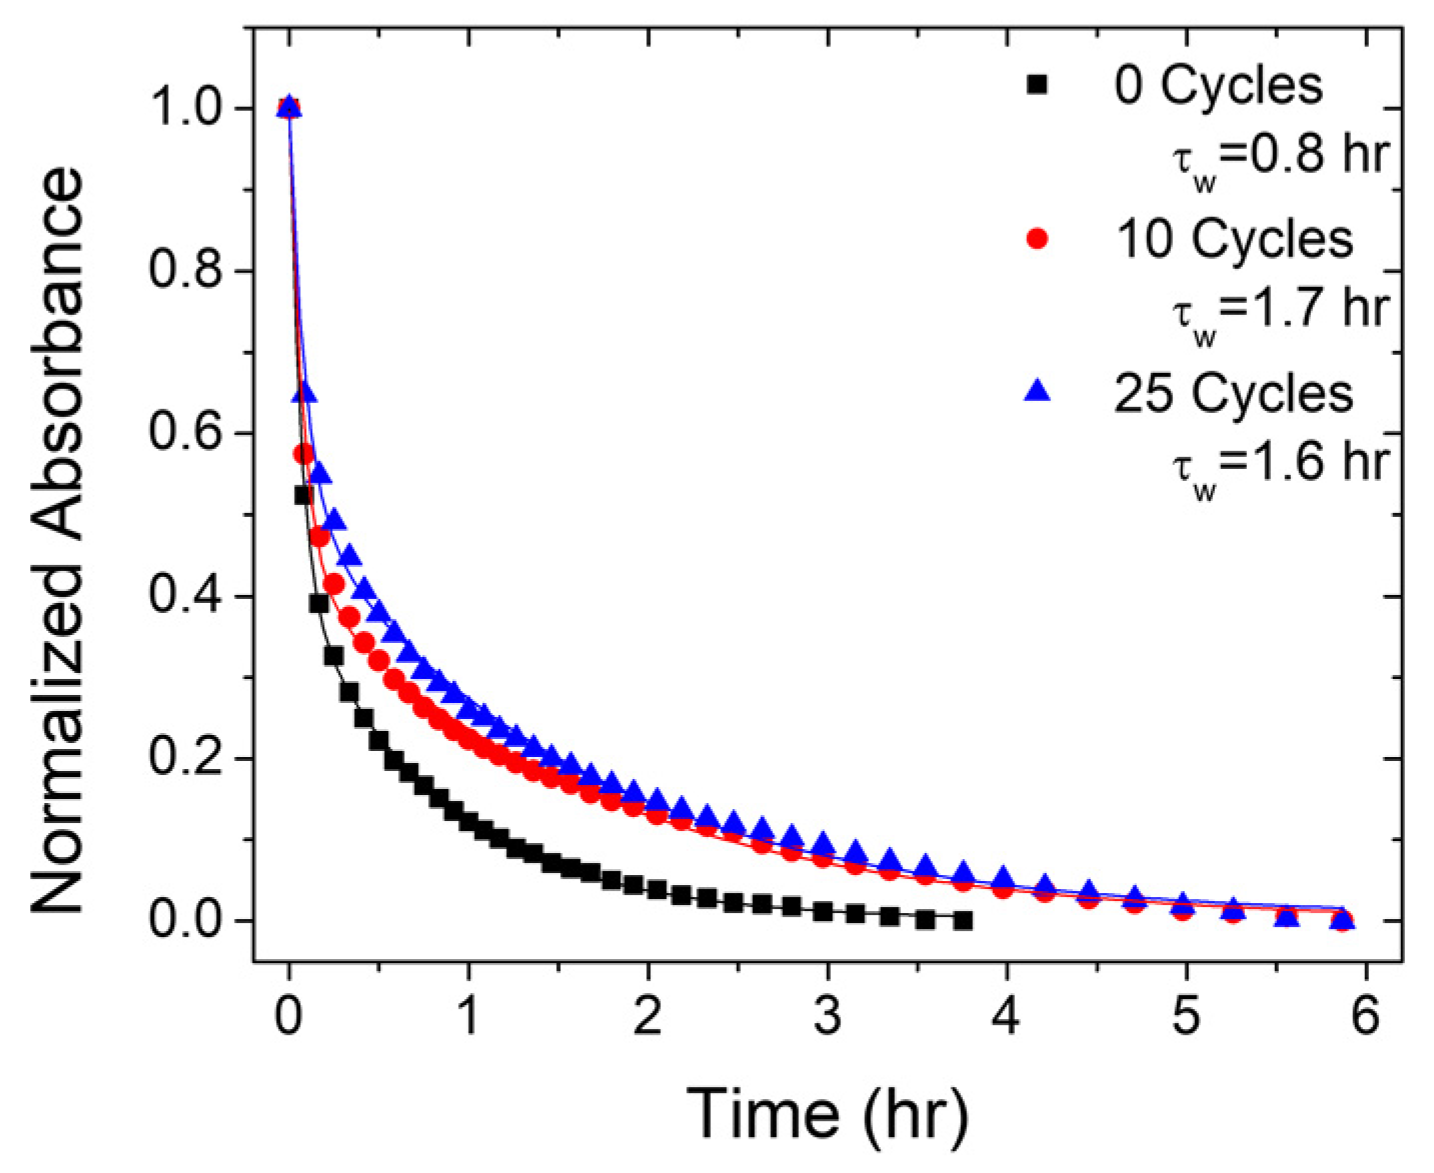
Deposition of metal oxide overlayers has also been known to impact stability of surface-bound molecules [24]. To probe the photostability of the films studied here we irradiated films of 50%- and 100%-loaded ZrO2-A-Zn with 0, 10, and 25 cycles of TMA/H2O under 455 nm light and monitored the absorption change over a 6 h period (Figure S14). The decrease in absorption was similar at all wavelengths (i.e., there were no spectral shifts) and the intensity decrease at 400 nm can be seen in Figure 7.
Without ALD layers, the 100% films had a slower decrease in absorbance (τw = 1.0 h) than that of the 50%-loaded films (τw = 0.8 h). This observation is intriguing, as the 100% film absorbs more photons and might be expected to generate more heat via non-radiative pathways which could contribute to decomposition/desorption. Likewise, any bimolecular decay pathway would expect to be quicker on the more concentrated films. Presumably the intermolecular interactions of the 100% film help inhibit desorption or decomposition. For both the 50%-loaded and 100%-loaded samples, there is a general increase in stability of the films upon the addition of ALD overlayers. The stability enhancement is more pronounced for the 50%-loaded film, presumably due to either a less stable starting point or more uniform distribution of Al2O3 due to more surface availability. Regardless of the cause, the increased stability with ALD overlayers is in good agreement with prior results [24].
The decrease in absorbance is typically attributed to either decomposition or desorption of the molecules [51]. Anthracene derivatives are known to undergo photochemical reactions via dimerization at the 9,10 positions which is thermally reversible [52,53]. To probe possible dimerization, after 6 h of irradiation with 455 nm light, the ZrO2-A-Zn samples were placed in an oven at 90 °C overnight. No return of the anthracene absorption features was observed, suggesting that either dimerization is not the decomposition mechanism or the reaction is not thermally reversible on the surface. To investigate a possible desorption pathway, we measured the absorbance spectra of the solution after photolysis and the results are shown in Figure S15. The lack of 9,10-bis(phenylethynyl)anthracene absorption features rules out simple desorption of A from the surface. Instead, the new absorption peaks at 275 and 330 nm suggest a new byproduct with less conjugated core is being formed. One could envision either the photoreaction leading to detachment from the surface or the reaction generating a product that is less stable on the surface.

3. Materials and Methods

3.1. Chemicals and Materials

Molecule A was synthesized according to a previously published procedure [3]. Zinc acetate dihydrate (Alfa Aesar, Tewksbury, MA, USA), trimethyl aluminum (Strem Chemicals, Newburyport, MA, USA; prepackaged in a 50 mL Swagelok cylinder), ultrahigh purity water (Strem Chemicals, Newburyport, MA, USA; prepackaged in a 50 mL Swagelok cylinder), acetonitrile (Sigma-Aldrich, Milwaukee, WI, USA), methanol (Sigma-Aldrich, Milwaukee, WI, USA), dimethyl sulfoxide (DMSO, Alfa Aesar), ethanol (Koptec), hydrochloric acid (Sigma-Aldrich, Milwaukee, WI, USA), zirconium (IV) propoxide solution (Sigma-Aldrich, Milwaukee, WI, USA), nitric acid (Avantar, Radnor, PA, USA), polyethylene glycol bisphenol A epichlorohydrin copolymer (Sigma-Aldrich, Milwaukee, WI, USA) were purchased from their respective suppliers, in parentheses, and used as received. Non-conductive glass was purchased from Hartford Glass Co. (Hartford, CT, USA). Vac’n Fill Syringe (65209) and Melatonix films (1170-25) were purchased from Solaronix (Aubonne, Switzerland). Micro glass cover slides (18 × 18 mm) were purchased from VWR (Radnor, PA, USA).

3.2. Thin Film Sample Preparation

ZrO2 sol–gels were synthesized according to previous procedures [54]. Non-conductive glass was sonicated in HCl/EtOH (15:85; v/v) for 20 min and then in ethanol for 20 min and then dried. Nanoparticle ZrO2 films were prepared by doctorblading (1 layer 3M Scotch™ tape, Saint Paul, MN, USA)with ZrO2 sol–gel. The films were sintered at 430 °C for 15 min. The thin films were loaded as described in Section 2.1 and sealed with a piece of non-conductive glass using Melatonix thermoplastic heated to 150 °C with a home-built apparatus [55]. The sandwiched cells were then injected with acetonitrile in air using a Vac’n Fill Syringe (Solaronix, Aubonne, Switzerland). The hole was sealed using the same thermoplastic above and a glass coverslip heated with a soldering iron. The sandwiched cells were used for subsequent steady state emission, time resolved emission, and femtosecond transient absorption measurements.

3.3. Atomic Layer Deposition

Atomic layer deposition was performed with a Veeco Fiji G2 (Plainview, NY, USA) at 100 °C. The deposition recipe is as follows: trimethyl aluminum precursor spray 0.06 s, wait 15 s, H2O spray 0.06 s, wait 15 s. Samples underwent 10 or 10 + 15 (25 total) cycles of ALD.

3.4. Attenuated Total Reflectance–Fourier-Transform Infrared Spectroscopy (ATR-IR)

Attenuated total reflectance infrared spectra were collected with a Bruker Alpha FTIR spectrometer (SiC Glowbar source, DTGS detector) with a Platinum ATR QuickSnap sampling module single reflection diamond crystal (Bruker Alpha, Billerica, MA, USA). Spectra were acquired from 2000 cm−1 to 600 cm−1 at a resolution of 4 cm−1. All ATR-IR spectra are reported as absorbance with a blank versus atmosphere.

3.5. X-ray Fluorescence

Elemental composition for all samples were confirmed using X-ray Fluorescence (XRF) on a Panalytical Epsilon X-ray florescence analyzer (Malvern, UK; Cu Kα source).

3.6. Absorbance

Absorption spectra were collected with an Agilent 8453 UV-Visible photo diode array spectrophotometer (Agilent, Santa Clara, CA, USA). Solution samples were prepared by dissolving A in DMSO in a 1 × 1 cm quartz cuvette. Solid samples were prepared as described in Section 2.1. Before the sandwich cells were assembled, absorbance was measured by holding the thin film perpendicular to the beam path, with the film facing the source.
Loading isotherms were fit according to the Langmuir isotherm model in Equation (2) [31],
Γ = Γmax(Kad × [A])/(1 + Kad × [A])
where Kad is the adsorption equilibrium constant and Γmax is the maximum surface coverage. The fitting parameters for A loaded at different concentrations and over time at 250 µM can be found in Figure S1.

3.7. Steady-State Emission

Steady state emission spectra were collected at room temperature on an Edinburgh FLS 980 fluorescence spectrometer (Livingston, UK). The samples were excited at 395 nm using a housed 450 W Xe lamp, passed through a single grating (1800 mm−1, 250 nm blaze) Czerny-Turner monochromator. Emissions from the sample were passed through a 420 nm long pass filter, then a single grating (1800 mm−1, 500 nm blaze) Czerny-Turner monochromator. Emission traces were detected by a Peltier-cooled Hamamatsu R928 photomultiplier tube (Bridgewater, NJ, USA). Spectra were processed with emission correction files on the Edinburgh software package (1.4.4, Build 2).
Solution samples were prepared in deaerated DMSO in a 1 × 1 cm quartz cuvette. Solid samples were prepared as described in Section 2.1 and placed in an Edinburgh SM4 integrating sphere. The excitation slit was set to 20 nm and the emission slit was set to 3 nm, which remained unchanged for all samples. Emission was monitored from 420–800 nm.

3.8. Time Resolved Emission

Time resolved emission measurements were recorded at room temperature on an Edinburgh FLS980 fluorescence spectrometer (Livingston, UK). The samples were excited by an Edinburgh EPL-405 nm picosecond pulsed diode laser (Livingston, UK; 405 ± 10 nm, pulse width 57.6 ps) operated at 100 Hz. Emission traces were passed through a 420 long-pass filter followed by a single grating (1800 mm−1, 500 nm blaze) Czerny-Turner monochromator and were detected by a Peltier-cooled Hamamatsu R928 photomultiplier tube (Bridgewater, NJ, USA). Emission decay traces were acquired using time-correlated single photon counting (TCSPC; 1024 channels; 200 ns window) with data collection for 10,000 counts. The decay traces were fit with either a single or biexponential reconvolution fit using the Edinburgh software package (1.4.4, Build 2).

3.9. Femtosecond Transient Absorption

Transient absorption was measured with an Ultrafast Systems HELIOS FIRE transient absorption spectrometer (Ultrfast Systems, Sarasota, FL, USA) coupled to a Vitara-S Coherent Ti:sapphire laser (Coherent, Santa Clara, CA, USA). The signal was amplified using a 1 kHz Coherent Revolution-50 pump laser (Coherent, Santa Clara, CA, USA). The resulting 5 mJ pulse (100 fs FWHM, centered at 800 nm) was split into a pump and probe beam. The pump was directed through a Coherent OPerA Solo optical parametric amplifier (Coherent, Santa Clara, CA, USA), passed through a chopper to minimize scattering from the laser line, and passed through the sample with a resulting intensity of 74.1 ± 1.4 μJ/cm−2 at 475 nm. The probe beam was sent through a delay stage. A sapphire crystal (420–780 nm) produced a white light continuum from the probe beam. The pump and probe beams were then overlapped on the sample. The signal was collected by a CMOS detector.
For solution measurements, samples were prepared using deaerated DMSO in a 2 mm quartz cuvette with constant stirring throughout the measurement. Difference spectra and single wavelength kinetics were collected by averaging 3 scans, holding for 2 s, with an exponential point acquisition beginning with 0.001 ps steps for a total of 200 points.
Thin film samples were prepared as described in Section 2.1 and Section 3.2 and were mounted in a clamp stage. Difference spectra and single wavelength kinetics were collected from single scans, holding for 2 s, with an exponential point acquisition beginning with 0.001 ps steps for a total of 200 points. This was done for 2 separate spots on each thin film sample and the kinetics were averaged together. Doing multiple scans on the same area resulted in bleaching of the samples.
Data was processed using the Surface Xplorer (4.3.0) software package from Ultrafast Systems. On each day, a background scan of DMSO for solution samples and ZrO2 with no loaded A were performed. These scans were subtracted from the sample scans. Chirp corrections were performed afterwards. For solutions, decay traces were fit with mono-exponential equation. Thin film kinetics were fit using triexponential decays. The weighted average lifetimes (τw) were calculated from the relative amplitude (Ax) of each lifetime component (τx) according to Equations (3) and (4) below.
Φx = (Axτx)/((Axτx) + (Ayτy) + (Azτz))
τw = ((Φxτx2) + (Φyτy2) + (Φzτz2))/((Φxτx) + (Φyτy) + (Φzτz))

3.10. Photostability

A blue (455 nm, FWHM 18 nm, 38.2 mW) mounted high-power LED (Thorlabs, Inc., Newton, NJ, USA; M455L4) was used to illuminate samples. It was powered by a T-Cube LED driver (Thorlabs, Inc., Newton, NJ, USA; LEDD1B) set to maximum power. The LED was placed perpendicular to the beam path of an Agilent 8543 UV-Visible photo diode array spectrometer (Santa Clara, CA, USA). Thin films of ZrO2-A-Zn with and without ALD treatment were held at a 45° angle in a 1 cm quartz cuvette with 2.5 mL MeCN. The samples were positioned at the intersection of the LED and spectrometer light paths. The absorption spectrum (350–600 nm) of the film was collected every 300 s for the first 3600 s and then with a 5% time increase in sampling time up to 21,600 s. The incident light power was measured by a thermopile detector (Newport Corp, Irvine, CA, USA; 1918-C meter, 818P-020-12 detector).

4. Conclusions

In this report, we investigated the impact of surface loading and ALD overlayers on the photophysical properties of a 9,10-bis(phenylethynyl)anthracene bound to a metal oxide surface. While surface loading density had no impact on the absorption spectra of the films, there was an increase in excimer features with surface loading as observed by both emission and transient absorption. The addition of ALD overlayers of Al2O3 resulted in a small decrease in excimer formation, but the emission and transient absorption spectra were still dominated by excimer features. Why the impact of ALD was so subtle is not obvious to us. One could envision the intermolecular interactions being so strong as to hinder the deposition of Al2O3 between molecular pairs. However, the minimal change in the absorption spectra across all samples suggests that the ground state interaction in not particularly strong. Instead, the electronic structure change in the excited state facilitates intermolecular interactions which are favorable at high surface loadings but slightly hindered after ALD treatment. Consequently, while we initially hoped that ALD would have a more pronounced impact on excimer formation (e.g., completely hinder it), these results do highlight the difficulty and subtlety in controlling these interactions on a surface.

Supplementary Materials

The following supporting information can be downloaded at: https://www.mdpi.com/article/10.3390/molecules28124835/s1, Figure S1: Loading Isotherms of ZrO2-A in DMSO; Figure S2: Extinction Coefficient Calculation (λ = 475 nm); Table S1: Ratio of Elements in ZrO2-A-Zn + Al2O3 Samples; Figure S3: X-ray Fluorescence Spectra of ZrO2-A-Zn + Al2O3; Figure S4: ATR-IR of ZrO2-A-Zn + Al2O3; Figure S5: Raw Absorption Spectra at Different Surface Loading; Figure S6: Emission Decay Traces at Different Surface Loading; Figure S7: Transient Absorption Decay Traces at Different Surface Loading; Table S2: Transient Absorption Decay Fitting Parameters for ZrO2-A at Different Surface Loading; Figure S8: Absorbance and Emission of 100% ZrO2-A-Zn + Al2O3; Figure S9: Emission Decay Traces of 100% ZrO2-A-Zn + Al2O3; Table S3: Emission Decay Fitting Parameters for ZrO2-A-Zn + Al2O3; Figure S10: fsTA Spectra of 100% ZrO2-A-Zn + Al2O3; Figure S11: Transient Absorption Decay Traces of 100% ZrO2-A-Zn + Al2O3; Table S4: Transient Absorption Decay Fitting Parameters for 100% ZrO2-A-Zn + Al2O3; Figure S12: Emission Decay Traces of 50% ZrO2-A-Zn + Al2O3; Table S5: Emission Decay Fitting Parameters for 50% ZrO2-A-Zn + Al2O3; Figure S13: Transient Absorption Decay Traces of 50% ZrO2-A-Zn + Al2O3; Table S6: Transient Absorption Decay Fitting Parameters for 50% ZrO2-A-Zn + Al2O3; Figure S14: Absorbance Spectra Changes in ZrO2-A-Zn + Al2O3; Table S7: Absorption Decrease Fitting Parameters of ZrO2-A-Zn + Al2O3; Figure S15: Absorption Spectra Changes for 100%-Loaded ZrO2-A-Zn + Al2O3 at 400 nm; Figure S16: 50%-Loaded ZrO2-A-Zn + Al2O3 Before and After Irradiation.

Author Contributions

Conceptualization, E.S.K., D.B., A.A., J.S.R.V.W. and K.H.; investigation, E.S.K., D.B., J.P.W., I.A.B. and C.T.B.; formal analysis, E.S.K. and K.H.; supervision, G.F.S. and K.H.; project administration, K.H.; funding acquisition, K.H.; visualization, E.S.K.; writing—original draft, E.S.K. and K.H.; writing—review and editing, E.S.K. and K.H. All authors have read and agreed to the published version of the manuscript.

Funding

This work was supported by the National Science Foundation under Grant No. DMR-1752782. Ultrafast transient absorption measurements were performed on a spectrometer supported by the National Science Foundation under Grant No. CHE-1919633.

Institutional Review Board Statement

Not applicable.

Informed Consent Statement

Not applicable.

Data Availability Statement

Data can be made available upon request.

Conflicts of Interest

The authors declare no conflict of interest.

Sample Availability

Samples are available upon request.

References

  1. Hestand, N.J.; Spano, F.C. Molecular Aggregate Photophysics beyond the Kasha Model: Novel Design Principles for Organic Materials. Acc. Chem. Res. 2017, 50, 341–350. [Google Scholar] [CrossRef] [PubMed]
  2. Myong, M.S.; Young, R.M.; Wasielewski, M.R. Excimer Diffusivity in 9,10-Bis(Phenylethynyl)Anthracene Assemblies on Anodic Aluminum Oxide Membranes. J. Phys. Chem. C 2021, 125, 24498–24504. [Google Scholar] [CrossRef]
  3. Beery, D.; Arcidiacono, A.; Wheeler, J.P.; Chen, J.; Hanson, K. Harnessing Near-Infrared Light via S0 to T1 Sensitizer Excitation in a Molecular Photon Upconversion Solar Cell. J. Mater. Chem. C 2022, 10, 4947–4954. [Google Scholar] [CrossRef]
  4. Bae, Y.J.; Kang, G.; Malliakas, C.D.; Nelson, J.N.; Zhou, J.; Young, R.M.; Wu, Y.-L.; Van Duyne, R.P.; Schatz, G.C.; Wasielewski, M.R. Singlet Fission in 9,10-Bis(Phenylethynyl)Anthracene Thin Films. J. Am. Chem. Soc. 2018, 140, 15140–15144. [Google Scholar] [CrossRef]
  5. Nazeeruddin, M.K.; Humphry-Baker, R.; Liska, P.; Grätzel, M. Investigation of Sensitizer Adsorption and the Influence of Protons on Current and Voltage of a Dye-Sensitized Nanocrystalline TiO2 Solar Cell. J. Phys. Chem. B 2003, 107, 8981–8987. [Google Scholar] [CrossRef]
  6. Wang, J.C.; Hill, S.P.; Dilbeck, T.; Ogunsolu, O.O.; Banerjee, T.; Hanson, K. Multimolecular Assemblies on High Surface Area Metal Oxides and Their Role in Interfacial Energy and Electron Transfer. Chem. Soc. Rev. 2018, 47, 104–148. [Google Scholar] [CrossRef] [PubMed]
  7. Manthou, V.S.; Pefkianakis, E.K.; Falaras, P.; Vougioukalakis, G.C. Co-Adsorbents: A Key Component in Efficient and Robust Dye-Sensitized Solar Cells. ChemSusChem 2015, 8, 588–599. [Google Scholar] [CrossRef] [PubMed]
  8. Dover, C.B.; Gallaher, J.K.; Frazer, L.; Tapping, P.C.; Petty, A.J.; Crossley, M.J.; Anthony, J.E.; Kee, T.W.; Schmidt, T.W. Endothermic Singlet Fission Is Hindered by Excimer Formation. Nat. Chem. 2018, 10, 305–310. [Google Scholar] [CrossRef]
  9. Samanta, S.; Ray, S.K.; Deolka, S.; Saha, S.; Pradeep, K.R.; Bhowal, R.; Ghosh, N.; Chaudhuri, D. Safeguarding Long-Lived Excitons from Excimer Traps in H-Aggregated Dye-Assemblies. Chem. Sci. 2020, 11, 5710–5715. [Google Scholar] [CrossRef]
  10. Dilbeck, T.; Hanson, K. Molecular Photon Upconversion Solar Cells Using Multilayer Assemblies: Progress and Prospects. J. Phys. Chem. Lett. 2018, 9, 5810–5821. [Google Scholar] [CrossRef]
  11. Beery, D.; Schmidt, T.W.; Hanson, K. Harnessing Sunlight via Molecular Photon Upconversion. ACS Appl. Mater. Interfaces 2021, 13, 32601–32605. [Google Scholar] [CrossRef]
  12. Hanna, M.C.; Nozik, A.J. Solar Conversion Efficiency of Photovoltaic and Photoelectrolysis Cells with Carrier Multiplication Absorbers. J. Appl. Phys. 2006, 100, 074510. [Google Scholar] [CrossRef]
  13. Schrauben, J.N.; Zhao, Y.; Mercado, C.; Dron, P.I.; Ryerson, J.L.; Michl, J.; Zhu, K.; Johnson, J.C. Photocurrent Enhanced by Singlet Fission in a Dye-Sensitized Solar Cell. ACS Appl. Mater. Interfaces 2015, 7, 2286–2293. [Google Scholar] [CrossRef]
  14. Banerjee, T.; Hill, S.P.; Hermosilla-Palacios, M.A.; Piercy, B.D.; Haney, J.; Casale, B.; DePrince, A.E.I.; Losego, M.D.; Kleiman, V.D.; Hanson, K. Diphenylisobenzofuran Bound to Nanocrystalline Metal Oxides: Excimer Formation, Singlet Fission, Electron Injection, and Low Energy Sensitization. J. Phys. Chem. C 2018, 122, 28478–28490. [Google Scholar] [CrossRef]
  15. Treat, N.A.; Knorr, F.J.; McHale, J.L. Templated Assembly of Betanin Chromophore on TiO2: Aggregation-Enhanced Light-Harvesting and Efficient Electron Injection in a Natural Dye-Sensitized Solar Cell. J. Phys. Chem. C 2016, 120, 9122–9131. [Google Scholar] [CrossRef]
  16. Nüesch, F.; Moser, J.E.; Shklover, V.; Grätzel, M. Merocyanine Aggregation in Mesoporous Networks. J. Am. Chem. Soc. 1996, 118, 5420–5431. [Google Scholar] [CrossRef]
  17. Hartnett, P.E.; Timalsina, A.; Matte, H.S.S.R.; Zhou, N.; Guo, X.; Zhao, W.; Facchetti, A.; Chang, R.P.H.; Hersam, M.C.; Wasielewski, M.R.; et al. Slip-Stacked Perylenediimides as an Alternative Strategy for High Efficiency Nonfullerene Acceptors in Organic Photovoltaics. J. Am. Chem. Soc. 2014, 136, 16345–16356. [Google Scholar] [CrossRef]
  18. Hartnett, P.E.; Margulies, E.A.; Matte, H.S.S.R.; Hersam, M.C.; Marks, T.J.; Wasielewski, M.R. Effects of Crystalline Perylenediimide Acceptor Morphology on Optoelectronic Properties and Device Performance. Chem. Mater. 2016, 28, 3928–3936. [Google Scholar] [CrossRef]
  19. Mann, J.R.; Gannon, M.K.; Fitzgibbons, T.C.; Detty, M.R.; Watson, D.F. Optimizing the Photocurrent Efficiency of Dye-Sensitized Solar Cells through the Controlled Aggregation of Chalcogenoxanthylium Dyes on Nanocrystalline Titania Films. J. Phys. Chem. C 2008, 112, 13057–13061. [Google Scholar] [CrossRef]
  20. Arcidiacono, A.; Zhou, Y.; Zhang, W.; Ellison, J.O.; Ayad, S.; Knorr, E.S.; Peters, A.N.; Zheng, L.; Yang, W.; Saavedra, S.S.; et al. Examining the Influence of Bilayer Structure on Energy Transfer and Molecular Photon Upconversion in Metal Ion Linked Multilayers. J. Phys. Chem. C 2020, 124, 23597–23610. [Google Scholar] [CrossRef]
  21. Puurunen, R.L. Surface Chemistry of Atomic Layer Deposition: A Case Study for the Trimethylaluminum/Water Process. J. Appl. Phys. 2005, 97, 121301. [Google Scholar] [CrossRef]
  22. Hanson, K.; Losego, M.D.; Kalanyan, B.; Ashford, D.L.; Parsons, G.N.; Meyer, T.J. Stabilization of [Ru(Bpy)2(4,4′-(PO3H2)Bpy)]2+ on Mesoporous TiO2 with Atomic Layer Deposition of Al2O3. Chem. Mater. 2013, 25, 3–5. [Google Scholar] [CrossRef]
  23. Son, H.-J.; Prasittichai, C.; Mondloch, J.E.; Luo, L.; Wu, J.; Kim, D.W.; Farha, O.K.; Hupp, J.T. Dye Stabilization and Enhanced Photoelectrode Wettability in Water-Based Dye-Sensitized Solar Cells through Post-Assembly Atomic Layer Deposition of TiO2. J. Am. Chem. Soc. 2013, 135, 11529–11532. [Google Scholar] [CrossRef]
  24. Hanson, K.; Losego, M.D.; Kalanyan, B.; Parsons, G.N.; Meyer, T.J. Stabilizing Small Molecules on Metal Oxide Surfaces Using Atomic Layer Deposition. Nano Lett. 2013, 13, 4802–4809. [Google Scholar] [CrossRef]
  25. Ayare, P.J.; Gregory, S.A.; Key, R.J.; Short, A.E.; Tillou, J.G.; Sitter, J.D.; Yom, T.; Goodlett, D.W.; Lee, D.-C.; Alamgir, F.M.; et al. Immobilization of Molecular Catalysts on Solid Supports via Atomic Layer Deposition for Chemical Synthesis in Sustainable Solvents. Green Chem. 2021, 23, 9523–9533. [Google Scholar] [CrossRef]
  26. Brady, M.D.; Troian-Gautier, L.; Motley, T.C.; Turlington, M.D.; Meyer, G.J. An Insulating Al2O3 Overlayer Prevents Lateral Hole Hopping Across Dye-Sensitized TiO2 Surfaces. ACS Appl. Mater. Interfaces 2019, 11, 27453–27463. [Google Scholar] [CrossRef]
  27. Bae, Y.J.; Shimizu, D.; Schultz, J.D.; Kang, G.; Zhou, J.; Schatz, G.C.; Osuka, A.; Wasielewski, M.R. Balancing Charge Transfer and Frenkel Exciton Coupling Leads to Excimer Formation in Molecular Dimers: Implications for Singlet Fission. J. Phys. Chem. A 2020, 124, 8478–8487. [Google Scholar] [CrossRef]
  28. Tachibana, Y.; Moser, J.E.; Grätzel, M.; Klug, D.R.; Durrant, J.R. Subpicosecond Interfacial Charge Separation in Dye-Sensitized Nanocrystalline Titanium Dioxide Films. J. Phys. Chem. 1996, 100, 20056–20062. [Google Scholar] [CrossRef] [Green Version]
  29. Hill, S.P.; Banerjee, T.; Dilbeck, T.; Hanson, K. Photon Upconversion and Photocurrent Generation via Self-Assembly at Organic–Inorganic Interfaces. J. Phys. Chem. Lett. 2015, 6, 4510–4517. [Google Scholar] [CrossRef]
  30. Gallagher, L.A.; Serron, S.A.; Wen, X.; Hornstein, B.J.; Dattelbaum, D.M.; Schoonover, J.R.; Meyer, T.J. Photoelectrochemistry on RuII-2,2′-Bipyridine-Phosphonate-Derivatized TiO2 with the I3-/I- and Quinone/Hydroquinone Relays. Design of Photoelectrochemical Synthesis Cells. Inorg. Chem. 2005, 44, 2089–2097. [Google Scholar] [CrossRef]
  31. Langmuir, I. The Adsorption of Gases on Plane Surfaces of Glass, Mica and Platinum. J. Am. Chem. Soc. 1918, 40, 1361–1403. [Google Scholar] [CrossRef] [Green Version]
  32. Cabrera, W.; Halls, M.D.; Povey, I.M.; Chabal, Y.J. Surface Oxide Characterization and Interface Evolution in Atomic Layer Deposition of Al2O3 on InP(100) Studied by in Situ Infrared Spectroscopy. J. Phys. Chem. C 2014, 118, 5862–5871. [Google Scholar] [CrossRef]
  33. Wang, D.; Sheridan, M.V.; Shan, B.; Farnum, B.H.; Marquard, S.L.; Sherman, B.D.; Eberhart, M.S.; Nayak, A.; Dares, C.J.; Das, A.K.; et al. Layer-by-Layer Molecular Assemblies for Dye-Sensitized Photoelectrosynthesis Cells Prepared by Atomic Layer Deposition. J. Am. Chem. Soc. 2017, 139, 14518–14525. [Google Scholar] [CrossRef]
  34. Gao, W.; Dickinson, L.; Grozinger, C.; Morin, F.G.; Reven, L. Self-Assembled Monolayers of Alkylphosphonic Acids on Metal Oxides. Langmuir 1996, 12, 6429–6435. [Google Scholar] [CrossRef]
  35. Zhao, R.; Rupper, P.; Gaan, S. Recent Development in Phosphonic Acid-Based Organic Coatings on Aluminum. Coatings 2017, 7, 133. [Google Scholar] [CrossRef] [Green Version]
  36. Boumaza, A.; Favaro, L.; Lédion, J.; Sattonnay, G.; Brubach, J.B.; Berthet, P.; Huntz, A.M.; Roy, P.; Tétot, R. Transition Alumina Phases Induced by Heat Treatment of Boehmite: An X-Ray Diffraction and Infrared Spectroscopy Study. J. Solid State Chem. 2009, 182, 1171–1176. [Google Scholar] [CrossRef]
  37. Ott, A.W.; Klaus, J.W.; Johnson, J.M.; George, S.M. Al3O3 Thin Film Growth on Si(100) Using Binary Reaction Sequence Chemistry. Thin Solid Films 1997, 292, 135–144. [Google Scholar] [CrossRef]
  38. Groner, M.D.; Fabreguette, F.H.; Elam, J.W.; George, S.M. Low-Temperature Al2O3 Atomic Layer Deposition. Chem. Mater. 2004, 16, 639–645. [Google Scholar] [CrossRef]
  39. van Hemmen, J.L.; Heil, S.B.S.; Klootwijk, J.H.; Roozeboom, F.; Hodson, C.J.; van de Sanden, M.C.M.; Kessels, W.M.M. Plasma and Thermal ALD of Al2O3 in a Commercial 200 Mm ALD Reactor. J. Electrochem. Soc. 2007, 154, G165. [Google Scholar] [CrossRef] [Green Version]
  40. Dingemans, G.; van de Sanden, M.C.M.; Kessels, W.M.M. Influence of the Deposition Temperature on the C-Si Surface Passivation by Al2O3 Films Synthesized by ALD and PECVD. Electrochem. Solid-State Lett. 2009, 13, H76. [Google Scholar] [CrossRef] [Green Version]
  41. Kim, S.; Lee, S.-H.; Jo, I.H.; Seo, J.; Yoo, Y.-E.; Kim, J.H. Influence of Growth Temperature on Dielectric Strength of Al2O3 Thin Films Prepared via Atomic Layer Deposition at Low Temperature. Sci. Rep. 2022, 12, 5124. [Google Scholar] [CrossRef] [PubMed]
  42. Reilly, C.E.; Dillon, R.J.; Nayak, A.; Brogan, S.; Moot, T.; Brennaman, M.K.; Lopez, R.; Meyer, T.J.; Alibabaei, L. Dye-Sensitized Nonstoichiometric Strontium Titanate Core–Shell Photocathodes for Photoelectrosynthesis Applications. ACS Appl. Mater. Interfaces 2021, 13, 15261–15269. [Google Scholar] [CrossRef] [PubMed]
  43. Cheng, H.; Liu, Y.; Cai, B.; Hägglund, C.; Kubart, T.; Boschloo, G.; Tian, H. Atomic Layer Deposition of SnO2 as an Electron Transport Material for Solid-State P-Type Dye-Sensitized Solar Cells. ACS Appl. Energy Mater. 2022, 5, 12022–12028. [Google Scholar] [CrossRef]
  44. Durrant, J.R.; Haque, S.A.; Palomares, E. Towards Optimisation of Electron Transfer Processes in Dye Sensitised Solar Cells. Coord. Chem. Rev. 2004, 248, 1247–1257. [Google Scholar] [CrossRef]
  45. Wirp, C.; Güsten, H.; Brauer, H.-D. Fluorescence Quenching of Meso-Substituted Anthracene Derivatives by Molecular Oxygen. Ber. Der Bunsenges. Für Phys. Chem. 1996, 100, 1217–1225. [Google Scholar] [CrossRef]
  46. Sagara, Y.; Simon, Y.C.; Tamaoki, N.; Weder, C. A Mechano- and Thermoresponsive Luminescent Cyclophane. Chem. Commun. 2016, 52, 5694–5697. [Google Scholar] [CrossRef] [Green Version]
  47. Avis, P.; Porter, G. Effect of Concentration on the Absorption and Fluorescence Spectra of Pyrene in a Solid Solution of Poly(Methyl Methacrylate). J. Chem. Soc. Faraday Trans. 2 Mol. Chem. Phys. 1974, 70, 1057–1065. [Google Scholar] [CrossRef]
  48. Johnson, G.E. Effect of Concentration on the Fluorescence Spectra and Lifetimes of Pyrene in Polystyrene Films. Macromolecules 1980, 13, 839–844. [Google Scholar] [CrossRef]
  49. Yamazaki, I.; Tamai, N.; Yamazaki, T. Picosecond Fluorescence Spectroscopy on Excimer Formation and Excitation Energy Transfer of Pyrene in Langmuir-Blodgett Monolayer Films. J. Phys. Chem. 1987, 91, 3572–3577. [Google Scholar] [CrossRef]
  50. Zachariasse, K.A. Excimer Formation with Pyrenes on Silica Surfaces. In Studies in Surface Science and Catalysis; Anpo, M., Matsuura, T., Eds.; Photochemistry on Solid Surfaces; Elsevier: Amsterdam, The Netherlands, 1989; Volume 47, pp. 48–78. [Google Scholar] [CrossRef]
  51. Hanson, K.; Brennaman, M.K.; Luo, H.; Glasson, C.R.K.; Concepcion, J.J.; Song, W.; Meyer, T.J. Photostability of Phosphonate-Derivatized, RuII Polypyridyl Complexes on Metal Oxide Surfaces. ACS Appl. Mater. Interfaces 2012, 4, 1462–1469. [Google Scholar] [CrossRef]
  52. Wei, K.S.; Livingston, R. Reversible Photodimerization of Anthracene and Tetracene. Photochem. Photobiol. 1967, 6, 229–232. [Google Scholar] [CrossRef]
  53. Li, Y.; Goswami, M.; Zhang, Y.; Liu, T.; Zhang, J.; Kessler, M.R.; Wang, L.; Rios, O. Combined Light- and Heat-Induced Shape Memory Behavior of Anthracene-Based Epoxy Elastomers. Sci. Rep. 2020, 10, 20214. [Google Scholar] [CrossRef] [PubMed]
  54. Lee, S.-H.A.; Abrams, N.M.; Hoertz, P.G.; Barber, G.D.; Halaoui, L.I.; Mallouk, T.E. Coupling of Titania Inverse Opals to Nanocrystalline Titania Layers in Dye-Sensitized Solar Cells. J. Phys. Chem. B 2008, 112, 14415–14421. [Google Scholar] [CrossRef] [PubMed]
  55. Ogunsolu, O.O.; Wang, J.C.; Hanson, K. Inhibiting Interfacial Recombination Events in Dye-Sensitized Solar Cells Using Self-Assembled Bilayers. ACS Appl. Mater. Interfaces 2015, 7, 27730–27734. [Google Scholar] [CrossRef] [PubMed]
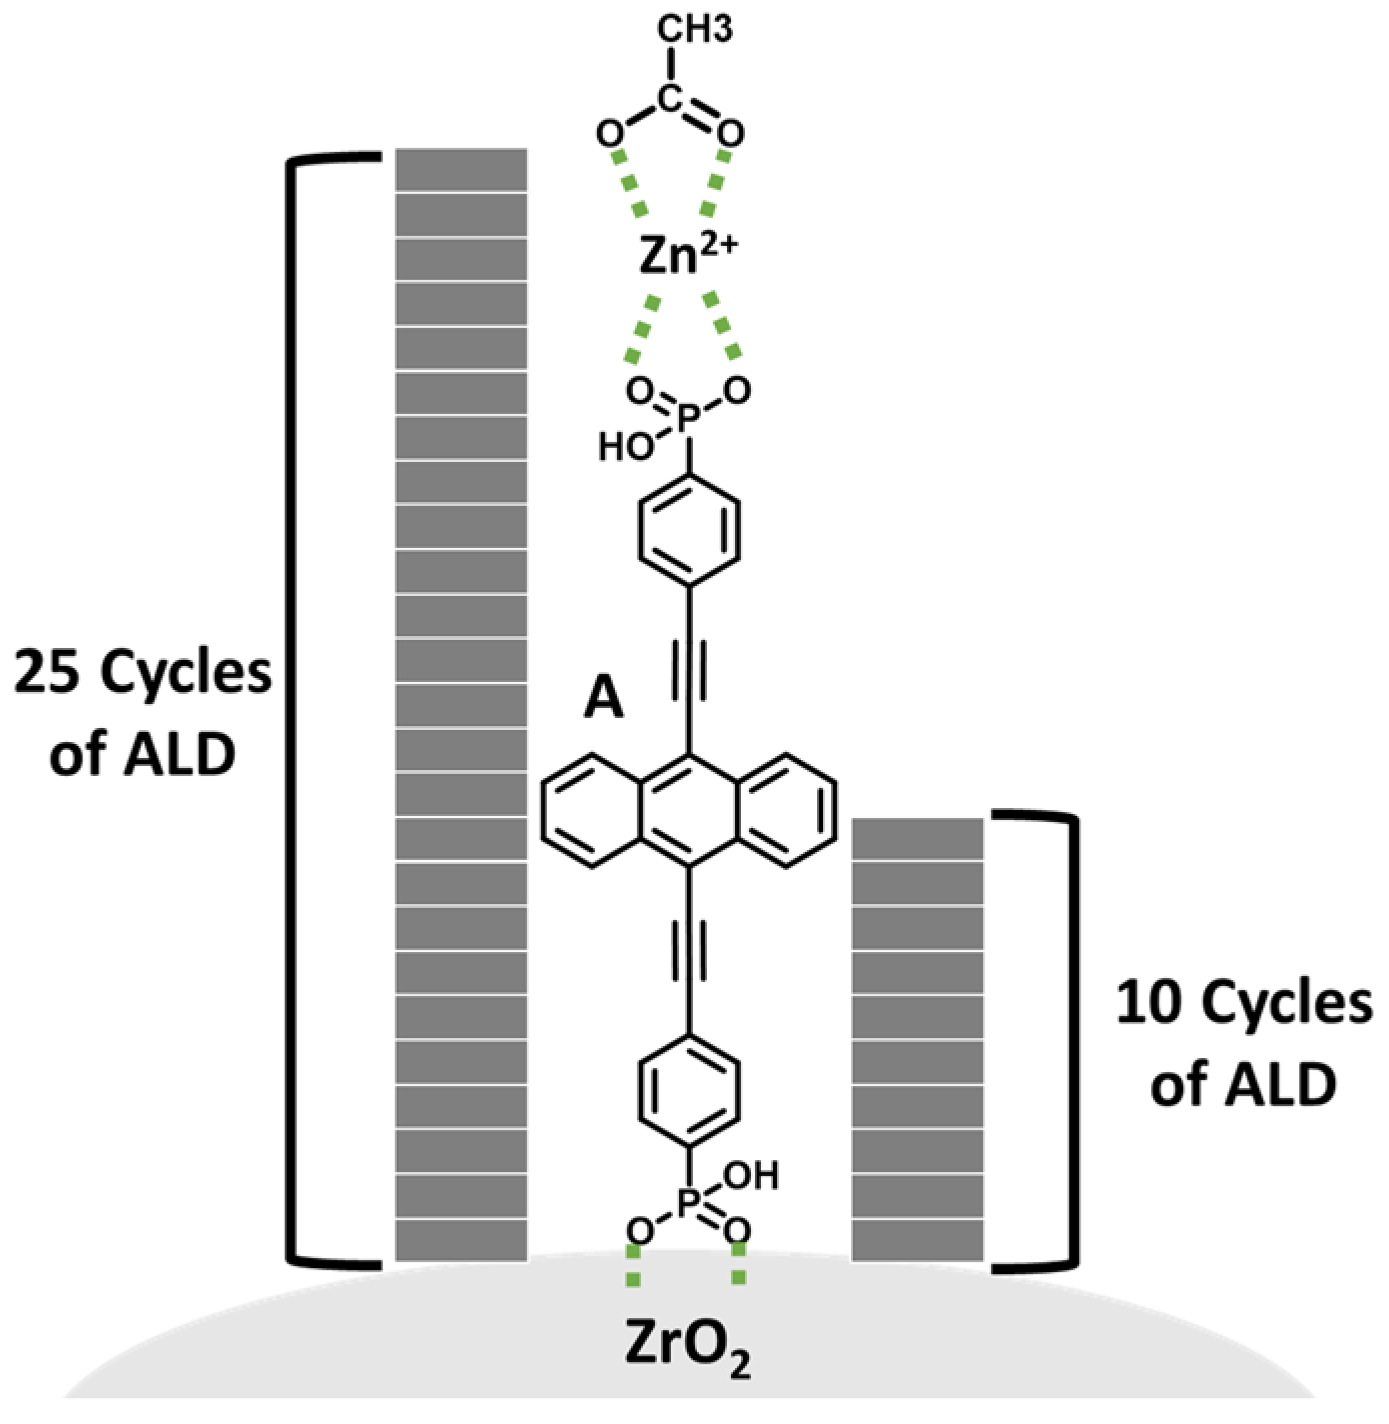
Figure 1. Depiction of ZrO2-A interface with the approximate thickness of 10 and 25 cycles of ALD (i.e., TMA/H2O) assuming complete Al2O3 layer growth at a rate of 1.1 Å per cycle.
Molecules 28 04835 g001
Figure 2. ATR-IR spectra of ZrO2, ZrO2-A, ZrO2-A-Zn, and ZrO2-A-Zn after 10 cycles of ALD (ZrO2-A-Zn + Al2O3) as well as neat powders of Al2O3, A, and Zn(OAc)2.
Molecules 28 04835 g002
Figure 3. Absorbance (solid line) and emission (dotted line) spectra of A in DMSO and A on ZrO2 at 10%, 50%, and 100% surface loading. (λex = 395 nm).
Molecules 28 04835 g003
Figure 4. Transient absorption spectra from 0.5 to 7000 ps (black to light green) for ZrO2-A in MeCN with (a) 10%, (b) 50%, and (c) 100% loading as well as (d) A in DMSO; (e) 0.5 ps time slices for all samples normalized to the peak at 610 nm. (λex = 475 nm).
Molecules 28 04835 g004
Figure 5. Absorbance (solid lines) and emission (dotted lines) of 50%-loaded ZrO2-A-Zn with 0 (black), 10 (red), and 25 (blue) cycles of TMA/H2O. (λex = 395 nm).
Molecules 28 04835 g005
Figure 6. Transient absorption spectra from 0.5–7000 ps (black to light green) for 50%-loaded ZrO2-A-Zn in MeCN with (a) 0, (b) 10, and (c) 25 cycles TMA/H2O loading as well as (d) A in DMSO. (λex = 475 nm); (e) the 0.5 ps time slices for all samples normalized to the peak at 610 nm.
Molecules 28 04835 g006
Figure 7. Absorption spectra changes for 50%-loaded ZrO2-A-Zn with 0 (black squares), 10 (red circles), and 25 (blue triangles) cycles of TMA/H2O monitored at 400 nm. Solid lines are the biexponential fits, and τw is the weighted average of those fits. (λex = 455 nm).
Molecules 28 04835 g007
Table 1. Emission decay fitting parameters at 500 and 600 nm for A in DMSO (sol’n) and ZrO2-A at 10%, 50%, and 100% loading in acetonitrile. Error bars are the standard deviation of three independent measurements. (λex = 405 nm).
Sample500 nm600 nm
A1τ1 (ns)A2τ2 (ns)τw (ns) aA1τ1 (ns)A2τ2 (ns)τw (ns) a
Sol’n----2.6 ± 0.1 b----2.7 ± 0.1 b
10%0.650.30.0174.23.7 ± 0.80.300.70.02310.910.4 ± 0.3
50%0.940.20.0085.85.2 ± 0.50.300.80.02711.811.2 ± 0.5
100%0.500.30.0036.75.4 ± 0.50.320.60.0299.28.8 ± 0.9
a From the weighted average of the biexponential fit parameters. b from the single exponential fit.
Disclaimer/Publisher’s Note: The statements, opinions and data contained in all publications are solely those of the individual author(s) and contributor(s) and not of MDPI and/or the editor(s). MDPI and/or the editor(s) disclaim responsibility for any injury to people or property resulting from any ideas, methods, instructions or products referred to in the content.