Article

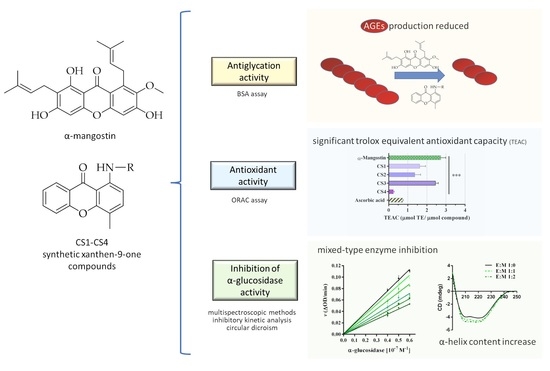
Anti-α-Glucosidase and Antiglycation Activities of α-Mangostin and New Xanthenone Derivatives: Enzymatic Kinetics and Mechanistic Insights through In Vitro Studies

by
Francine Medjiofack Djeujo
1,
Valeria Francesconi
2,
Maddalena Gonella
1,
Eugenio Ragazzi
1,
Michele Tonelli
2,* and
Guglielmina Froldi
1,*
1
Department of Pharmaceutical and Pharmacological Sciences, University of Padova, 35131 Padova, Italy
2
Department of Pharmacy, University of Genova, 16132 Genova, Italy
*
Authors to whom correspondence should be addressed.
Molecules 2022, 27(2), 547; https://doi.org/10.3390/molecules27020547
Submission received: 22 December 2021 / Revised: 11 January 2022 / Accepted: 12 January 2022 / Published: 15 January 2022

Abstract

:
Diabetes mellitus is characterized by chronic hyperglycemia that promotes ROS formation, causing severe oxidative stress. Furthermore, prolonged hyperglycemia leads to glycation reactions with formation of AGEs that contribute to a chronic inflammatory state. This research aims to evaluate the inhibitory activity of α-mangostin and four synthetic xanthenone derivatives against glycation and oxidative processes and on α-glucosidase, an intestinal hydrolase that catalyzes the cleavage of oligosaccharides into glucose molecules, promoting the postprandial glycemic peak. Antiglycation activity was evaluated using the BSA assay, while antioxidant capacity was detected with the ORAC assay. The inhibition of α-glucosidase activity was studied with multispectroscopic methods along with inhibitory kinetic analysis. α-Mangostin and synthetic compounds at 25 µM reduced the production of AGEs, whereas the α-glucosidase activity was inhibited only by the natural compound. α-Mangostin decreased enzymatic activity in a concentration-dependent manner in the micromolar range by a reversible mixed-type antagonism. Circular dichroism revealed a rearrangement of the secondary structure of α-glucosidase with an increase in the contents of α-helix and random coils and a decrease in β-sheet and β-turn components. The data highlighted the anti-α-glucosidase activity of α-mangostin together with its protective effects on protein glycation and oxidation damage.

Graphical Abstract

1. Introduction

The main causes of morbidity in diabetes mellitus (DM) are chronic complications resulting from prolonged hyperglycemia [1]. These can be alleviated through careful and continuous blood glucose control. Micro- and macrovascular damage occurs at the arterial level, causing cardiovascular and cerebrovascular diseases that can result in cardiac infarction and stroke [2,3]. In the condition of chronic hyperglycemia, glucose tends to form covalent adducts with plasma proteins (albumin, fibrinogen, globulins, collagen) through a nonenzymatic process known as glycation [1,4]. Protein glycation and formation of advanced glycation end products (AGEs) play a crucial role in the pathogenesis of DM-related complications such as retinopathy, nephropathy, and cardiomyopathy [1]. Recent studies suggest that AGEs interact with the plasma membrane by specific receptors (RAGE), changing intracellular signal transmission, modifying gene expression, and promoting the release of pro-inflammatory molecules and free radicals [5]. The enzyme α-glucosidase is an intestinal hydrolase located in the brush-rim membrane of intestinal cells that catalyzes the cleavage of food oligosaccharides into glucose molecules, promoting the postprandial glycemic peak. Inhibition of the enzyme activity determines a significant delay in intestinal glucose absorption by decreasing the postprandial glycemic peak and helping glycaemia control [6], also in the multi-drug combination therapy [7,8].
α-Mangostin is a 9H-xanthene-9-one derivative mainly isolated from the fruit of Garcinia mangostana L. (Clusiaceae family), commonly known as mangosteen, a plant widely cultivated in Southeast Asian countries [8,9,10]. Studies have shown that the plant-derived α-mangostin possesses several pharmacological properties, including anti-inflammatory, antidiabetic, cardioprotective, and antimicrobial activities [10,11,12,13,14]. α-Mangostin and related xanthones are generally considered safe and well tolerated in vivo [15,16].
In general, in the literature, xanthenone compounds (dibenzo-γ-pyrones) have been shown to possess numerous biological properties such as antiproliferative, anti-HIV, anticholinesterase, and antimalarial effects but are also known to have inhibitory activity against α-glucosidase [17]. Molecular modeling studies have shown that xanthenone derivatives are capable of binding to allosteric sites of α-glucosidase, mainly establishing π-stacking interactions, and when additional aromatic moieties are introduced as decorations of the main core, biological performance increases due to hydrophobic contacts with the target enzyme. Furthermore, improvements in inhibitory activity could be observed by including oxygen or nitrogen-containing groups on these aromatic units [17,18]. Applying a molecular simplification strategy to α-mangostin structure, we synthesized a small set of xanthenone derivatives (CS1–CS4), substituted at position 1 with various side chains, bearing polar groups, and with a methyl group at position 4 (Figure 1).
The purpose of this investigation was to explore the potential of the plant-derived α-mangostin and related synthetic xanthenone derivatives CS1–CS4 as antidiabetic agents. The study was performed by evaluating the following: (i) antiglycation activity using the bovine serum albumin (BSA) assay, (ii) antioxidant activity with oxygen radical absorbance capacity (ORAC) test, and (iii) anti-α-glucosidase activity. The inhibition of α-glucosidase activity was deepened through enzymatic kinetics and fluorescence studies, which have allowed us to understand the type of interaction and the inhibition mechanism.

2. Results and Discussion

2.1. α-Mangostin and Synthetic Compounds CS1–CS4: Chemistry

The ability of α-mangostin to exert antidiabetic effects was studied together with four synthetic compounds (CS1–CS4) to investigate new chemical characteristics in the xanthenone core (Figure 1).
For the synthesis of compounds CS1-CS4 a mixture of 1-chloro-4-methyl-9H-xanthen-9-one, prepared according to [19], with the appropriate amine derivative was melted at 170 °C in a sealed tube for 4 h (Scheme 1).
The structure of the synthetic compounds was confirmed using 1H and 13C NMR and elemental analysis. The purity of the compounds checked by elemental analysis was ≥95%.

2.2. α-Mangostin and Synthetic Compounds CS1–CS4: Antiglycation Activity

α-Mangostin and synthetic compounds were evaluated with the BSA assay, which measures the fluorescence produced by the AGE formation from ribose and albumin reaction [20]. Aminoguanidine (25 mM) was used as a reference inhibitor (positive control) [21,22]. In this setup, glycation increased significantly after two days of incubation, while maximum AGE production was detected after 5 days, and then it became stable at 7 and 9 days (Figure S1, Supplementary Materials).
Figure 2 shows the effect of α-mangostin (5–75 μM) on ribose-induced albumin glycation. The natural compound showed a concentration-dependent inhibition, with a maximum effect at 75 μM after 2 days of incubation (−30%). Inhibition was maintained at 5 and 7 days, even if it gradually decreased afterward. These results agree with a previous study showing the anti-AGE effect of some xanthones isolated from a methanol extract of Garcinia mangostana where 100 µM α-mangostin significantly inhibited three-day ribose-induced glycation [23].
Figure 3 reports the inhibitory activity of the synthetic xanthenones CS1–CS4. Interestingly, compounds CS2 and CS3 at the highest concentration tested produced an antiglycation effect of 32% and 25%, respectively, on day 2, which gradually decreased during incubation, showing an inhibition comparable to α-mangostin. Thus, the 1-(3-hydroxypropyl)amino and 1-(2-morpholinoethyl)amino chains of CS2 and CS3 have emerged as novel fragments of the xanthone nucleus, capable of promoting inhibition of AGE production. Otherwise, CS1 and CS4 only slightly reduced glycation at the highest concentration tested (days 2 and 5). Overall, α-mangostin and, among synthetic compounds, mainly CS2 and CS3 showed significant antiglycation activities. Previously, other authors suggested that a G. mangostana total methanol extract and four isolated phenolic compounds reduce fructosamine (Amadori product) and protein aggregation formation in glucose and ribose-induced BSA glycation [24]. However, the specific mechanisms involved in the antiglycation activity of the considered compounds merit future investigation.

2.3. α-Mangostin and Synthetic Compounds CS1–CS4: Antioxidant Activity

Since the antiglycation activity of α-mangostin and synthetic compounds could be related to their antioxidant capacity, the oxygen radical absorbance capacity (ORAC) assay was performed. This test evaluates the ability of compounds to inhibit the oxidative degradation of a fluorescent probe caused by peroxyl radicals (ROO) through the hydrogen atom transfer (HAT) mechanism [25,26]. In this investigation, ascorbic acid was used as a reference inhibitor (positive control) [27].
The antiradical activity of α-mangostin was approximately four times higher than that of ascorbic acid: 2.73 ± 0.26 μmol TE/μmol and 0.69 ± 0.03 μmol TE/μmol, respectively (Figure 4). Among the synthetic compounds, CS3 showed the highest activity (2.44 ± 0.16 μmol TE/μmol), followed by CS1 (1.83 ± 0.28 μmol TE/μmol), CS2 (1.36 ± 0.31 μmol TE/μmol), and CS4 (0.24 ± 0.05 μmol TE/μmol). The order of antioxidant activity was α-mangostin > CS3 > CS1 ≥ CS2 > ascorbic acid > CS4. α-Mangostin is a natural polyphenol that has been reported to have antioxidant activity thanks to the hydroxyl groups; in particular, the authors indicated that the C-6 OH group is fundamental in HAT mechanism [28,29]. Analogous considerations have been reported for other xanthone derivatives, whose antioxidant activity was found to be affected by the number and position of hydroxyl groups [30]. In particular, although morpholinoethylamino xanthenone CS3 is devoid of any hydroxyl group, it ranks second in potency. Therefore, the exploration of novel biologically relevant regions of chemical space around the xanthone scaffold may deserve further investigation. It should be noted that antiradical activity can be useful in trapping intermediate dicarbonyl compounds, decreasing glycation and AGE formation [31].

2.4. Yeast α-Glucosidase Inhibitory Activity

2.4.1. α-Mangostin and Synthetic Compounds CS1–CS4

The inhibitory activity of α-mangostin and synthetic compounds was studied by a colorimetric assay using pNPG as a substrate. α-Glucosidase hydrolyzes pNPG into α-D-glucopyranoside and p-nitrophenol (yellow) whose chromatic intensity was detected: staining decreases proportionally to the ability of an inhibitor to counteract enzyme activity [32].
Figure 5 A shows the absorbance curves during the 60 min reaction between 0.04 µM α-glucosidase and 2 mM pNPG in the presence of α-mangostin (1–50 µM). The compound inhibited the degradation of pNPG in a concentration-dependent manner, reducing the enzyme activity. Inhibition with 5 µM α-mangostin was 25.5 ± 2.6% (p < 0.001), while with 50 µM, 60.8 ± 2.5% (p < 0.001).
Furthermore, the inhibition of α-mangostin was assessed using 0.05 and 0.06 µM α-glucosidase. As expected, with higher enzyme concentrations, the absorbance curves moved to the left, and the plateau was reached in a shorter time. Table 1 reports the Km and Vmax values obtained with 0.05 µM α-glucosidase alone and in the presence of α-mangostin. Km increased, while the maximum reaction velocity (Vm) decreased with increasing inhibitor concentrations (Table 1), suggesting a mixed-type interaction between α-mangostin and the enzyme.
Unlike the natural compound, the compounds CS1 and CS4 tested from 1 μM to 100 μM did not inhibit the α-glucosidase activity; additionally, CS2 and CS3, which were used at lower concentrations (up to 25 μM) due to their minor solubility, were inactive (Figure S2, Supplementary materials). On this basis, it can be deduced that inhibition of α-glucosidase activity is mainly driven by the chemical nature and disposition of substituents on the xanthenone scaffold rather than the xanthenone core itself. Therefore, further investigations into α-glucosidase inhibition were only performed with α-mangostin.
To study the type of interaction between the enzyme and α-mangostin, the graph “v versus [α-glucosidase]” was evaluated (Figure 5B), suggesting a concentration-dependent reversible interaction since all straight lines obtained at different concentrations of α-mangostin pass through the origin of the axes, and their slope decreased with increasing concentrations of the inhibitor. With 0.05 μM α-glucosidase and 2 mM pNPG, the IC50 of α-mangostin was 31.1 μM (pIC50 = 4.51 ± 0.04), showing a higher affinity than acarbose, IC50 = 1712 μM (pIC50 = 2.77±0.04), tested as a positive control, resulting in an inhibitory potency ratio of 55. Other authors reported the α-mangostin inhibition on α-glucosidase, showing IC50 values ranging from 1.3 to 29.3 μM [11,12,13,33,34]; among these investigations, only three compared the inhibition with that of acarbose, evidencing a potency ratio of 2.1, 8.2 and 18.8 [11,13,34].

2.4.2. α-Mangostin Inhibition with Different Concentrations of pNPG

An in-depth study of the α-mangostin interaction was performed using five different concentrations of substrate pNPG, from 0.25 mM to 2 mM, while the concentration of α-glucosidase was maintained constant (0.05 µM). Figure 6 reports the graphical elaborations of Michaelis–Menten (A) and Lineweaver–Burk (B). In particular, the Lineweaver–Burk plot suggests a mixed-type inhibition, since the lines intercept in the second quadrant (Figure B). The mixed-type inhibitor has different affinities for the free enzyme and enzyme–substrate complex. Furthermore, the secondary slope plots were linear, suggesting that α-mangostin acts as a complete inhibitor [35]. Secondary plots of the slope and intercept (Figure 6C,D) of the data depicted in Figure 6 B provide a means to determine the kinetic constants describing the enzyme kinetics (Table 2). For α-mangostin, the inhibition constant of the enzyme (Ki) and the inhibition constant of the enzyme–substrate complex (Ki′) were, respectively, 30.33 µM and 45.60 µM, suggesting that the inhibitor preferentially binds the free enzyme, as Ki was lower than Ki’. The catalytic efficiency of α-glucosidase expressed as Kcat/Km was also calculated, showing that the values decreased in the presence of α-mangostin, suggesting a decrease in the catalytic efficiency of α-glucosidase (Table 2). In general, the trend of the kinetic parameters (Km, Kcat, Ki, Ki’, Vmax) and Figure 6 reveal a mixed-type inhibition of α-mangostin on α-glucosidase.

2.4.3. α-Glucosidase Fluorescence Quenching by α-Mangostin

Furthermore, for the first time, the effects of α-mangostin on the secondary structure of the enzyme have been investigated using circular dichroism and synchronous fluorescence spectroscopic techniques. α-Glucosidase showed an emission peak at 340 nm, as previously reported [36,37]. Figure 7 shows the high fluorescence intensity of α-glucosidase at 344 nm when excited at 280 nm, detected at 298, 304, and 310 K, alone and in the presence of α-mangostin. It can be observed that the fluorescence intensity progressively decreased as the concentration of α-mangostin increased, suggesting a specific interaction. Stern–Volmer constant (Ksv) and bimolecular quenching constant (Kq) were determined using the graphs F0/F vs. [Q], Figure 7 D. It is known that fluorophore quenching can occur by dynamic and/or static quenching processes [38]. These types of mechanism can be distinguished by their different dependences on temperature and excited-state lifetime. With α-mangostin, the Ksv and Kq values are positively correlated with temperature, and the Kq values were three orders of magnitude higher than the limiting diffusion constant Kdif of the biomolecule (Kdif = 2.0 × 10¹⁰ M−1 s−1) [38], confirming a specific interaction between α-mangostin and the enzyme (Table 3) [39]. Furthermore, these results indicate that the quenching of α-glucosidase by α-mangostin is a static–dynamic process driven mainly by hydrophobic interactions, as previously shown for other compounds, such as procyanidins [40]. No other studies have been found in the literature about α-mangostin fluorescence quenching.
The possibility of obtaining characteristic information on the tyrosine and tryptophan residues of α-glucosidase using synchronous fluorescence spectroscopy has been described [41]. In detail, yeast α-glucosidase contains 589 amino acids with 20 tryptophan and 27 tyrosine residues [37]. Figure 8 shows the synchronous fluorescence spectra of the tyrosine (A) and tryptophan (B) residues with different concentrations of α-mangostin (0.05–1.5 µM). The shift from 285 to 287.5 nm for α-mangostin (Figure 8A) was observed with ∆λ = 15 nm, while there was no modification with ∆λ = 60 nm (Figure 8B), suggesting that the enzyme–ligand interaction did not influence the microenvironment of tryptophan residues. Therefore, the results show a change in the microenvironment of tyrosine, indicating that α-mangostin affected the structure of α-glucosidase.

2.4.4. Circular Dichroism Measurements

Circular dichroism (CD) spectroscopy was used for the characterization of the secondary structure of α-glucosidase and to estimate its changes during interaction with α-mangostin. According to previous studies [42,43], enzyme CD spectra reported two negative minimum values at 209 and 222 nm, which coincide with α-helix structure (Figure 9). The presence of α-mangostin (molar ratio 1:1 and 1:2) increased both negative humped peaks compared to α-glucosidase alone, indicating that the α-helix content increases, while β-sheet and β-turn decrease (Table 4). No published dichroism studies have been found for α-mangostin. The increase in α-helix and random coil contents suggests that the enzyme structure tends to be more compact in the presence of α-mangostin, with a decrease in the catalytic activity of α-glucosidase, as shown, e.g., for oleanolic and ursolic acids [44].

3. Materials and Methods

3.1. Reagents

Acarbose, α-glucosidase (EC 3.2.1.20, Saccharomyces cerevisiae type I, 10 U/mg protein), p-nitrophenyl-α-d-glucopyranoside (pNPG), α-mangostin (1,3,6-trihydroxy-7-methoxy-2,8-bis(3-methylbut-2-en-1-yl)-9H-xanthen-9-one). All chemicals and solvents were purchased from Merck KGaA, Darmstadt, Germany. The purity of the reference standards was ≥97%, while other chemicals were of at least of analytical grade.

3.2. Chemistry

3.2.1. General Information

Melting points (uncorrected) were determined using a Büchi apparatus (Milan, Italy). 1H NMR spectra and 13C NMR spectra were recorded by a Jeol instrument (Milan, Italy) at 400 and 101 MHz, respectively; chemical shifts were reported as δ (ppm) and referenced to the solvent signal: DMSO-d6, quintet at 2.5 ppm (1H), septet at 39.5 ppm (13C); J in Hz. Elemental analyses were performed on a Flash 2000 CHNS instrument (Thermo Scientific, Milan, Italy) in the Microanalysis Laboratory of the Department of Pharmacy, University of Genova. The results of the elemental analyses indicated that the purity of all compounds was >95%.

3.2.2. General Synthesis of Compounds CS1–CS4

A mixture of 1-chloro-4-methyl-9H-xanthen-9-one (1.3 mmol) with the proper amino compound (2.6 mmol) was heated at 170 °C in a sealed tube for 4 h. After cooling, the mixture was treated with 2 N HCl and extracted with CH2Cl2 (20 mL × 3). The acid solution was then alkalinized with 6 N NaOH and extracted exhaustively extracted with CH2Cl2 (20 mL × 4). The organic layer was dried with anhydrous Na2SO4, filtered, and evaporated under vacuum, producing a yellow residue that was purified by CC (SiO2/CH2Cl2 + 5%MeOH). While compounds CS2–CS4 were obtained as yellow-orange crystalline solids, CS1 was an orange oil, which was converted into its corresponding monohydrochloride salt by the addition of an equimolar amount of 1 N ethanolic solution of HCl.
1-{[4-(2-Hydroxyethyl)piperazin-1-yl]amino}-4-methyl-9H-xanthen-9-one hydrochloride (CS1), Yield: 28%; m.p. 194–195 °C (monohydrochloride salt); anal calculation for C20H23N3O3·HCl: % C 61.61; H 6.20; N 10.78; found % C 61.81; H 5.94; N 10.11. 1H NMR (400 MHz, DMSO-d6): δ 10.37 (s, 1H, NH), 8.05 (dd, J = 7.9, 1.6 Hz, 1H, H(8)), 7.62–7.74 (ddd, J = 8.6, 7.1, 1.7 Hz, 1H, H(6)), 7.54 (dd, J = 8.3 Hz, 2H, H(3,5)), 7.36 (t, J = 7.5 Hz, 1H, H(7)), 6.83 (d, J = 8.2 Hz, 1H. H(2)), 3.78 (pseudo s, superimposed on the DMSO signal, 2H, CH2-OH), 3.58 (d, J = 11.5 Hz, 2H, N-CH2-CH2OH), 3.38 (d, J = 13.2 Hz, 4H, NH-N(CH2)2 piperazine), 3.26 (t, J = 5.2 Hz, 2H, N-(CH2)2 Hα piperazine), 3.21–3.11 (m, 2H, N-(CH2)2 Hβ piperazine), 2.46 (t, J = 1.8 Hz, 1H, OH), 2.35 (s, 3H, CH3). 13C NMR (101 MHz, DMSO-d6) δ 208.76, 173.53, 157.86, 154.58, 150.50, 136.25, 134.82, 127.14, 124.29, 122.42, 120.33, 116.69, 114.28, 113.08, 58.98, 56.36, 52.40, 48.45, 31.21, 18.29.
1-[(3- Hydroxypropyl)amino]-4-methyl-9H-xanthen-9-one (CS2), Yield: 64%; m.p. 145–146 °C; Anal calculation for C16H15NO3: % C 72.07; H 6.05; N 4.94; found % C 72.32; H 6.05; N 4.77. 1H NMR (400 MHz, CDCl3): δ 9.33 (s, 1H, NH), 8.19 (dd, J = 7.9, 1.7 Hz, 1H, H(8)), 7.62 (p, J = 7.8, 1.6 Hz, 1H, H(6)), 7.39 (d, J = 8.3 Hz, 1H, H(3)), 7.33–7.23 (m, 2H, H(7,5)), 6.33 (d, J = 8.5 Hz, 1H, H(2)), 3.85 (t, J = 6.1 Hz, 2H, NH-CH2-), 3.35 (q, J = 6.4 Hz, 2H, -CH2-OH), 2.31 (s, 3H, CH3), 1.99 (p, J = 6.4 Hz, 2H, -CH2-CH2-CH2-), 1.78 (s, 1H, OH). 13C NMR (101 MHz, CDCl3): δ 180.30, 155.54, 155.44, 150.35, 137.68, 134.10, 126.05, 123.53, 122.04, 117.39, 110.43, 107.07, 103.15, 60.67, 39.82, 31.75, 15.12.
4-Methyl-1-((2-morpholinoethyl)amino)-9H-xanthen-9-one (CS3), Yield: 40%; m.p. 125–126 °C; Anal calculation for C16H15NO3: % C 70.99; H 6.55; N 8.28; found % C 70.68; H 5.99; N 7.97. 1H NMR (400 MHz, CDCl3): δ 9.42 (s, 1H, NH), 8.22 (dd, J = 8.0, 1.8 Hz, 1H, H(8)), 7.66–7.56 (m, 1H, H(6)), 7.38 (d, J = 8.4 Hz, 1H, H(3)), 7.32–7.25 (m, 2H, H(7,5)), 6.31 (d, J = 8.5 Hz, 1H, H(2)), 3.77 (t, J = 4.7 Hz, 4H, -(CH2)2O morpholine), 3.34 (q, J = 6.6 Hz, 2H, NH-CH2CH2- morpholine), 2.72 (t, J = 6.6 Hz, 1H, NH-CH2CH2- morpholine), 2.55 (pseudo s, 4H, -(CH2)2N morpholine), 2.32 (s, 3H CH3). 13C NMR (101 MHz, CDCl3): δ 180.13, 155.60, 155.43, 150.07, 137.54, 134.06, 126.18, 123.49, 122.13, 117.38, 110.63, 107.25, 103.14, 67.07 (2C), 57.13, 53.71 (2C), 40.11, 15.15.
1-((Benzo[d][1,3]dioxol-5-ylmethyl)amino)-4-methyl-9H-xanthen-9-one (CS4), Yield: 30%; m.p. 154–156 °C; Anal calculation for C16H15NO3: % C 75.53; H 4.77; N 3.90; found % C 75.20; H 4.50; N 3.64. 1H NMR (400 MHz, CDCl3): δ 9.70 (s, 1H, NH), 8.21 (dd, J = 8.0, 1.7 Hz, 1H, H(8)), 7.64 (ddd, J = 8.6, 7.1, 1.7 Hz, 1H, H(6)), 7.41 (d, J = 8.3 Hz, 1H, H(3)), 7.33–7.28 (m, 1H, H(7)), 7.27–7.23 (m, 1H, H(5)), 6.90–6.82 (m, 2H, H(2) and H(4′) benzodioxol), 6.76 (d, J = 7.9 Hz, 1H, H(6′) benzodioxol), 6.28 (d, J = 8.4 Hz, 1H, H(7′) benzodioxol), 5.92 (s, 2H, O-CH2-O), 4.37 (d, J = 5.6 Hz, 2H, NH-CH2- benzodioxol), 2.32 (s, 3H, CH3). 13C NMR (101 MHz, CDCl3): δ 180.39, 155.54, 155.48, 149.93, 148.06, 146.79, 137.58, 134.19, 132.65, 126.12, 123.58, 122.07, 120.40, 117.45, 111.05, 108.46, 107.87, 107.32, 103.74, 101.08, 47.04, 15.16, 4.5.

3.3. Detection of Advanced Glycation End Products

The preparation of glycated serum albumin was performed according to a previously described method [45,46]. Shortly, AGEs were determined using BSA (50 mg/mL, pH 7.4) as protein substrate and ribose (0.1 M) as glycation agent. Each compound tested from 5 to 75 μM was added in BSA-ribose reaction and incubated at 37 °C for 2, 5, 7, and 9 days. The fluorescence intensity was measured at the excitation wavelength of 355 nm and emission wavelength of 460 nm with a PerkinElmer Victor Nivo microplate reader (Waltham, MA, USA). Aminoguanidine (25 mM) was used as a positive control. The inhibition of AGE formation was calculated as the fluorescence difference between glycation under the control condition and in the presence of the inhibitor, expressed as a percentage.

3.4. Measurement of the Oxygen Radical Absorbance Capacity

The oxygen radical absorbance capacity (ORAC) assay allows evaluating the ability of substances to interfere with oxidative reactions induced by peroxidic radicals. The assay was performed as previously reported [47,48]. Briefly, 6-hydroxy-2,5,7,8-tetramethylchroman-2-carboxylic acid (trolox) was prepared in phosphate buffer in a concentration range of 6.25–50 μM. Fluorescein (1.5 mL of 0.08 μM solution) was added to 24-well plates, followed by 250 μL of trolox for the controls, 250 μL of buffer for the blank, and 250 μL for the samples (5.0 and 10 μg/mL). After 10 min of incubation at 37 °C, 250 μL of 0.15 M 2,2′-azobis(2-amidinopropane)-dihydrochloride (AAPH) were added. Successively, the PerkinElmer Victor Nivo microplate reader (Waltham, MA, USA) was settled for a fluorescence kinetic reading at 37 °C for 45 min, with excitation and emission wavelengths of 485 and 530 nm, respectively. Data were expressed as TEAC (trolox equivalent antioxidant capacity, TE μmol/ μmol compound).

3.5. Measurement of α-Glucosidase Activity

The assay was used to detect the ability of each compound (5–100 µM) to reduce the activity of yeast α-glucosidase (EC 3.2.1.20, Saccharomyces cerevisiae type I, 10 U/mg protein) in the presence of the substrate p-nitrophenyl-α-d-glucopyranoside (pNPG) [49]. Acarbose (1.25 M) was used as a positive control. Each sample was incubated with α-glucosidase 0.4, 0.5, and 0.6 µM and 0.1 M PBS (pH 6.8) for 10 min, at 37 °C. The reaction started by adding pNPG. Absorbance values were detected at 405 nm for 45 min, using a PerkinElmer Victor Nivo microplate reader (Waltham, MA, USA). The α-glucosidase activity in the absence of inhibitors was defined as 100%. Half-maximal inhibitory concentration (IC50) was estimated by plot of relative enzyme activity versus inhibitor concentration. The type of enzyme inhibition exerted by α-mangostin was evaluated from kinetic studies using different substrate concentrations (0.25–2.0 mM pNPG) applying Michaelis–Menten and Lineweaver–Burk plots.

3.5.1. Fluorescence Quenching Analysis

The interaction of α-mangostin with α-glucosidase was studied using the fluorescence quenching method [50]. The fluorescence of α-glucosidase alone and in the presence of the inhibitor was studied at different concentrations (Jasco FP-6500 spectrofluorometer, Japan). Measurements were made in the emission range of 300–500 nm, with an excitation of 280 nm, after 10 min of stabilization. The fluorescent spectra of α-glucosidase (0.35 µM) and inhibitor (0.05–1.5 µM) were carried out at three different temperatures (298, 304 and 310 K), and the bandwidths were set at 5 nm for both emission and excitation slits. For each sample, three fluorescence spectra were acquired, and the blank was subtracted. The compound quenching mechanism was evaluated using the Stern–Volmer equation [51]. Synchronous fluorescence spectra were collected in the emission range of 260–320 nm [52]. The difference between excitation and emission wavelength (Δλ) was established at 15 nm (for tyrosine residues) or 60 nm (for tryptophan residues) [53].

3.5.2. Circular Dichroism Measurements

To investigate changes in the secondary structure of α-glucosidase in the presence of α-mangostin, circular dichroism (CD) spectra were collected using the Jasco J-810 circular dichroism spectropolarimeter (Tokyo, Japan) at wavelengths between 200 and 250 nm in a nitrogen environment (1 atm). All solutions were prepared in PBS (pH 6.8). The quartz cuvette used had a path length of 1 cm. The concentration of α-glucosidase was 1 µM. The molar ratios of the enzyme/inhibitor were 1:0, 1:1, and 1:2. The blank and PBS signals were removed to produce an accurate background signal. Quantification of the different components of the secondary structure of the enzyme was established using the online SELCON3 program (accessed on 20/12/2021) [54].

3.6. Statistical Analysis

Data are expressed as mean ± SEM of at least three independent experiments. Results were analyzed using Microsoft Excel for Windows 10, while sigmoid curve fitting and statistical evaluations were performed using GraphPad Prism 6 (San Diego, CA, USA). The half maximal inhibitory concentration (IC50) was estimated by nonlinear regression. The difference between controls and each treatment was assessed using Student’s t test. Statistical comparisons among three or more groups were performed using ANOVA, followed by Tukey’s multiple comparison test. The level of significance was established at p < 0.05.

4. Conclusions

α-Mangostin exhibits antiglycation, antioxidant, and anti-α-glucosidase activities, while synthetic compounds CS1–CS4 showed antioxidant activity and inhibited albumin glycation but missed the inhibition of the enzyme. Thus, the xanthenone nucleus requires further structural functionalization toward the development of improved antidiabetic agents with easily accessible chemical synthesis. In detail, α-mangostin decreased the enzymatic activity in a concentration-dependent manner in the micromolar range by a reversible mixed-type inhibition by changing the secondary structure in the tyrosine microenvironment, increasing the α-helix and random coils.
This research provides new information on the inhibitory mechanism of α-mangostin on α-glucosidase; however, additional in vitro and in vivo studies are required for candidate α-mangostin in the therapy of diabetes mellitus.

Supplementary Materials

The following are available online, Figure S1: AGE formation after 2, 5, 7 and 9 days of incubation of 50 mg/mL BSA with 0.1 M ribose., Figure S2: Effects of synthetic compounds CS1–CS4 on 0.04 µM α-glucosidase activity.

Author Contributions

Conceptualization, F.M.D., G.F., and M.T.; investigation, F.M.D., V.F., and M.G; software, F.M.D., M.G., and G.F.; data curation, F.M.D. and G.F.; writing—original draft preparation, G.F. and M.T.; writing—review and editing, G.F., M.T., and E.R.; funding acquisition, G.F., E.R. and M.T. All authors have read and agreed to the published version of the manuscript.

Funding

This research was funded by 2020 MUR (Italy).

Institutional Review Board Statement

Not applicable.

Informed Consent Statement

Not applicable.

Data Availability Statement

Not applicable.

Conflicts of Interest

The authors declare no conflict of interest.

Sample Availability

Samples of α-mangostin and CS1–CS4 compounds are available from the authors.

References

  1. Paul, S.; Ali, A.; Katare, R. Molecular complexities underlying the vascular complications of diabetes mellitus–A comprehensive review. J. Diabetes Its Complicat. 2020, 34, 107613. [Google Scholar] [CrossRef]
  2. Katakami, N. Mechanism of development of atherosclerosis and cardiovascular disease in diabetes mellitus. J. Atheroscler. Thromb. 2018, 25, 27–39. [Google Scholar] [CrossRef] [Green Version]
  3. Ceriello, A.; Catrinoiu, D.; Chandramouli, C.; Cosentino, F.; Dombrowsky, A.C.; Itzhak, B.; Lalic, N.M.; Prattichizzo, F.; Schnell, O.; Seferović, P.M.; et al. Heart failure in type 2 diabetes: Current perspectives on screening, diagnosis and management. Cardiovasc. Diabetol. 2021, 20, 1–19. [Google Scholar] [CrossRef]
  4. Fournet, M.; Bonté, F.; Desmoulière, A. Glycation damage: A possible hub for major pathophysiological disorders and aging. Aging Dis. 2018, 9, 880–900. [Google Scholar] [CrossRef] [PubMed] [Green Version]
  5. Shen, C.Y.; Lu, C.H.; Wu, C.H.; Li, K.J.; Kuo, Y.M.; Hsieh, S.C.; Yu, C.L. The development of Maillard reaction, and advanced glycation end product (AGE)-receptor for AGE (RAGE) signaling inhibitors as novel therapeutic strategies for patients with age-related diseases. Molecules 2020, 25, 5591. [Google Scholar] [CrossRef]
  6. Padhi, S.; Nayak, A.K.; Behera, A. Type II diabetes mellitus: A review on recent drug based therapeutics. Biomed. Pharmacother. 2020, 131, 110708. [Google Scholar] [CrossRef]
  7. Kusunoki, M.; Wakazono, N.; Wakazono, N.; Tsutsumi, K.; Tsutsumi, K.; Oshida, Y.; Oshida, Y.; Miyata, T.; Miyata, T. Combination therapy of α-glucosidase inhibitor, thiazolidinedione and sodium glucose co-transporter-2 inhibitor in Japanese type 2 diabetes patients. J. Endocrinol. Metab. 2020, 10, 6. [Google Scholar] [CrossRef]
  8. Blahova, J.; Martiniakova, M.; Babikova, M.; Kovacova, V.; Mondockova, V.; Omelka, R. Pharmaceutical drugs and natural therapeutic products for the treatment of type 2 diabetes mellitus. Pharmaceuticals 2021, 14, 806. [Google Scholar] [CrossRef] [PubMed]
  9. Liandhajani; Immaculata Iwo, M.; Sukrasno; Soemardji, A.A.; Hanafi, M. Sunscreen activity of α-mangostin from the pericarps of Garcinia mangostana Linn. J. Appl. Pharm. Sci. 2013, 3, 70–73. [Google Scholar] [CrossRef]
  10. Kumar, V.; Bhatt, P.C.; Kaithwas, G.; Rashid, M.; Al-abbasi, F.A.; Khan, J.A.J.; Anwar, F.; Verma, A. α-Mangostin mediated pharmacological modulation of hepatic carbohydrate metabolism in diabetes induced Wistar rat. Beni-Suef Univ. J. Basic Appl. Sci. 2016, 5, 255–276. [Google Scholar] [CrossRef] [Green Version]
  11. Usman, F.; Shah, H.S.; Zaib, S.; Manee, S.; Mudassir, J.; Khan, A.; Batiha, G.E.; Abualnaja, K.M.; Alhashmialameer, D.; Khan, I. Fabrication and biological assessment of antidiabetic α-Mangostin loaded nanosponges: In vitro, in vivo, and in silico studies. Molecules 2021, 26, 6633. [Google Scholar] [CrossRef]
  12. Ryu, H.W.; Cho, J.K.; Curtis-Long, M.J.; Yuk, H.J.; Kim, Y.S.; Jung, S.; Kim, Y.S.; Lee, B.W.; Park, K.H. α-Glucosidase inhibition and antihyperglycemic activity of prenylated xanthones from Garcinia mangostana. Phytochemistry 2011, 72, 2148–2154. [Google Scholar] [CrossRef] [PubMed]
  13. Vongsak, B.; Kongkiatpaiboon, S.; Jaisamut, S.; Machana, S.; Pattarapanich, C. In vitro α-glucosidase inhibition and free-radical scavenging activity of propolis from Thai stingless bees in mangosteen orchard. Rev. Bras. Farmacogn. 2015, 25, 445–450. [Google Scholar] [CrossRef] [Green Version]
  14. Gutierrez-Orozco, F.; Failla, M.L. Biological activities and bioavailability of mangosteen xanthones: A critical review of the current evidence. Nutrients 2013, 5, 3163–3183. [Google Scholar] [CrossRef] [PubMed] [Green Version]
  15. Do, H.T.T.; Cho, J. Mangosteen pericarp and its bioactive xanthones: Potential therapeutic value in Alzheimer’s disease, Parkinson’s disease, and depression with pharmacokinetic and safety profiles. Int. J. Mol. Sci. 2020, 21, 6211. [Google Scholar] [CrossRef]
  16. Chayaburakul, K.; Sukplang, P.; Pinpart, T.; Kengkoom, K. Acute and subchronic oral toxicity of xanthones extracted from the pericarp of Garcinia mangostana Linn. in Rat. Asian Arch. Pathol. 2015, 11, 57–70. [Google Scholar]
  17. Santos, C.M.M.; Freitas, M.; Fernandes, E. A comprehensive review on xanthone derivatives as α-glucosidase inhibitors. Eur. J. Med. Chem. 2018, 157, 1460–1479. [Google Scholar] [CrossRef]
  18. Ye, G.J.; Lan, T.; Huang, Z.X.; Cheng, X.N.; Cai, C.Y.; Ding, S.M.; Xie, M.L.; Wang, B. Design and synthesis of novel xanthone-triazole derivatives as potential antidiabetic agents: α-Glucosidase inhibition and glucose uptake promotion. Eur. J. Med. Chem. 2019, 177, 362–373. [Google Scholar] [CrossRef] [PubMed]
  19. Mauss, H. Über basisch substituierte xanthon- und thioxanthon-abkömmlinge; miracil, ein neues chemotherapeuticum. Chem. Ber. 1948, 81, 19–31. [Google Scholar] [CrossRef]
  20. Wei, Y.; Han, C.S.; Zhou, J.; Liu, Y.; Chen, L.; He, R.Q. D-ribose in glycation and protein aggregation. Biochimica Biophysica Acta–Gen. Subj. 2012, 1820, 488–494. [Google Scholar] [CrossRef]
  21. Thornalley, P.J. Use of aminoguanidine (Pimagedine) to prevent the formation of advanced glycation endproducts. Arch. Biochem. Biophys. 2003, 419, 31–40. [Google Scholar] [CrossRef]
  22. Rhee, S.Y.; Kim, Y.S. The role of advanced glycation end products in diabetic vascular complications. Diabetes Metab. J. 2018, 42, 188–195. [Google Scholar] [CrossRef]
  23. Abdallah, H.M.; El-Bassossy, H.M.; Mohamed, G.A.; El-Halawany, A.M.; Alshali, K.Z.; Banjar, Z.M. Mangostana xanthones III and IV: Advanced glycation end-product inhibitors from the pericarp of Garcinia mangostana. J. Nat. Med. 2017, 71, 216–226. [Google Scholar] [CrossRef] [PubMed]
  24. Abdallah, H.M.; El-Bassossy, H.; Mohamed, G.A.; El-Halawany, A.M.; Alshali, K.Z.; Banjar, Z.M. Phenolics from Garcinia mangostana inhibit advanced glycation endproducts formation: Effect on Amadori products, cross-linked structures and protein thiols. Molecules 2016, 21, 251. [Google Scholar] [CrossRef] [Green Version]
  25. Cao, G. Oxygen-radical absorbance capacity assay for antioxidants. Free Radic. Biol. Med. 1993, 14, 303. [Google Scholar] [CrossRef] [Green Version]
  26. Prior, R.L.; Wu, X.; Schaich, K. Standardized methods for the determination of antioxidant capacity and phenolics in foods and dietary supplements. J. Agric. Food Chem. 2005, 53, 4290–4302. [Google Scholar] [CrossRef]
  27. Cao, G.; Sofic, E.; Prior, R.L. Antioxidant and prooxidant behavior of flavonoids: Structure-activity relationships. Free Radic. Biol. Med. 1997, 22, 749–760. [Google Scholar] [CrossRef]
  28. Minami, H.; Kuwayama, A.; Yoshizawa, T.; Fukuyama, Y. Novel prenylated xanthones with antioxidant property from the wood of Garcinia subelliptica. Chem. Pharm. Bull. 1996, 2103–2106. [Google Scholar] [CrossRef] [Green Version]
  29. Thong, N.M.; Quang, D.T.; Bui, N.H.T.; Dao, D.Q.; Nam, P.C. Antioxidant properties of xanthones extracted from the pericarp of Garcinia mangostana (Mangosteen): A theoretical study. Chem. Phys. Lett. 2015, 625, 30–35. [Google Scholar] [CrossRef]
  30. Panda, S.S.; Chand, M.; Sakhuja, R.; Jain, S.C. Xanthones as potential antioxidants. Chem. Phys. Lett. 2013, 20, 4481–4507. [Google Scholar] [CrossRef]
  31. Anwar, S.; Khan, S.; Almatroudi, A.; Khan, A.A.; Alsahli, M.A.; Almatroodi, S.A.; Rahmani, A.H. A review on mechanism of inhibition of advanced glycation end products formation by plant derived polyphenolic compounds. Mol. Biol. Rep. 2021, 48, 787–805. [Google Scholar] [CrossRef] [PubMed]
  32. Kwon, Y.I.; Apostolidis, E.; Shetty, K. In vitro studies of eggplant (Solanum melongena) phenolics as inhibitors of key enzymes relevant for type 2 diabetes and hypertension. Bioresour. Technol. 2008, 99, 2981–2988. [Google Scholar] [CrossRef] [PubMed]
  33. Li, Z.P.; Song, Y.H.; Uddin, Z.; Wang, Y.; Park, K.H. Inhibition of protein tyrosine phosphatase 1B (PTP1B) and α-glucosidase by xanthones from Cratoxylum cochinchinense, and their kinetic characterization. Bioorganic Med. Chem. 2018, 26, 737–746. [Google Scholar] [CrossRef] [PubMed]
  34. Nguyen, N.K.; Truong, X.A.; Bui, T.Q.; Bui, D.N.; Nguyen, H.X.; Tran, P.T.; Nguyen, L.H.D. α-Glucosidase inhibitory xanthones from the roots of Garcinia fusca. Chem. Biodivers. 2017, 14, e1700232. [Google Scholar] [CrossRef]
  35. Grant, G.A. The many faces of partial inhibition: Revealing imposters with graphical analysis. Arch. Biochem. Biophys. 2018, 653, 10–23. [Google Scholar] [CrossRef]
  36. Han, L.; Fang, C.; Zhu, R.; Peng, Q.; Li, D.; Wang, M. Inhibitory effect of phloretin on α-glucosidase: Kinetics, interaction mechanism and molecular docking. Int. J. Biol. Macromol. 2017, 95, 520–527. [Google Scholar] [CrossRef]
  37. Dai, T.; Li, T.; He, X.; Li, X.; Liu, C.; Chen, J.; McClements, D.J. Analysis of inhibitory interaction between epigallocatechin gallate and α-glucosidase: A spectroscopy and molecular simulation study. Spectrochimica Acta–Part A Mol. Biomol. Spectrosc. 2020, 230, 118023. [Google Scholar] [CrossRef]
  38. Lakowicz, J.R.; Weber, G. Quenching of fluorescence by oxygen. A probe for structural fluctuations in macromolecules. Biochemistry 1973, 12, 4161–4170. [Google Scholar] [CrossRef]
  39. Kohlmann, T.; Goez, M. Combined static and dynamic intramicellar fluorescence quenching: Effects on stationary and time-resolved Stern-Volmer experiments. Phys. Chem. Chem. Phys. 2019, 21, 10075–10085. [Google Scholar] [CrossRef]
  40. Zhao, L.; Wen, L.; Lu, Q.; Liu, R. Interaction mechanism between α-glucosidase and A-type trimer procyanidin revealed by integrated spectroscopic analysis techniques. Int. J. Biol. Macromol. 2020, 143, 173–180. [Google Scholar] [CrossRef]
  41. Lakowicz, J. Principles of Fluorescence Spectroscopy; Lakowicz, J.R., Ed.; Springer: Boston, MA, USA, 2013; ISBN 9781475787702, 1475787707. [Google Scholar]
  42. Zeng, L.; Zhang, G.; Lin, S.; Gong, D. Inhibitory mechanism of apigenin on α-glucosidase and synergy analysis of flavonoids. J. Agric. Food Chem. 2016, 64, 6939–6949. [Google Scholar] [CrossRef] [PubMed]
  43. Zeng, L.; Ding, H.; Hu, X.; Zhang, G.; Gong, D. Galangin inhibits α-glucosidase activity and formation of non-enzymatic glycation products. Food Chem. 2019, 271, 70–79. [Google Scholar] [CrossRef] [PubMed]
  44. Ding, H.; Hu, X.; Xu, X.; Zhang, G.; Gong, D. Inhibitory mechanism of two allosteric inhibitors, oleanolic acid and ursolic acid on α-glucosidase. Int. J. Biol. Macromol. 2018, 107, 1844–1855. [Google Scholar] [CrossRef] [PubMed]
  45. Mou, L.; Hu, P.; Cao, X.; Chen, Y.; Xu, Y.; He, T.; Wei, Y.; He, R. Comparison of bovine serum albumin glycation by ribose and fructose in vitro and in vivo. Biochimica Biophysica Acta–Mol. Basis Dis. 2022, 1868, 166283. [Google Scholar] [CrossRef]
  46. Chen, Z.; Bertin, R.; Marin, R.; Medjiofack Djeujo, F.; Froldi, G. Effects of Croton lechleri sap (Sangre de Drago) on AGEs formation, LDL oxidation and oxidative stress related to vascular diseases. Nat. Prod. Res. 2021. [Google Scholar] [CrossRef]
  47. Ou, B.; Hampsch-Woodill, M.; Prior, R.L. Development and validation of an improved oxygen radical absorbance capacity assay using fluorescein as the fluorescent probe. J. Agric. Food Chem. 2001, 49, 4619–4626. [Google Scholar] [CrossRef]
  48. Medjiofack Djeujo, F.; Cusinato, F.; Ragazzi, E.; Froldi, G. α-Glucosidase and advanced glycation end products inhibition with Vernonia amygdalina root and leaf extracts: New data supporting the antidiabetic properties. J. Pharm. Pharmacol. 2021, 73, 1240–1249. [Google Scholar] [CrossRef]
  49. Iqbal, S.; Rehman, N.U.; Kortz, U.; Iqbal, J. Development of a fast and efficient CE enzyme assay for the characterization and inhibition studies of α-glucosidase inhibitors. J. Sep. Sci. 2013, 36, 3623–3628. [Google Scholar] [CrossRef]
  50. Ghisaidoobe, A.B.T.; Chung, S.J. Intrinsic tryptophan fluorescence in the detection and analysis of proteins: A focus on Förster resonance energy transfer techniques. Int. J. Mol. Sci. 2014, 15, 22518–22538. [Google Scholar] [CrossRef]
  51. Papadopoulou, A.; Green, R.J.; Frazier, R.A. Interaction of flavonoids with bovine serum albumin: A fluorescence quenching study. J. Agric. Food Chem. 2005, 53, 158–163. [Google Scholar] [CrossRef]
  52. Yang, J.; Wang, X.; Zhang, C.; Ma, L.; Wei, T.; Zhao, Y.; Peng, X. Comparative study of inhibition mechanisms of structurally different flavonoid compounds on α-glucosidase and synergistic effect with acarbose. Food Chem. 2021, 347, 129056. [Google Scholar] [CrossRef] [PubMed]
  53. Pacheco, M.E.; Bruzzone, L. Synchronous fluorescence spectrometry: Conformational investigation or inner filter effect? J. Lumin. 2013, 137, 138–142. [Google Scholar] [CrossRef]
  54. Greenfield, N.J. Using circular dichroism spectra to estimate protein secondary structure. Nat. Protoc. 2007, 1, 2876–2890. [Google Scholar] [CrossRef] [PubMed]
Figure 1. Chemical structures of α-mangostin and four new derivatives of xanthen-9-one.
Molecules 27 00547 g001
Scheme 1. Reagents and conditions: (a) ratio 1-chloroxanthenone/amine (1:2), 170 °C, 4 h.
Molecules 27 00547 sch001
Figure 2. Inhibition of α-mangostin on AGE formation after 2 (A), 5 (B), 7 (C), and 9 (D) days of incubation of 50 mg/mL BSA with 0.1 M ribose. Aminoguanidine (50 mM, AG) was the positive control. Data are the mean ± SEM of 3–6 experiments. * p < 0.05, *** p < 0.001 vs. maximal ribose-induced BSA glycation (controls).
Molecules 27 00547 g002
Figure 3. Inhibition of synthetic compounds CS1–CS4 on AGE production after 2 (A), 5 (B), 7 (C), and 9 (D) days of incubation of 50 mg/mL BSA with 0.1 M ribose. Aminoguanidine (50 mM, AG) was the positive control. Data are the mean ± SEM of 3–6 experiments. * p < 0.05, ** p < 0.01, *** p < 0.001 vs. maximal ribose-induced BSA glycation (controls).
Molecules 27 00547 g003
Figure 4. Antiradical activity of α-mangostin and synthetic compounds CS1-CS4 tested with ORAC assay. Positive control: ascorbic acid. Data are the mean ± SEM of 3–6 experiments. *** p < 0.001 vs. positive control. The ORAC values are expressed as TEAC (trolox equivalent antioxidant capacity).
Molecules 27 00547 g004
Figure 5. Kinetics of 0.04 µM α-glucosidase in the presence of increasing concentrations of α-mangostin (A). The plot “v versus [α-glucosidase]” is reported (B). Concentration of pNPG substrate: 2 mM. Data are reported as mean ± SEM of 3–6 experiments.
Molecules 27 00547 g005
Figure 6. Michaelis–Menten and Lineaweaver–Burk graphs of α-mangostin (A and B) on α-glucosidase activity with various concentrations of pNPG (0.25–2.0 mM). Graphs (C and D) are the secondary plots of “slope/y-intercept vs. [α-mangostin]”. Data are expressed as mean ± SEM of 3–6 experiments.
Molecules 27 00547 g006
Figure 7. Fluorescence spectra of α-glucosidase in the presence of increasing concentrations of α-mangostin (0.05–1.5 µM) at 298, 304, and 310 K (A, B and C) and the Stern–Volmer plot of fluorescence quenching (D).
Molecules 27 00547 g007
Figure 8. Synchronous fluorescence spectra of α-glucosidase with increasing α-mangostin concentrations (pH 6.8, T = 298 K) at ∆λ = 15 nm (A) and ∆λ = 60 nm (B). Concentrations of the inhibitor (a m): 0.0, 0.05, 0.15, 0.25, 0.35, 0.45, 0.60, 0.75, 1.0, 1.25, and 1.5 µM.
Molecules 27 00547 g008
Figure 9. Circular dichroism spectra of α-glucosidase alone (E:M 1:0) and in the presence of α-mangostin (1:1 and 1:2) detected at 298 K.
Molecules 27 00547 g009
Table 1. Km and Vmax values of 0.05 µM α-glucosidase with different concentrations of α-mangostin using 2 mM pNPG as substrate.
α-Mangostin
(µM)
Km
(mM)
Vmax
(ΔOD/min)
Vmax
(µM/min)
--0.454 ± 0.0430.118 ± 0.00311.80 ± 0.30
10.490 ± 0.0580.111 ± 0.00411.10 ± 0.40
50.504 ± 0.0790.097 ± 0.0059.70 ± 0.50
100.492 ± 0.0790.083 ± 0.0048.30 ± 0.40
250.524 ± 0.0750.068 ± 0.0036.80 ± 0.30
500.651 ± 0.1260.057 ± 0.0045.70 ± 0.40
Km: Michaelis constant value; Vmax: maximum reaction velocity. Parameters were estimated based on 4–6 data points for each concentration.
Table 2. Kinetic parameters of α-mangostin as inhibitor of α-glucosidase.
α-Mangostin
(µM)
Km
(mM)
Kcat
(10−3 sec−1)
Kcat/Km
(sec−1 mM−1)
Ki
(µM)
Ki’
(µM)
00.454 ± 0.0433.90 ± 1.100.087 ± 0.0330.3345.60
10.490 ± 0.0583.70 ± 1.430.076 ± 0.02
50.504 ± 0.0793.24 ± 1.620.064 ± 0.01
100.492 ± 0.0792.76 ± 1.380.056 ± 0.02
250.524 ± 0.0752.26 ± 1.050.043 ± 0.01
500.585 ± 0.1261.85 ± 1.760.032 ± 0.01
α-Glucosidase concentration: 0.05 µM; pNPG concentration: 2 mM. The Km values were obtained using the Michaelis–Menten plot (Figure 6 A) and nonlinear curve fitting. Kcat: enzyme cycle per unit of time; Ki: binding constant of the inhibitor to the free enzyme; Ki’: binding constant of the inhibitor to the substrate–enzyme complex; Kcat/Km: catalytic efficiency of α-glucosidase.
Table 3. The quenching constant (Ksv) and the bimolecular quenching constant (Kq) of α-mangostin with α-glucosidase at different temperatures.
T
(K)
Ksv
(105 M−1)
Kq
(1013 M−1 s−1)
R
2981.92 ± 0.011.92 ± 0.010.9733
3042.30 ± 0.012.30 ± 0.010.9731
3102.62 ± 0.01262 ± 0.010.9718
T: temperature; Ksv: Stern–Volmer constant; Kq bimolecular quenching constant; R: correlation coefficient.
Table 4. The secondary structures of α-glucosidase alone and with α-mangostin detected by circular dichroism spectroscopy.
Molar Ratios
[E]:[M]
α-Helix
(%)
β-Sheet
(%)
β-Turn
(%)
Random Coil
(%)
1:043.2214.0517.5625.17
1:151.765.7715.2627.20
1:252.955.994.7036.36
E: α-glucosidase; M: α-mangostin. Data were obtained by SELCON 3 program.
Publisher’s Note: MDPI stays neutral with regard to jurisdictional claims in published maps and institutional affiliations.

