
Antioxidant Interactions between S-allyl-L-cysteine and Polyphenols Using Interaction Index and Isobolographic Analysis

 , ,
, ,
Abstract
: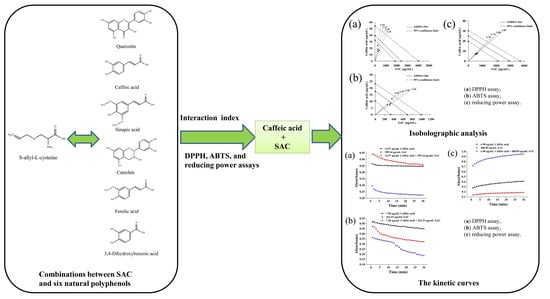
1. Introduction
2. Results and Discussion
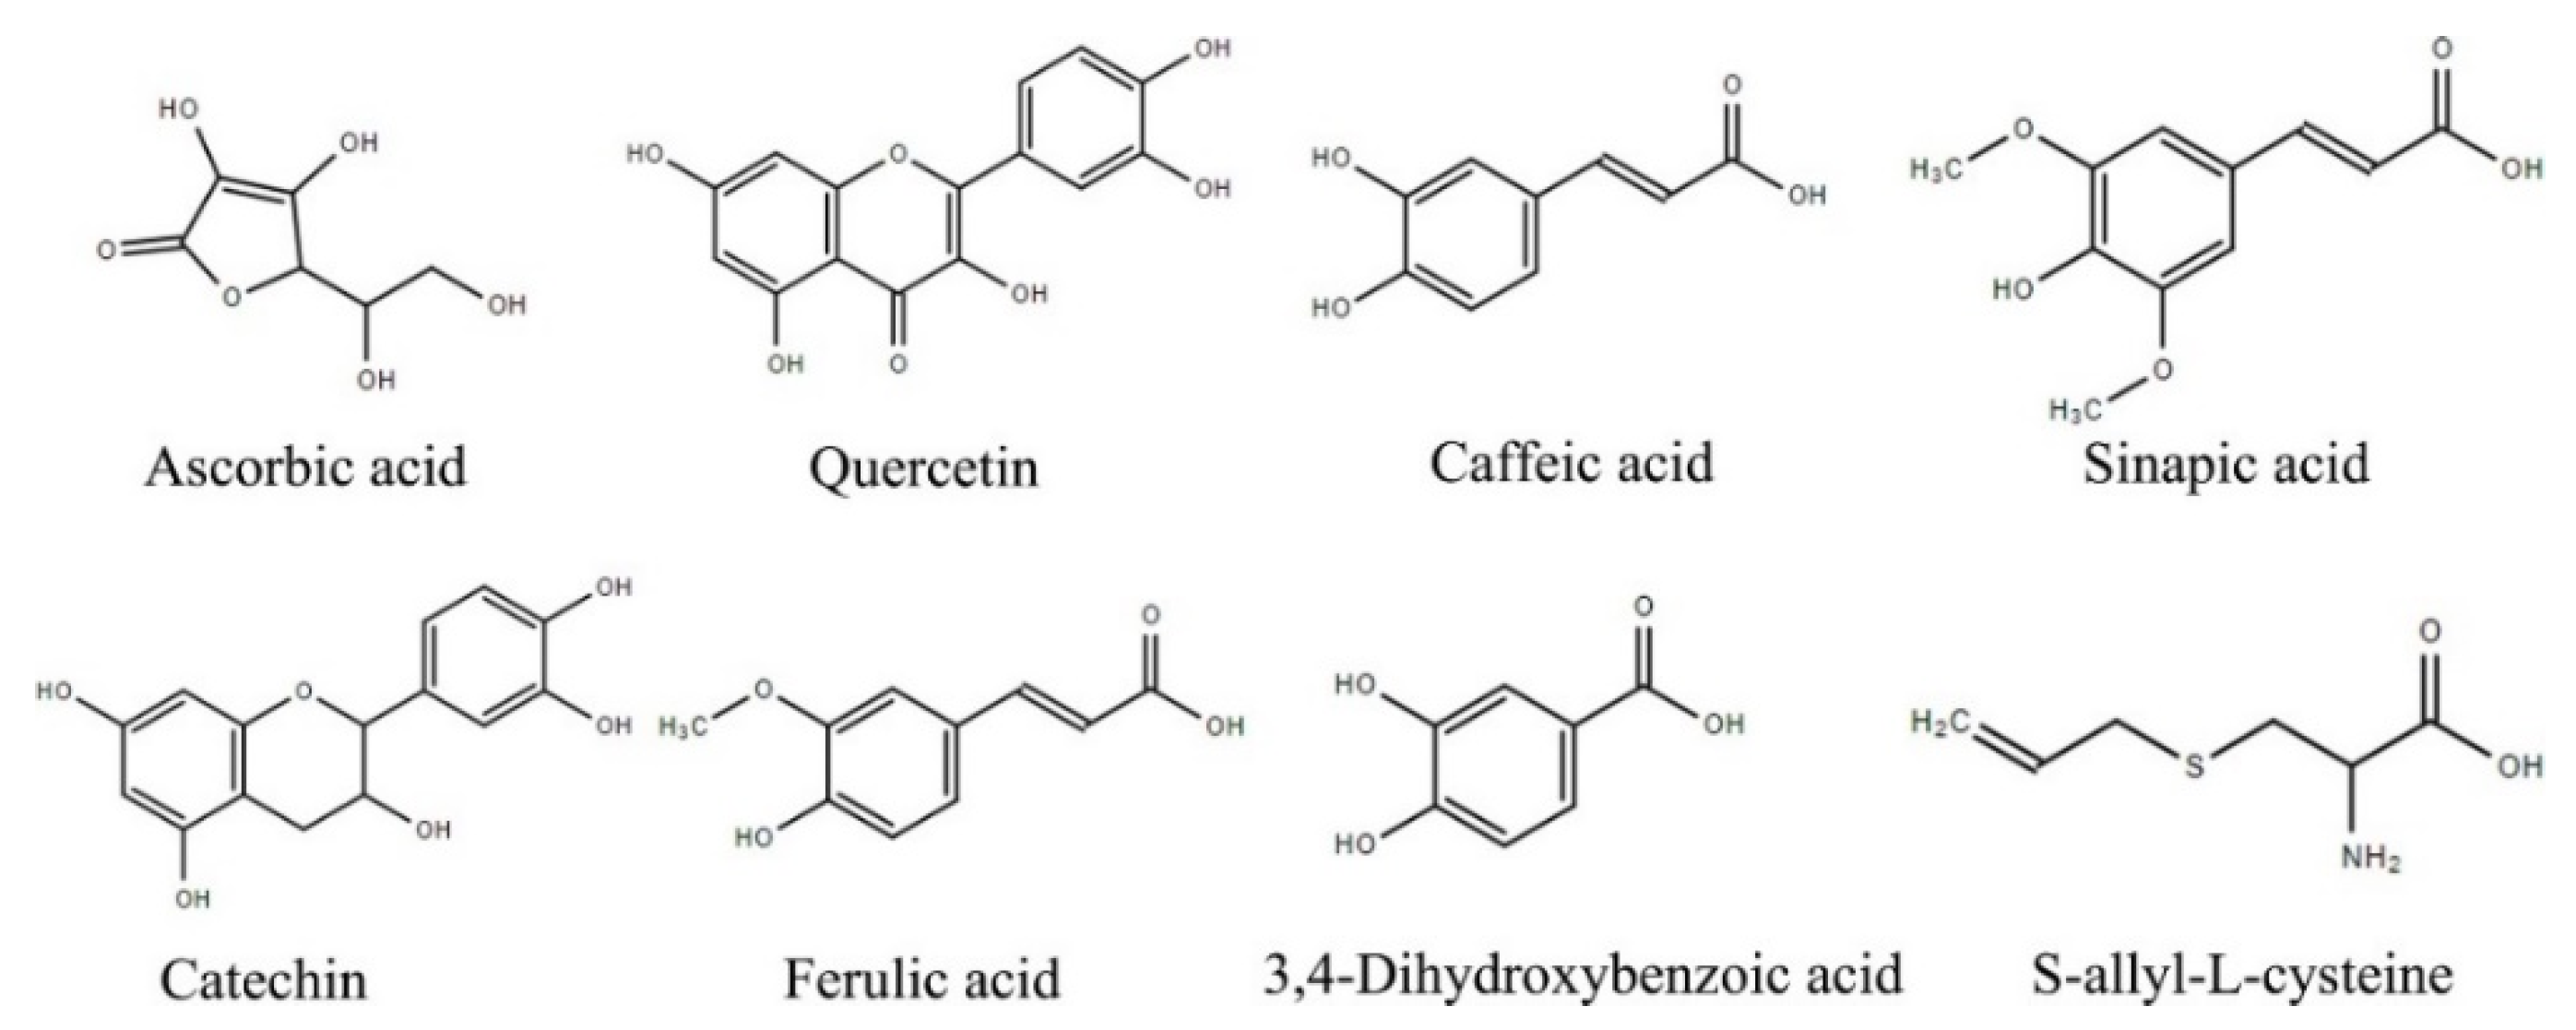
2.1. Antioxidant Activity of Individual Compounds including SAC and Six Polyphenols
2.2. Antioxidant Interactions of SAC and Six Polyphenols
2.3. Antioxidant Interactions of SAC and Caffeic Acid at Different Proportions
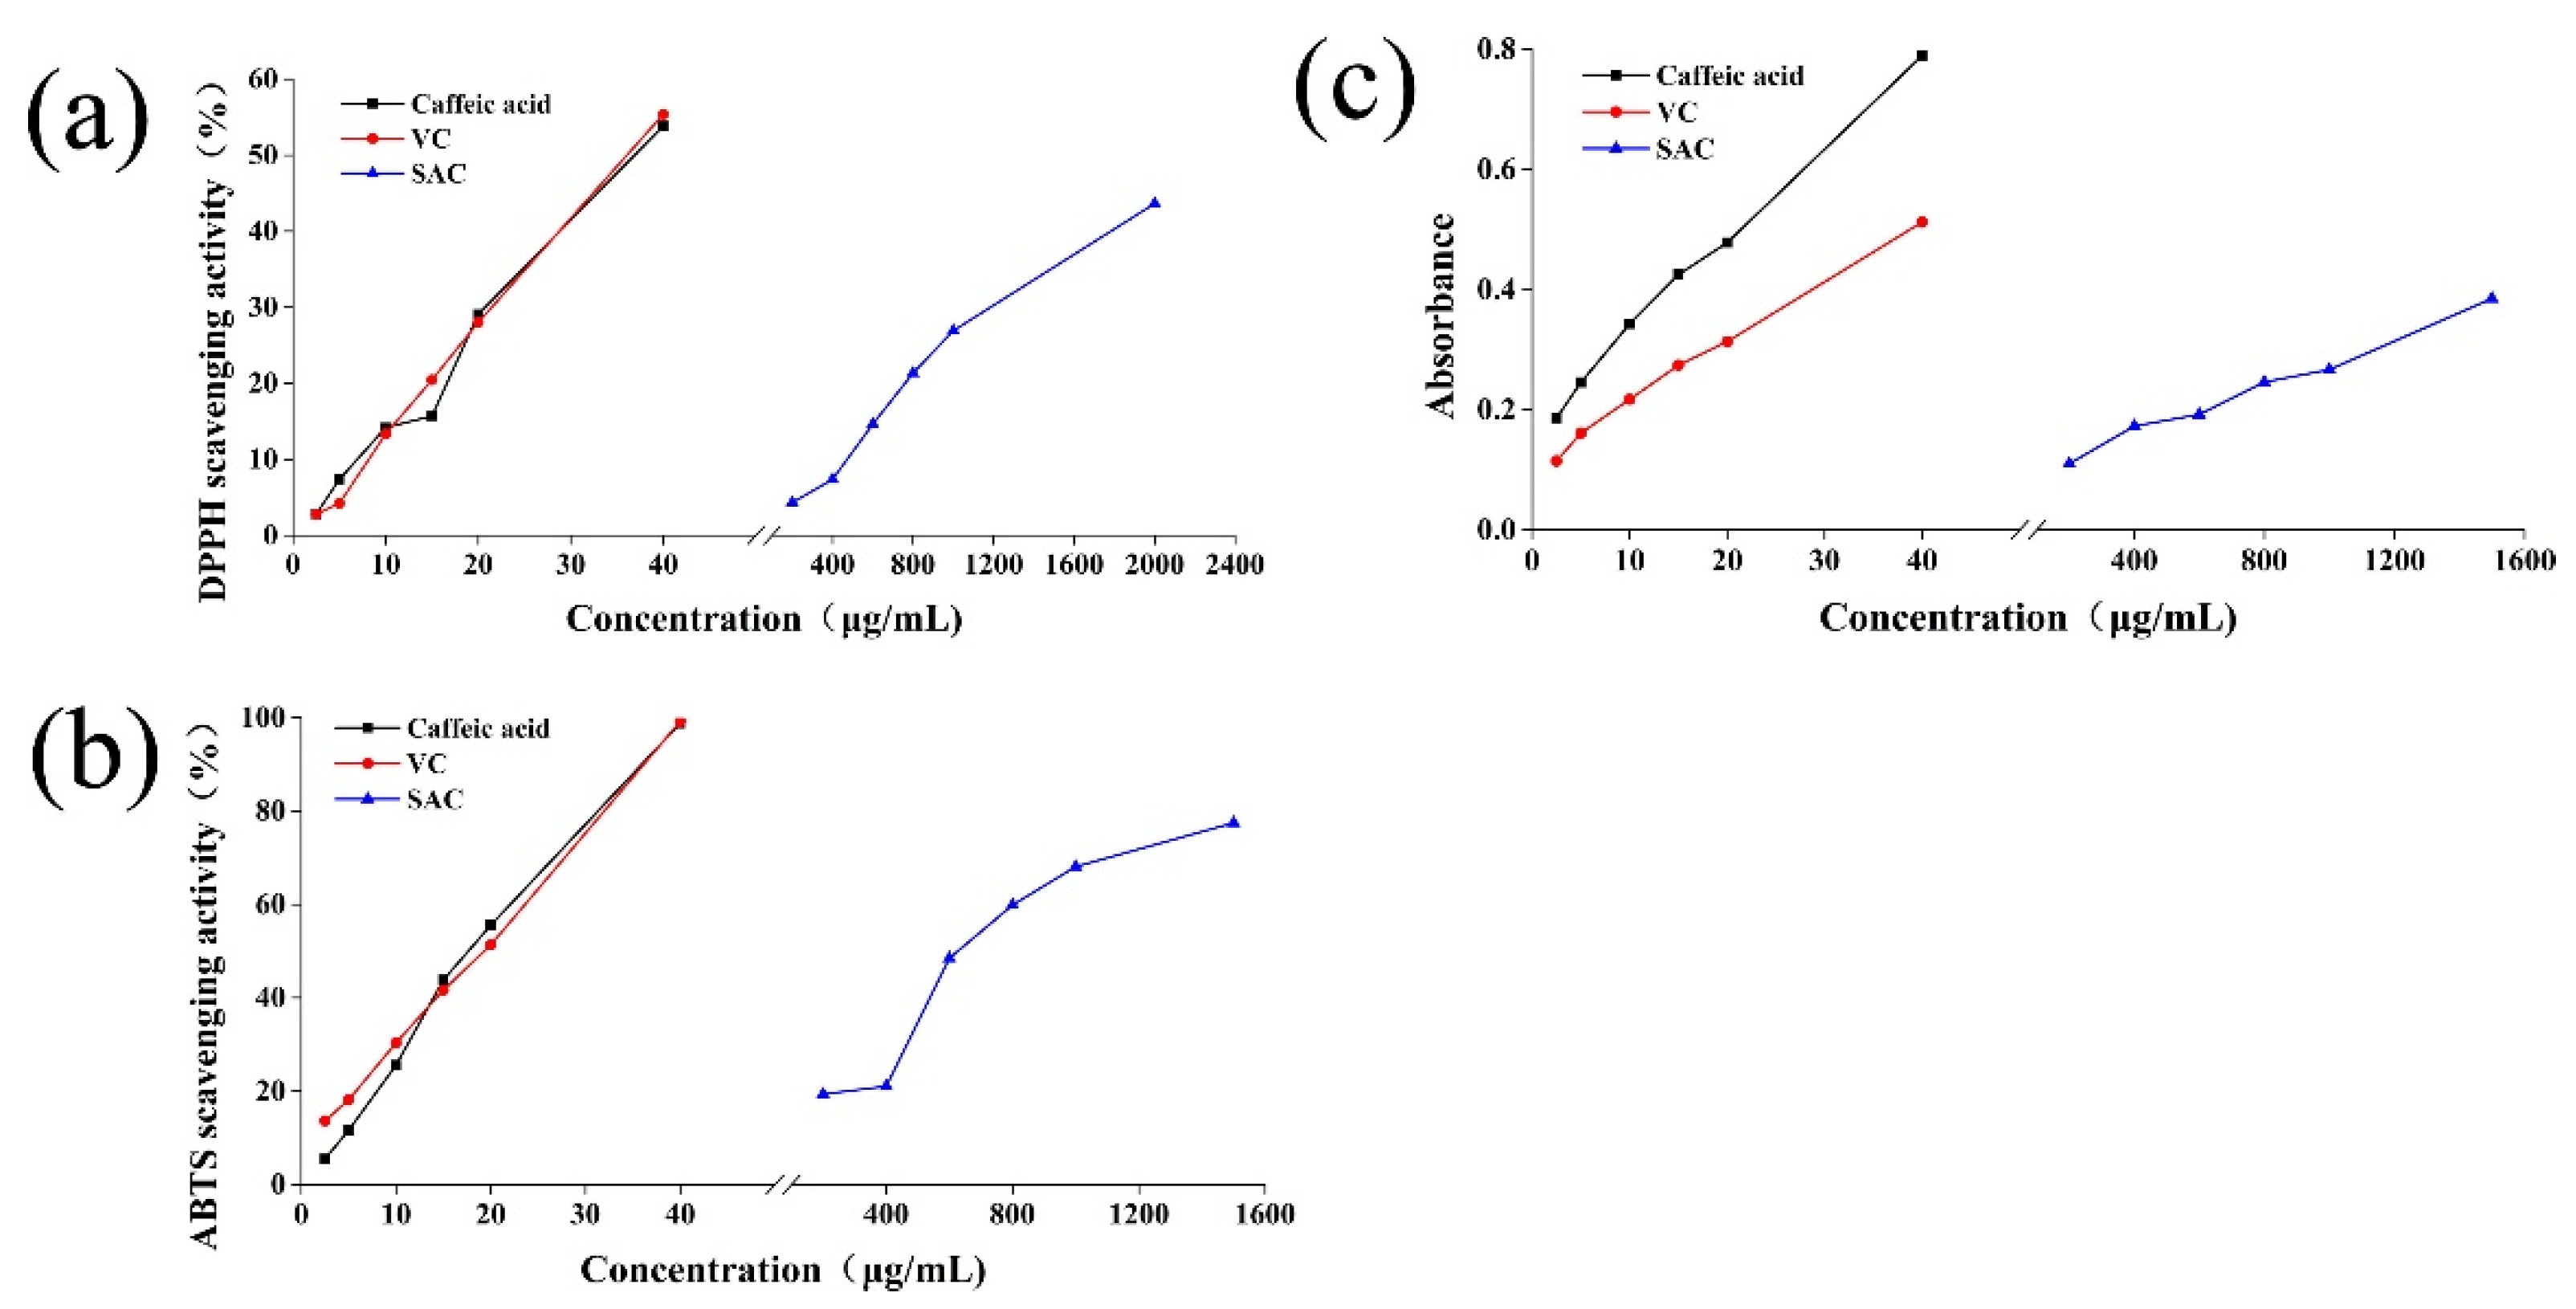
2.3.1. Antioxidant Activity of Caffeic Acid, VC and SAC at Different Concentrations
2.3.2. Antioxidant Activity for the Mixture of Caffeic Acid and SAC
2.3.3. Interaction Index Values for the Mixture of Caffeic Acid and SAC
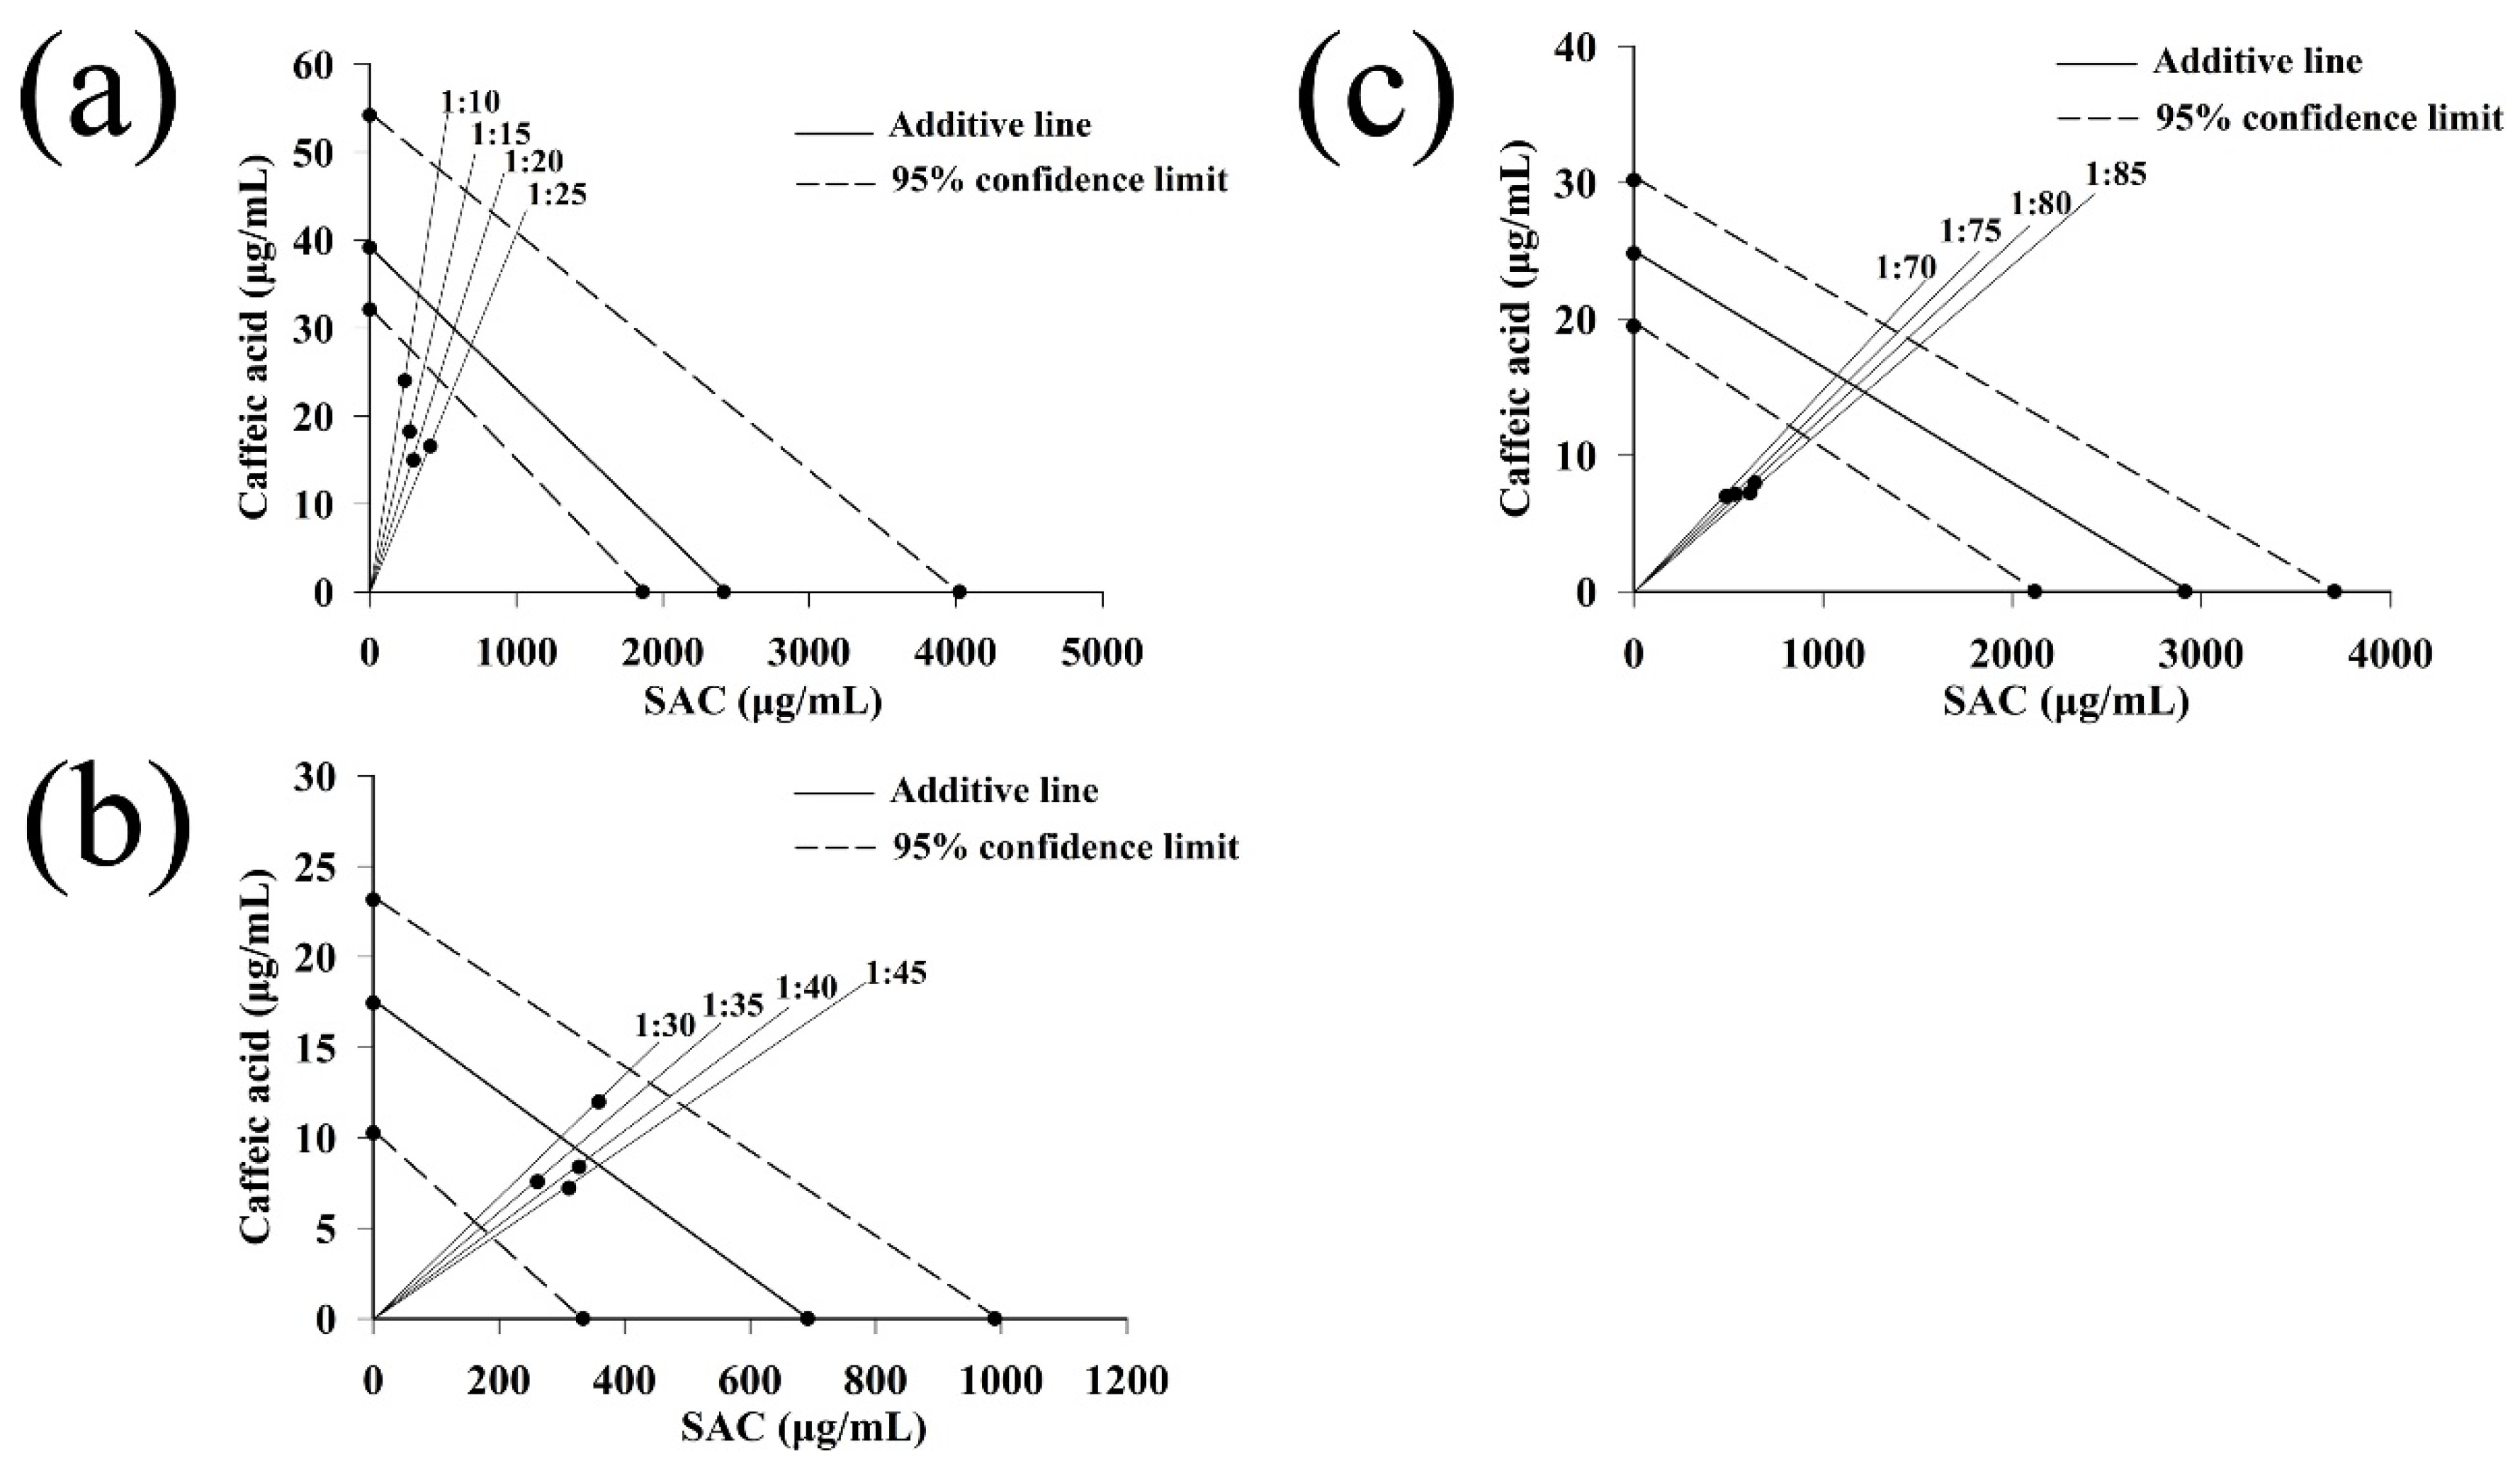
2.3.4. Isobolographic Analysis of the Mixture of Caffeic Acid and SAC
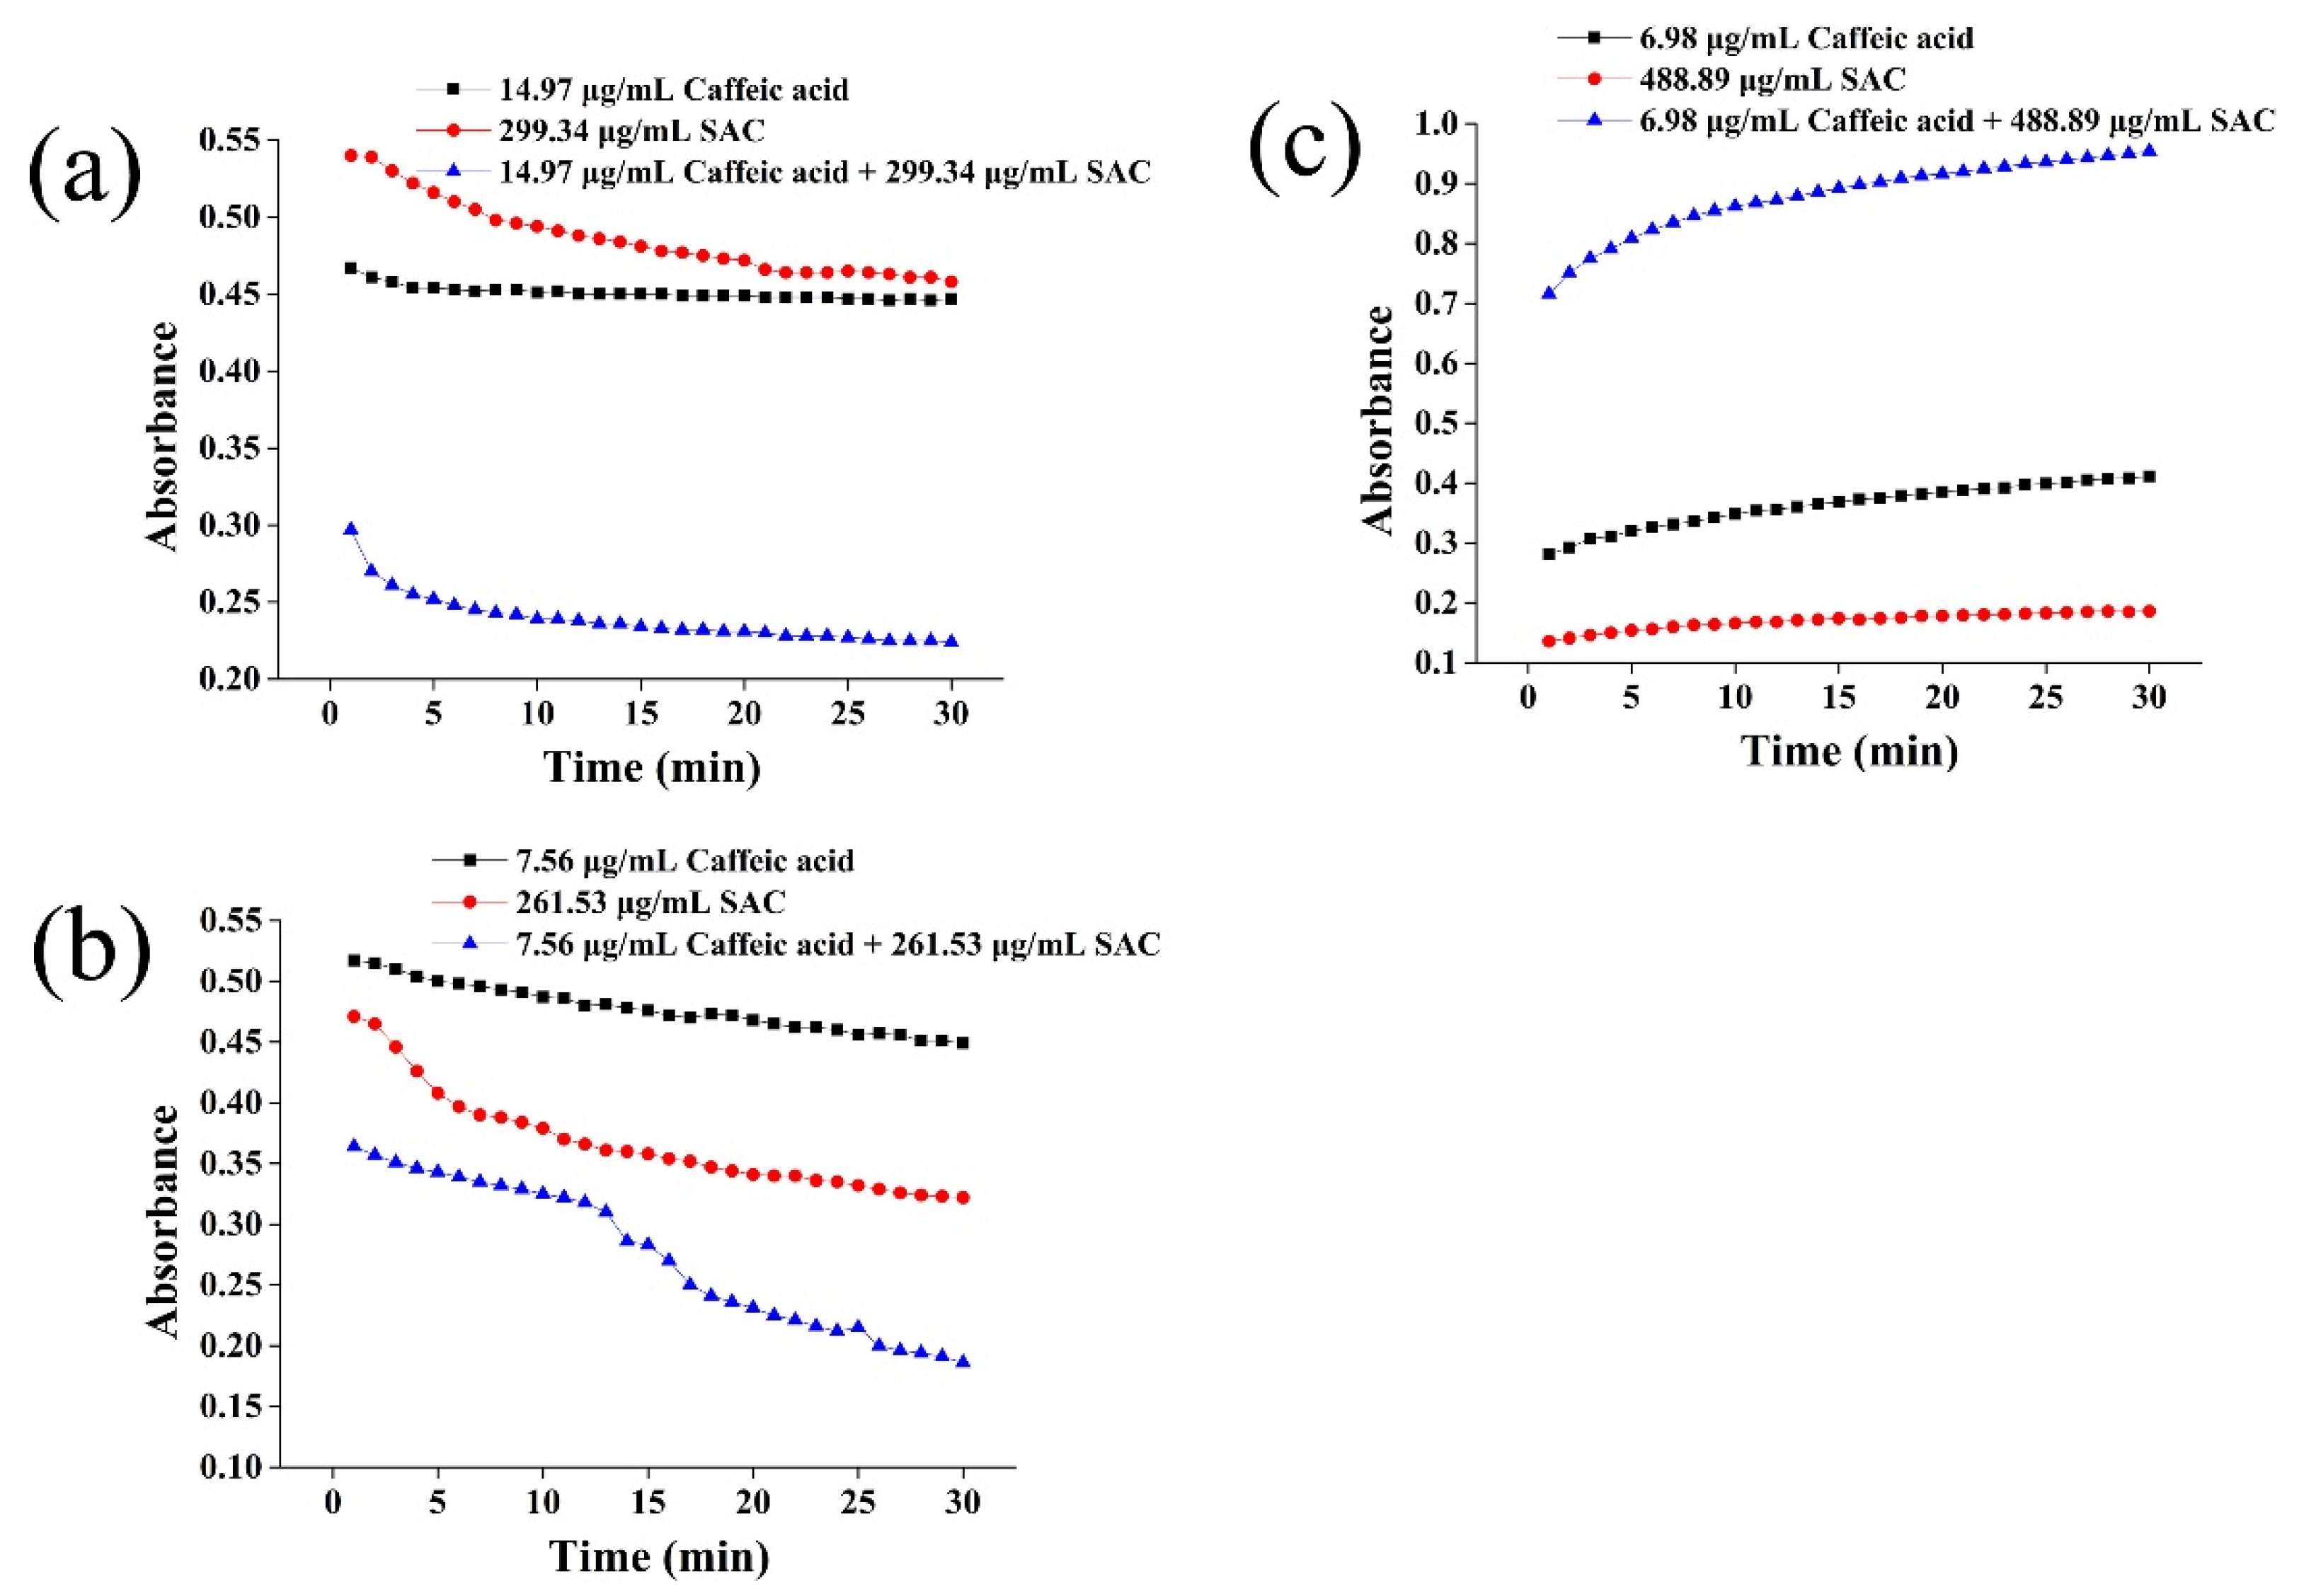
2.4. Absorbance Change of the Mixture of Caffeic Acid and SAC with Time
3. Materials and Methods
3.1. Chemicals and Reagents
3.2. Measurement of Scavenging Activity of DPPH, ABTS, and Reducing Power
3.3. Assessment of the Antioxidant Interactions between SAC and Polyphenols
3.4. Statistical Analysis
4. Conclusions
Author Contributions
Funding
Institutional Review Board Statement
Informed Consent Statement
Data Availability Statement
Conflicts of Interest
Sample Availability
References
- Amagase, H.; Petesch, B.L.; Matsuura, H.; Kasuga, S.; Itakura, Y. Intake of garlic and its bioactive components. J. Nutr. 2001, 131, 955S–962S. [Google Scholar] [CrossRef]
- Shobana, S.; Vidhya, V.G.; Ramya, M. Antibacterial activity of garlic varieties (Ophioscordon and Sativum) on enteric pathogens. Curr. Res. J. Biol. Sci. 2009, 1, 123–126. [Google Scholar]
- Atkin, M.; Laight, D.; Cummings, M.H. The effects of garlic extract upon endothelial function, vascular inflammation, oxidative stress and insulin resistance in adults with type 2 diabetes at high cardiovascular risk. A pilot double blind randomized placebo controlled trial. J. Diabetes Complicat. 2016, 30, 723–727. [Google Scholar] [CrossRef] [PubMed] [Green Version]
- Hui, S. Anti-inflammatory and intestinal microbiota modulation properties of jinxiang garlic (Allium sativum L.) polysaccharides toward dextran sodium sulfate-induced colitis. J. Agric. Food Chem. 2020, 68, 12295–12309. [Google Scholar]
- Ro, K.S.; Chen, Y.; Du, L.; Wang, L.X.; Zhao, L.; Xie, J.L.; Wei, D.Z. Improvement of S-allylcysteine content, probiotic properties and constipation prevention effect of black garlic by the lactic acid bacteria fermentation. Process Biochem. 2022, 115, 110–117. [Google Scholar] [CrossRef]
- Matsutomo, T.; Stark, T.D.; Hofmann, T. Targeted screening and quantitative analyses of antioxidant compounds in aged-garlic extract. Eur. Food Res. Technol. 2018, 244, 1803–1814. [Google Scholar] [CrossRef]
- Sun, Y.E.; Wang, W.D. Molecular detection and in vitro antioxidant activity of S-allyl-L-cysteine (SAC) extracted from Allium sativum. Cell. Mol. Biol. 2016, 62, 85–89. [Google Scholar]
- Denzer, I.; Münch, G.; Pischetsrieder, M.; Friedland, K. S-allyl-L-cysteine and isoliquiritigenin improve mitochondrial function in cellular models of oxidative and nitrosative stress. Food Chem. 2016, 194, 843–848. [Google Scholar] [CrossRef]
- Yamaguchi, Y.; Honma, R.; Yazaki, T.; Shibuya, T.; Sakaguchi, T.; Uto-Kondo, H.; Kumagai, H. Sulfuric odor precursor S-allyl-L-cysteine sulfoxide in garlic induces detoxifying enzymes and prevents hepatic Injury. Antioxidants 2019, 8, 385. [Google Scholar] [CrossRef]
- Medina-Campos, O.N.; Barrera, D.; Segoviano-Murillo, S.; Rocha, D.; Maldonado, P.D.; Mendoza-Patiño, N.; Pedraza-Chaverri, J. S-allylcysteine scavenges singlet oxygen and hypochlorous acid and protects LLC-PK1 cells of potassium dichromate-induced toxicity. Food Chem. Toxicol. 2007, 45, 2030–2039. [Google Scholar] [CrossRef]
- De Beer, D.; Joubert, E.; Gelderblom, W.; Manley, M. Antioxidant activity of South African red wines and white cultivar wines: Free radical scavenging. J. Agric. Food Chem. 2003, 51, 902–909. [Google Scholar] [CrossRef] [PubMed]
- Sánchez-Moreno, C.; Cao, G.; Ou, B.; Prior, R.L. Anthocyanin and proanthocyanidin content in selected white and red wines. Oxygen radical absorbance capacity comparison with nontraditional wines obtained from highbush blueberry. J. Agric. Food Chem. 2003, 51, 4889–4896. [Google Scholar] [CrossRef] [PubMed]
- Fernández-Pachón, M.S.; Villaño, D.; García-Parrilla, M.C.; Troncoso, A.M. Antioxidant activity of wines and relation with their polyphenolic composition. Anal. Chim. Acta 2004, 513, 113–118. [Google Scholar] [CrossRef]
- Scalbert, A.; Manach, C.; Morand, C.; Rémésy, C.; Jiménez, L. Dietary polyphenols and the prevention of diseases. Crit. Rev. Food Sci. Nutr. 2005, 454, 287–306. [Google Scholar] [CrossRef]
- Nijveldt, R.J.; van Nood, E.; van Hoorn, D.E.; Boelens, P.G.; van Norren, K.; van Leeuwen, P.A. Flavonoids: A review of probable mechanisms of action and potential applications. Am. J. Clin. Nutr. 2001, 74, 418–425. [Google Scholar] [CrossRef]
- Becker, E.M.; Nissen, L.R.; Skibsted, L.H. Antioxidant evaluation protocols: Food quality or health effects. Eur. Food Res. Technol. 2004, 219, 561–571. [Google Scholar] [CrossRef]
- Schroeder, M.T.; Becker, E.M.; Skibsted, L.H. Molecular mechanism of antioxidant synergism of tocotrienols and carotenoids in palm oil. J. Agric. Food Chem. 2006, 54, 3445–3453. [Google Scholar] [CrossRef]
- Guo, Y.; Amorati, R.; Valgimigli, L. Synergic antioxidant activity of γ-terpinene with phenols and polyphenols enabled by hydroperoxyl radicals. Food Chem. 2020, 345, 128468. [Google Scholar] [CrossRef]
- Noguer, M.; Cerezo, A.B.; Moyá, M.L.; Troncoso, A.M.; García-Parrilla, M.C. Synergism effect between phenolic metabolites and endogenous antioxidants in terms of antioxidant activity. Adv. Chem. Eng. Sci. 2014, 4, 258–265. [Google Scholar] [CrossRef] [Green Version]
- Shahidi, F.; Zhong, Y. Measurement of antioxidant activity. J. Funct. Foods. 2015, 18, 757–781. [Google Scholar] [CrossRef]
- Huang, D.; Ou, B.; Prior, R.L. The chemistry behind antioxidant capacity assays. J. Agric. Food Chem. 2005, 53, 1841–1856. [Google Scholar] [CrossRef] [PubMed]
- Pulido, R.; Bravo, L.; Saura-Calixto, F. Antioxidant activity of dietary polyphenols as determined by a modified ferric reducing/antioxidant power assay. J. Agric. Food Chem. 2000, 48, 3396–3402. [Google Scholar] [CrossRef] [PubMed] [Green Version]
- Aleksandra, S.; Krystyna, P. Investigation of antioxidant interaction between green tea polyphenols and acetaminophen using isobolographic Analysis. J. Pharm. Biomed. Anal. 2018, 159, 393–397. [Google Scholar]
- Chen, Z.Y.; Chan, P.T.; Ho, K.Y.; Fung, K.P.; Wang, J. Antioxidant activity of natural flavonoids is governed by number and location of their aromatic hydroxyl groups. Chem. Phys. Lipids 1996, 79, 157–163. [Google Scholar] [CrossRef]
- Shan, H.; Liu, S. Targeted acylation for all the hydroxyls of (+)-catechin and evaluation of their individual contribution to radical scavenging activity. Food Chem. 2015, 197, 415–427. [Google Scholar]
- Handique, J.G.; Baruah, J.B. Polyphenolic compounds: An overview. React. Funct. Polym. 2002, 52, 163–188. [Google Scholar] [CrossRef]
- Reber, J.D.; Eggett, D.L.; Parker, T.L. Antioxidant capacity interactions and a chemical/structural model of phenolic compounds found in strawberries. Int. J. Food Sci. Nutr. 2011, 62, 445–452. [Google Scholar] [CrossRef]
- Choe, E.; Min, D.B. Mechanisms of antioxidants in the oxidation of foods. Compr. Rev. Food Sci. Food Saf. 2009, 8, 345–358. [Google Scholar] [CrossRef]
- Prieto, M.A.; Murado, M.A.; Vázquez, J.A. Quantification, characterization and description of synergy and antagonism in the antioxidant response. Food Res. Inter. 2014, 60, 218–229. [Google Scholar] [CrossRef] [Green Version]
- Freeman, B.L.; Eggett, D.L.; Parker, T.L. Synergistic and antagonistic interactions of phenolic compounds found in navel oranges. J. Food Sci. 2010, 75, C570–C576. [Google Scholar] [CrossRef]
- Peyrat-Maillard, M.N.; Cuvelier, M.E.; Berset, C. Antioxidant activity of phenolic compounds in 2, 2′-azobis(2-amidinopropane) dihydrochloride (AAPH)-induced oxidation: Synergistic and antagonistic effects. J. Am. Oil Chem. Soc. 2003, 80, 1007–1012. [Google Scholar] [CrossRef]
- Tian, Y.; Zhang, X.; Du, M.; Li, F.; Xiao, M.; Zhang, W. Synergistic antioxidant effects of araloside A and L-ascorbic acid on H2O2-induced HEK293 cells: Regulation of cellular antioxidant status. Oxid. Med. Cell. Longev. 2021, 2021, 9996040. [Google Scholar] [CrossRef] [PubMed]
- Gessner, P.K. A straightforward method for the study of drug interactions: An isobolographic analysis primer. Int. J. Toxicol. 1988, 7, 987–1012. [Google Scholar] [CrossRef]
- Villaño, D.; Fernández-Pachón, M.S.; Moyá, M.L.; Troncoso, A.M.; García-Parrilla, M.C. Radical scavenging ability of polyphenolic compounds towards DPPH free radical. Talanta 2007, 71, 230–235. [Google Scholar] [CrossRef]
- Yu, L. Free radical scavenging properties of conjugated linoleic acids. J. Agric. Food Chem. 2001, 49, 3452–3456. [Google Scholar] [CrossRef]
- Jia, X.; Chao, Z.; Hu, J.; He, M.; Bao, J.; Kai, W.; Li, P.; Chen, M.; Wan, J.; Su, H. Ultrasound-assisted extraction, antioxidant and anticancer activities of the polysaccharides from Rhynchosia minima root. Molecules 2015, 20, 20901–20911. [Google Scholar] [CrossRef] [Green Version]
- Brand-Williams, W.; Cuvelier, M.; Berset, C. Use of a free radical method to evaluate antioxidant activity. LWT-Food Sci. Technol. 1995, 28, 25–30. [Google Scholar] [CrossRef]
- Jayaprakasha, G.K.; Girennavar, B.; Patil, B.S. Radical scavenging activities of rio red grapefruits and sour orange fruit extracts in different in vitro model systems. Bioresour. Technol. 2008, 99, 4484–4494. [Google Scholar] [CrossRef]
- Tallarida, R.J. The interaction index: A measure of drug synergism. Pain 2002, 98, 63–168. [Google Scholar] [CrossRef]
- Tomi, M.A.; Vukovi, S.M.; Stepanovi-Petrovi, R.M.; Micov, A.M.; Ugresić, N.D.; Prostran, M.S.; Bosković, B. Analysis of the antinociceptive interactions in two-drug combinations of gabapentin, oxcarbazepine and amitriptyline in streptozotocin-induced diabetic mice. Eur. J. Pharmacol. 2010, 628, 75–82. [Google Scholar] [CrossRef]


| Index | EC50 of DPPH Scavenging Activity/(μg/mL) | EC50 of ABTS Scavenging Activity/(μg/mL) | OD0.5 of Reducing Power/(μg/mL) |
|---|---|---|---|
| Ascorbic acid | 36.39 ± 0.2 a | 23.08 ± 0.16 a | 48.83 ± 0.15 ab |
| Quercetin | 8.39 ± 0.09 b | 5.10 ± 0.03 b | 69.08 ± 1.02 bc |
| Caffeic acid | 39.16 ± 0.45 a | 17.45 ± 0.03 c | 24.85 ± 0.48 a |
| Sinapic acid | 17.11 ± 0.17 ab | 12.40 ± 0.11 d | 101.26 ± 3.98 c |
| Catechin | 10.26 ± 0.33 ab | 9.41 ± 0.27 e | 61.92 ± 0.54 abc |
| Ferulic acid | 21.76 ± 0.42 ab | 5.11 ± 0.02 b | 46.31 ± 0.74 ab |
| 3,4-Dihydroxybenzoic acid | 11.39 ± 0.27 ab | 12.21 ± 0.17 d | 29.05 ± 0.19 ab |
| SAC | 2416.09 ± 31.10 c | 691.86 ± 6.03 f | 2864.63 ± 65.06 d |
| Compound Combination | EC50A | EC50Amix | EC50B | EC50Bmix | Interaction Index (γ) | |
|---|---|---|---|---|---|---|
| DPPH free radical scavenging activity | Quercetin + SAC | 8.39 ± 0.09 | 4.05 ± 0.04 | 2416.09 ± 31.10 | 507.12 ± 11.6 | 0.69 ± 0.03 a |
| Caffeic acid + SAC | 39.16 ± 0.45 | 12.01 ± 0.06 | 2416.09 ± 31.10 | 305.43 ± 4.04 | 0.43 ± 0.04 b | |
| Sinapic acid + SAC | 17.11 ± 0.17 | 6.49 ± 0.12 | 2416.09 ± 31.10 | 917.01 ± 16.81 | 0.76 ± 0.05 ad | |
| Catechin + SAC | 10.26 ± 0.33 | 3.21 ± 0.04 | 2416.09 ± 31.10 | 673.62 ± 9.9 | 0.59 ± 0.02 c | |
| Ferulic acid + SAC | 21.76 ± 0.42 | 9.45 ± 0.09 | 2416.09 ± 31.10 | 831.96 ± 9.55 | 0.78 ± 0.06 d | |
| 3,4-Dihydroxybenzoic acid + SAC | 11.39 ± 0.27 | 4.29 ± 0.11 | 2416.09 ± 31.10 | 409.66 ± 19.4 | 0.55 ± 0.03 c | |
| ABTS radical cation scavenging activity | Quercetin + SAC | 5.10 ± 0.03 | 3.47 ± 0.08 | 691.86 ± 6.03 | 401.31 ± 13.01 | 1.26 ± 0.05 a |
| Caffeic acid + SAC | 17.45 ± 0.03 | 12.63 ± 0.02 | 691.86 ± 6.03 | 351.97 ± 3.04 | 1.23 ± 0.07 ab | |
| Sinapic acid + SAC | 12.40 ± 0.11 | 9.59 ± 0.14 | 691.86 ± 6.03 | 417.64 ± 12.78 | 1.38 ± 0.05 c | |
| Catechin + SAC | 9.41 ± 0.27 | 7.02 ± 0.04 | 691.86 ± 6.03 | 379.07 ± 8.56 | 1.29 ± 0.08 ac | |
| Ferulic acid + SAC | 5.11 ± 0.02 | 3.85 ± 0.06 | 691.86 ± 6.03 | 443.47 ± 13.66 | 1.39 ± 0.06 c | |
| 3,4-Dihydroxybenzoic acid + SAC | 12.21 ± 0.17 | 8.07 ± 0.02 | 691.86 ± 6.03 | 335.65 ± 1.32 | 1.15 ± 0.03 b | |
| Reducing power | Quercetin + SAC | 69.08 ± 1.02 | 17.15 ± 0.14 | 2864.63 ± 65.06 | 1419.26 ± 1.44 | 0.74 ± 0.05 a |
| Caffeic acid + SAC | 24.85 ± 0.48 | 5.71 ± 0.41 | 2864.63 ± 65.06 | 1049.42 ± 21.45 | 0.60 ± 0.01 c | |
| Sinapic acid + SAC | 101.26 ± 3.98 | 21.74 ± 0.19 | 2864.63 ± 65.06 | 1646.79 ± 4.04 | 0.79 ± 0.02 ab | |
| Catechin + SAC | 61.92 ± 0.54 | 21.97 ± 0.11 | 2864.63 ± 65.06 | 1431.57 ± 4.8 | 0.85 ± 0.03 b | |
| Ferulic acid + SAC | 46.31 ± 0.74 | 31.36 ± 0.14 | 2864.63 ± 65.06 | 2014.44 ± 2.7 | 1.38 ± 0.04 d | |
| 3,4-Dihydroxybenzoic acid + SAC | 29.05 ± 0.19 | 15.20 ± 0.11 | 2864.63 ± 65.06 | 1534.46 ± 2.73 | 1.06 ± 0.05 e |
| Caffeic Acid: SAC (Concentration Ratio) | DPPH Assay | Caffeic Acid: SAC (Concentration Ratio) | ABTS Assay | Caffeic Acid: SAC (Concentration Ratio) | Reducing Power Assay | ||||||
|---|---|---|---|---|---|---|---|---|---|---|---|
| Concentration of Caffeic Acid (µg/mL) | Concentration of SAC (µg/mL) | DPPH Free Radical Scavenging Activity (%) | Concentration of Caffeic Acid (µg/mL) | Concentration of SAC (µg/mL) | ABTS Radical Cation Scavenging Activity (%) | Concentration of Caffeic Acid (µg/mL) | Concentration of SAC (µg/mL) | Absorption | |||
| 1:10 | 20 | 200 | 48.05 ± 0.31 a | 1:30 | 20 | 600 | 99.25 ± 0.54 a | 1:70 | 15 | 1050 | 0.87 ± 0.001 a |
| 16 | 160 | 37.87 ± 0.46 b | 16 | 480 | 97.09 ± 0.17 b | 13 | 910 | 0.81 ± 0.001 b | |||
| 14 | 140 | 33.06 ± 0.11 c | 14 | 420 | 85.93 ± 0.20 c | 10 | 700 | 0.77 ± 0.001 c | |||
| 12 | 120 | 27.65 ± 0.28 d | 12 | 360 | 74.54 ± 0.29 d | 7 | 490 | 0.56 ± 0.001 d | |||
| 10 | 100 | 24.22 ± 0.46 e | 10 | 300 | 66.86 ± 0.17 e | 5 | 350 | 0.48 ± 0.001 e | |||
| 8 | 80 | 18.88 ± 0.22 f | 8 | 240 | 52.51 ± 0.32 f | 2 | 140 | 0.23 ± 0.002 f | |||
| 1:15 | 20 | 300 | 58.11 ± 0.17 a | 1:35 | 20 | 700 | 96.91 ± 0.34 a | 1:75 | 15 | 1125 | 1.05 ± 0.002 a |
| 16 | 240 | 45.82 ± 0.47 b | 16 | 560 | 96.60 ± 0.37 a | 13 | 975 | 0.91 ± 0.001 b | |||
| 14 | 210 | 38.91 ± 0.21 c | 14 | 490 | 92.52 ± 0.37 b | 10 | 750 | 0.78 ± 0.002 c | |||
| 12 | 180 | 31.35 ± 0.32 d | 12 | 420 | 83.88 ± 0.25 c | 7 | 525 | 0.56 ± 0.002 d | |||
| 10 | 150 | 24.34 ± 0.32 e | 10 | 350 | 72.76 ± 0.35 d | 5 | 375 | 0.48 ± 0.001 e | |||
| 8 | 120 | 16.75 ± 0.62 f | 8 | 280 | 55.67 ± 0.37 e | 2 | 150 | 0.24 ± 0.001 f | |||
| 1:20 | 20 | 400 | 69.98 ± 0.36 a | 1:40 | 20 | 800 | 98.82 ± 0.25 a | 1:80 | 15 | 1200 | 0.81 ± 0.002 a |
| 16 | 320 | 55.86 ± 0.31 b | 16 | 640 | 98.05 ± 0.20 b | 13 | 1040 | 0.80 ± 0.003 b | |||
| 14 | 280 | 51.69 ± 0.25 c | 14 | 560 | 91.69 ± 0.18 c | 10 | 800 | 0.68 ± 0.003 c | |||
| 12 | 240 | 44.17 ± 0.22 d | 12 | 480 | 90.61 ± 0.16 d | 7 | 560 | 0.52 ± 0.001 d | |||
| 10 | 200 | 32.75 ± 0.32 e | 10 | 400 | 77.31 ± 0.32 e | 5 | 400 | 0.43 ± 0.001 e | |||
| 8 | 160 | 25.20 ± 0.43 f | 8 | 320 | 63.42 ± 0.36 f | 2 | 160 | 0.22 ± 0.001 f | |||
| 1:25 | 20 | 500 | 71.65 ± 0.32 a | 1:45 | 20 | 900 | 98.57 ± 0.36 a | 1:85 | 15 | 1275 | 1.01 ± 0.008 a |
| 16 | 400 | 52.25 ± 0.44 b | 16 | 720 | 98.16 ± 0.20 ab | 13 | 1105 | 0.94 ± 0.001 b | |||
| 14 | 350 | 45.38 ± 0.28 c | 14 | 630 | 97.82 ± 0.18 b | 10 | 850 | 0.76 ± 0.001 c | |||
| 12 | 300 | 41.78 ± 0.44 d | 12 | 540 | 95.6 ± 0.32 c | 7 | 595 | 0.55 ± 0.001 d | |||
| 10 | 250 | 30.95 ± 0.61 e | 10 | 450 | 77.27 ± 0.23 d | 5 | 425 | 0.46 ± 0.003 e | |||
| 8 | 200 | 21.90 ± 0.55 f | 8 | 360 | 66.29 ± 0.17 e | 2 | 170 | 0.22 ± 0.001 f | |||
| Concentration Ratio | EC50Amix | EC50Bmix | EC50 add | EC50 mix | Synergistic Rate/% | Interaction Index (γ) | |
|---|---|---|---|---|---|---|---|
| DPPH free radical scavenging activity | 1:10 | 24.01 ± 0.09 | 240.01 ± 0.92 | 370.66 ± 4.29 | 264.02 ± 1.02 ** a | 28.77 ± 0.66 a | 0.71 ± 0.01 a |
| 1:15 | 18.22 ± 0.30 | 273.24 ± 4.50 | 503.99 ± 5.87 | 291.46 ± 4.80 ** b | 42.16 ± 1.52 b | 0.58 ± 0.02 bc | |
| 1:20 | 14.97 ± 0.08 | 299.34 ± 1.52 | 621.01 ± 7.28 | 314.31 ± 1.60 ** c | 49.39 ± 0.34 c | 0.51 ± 0.03 c | |
| 1:25 | 16.56 ± 0.02 | 413.99 ± 0.46 | 724.53 ± 8.54 | 430.55 ± 0.48 ** d | 40.57 ± 0.74 b | 0.59 ± 0.07 b | |
| ABTS radical cation scavenging activity | 1:30 | 11.97 ± 0.21 | 359.18 ± 6.21 | 307.96 ± 1.42 | 371.16 ± 6.42 ** a | -20.53 ± 2.62 a | 1.21 ± 0.03 a |
| 1:35 | 7.56 ± 0.15 | 261.53 ± 0.10 | 333.68 ± 1.63 | 269.09 ± 0.13 ** b | 19.36 ± 0.42 b | 0.81 ± 0.01 b | |
| 1:40 | 8.08 ± 0.30 | 327.61 ± 16.34 | 356.16 ± 1.83 | 320.58 ± 16.65 * c | 9.97 ± 5.12 c | 0.91 ± 0.05 c | |
| 1:45 | 7.2 ± 0.42 | 311.45 ± 9.45 | 375.99 ± 2.01 | 318.65 ± 9.87 ** c | 15.24 ± 3.07 d | 0.86 ± 0.04 bc | |
| Reducing power | 1:70 | 6.98 ± 0.03 | 488.89 ± 2.23 | 1097.75 ± 20.43 | 495.87 ± 1.62 ** a | 54.82 ± 0.85 a | 0.45 ± 0.01 a |
| 1:75 | 7.14 ± 0.02 | 534.95 ± 1.6 | 1144.18 ± 21.33 | 542.1 ± 1.62 ** b | 52.61 ± 0.81 b | 0.47 ± 0.01 b | |
| 1:80 | 7.97 ± 0.02 | 639.06 ± 2 | 1188.23 ± 22.19 | 647.05 ± 2.02 ** c | 45.53 ± 0.96 c | 0.54 ± 0.01 c | |
| 1:85 | 7.23 ± 0.02 | 614.13 ± 1.7 | 1230.08 ± 23.01 | 621.35 ± 1.72 ** d | 49.47 ± 1.09 d | 0.51 ± 0.01 d |
Publisher’s Note: MDPI stays neutral with regard to jurisdictional claims in published maps and institutional affiliations. |
© 2022 by the authors. Licensee MDPI, Basel, Switzerland. This article is an open access article distributed under the terms and conditions of the Creative Commons Attribution (CC BY) license (https://creativecommons.org/licenses/by/4.0/).
Share and Cite
Dong, C.; Zhao, G.; Tao, L.; Qiu, F.; Wang, S.; Wang, B.; Liu, J.; Duan, S. Antioxidant Interactions between S-allyl-L-cysteine and Polyphenols Using Interaction Index and Isobolographic Analysis. Molecules 2022, 27, 4089. https://doi.org/10.3390/molecules27134089
Dong C, Zhao G, Tao L, Qiu F, Wang S, Wang B, Liu J, Duan S. Antioxidant Interactions between S-allyl-L-cysteine and Polyphenols Using Interaction Index and Isobolographic Analysis. Molecules. 2022; 27(13):4089. https://doi.org/10.3390/molecules27134089
Chicago/Turabian StyleDong, Chunming, Guihong Zhao, Lei Tao, Fanghang Qiu, Shujing Wang, Bo Wang, Jian Liu, and Shengxia Duan. 2022. "Antioxidant Interactions between S-allyl-L-cysteine and Polyphenols Using Interaction Index and Isobolographic Analysis" Molecules 27, no. 13: 4089. https://doi.org/10.3390/molecules27134089
APA StyleDong, C., Zhao, G., Tao, L., Qiu, F., Wang, S., Wang, B., Liu, J., & Duan, S. (2022). Antioxidant Interactions between S-allyl-L-cysteine and Polyphenols Using Interaction Index and Isobolographic Analysis. Molecules, 27(13), 4089. https://doi.org/10.3390/molecules27134089