
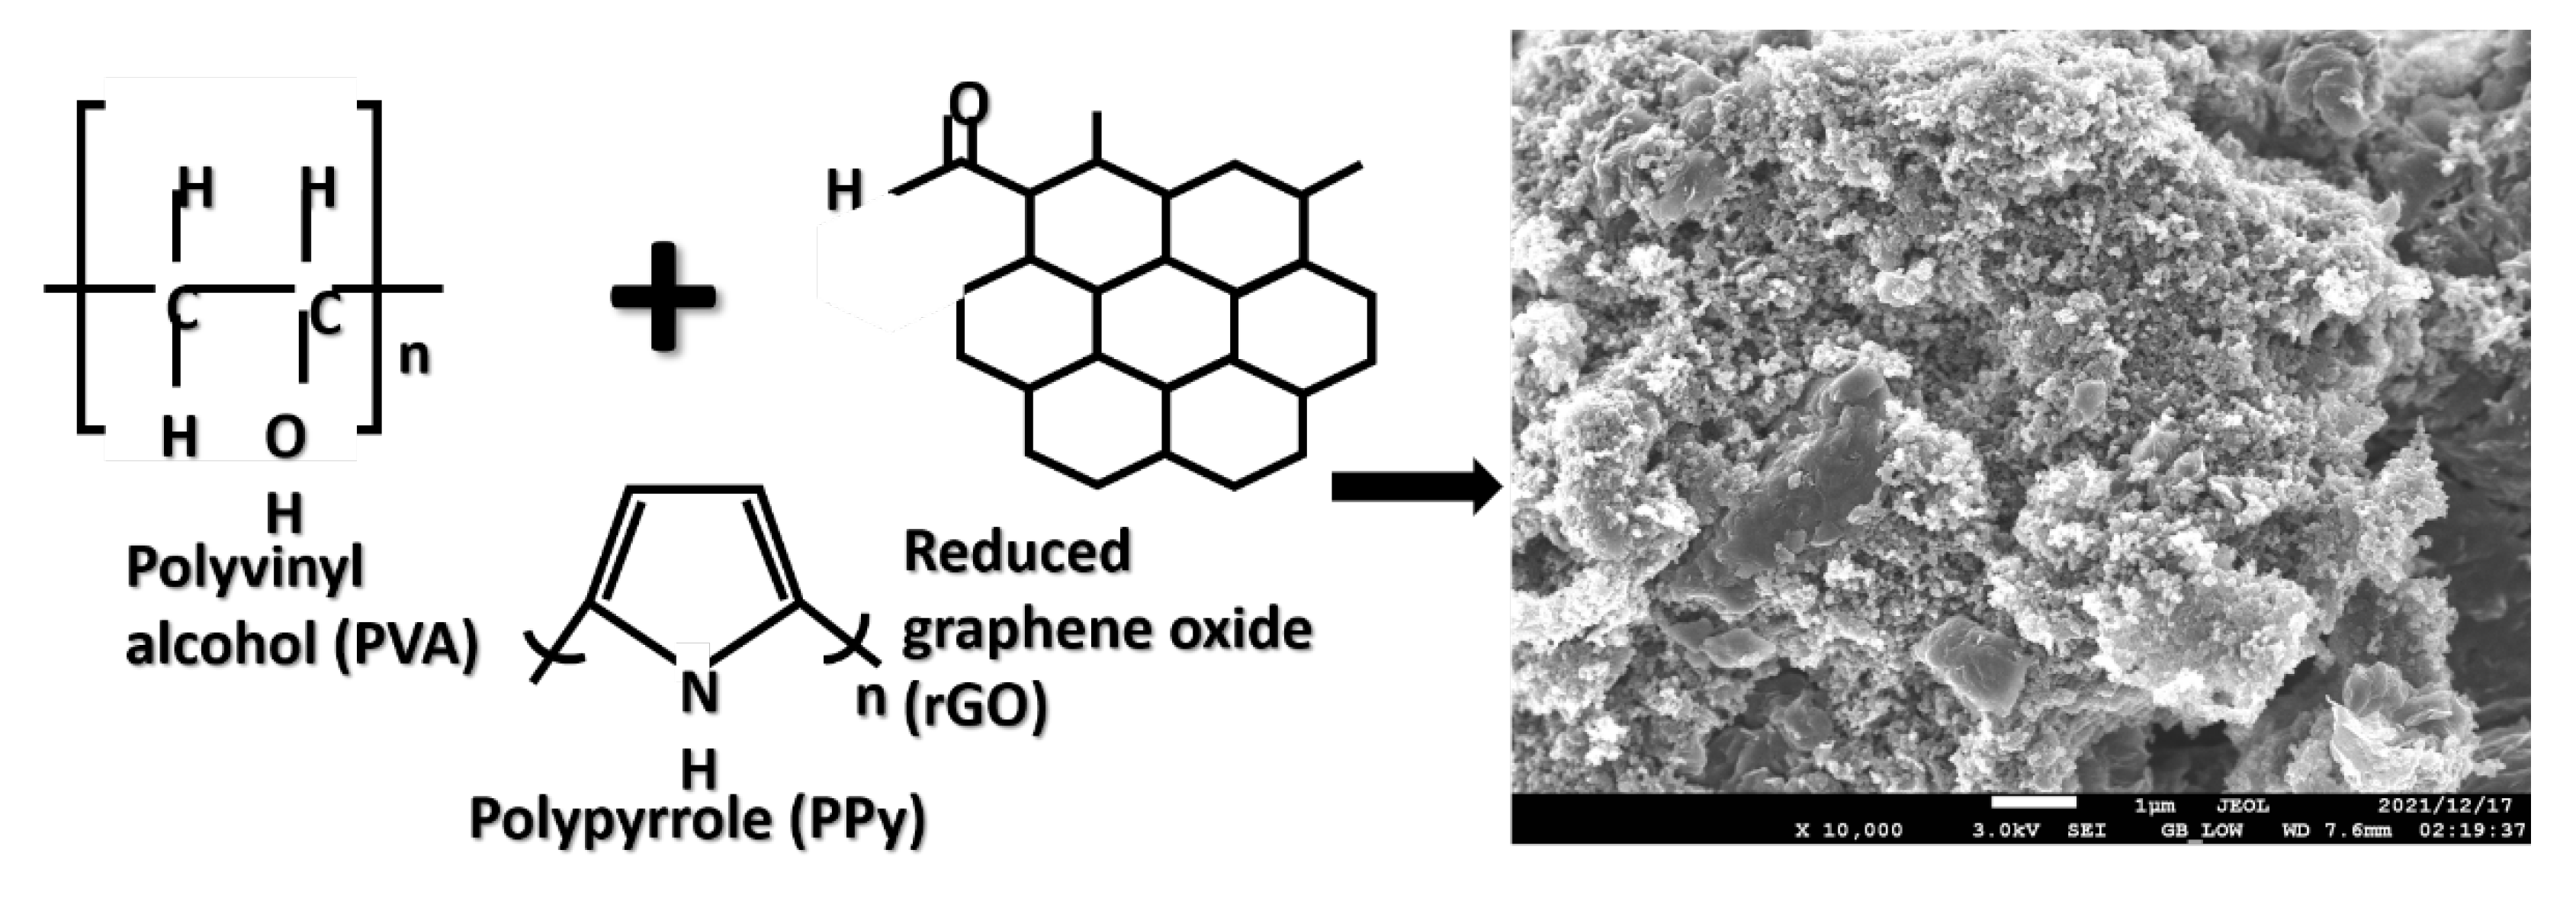
Fabrication and Model Characterization of the Electrical Conductivity of PVA/PPy/rGO Nanocomposite

 , , ,
, , ,  and
and 
Abstract
:1. Introduction
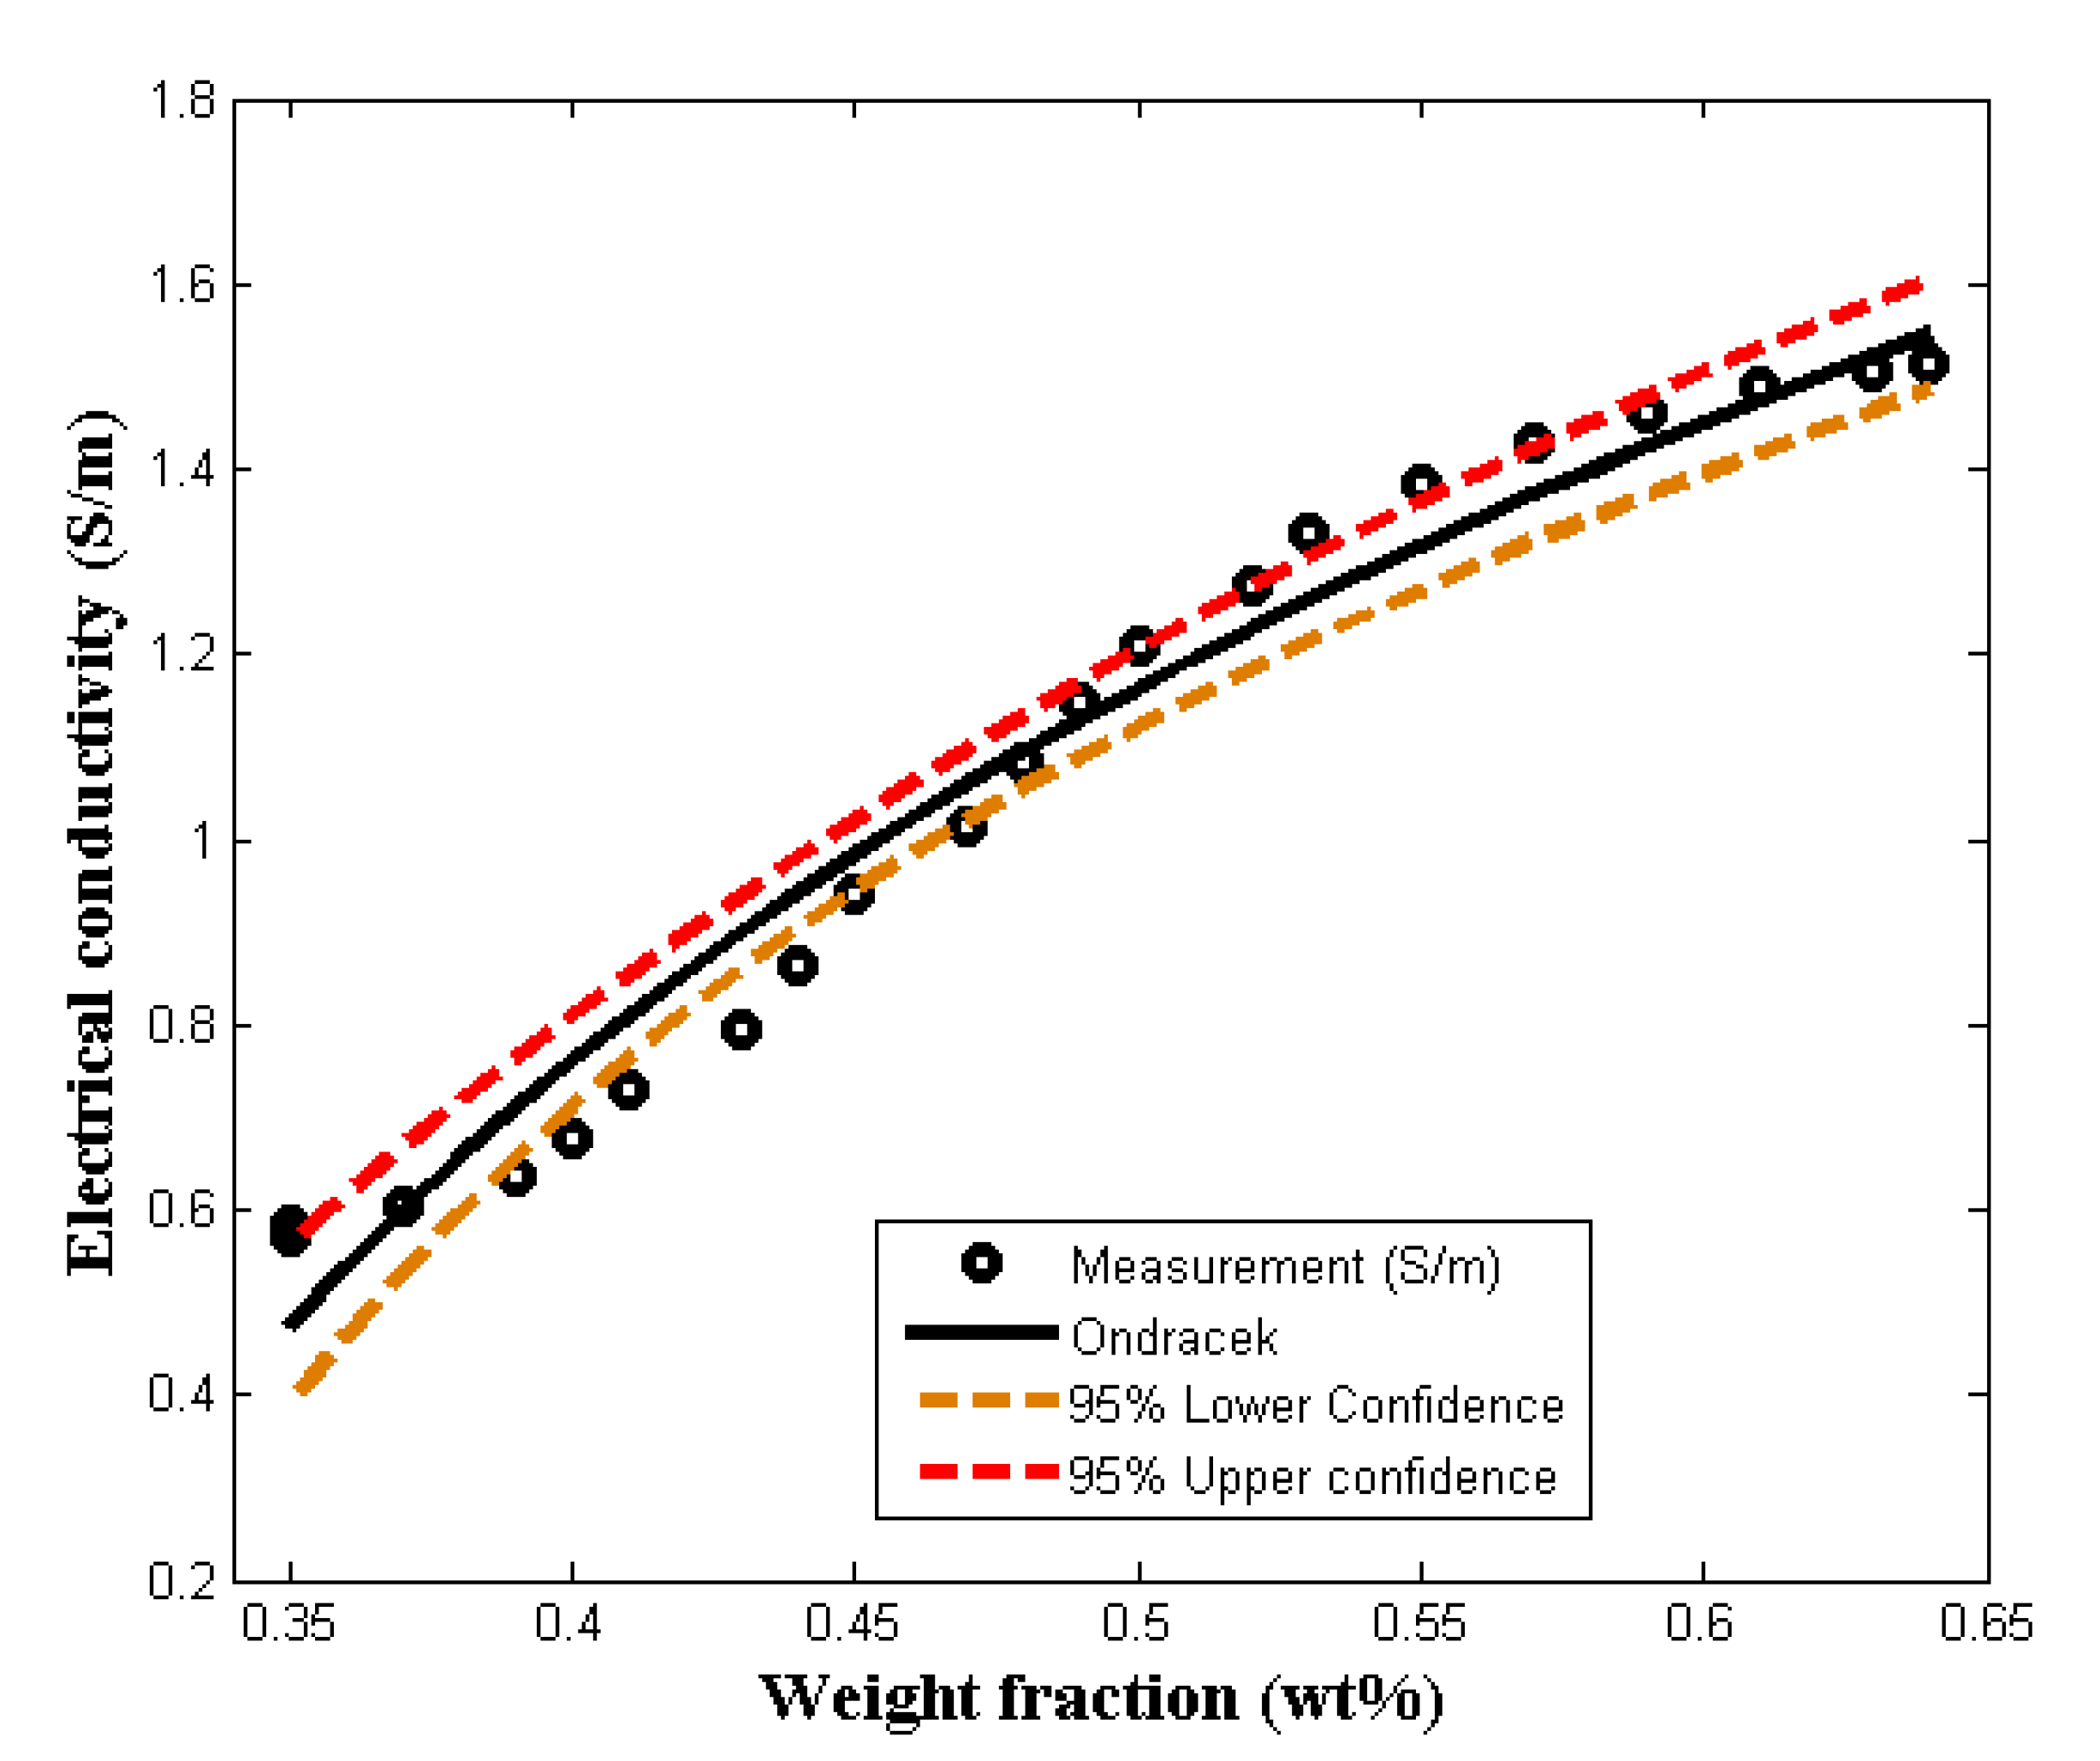
1.1. Ondracek Model
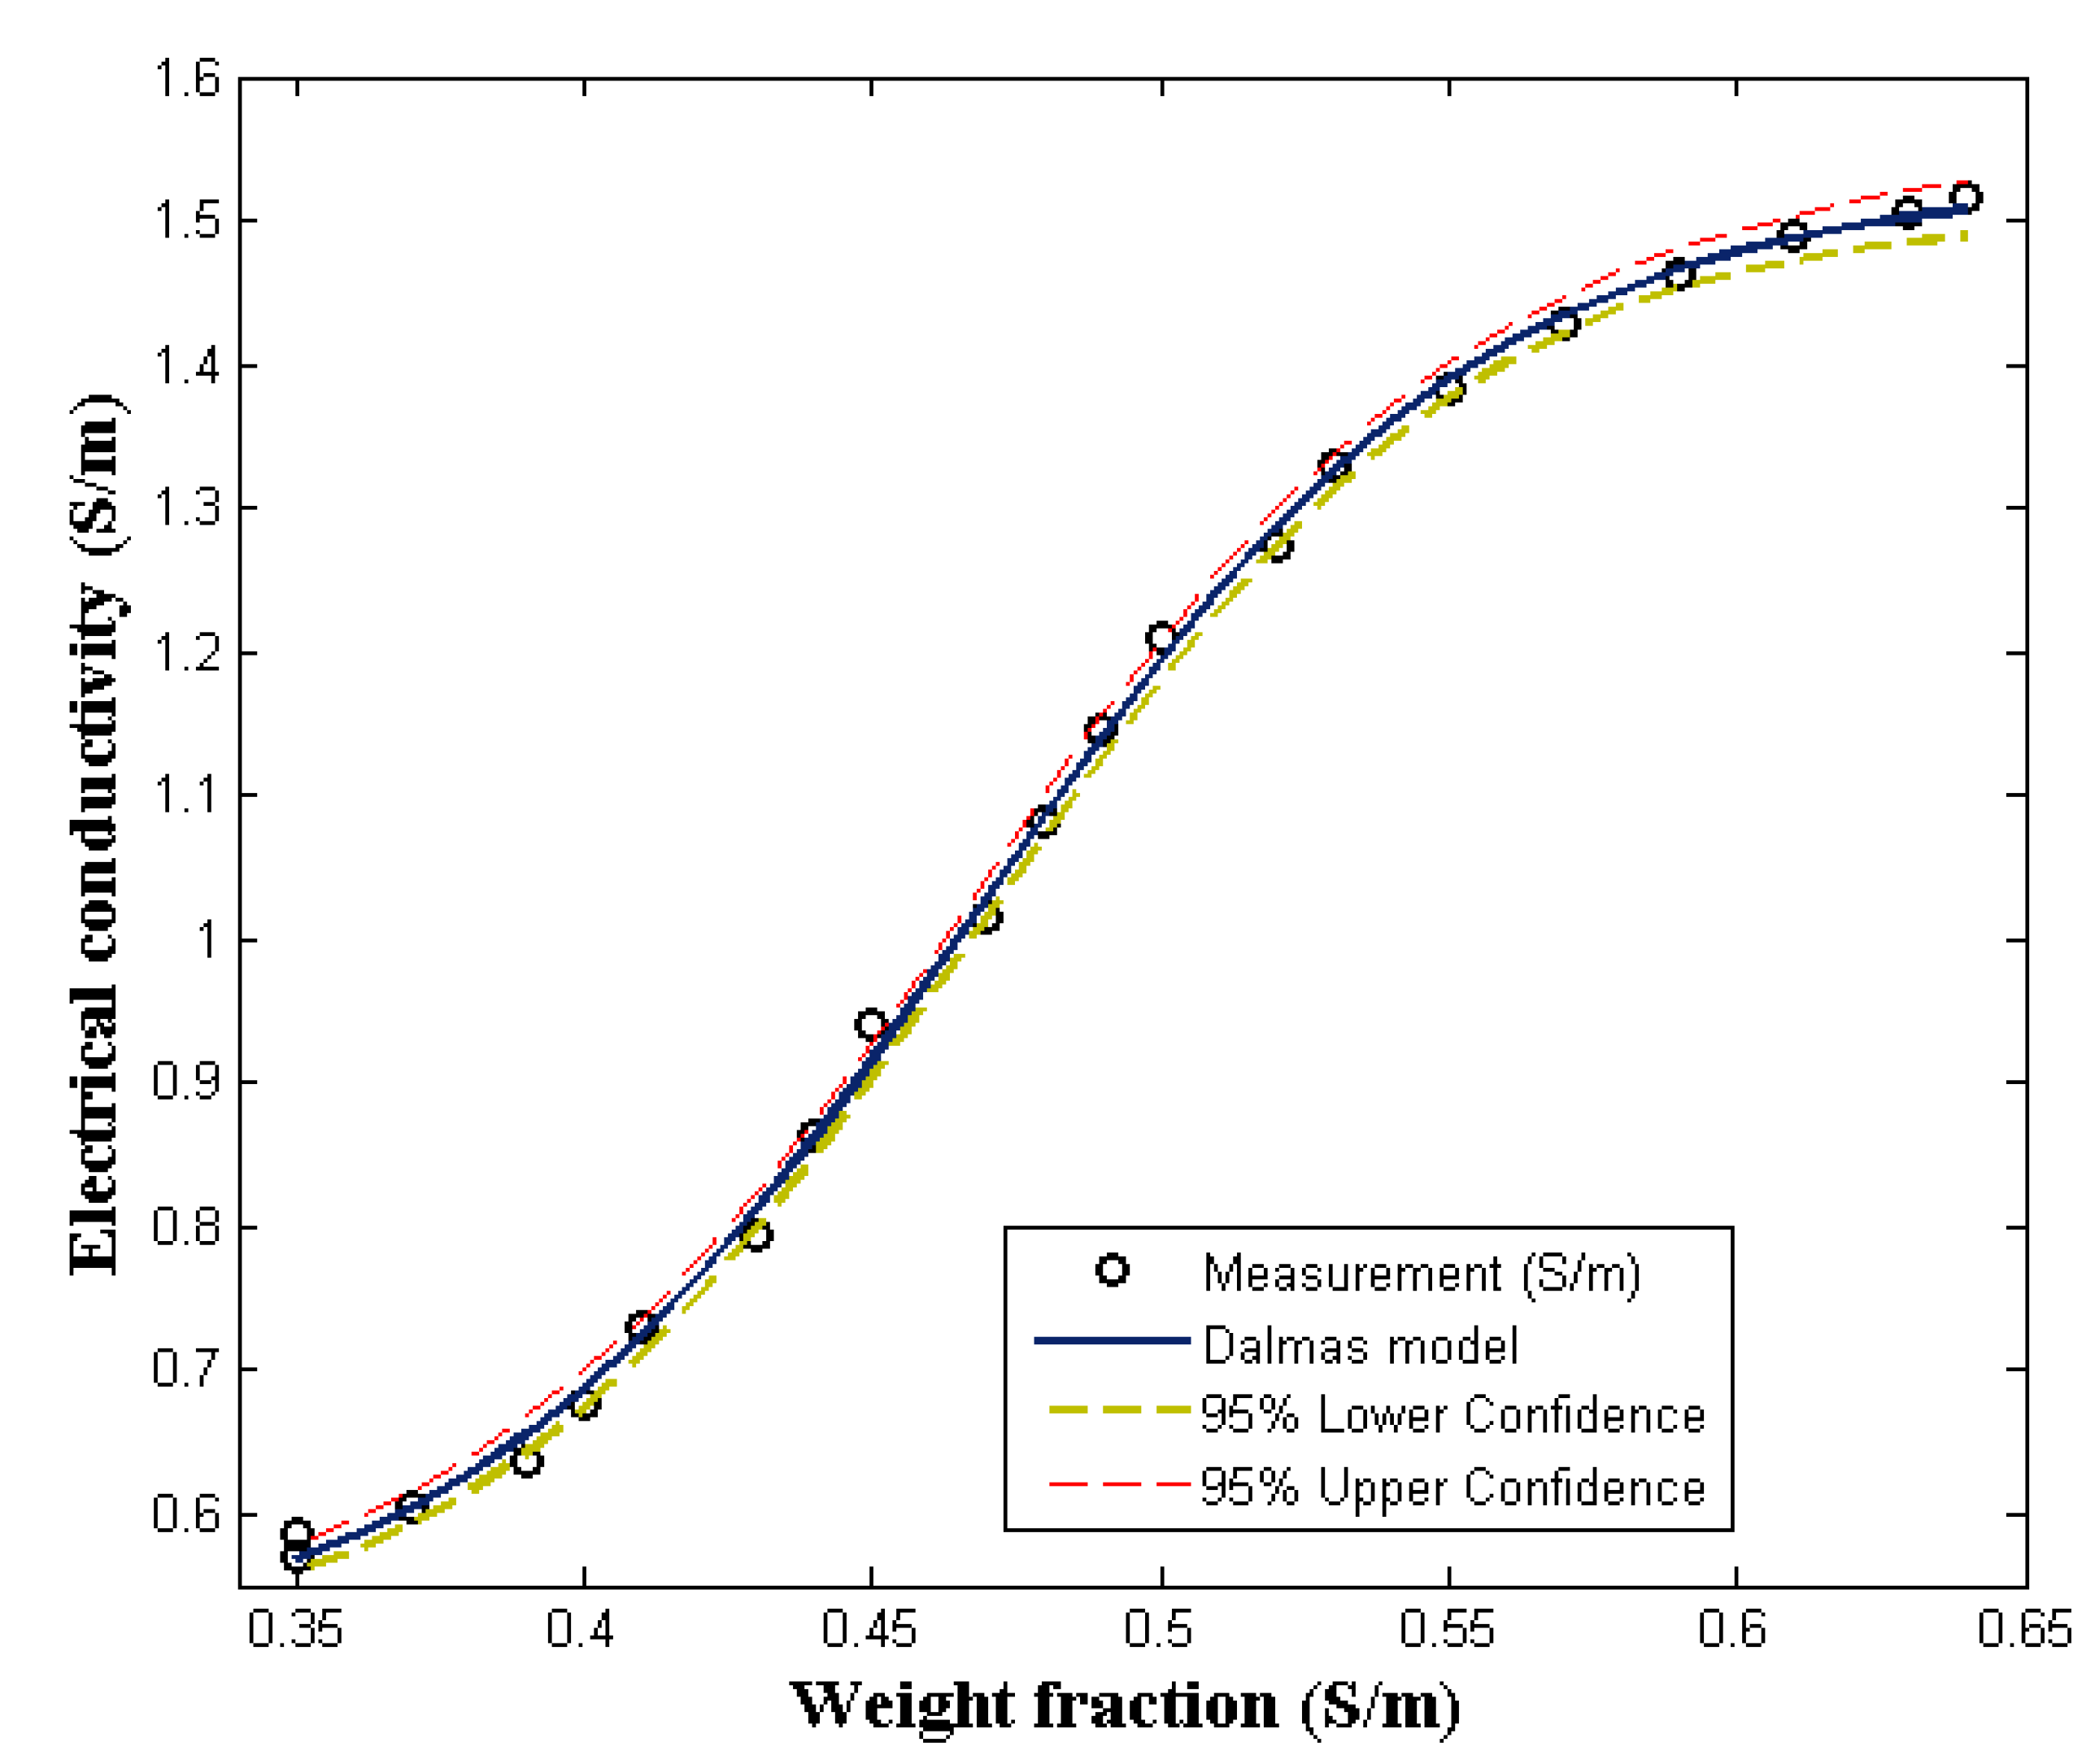
1.2. Dalmas s-Shape Model
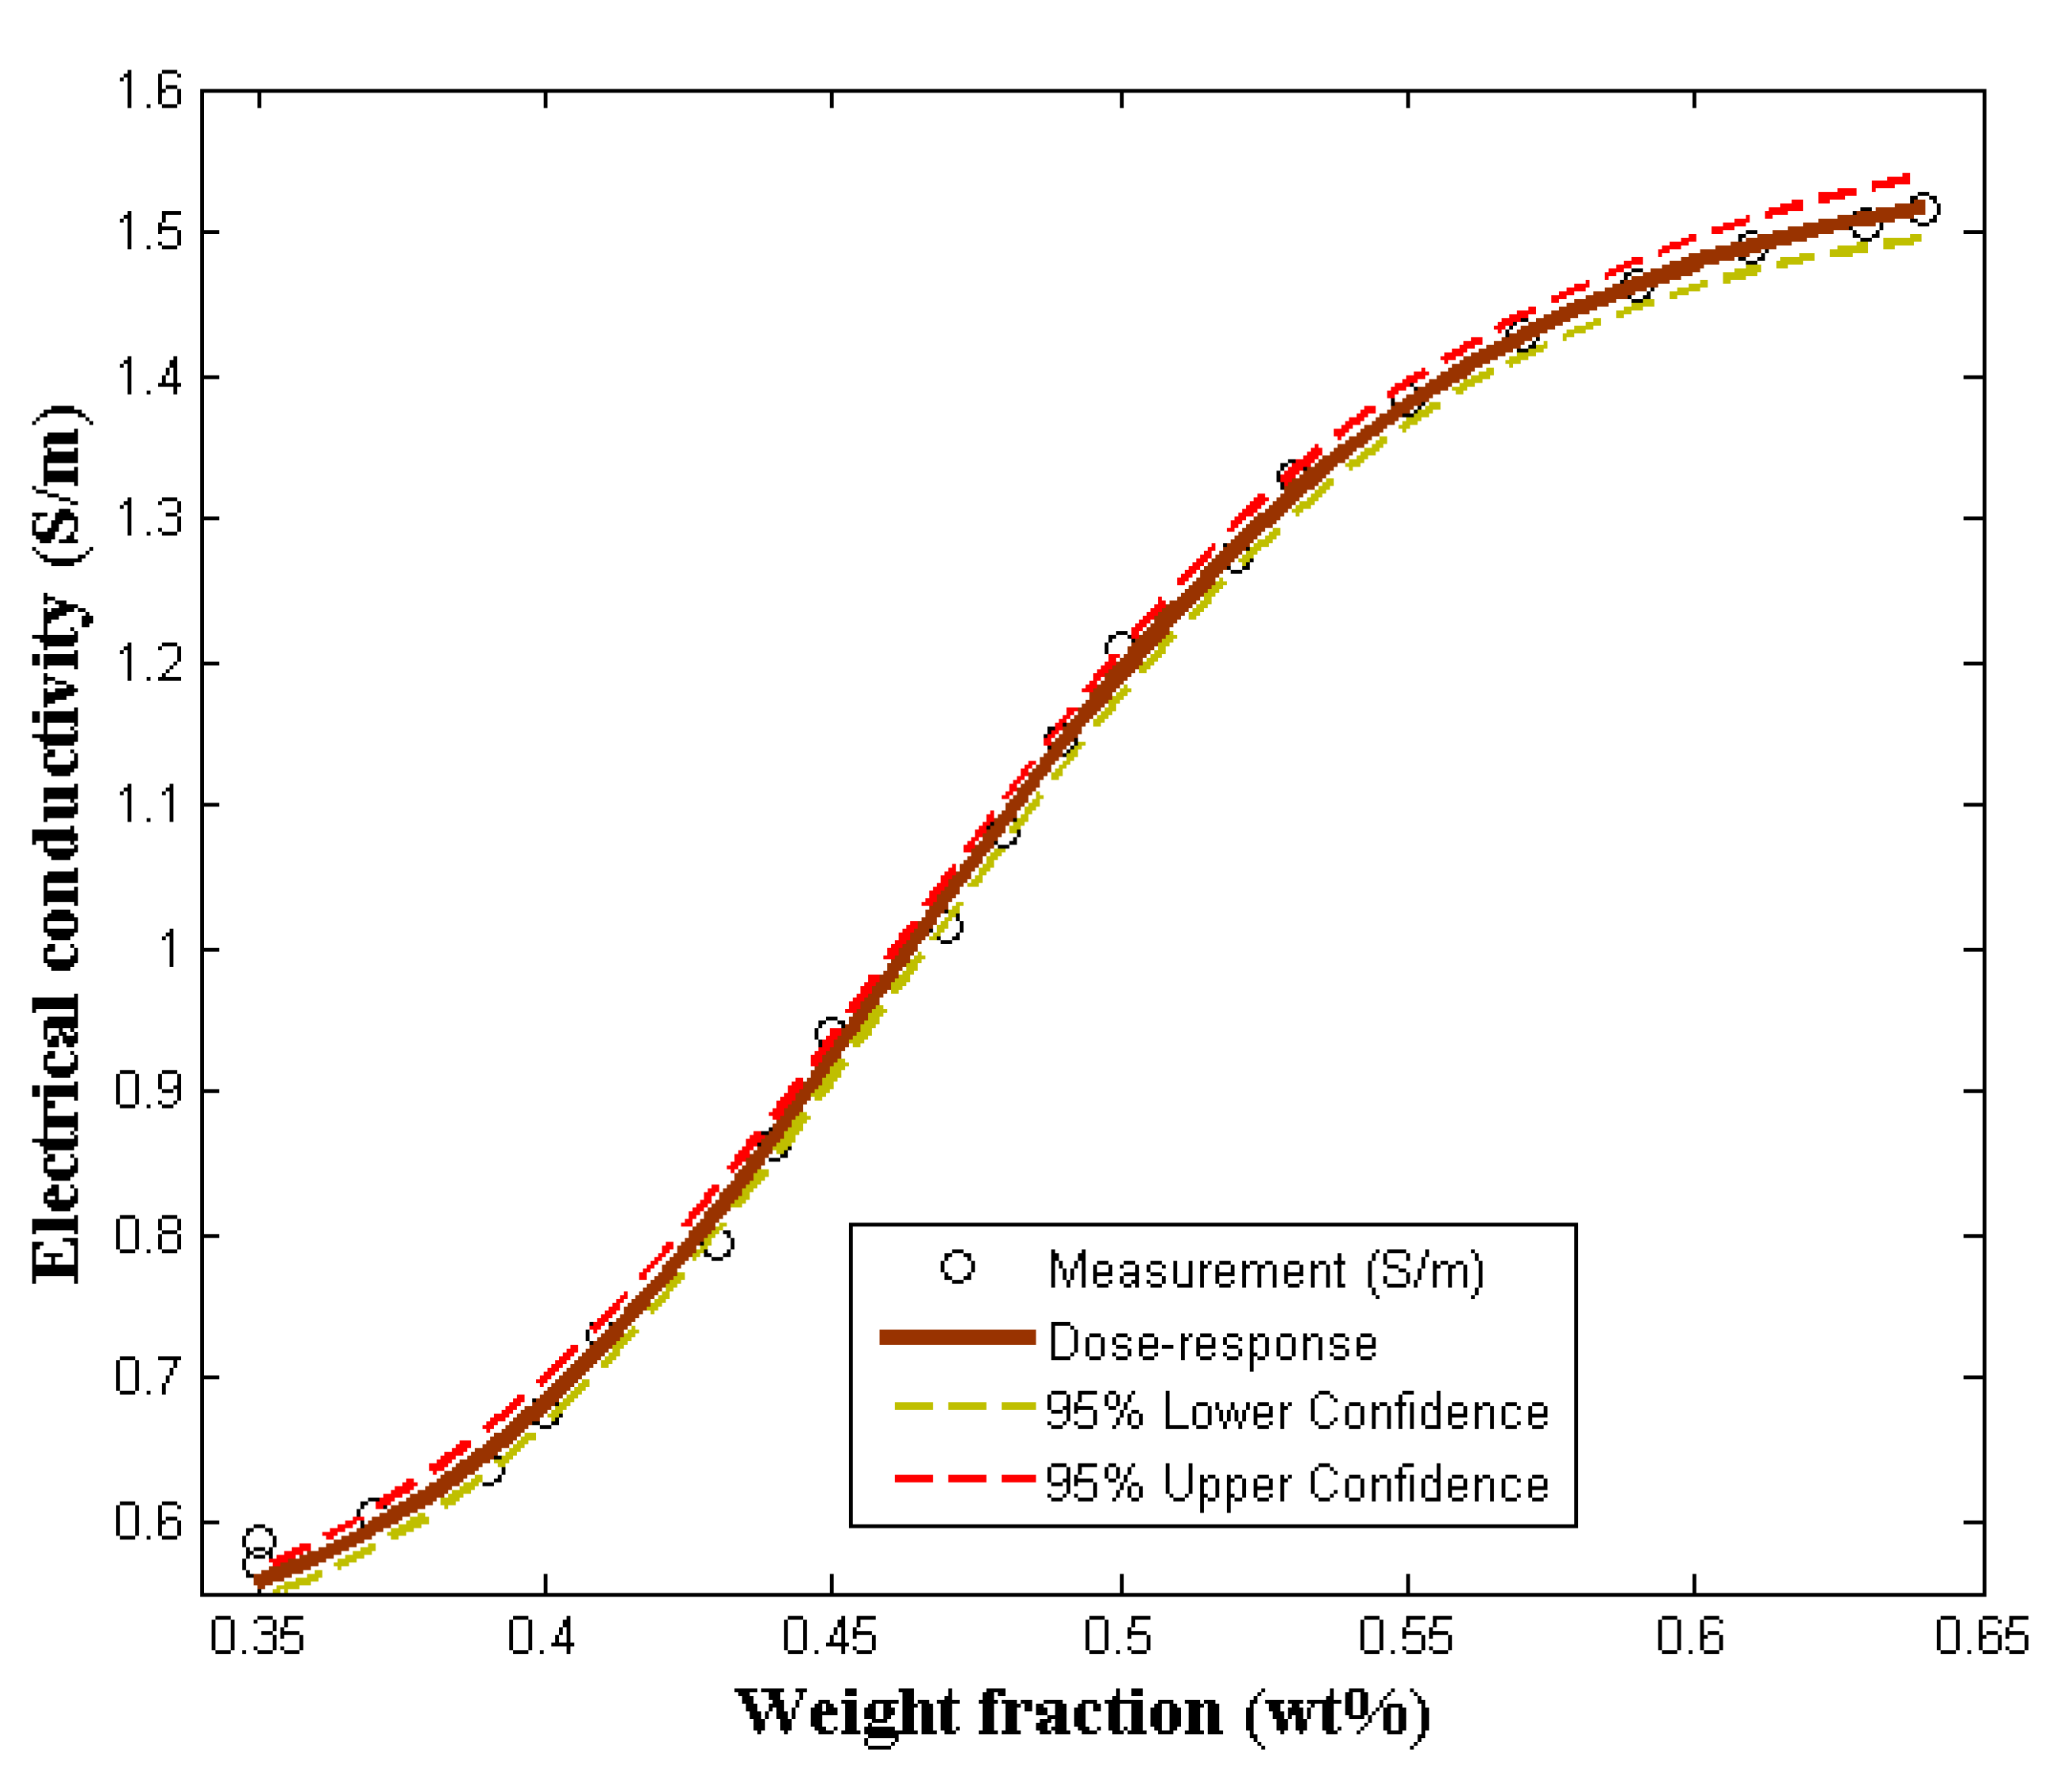
1.3. Dose–Response Model
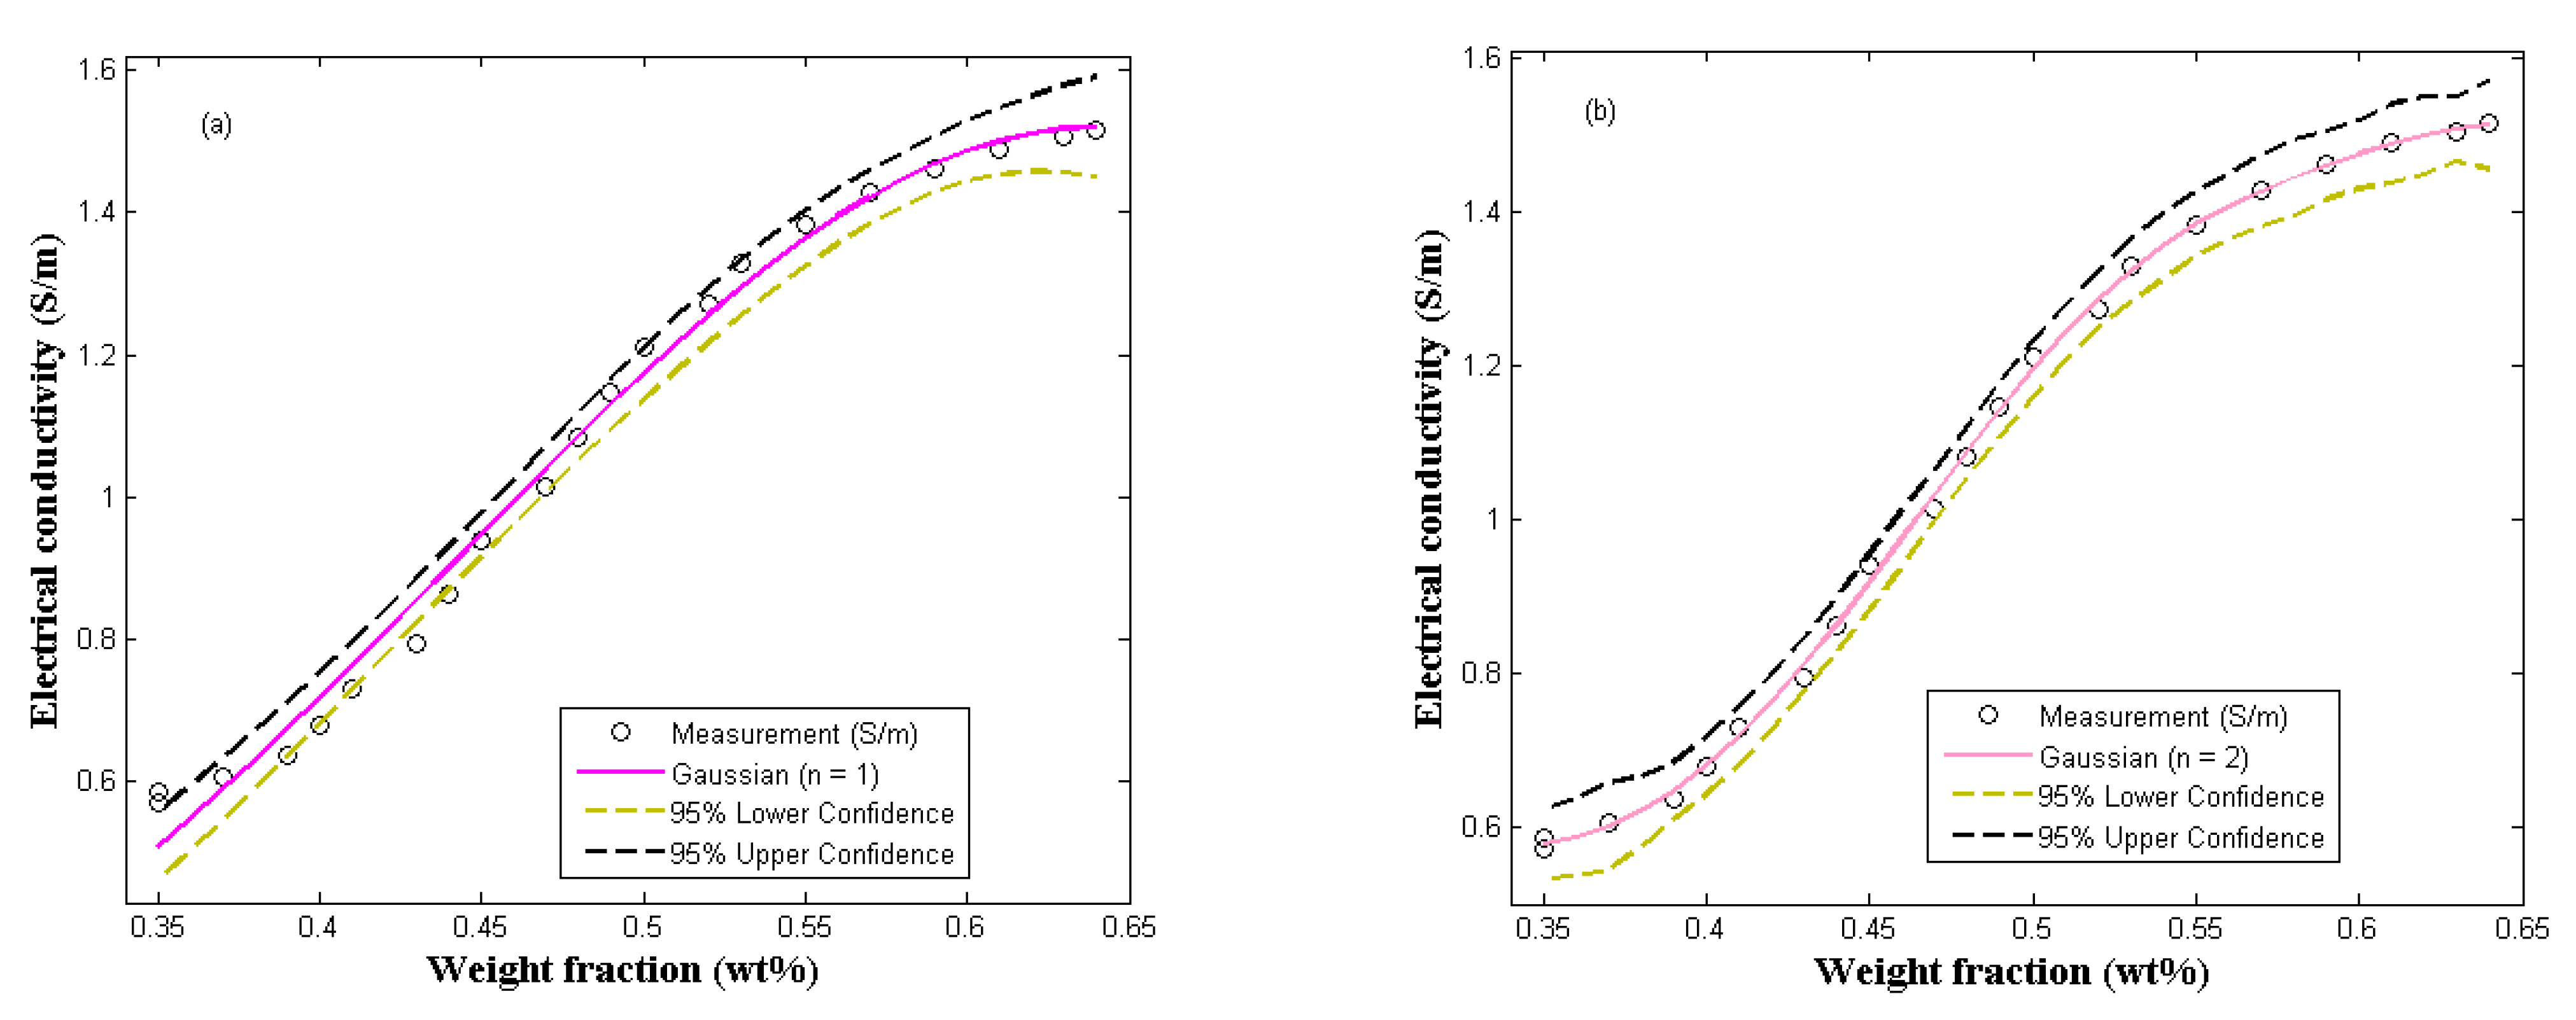
1.4. Gaussian Fitting Model
2. Results
Experimental Data and Modeling Analysis
3. Materials and Methods
Fabrication Method
4. Conclusions
Author Contributions
Funding
Institutional Review Board Statement
Informed Consent Statement
Data Availability Statement
Acknowledgments
Conflicts of Interest
References
- Al-Zu’bi, M.; Fan, M.; Anguilano, L. Advances in bonding agents for retrofitting concrete structures with fibre reinforced polymer materials: A review. Constr. Build. Mater. 2022, 330, 127115. [Google Scholar] [CrossRef]
- Pan, L.; Qiu, H.; Dou, C.; Li, Y.; Pu, L.; Xu, J.; Shi, Y. Conducting polymer nanostructures: Template synthesis and applications in energy storage. Int. J. Mol. Sci. 2010, 11, 2636–2657. [Google Scholar] [CrossRef] [PubMed] [Green Version]
- Bednarczyk, K.; Kukulski, T.; Fryczkowski, R.; Schab-Balcerzak, E.; Libera, M. Effect of Polythiophene Content on Thermomechanical Properties of Electroconductive Composites. Molecules 2021, 26, 2476. [Google Scholar] [CrossRef] [PubMed]
- Li, H.-Y.; Huang, D.-N.; Ren, K.-F.; Ji, J. Inorganic-polymer composite coatings for biomedical devices. Smart Mater. Med. 2021, 2, 1–14. [Google Scholar] [CrossRef]
- Aziz, S.B.; Dannoun, E.; Abdulwahid, R.T.; Kadir, M.F.; Nofal, M.M.; Al-Saeedi, S.I.; Murad, A.R. The Study of Ion Transport Parameters in MC-Based Electrolyte Membranes Using EIS and Their Applications for EDLC Devices. Membranes 2022, 12, 139. [Google Scholar] [CrossRef] [PubMed]
- Aziz, S.B.; Nofal, M.M.; Abdulwahid, R.T.; Kadir, M.; Hadi, J.M.; Hessien, M.M.; Kareem, W.O.; Dannoun, E.M.; Saeed, S.R. Impedance, FTIR and transport properties of plasticized proton conducting biopolymer electrolyte based on chitosan for electrochemical device application. Results Phys. 2021, 29, 104770. [Google Scholar] [CrossRef]
- Gaida, B.; Brzęczek-Szafran, A. Insights into the properties and potential applications of renewable carbohydrate-based ionic liquids: A review. Molecules 2020, 25, 3285. [Google Scholar] [CrossRef] [PubMed]
- Aziz, S.B.; Nofal, M.M.; Abdulwahid, R.T.; Ghareeb, H.O.; Dannoun, E.; Abdullah, R.M.; Hamsan, M.; Kadir, M. Plasticized Sodium-Ion Conducting PVA Based Polymer Electrolyte for Electrochemical Energy Storage—EEC Modeling, Transport Properties, and Charge-Discharge Characteristics. Polymers 2021, 13, 803. [Google Scholar] [CrossRef]
- Aziz, S.B.; Abdulwahid, R.T.; Kadir, M.F.; Ghareeb, H.O.; Ahamad, T.; Alshehri, S.M. Design of non-faradaic EDLC from plasticized MC based polymer electrolyte with an energy density close to lead-acid batteries. J. Ind. Eng. Chem. 2022, 105, 414–426. [Google Scholar] [CrossRef]
- Folorunso, O.; Hamam, Y.; Sadiku, R.; Ray, S.S.; Adekoya, G.J. Electrical Resistance control model for polypyrrole-graphene nanocomposite: Energy storage applications. Mater. Today Commun. 2021, 26, 101699. [Google Scholar] [CrossRef]
- Folorunso, O.; Hamam, Y.; Sadiku, R.; Ray, S.S.; Adekoya, G.J. Synthesis methods of borophene, graphene-loaded polypyrrole nanocomposites and their benefits for energy storage applications: A brief overview. FlatChem 2021, 26, 100211. [Google Scholar] [CrossRef]
- Moyseowicz, A.; Pająk, K.; Gajewska, K.; Gryglewicz, G. Synthesis of polypyrrole/reduced graphene oxide hybrids via hydrothermal treatment for energy storage applications. Materials 2020, 13, 2273. [Google Scholar] [CrossRef]
- Liu, Z.; Shen, D.; Yu, J.; Dai, W.; Li, C.; Du, S.; Jiang, N.; Li, H.; Lin, C.-T. Exceptionally high thermal and electrical conductivity of three-dimensional graphene-foam-based polymer composites. RSC Adv. 2016, 6, 22364–22369. [Google Scholar] [CrossRef]
- Tjong, S.C. Polymer composites with graphene nanofillers: Electrical properties and applications. J. Nanosci. Nanotechnol. 2014, 14, 1154–1168. [Google Scholar] [CrossRef]
- Folorunso, O.; Hamam, Y.; Sadiku, R.; Ray, S.S.; Joseph, A.G. Parametric analysis of electrical conductivity of polymer-composites. Polymers 2019, 11, 1250. [Google Scholar] [CrossRef] [Green Version]
- Clingerman, M.L.; King, J.A.; Schulz, K.H.; Meyers, J.D. Evaluation of electrical conductivity models for conductive polymer composites. J. Appl. Polym. Sci. 2002, 83, 1341–1356. [Google Scholar] [CrossRef]
- Mamunya, Y.P.; Davydenko, V.; Pissis, P.; Lebedev, E. Electrical and thermal conductivity of polymers filled with metal powders. Eur. Polym. J. 2002, 38, 1887–1897. [Google Scholar] [CrossRef]
- Folorunso, O.; Hamam, Y.; Sadiku, R.; Ray, S.S.; Joseph, A.G. The modified logistic model for polymer-composites electrical conductivity prediction. AIP Conf. Proc. 2020, 2289, 020019. [Google Scholar]
- Folorunso, O.; Hamam, Y.; Sadiku, R.; Ray, S.S.; Kumar, N. Investigation and modeling of the electrical conductivity of graphene nanoplatelets-loaded doped-polypyrrole. Polymers 2021, 13, 1034. [Google Scholar] [CrossRef]
- Takeda, T.; Shindo, Y.; Kuronuma, Y.; Narita, F. Modeling and characterization of the electrical conductivity of carbon nanotube-based polymer composites. Polymer 2011, 52, 3852–3856. [Google Scholar] [CrossRef]
- Folorunso, O.; Hamam, Y.; Sadiku, R.; Ray, S.S.; Adekoya, G.J. Statistical characterization and simulation of graphene-loaded polypyrrole composite electrical conductivity. J. Mater. Res. Technol. 2020, 9, 15788–15801. [Google Scholar] [CrossRef]
- Ondracek, G. Microstructure-thermomechanical-property correlations of two-phase and porous materials. Mater. Chem. Phys. 1986, 15, 281–313. [Google Scholar] [CrossRef]
- Dalmas, F.; Dendievel, R.; Chazeau, L.; Cavaillé, J.-Y.; Gauthier, C. Carbon nanotube-filled polymer composites. Numerical simulation of electrical conductivity in three-dimensional entangled fibrous networks. Acta Mater. 2006, 54, 2923–2931. [Google Scholar] [CrossRef]
- Hong, P.-Y. Antibiotic-Resistant Bacteria and Resistance Genes in the Water–Food Nexus of the Agricultural Environment. In Antimicrobial Resistance and Food Safety; Elsevier: Amsterdam, The Netherlands, 2015; pp. 325–346. [Google Scholar]
- Park, H.C.; Seong, J.; Han, K.H.; Chon, C.Y.; Moon, Y.M.; Suh, C.O. Dose–response relationship in local radiotherapy for hepatocellular carcinoma. Int. J. Radiat. Oncol. Biol. Phys. 2002, 54, 150–155. [Google Scholar] [CrossRef]
- Li, Z.-Y.; Tan, Y.-T.; Wang, J.; Fang, J.; Liu, D.-K.; Li, H.-L.; Xiang, Y.-B. Dose–response relationship between fat distribution and liver cancer incidence: A prospective cohort study in Chinese men. Cancer Epidemiol. 2022, 76, 102091. [Google Scholar] [CrossRef]
- Rahaman, M.; Aldalbahi, A.; Govindasami, P.; Khanam, N.P.; Bhandari, S.; Feng, P.; Altalhi, T. A new insight in determining the percolation threshold of electrical conductivity for extrinsically conducting polymer composites through different sigmoidal models. Polymers 2017, 9, 527. [Google Scholar] [CrossRef]
- Ritz, C.; Baty, F.; Streibig, J.C.; Gerhard, D. Dose–response analysis using R. PLoS ONE 2015, 10, e0146021. [Google Scholar] [CrossRef] [Green Version]
- Choi, S.; Jung, G.B.; Park, H.-K. A novel cardiac spectral segmentation based on a multi-Gaussian fitting method for regurgitation murmur identification. Signal Process. 2014, 104, 339–345. [Google Scholar] [CrossRef]
- Chou, Y.; Gu, Y.; Liu, J.; Huang, X.; Lin, J. Modelling arterial blood pressure waveforms for extreme bradycardia and tachycardia by curve fitting with Gaussian functions. Int. J. Model. Identif. Control. 2019, 32, 226–231. [Google Scholar] [CrossRef]
- Gournelos, T.; Kotinas, V.; Poulos, S. Fitting a Gaussian mixture model to bivariate distributions of monthly river flows and suspended sediments. J. Hydrol. 2020, 590, 125166. [Google Scholar] [CrossRef]
- Huang, Y.-H.; Tseng, F.-F.; Tsai, S.-J.; Lin, C.-H.; Chou, Y.-H.; Lew, H.L. The use of the Gaussian curve fitting method for scintigraphic measurements of the swallowing process in healthy subjects: Implications for evaluation of dysphagia. Arch. Phys. Med. Rehabil. 2006, 87, 1526–1529. [Google Scholar] [CrossRef] [PubMed]
- Jariwala, D.; Marks, T.J.; Hersam, M.C. Mixed-dimensional van der Waals heterostructures. Nat. Mater. 2017, 16, 170–181. [Google Scholar] [CrossRef] [PubMed]
- Park, S.-H.; Hwang, J.; Park, G.-S.; Ha, J.-H.; Zhang, M.; Kim, D.; Yun, D.-J.; Lee, S.; Lee, S.H. Modeling the electrical resistivity of polymer composites with segregated structures. Nat. Commun. 2019, 10, 2357. [Google Scholar] [CrossRef] [PubMed] [Green Version]
- Rahaman, M.; Aldalbahi, A.; Nayak, L.; Giri, R. Electrical conductivity of polymer–carbon composites: Effects of different factors. In Carbon-Containing Polymer Composites; Springer: Berlin/Heidelberg, Germany, 2019; pp. 159–210. [Google Scholar]
- Taherian, R. Experimental and analytical model for the electrical conductivity of polymer-based nanocomposites. Compos. Sci. Technol. 2016, 123, 17–31. [Google Scholar] [CrossRef]
- Shah, S.; Lee, J. Stochastic lightning damage prediction of carbon/epoxy composites with material uncertainties. Compos. Struct. 2022, 282, 115014. [Google Scholar] [CrossRef]


| Model | Parameters | Parameter Values | Standard Error | Per-Unit Standard Error | R2 | R2-adj |
|---|---|---|---|---|---|---|
| Ondracek | 8.51 | 0.27 | 0.03 | 0.967 | 0.962 | |
| −2.11 | 0.21 | 0.09 |
| Model | Parameters | Parameter Values | Standard Error | Per-Unit Standard Error | R2 | R2-adj |
|---|---|---|---|---|---|---|
| Dalmas s-shape | 1.02 | 0.008 | 0.007 | |||
| 22.37 | 0.462 | 0.021 | 0.9989 | 0.9988 | ||
| 10.46 | 0.203 | 0.019 |
| Model | Parameters | Parameter Values | Standard Error | Per-Unit Standard Error | R2 | R2-adj |
|---|---|---|---|---|---|---|
| Dose–response | 1.07 | 0.01 | 0.01 | |||
| −9.79 | 0.24 | 0.03 | 0.9986 | 0.9984 | ||
| 7.40 | 0.21 | 0.03 |
| Model | Parameters | Parameter Values | Standard Error | Per-Unit Standard Error | R2 | R2-adj |
|---|---|---|---|---|---|---|
| Gaussian | 1.52 | 0.024 | 0.02 | |||
| 0.64 | 0.011 | 0.02 | 0.9989 | 0.9902 | ||
| 0.28 | 0.012 | 0.04 |
| Model | Parameters | Parameter Values | Standard Error | Per-Unit Standard Error | R2 | R2-adj |
|---|---|---|---|---|---|---|
| Gaussian | 0.138 | 0.033 | 0.236 | 0.9983 | 0.9975 | |
| 0.346 | 0.019 | 0.056 | ||||
| 0.032 | 0.019 | 0.578 | ||||
| 1.505 | 0.008 | 0.005 | ||||
| 0.620 | 0.004 | 0.007 | ||||
| −0.244 | 0.007 | 0.027 |
Publisher’s Note: MDPI stays neutral with regard to jurisdictional claims in published maps and institutional affiliations. |
© 2022 by the authors. Licensee MDPI, Basel, Switzerland. This article is an open access article distributed under the terms and conditions of the Creative Commons Attribution (CC BY) license (https://creativecommons.org/licenses/by/4.0/).
Share and Cite
Folorunso, O.; Onibonoje, M.O.; Hamam, Y.; Sadiku, R.; Ray, S.S. Fabrication and Model Characterization of the Electrical Conductivity of PVA/PPy/rGO Nanocomposite. Molecules 2022, 27, 3696. https://doi.org/10.3390/molecules27123696
Folorunso O, Onibonoje MO, Hamam Y, Sadiku R, Ray SS. Fabrication and Model Characterization of the Electrical Conductivity of PVA/PPy/rGO Nanocomposite. Molecules. 2022; 27(12):3696. https://doi.org/10.3390/molecules27123696
Chicago/Turabian StyleFolorunso, Oladipo, Moses Oluwafemi Onibonoje, Yskandar Hamam, Rotimi Sadiku, and Suprakas Sinha Ray. 2022. "Fabrication and Model Characterization of the Electrical Conductivity of PVA/PPy/rGO Nanocomposite" Molecules 27, no. 12: 3696. https://doi.org/10.3390/molecules27123696
APA StyleFolorunso, O., Onibonoje, M. O., Hamam, Y., Sadiku, R., & Ray, S. S. (2022). Fabrication and Model Characterization of the Electrical Conductivity of PVA/PPy/rGO Nanocomposite. Molecules, 27(12), 3696. https://doi.org/10.3390/molecules27123696