Article

Berberrubine Phosphate: A Selective Fluorescent Probe for Quadruplex DNA

by
Peter Jonas Wickhorst
and
Heiko Ihmels
*
Department of Chemistry-Biology, University of Siegen, Center of Micro- and Nanochemistry and Engineering (Cµ), Adolf-Reichwein-Str. 2, 57068 Siegen, Germany
*
Author to whom correspondence should be addressed.
Molecules 2021, 26(9), 2566; https://doi.org/10.3390/molecules26092566
Submission received: 25 March 2021 / Revised: 20 April 2021 / Accepted: 22 April 2021 / Published: 28 April 2021
(This article belongs to the Special Issue Advances in DNA and RNA Sensing)

Abstract

:
A phosphate-substituted, zwitterionic berberine derivative was synthesized and its binding properties with duplex DNA and G4-DNA were studied using photometric, fluorimetric and polarimetric titrations and thermal DNA denaturation experiments. The ligand binds with high affinity toward both DNA forms (Kb = 2–7 × 10⁵ M−1) and induces a slight stabilization of G4-DNA toward thermally induced unfolding, mostly pronounced for the telomeric quadruplex 22AG. The ligand likely binds by aggregation and intercalation with ct DNA and by terminal stacking with G4-DNA. Thus, this compound represents one of the rare examples of phosphate-substituted DNA binders. In an aqueous solution, the title compound has a very weak fluorescence intensity (Φfl < 0.01) that increases significantly upon binding to G4-DNA (Φfl = 0.01). In contrast, the association with duplex DNA was not accompanied by such a strong fluorescence light-up effect (Φfl < 0.01). These different fluorimetric responses upon binding to particular DNA forms are proposed to be caused by the different binding modes and may be used for the selective fluorimetric detection of G4-DNA.

Graphical Abstract

1. Introduction

Among the various methods used for the detection of analytes in biological systems, small probe molecules that change their photophysical properties upon interaction with the analyte are particularly useful as they may be employed to detect biomolecules even in living organisms and may thus provide real-time information about biological processes [1,2]. Along these lines, fluorescent probes that either change their emission energy (color) or fluorescence quantum yield (intensity) upon association with a target molecule are of special interest [3,4,5]. In this context, nucleic acids are an important target class of analytes because they are relevant in many biological processes [6,7] and are therefore a key target in the treatment of several diseases [8,9,10]. Besides the detection of double-stranded DNA, there is also growing interest for the detection of noncanonical DNA structures like G-quadruplex DNA (G4-DNA) since they are relevant for biological activities such as gene transcription [11,12,13,14] or telomerase inhibition [15]. Consequently, many fluorescent probes have been reported that target DNA with high selectivity and efficiency in vitro and in vivo [16,17,18,19,20,21,22,23,24,25,26,27]. Among the many different classes used for the development of DNA-sensitive fluorescent probes, natural products like sanguinarine, coralyne, or berberine (1a) are particularly well suited as starting points because of their combination of favorable photophysical properties with a high biocompatibility and high affinity toward G4-DNA [28,29]. In fact, many fluorescent light-up probes based on these natural products have been developed that show a highly selective increase in their emission intensity upon binding to G4-DNA [20,21,22,23,24,25,26,27,28,29,30,31,32,33,34]. Among the natural products, berberine and its derivatives are extensively studied substrates because the biocompatibility of this class of compounds has been demonstrated with their application in the treatment of various diseases [35,36,37,38]. Moreover, these compounds exhibit a light-up effect upon binding to polyanionic analytes like DNA, which is, however, rather unselective for the parent berberine [28,33,39,40]. Since the fluorescence of berberine is dependent on the polarity of the environment [41,42], the light-up effect upon complexation to DNA is significantly influenced by the binding mode of the ligand. As a result, the introduction of substituents that lead to particular binding modes of berberine derivatives to different DNA forms should enable a more selective light-up effect of the bound ligand. In this context, we focused our attention to anionic substituents. Based on the observation that anions can coordinate to specific binding sites of DNA [43,44,45,46], we reasoned that a substitution of berberine with anionic substituents may also result in particular binding modes, which in turn would cause distinct light-up effects. However, to the best of our knowledge, the DNA-binding properties of only a few DNA ligands with anionic substituents have been investigated and it has been found that these ligands exhibit a negligible affinity toward double-stranded DNA, which is supposedly caused by the strong repulsion between the negatively charged ligands and the phosphate backbone of the DNA [47,48,49]. Thus, these ligands obviously do not exhibit a significant affinity to the anion binding sides of the DNA mentioned above. Nevertheless, the positively charged nitrogen atom of the isoquinolinium unit of berberine may compensate at least the negative charge and provide an overall charge-neutral substrate. In fact, a zwitterionic anthraquinone has already been reported that exhibits a similar binding affinity to DNA as compared to its cationic parent system [50]. Along the same lines, porphyrine and phthalocyanine ligands with negatively charged substituents, with hemin as the most prominent example, show a high affinity and selectivity toward G4-DNA [51,52,53,54,55,56]. Therefore, it may be concluded that under particular circumstances the G4-DNA tolerates a negative charge of the ligand. In this context, we propose that a berberine derivative with an anionic substituent may also exhibit some special DNA-binding properties based on the combination of the different structural properties, which in turn should lead to particular optical responses of the DNA-bound ligand. Hence, we synthesized a phosphate-substituted zwitterionic berberine derivative, namely 9-O-Phosphonatoberberrubin (2), and investigated its interactions with duplex and quadruplex DNA with a special focus on fluorimeric DNA detection.

2. Results and Discussion

2.1. Synthesis

The 9-O-Phosphonatoberberrubin (2) was synthesized from berberrubine (1b) in a two-step synthesis (Scheme 1). In the first step, the reaction of berberrubine (1b) with POCl3 gave an intermediate phosphoryl dichloride that was directly hydrolyzed to obtain the product 2 with a 44% overall yield. The NMR-spectroscopic analysis (1H, 13C, COSY, HSQC, HMBC), elemental analysis, and mass-spectrometric data were in accordance with the structure assignment of product 2.

2.2. Absorption and Emission Properties

The absorption and emission properties of compound 2 could only be tested in a few selected solvents because of its low solubility, especially in nonpolar solvents. This derivative exhibited similar absorption and emission properties as the parent berberine (1a) [41] with only a negligible effect from the solvent. Thus, the absorption maxima of the long-wavelength bands range between 424 nm (aqueous buffer) and 431 nm (MeOH, EtOH, 1-PrOH, MeCN, Table 1, Figure S1). However, the near-UV absorption bands between 346 nm (aqueous buffer) and 350 nm (MeOH) are slightly red-shifted as compared to 1a (MeOH: ∆λ = 10 nm). At the same time, the derivative 2 has only a very weak emission with maxima between 531 nm (1-PrOH) and 558 nm (MeOH). The fluorescence quantum yields are generally higher in less polar solvents (e.g., 1-PrOH: Φfl = 0.04) as compared to polar protic solvents (aqueous buffer: Φfl < 0.01), which was also found for the parent berberine (1a) and may be interpreted as a result of a charge transfer (CT) in the excited state [41,42]. Usually, a CT is closely accompanied by conformational changes that may cause a symmetry-forbidden transition between the CT-excited state and the ground state [57]. Specifically, the oscillator strength of the CT state is very low, which in turn decreases the probability for emission from the CT state. Since the CT state is more stabilized in polar solvents, the fluorescence quantum yields are especially low in these solvents [57,58].
Overall, the resemblance of the absorption and emission properties of the berberine derivative 2 with the ones of the parent compound 1a show that the phosphate group has essentially no special impact on the electronic transitions of the berberine unit as compared with the regular methoxy substituent of 1a.
To gain further insight into the factors that cause the weak fluorescence of compound 2, the dependence of the emission on the viscosity of the solvent was studied using measurements in glycerol, with a 0.25% DMSO to achieve sufficient solubility, at different temperatures (Figure 1) because the viscosity of this solvent changed from η = 1412 cP at 20 °C to η = 32 cP at 80 °C [60]. These experiments revealed a fluorescence quantum yield at a higher viscosity, i.e., Φfl = 0.03 at 20 °C, that decreased at a higher temperature (Φfl = 0.01 at 80 °C). This observation indicated additional pathways for a nonradiative deactivation of the excited state by conformational changes, for example, by torsional motions of the substituents or the more flexible C5-C6 ethano unit. However, since the fluorescence in solvents with low viscosity, such as 1-PrOH (Φfl = 0.04, η = 2.18 cP) [61] or MeCN (Φfl = 0.03, η = 0.36 cP) [61], is comparable to the one in glycerol at 20 °C, the fluorescence obviously depends not only on the viscosity.

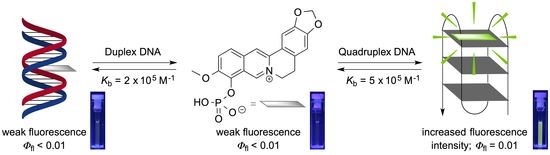
2.3. Photometric DNA Titrations

The binding properties of derivative 2 with double-stranded calf thymus (ct) DNA and G4-DNA were investigated by photometric titrations. For this purpose, a small series of biologically relevant quadruplex-forming oligonucleotides was selected, namely the parallel c-myc (d[AG3AG3CGCTG3AG2AG3]) and c-kit (d[TGA(G3TG3TA)2]), and the mixed parallel/antiparallel a2 (d[(ACAG3TGT)2]), which are found in the promoter regions of myc, kit and insulin [11,12,13,14], as well as 22AG (d[A(T2AG3)3G3]), which is located in the single-stranded DNA overhang of human telomers and forms a hybrid antiparallel–parallel conformation [15]. As a general trend, a continuous decrease and a red shift of the absorption bands at 346 nm and 424 nm were observed upon addition of DNA (Figure 2, Figure S3). Interestingly, the red shift was slightly more pronounced in the presence of G4-DNA (∆λ = 10–12 nm; ∆ν = 543–649 cm−1) as compared to ct DNA (∆λ = 6 nm; ∆ν = 329 cm−1). Moreover, no isosbestic points were observed during the titrations, which usually indicates different binding modes at varying ligand–DNA ratio (LDR). The resulting binding isotherms from the photometric titrations were used to determine the corresponding binding constants Kb (Table 2, Figure S5) [62]. Accordingly, the binding constant of the ligand 2 with ct DNA was slightly lower (Kb = 2.2 × 10⁵ M−1) than the ones with G4-DNA (Kb = 5.0–6.9 × 10⁵ M−1), and these values are in the same range as the binding parameters of berberine (1a) with ct DNA (Kb = 9.7 × 10⁴ M−1) [38] and 22AG (Kb = 4.5 × 10⁵ M−1) [28]. The relatively high affinity of derivative 2 to DNA is somewhat surprising because the introduction of negatively charged substituents is commonly believed to decrease the affinity of a DNA ligand. For example, the introduction of phosphate groups to known DNA binders, such as naphthalimide, napthaldiimide, or diaminomitosene [47,48,49], leads to a significantly decreased affinity to DNA as compared to the parent compounds, presumably due to the electrostatic repulsion between negatively charged phosphate substituent and the negatively charged DNA backbone. At the same time, anions have been shown to bind to DNA via specific associations with the DNA bases, and a zwitterionic anthraquinone has been reported to bind to DNA with the same affinity as the corresponding cationic system [50]. Thus, the berberine 2 represented one of the rare examples of ligands with anionic substituents that bind with sufficient affinity to duplex DNA. At the same time, the affinity toward G4-DNA was in good agreement with the one of the few already known anionic G4-DNA ligands [51,52,53,54].

2.4. Thermal DNA Denaturation Experiments

The stabilization of different G4-DNA forms toward thermally induced unfolding via association with ligand 2 was examined by thermal DNA-denaturation experiments. For that purpose, the melting temperature, Tm, of the dye-labeled quadruplex-forming oligonucleotides F21T, Fa2T, FmycT, and FkitT was determined using fluorescence spectroscopy (Table 2, Figures S6 and S7) [63]. The induced shifts of the melting temperature, ∆Tm, indicated that ligand 2 slightly stabilized the quadruplex forms F21T (∆Tm = 3.6 °C, at LDR = 5) and FmycT (∆Tm = 2.2 °C), and has essentially no effect on the oligonucleotides FkitT (∆Tm = 1.0 °C) and Fa2T (∆Tm = 0.6 °C). Notably, the ∆Tm values were, in most cases, not affected by the presence of a potentially competitive double-stranded DNA as formed by the self-complementary oligonucleotide ds26 (F21T/ds26: ∆∆Tm = –0.4 °C; FRETS = 0.89, FkitT/ds26: ∆∆Tm = 0.0 °C; FRETS = 1.00, Fa2T/ds26: ∆ΔTm = −0.2 °C; FRETS = 0.67) (Figures S6 and S7), which revealed a selective association of the ligand with the G4-DNA structures in the mixtures of both oligonucleotides. Only the stabilization of oligonucleotide FmycT was affected marginally by the presence of ds26 (FmycT/ds26: ∆∆Tm = −1.3 °C; FRETS = 0.41).

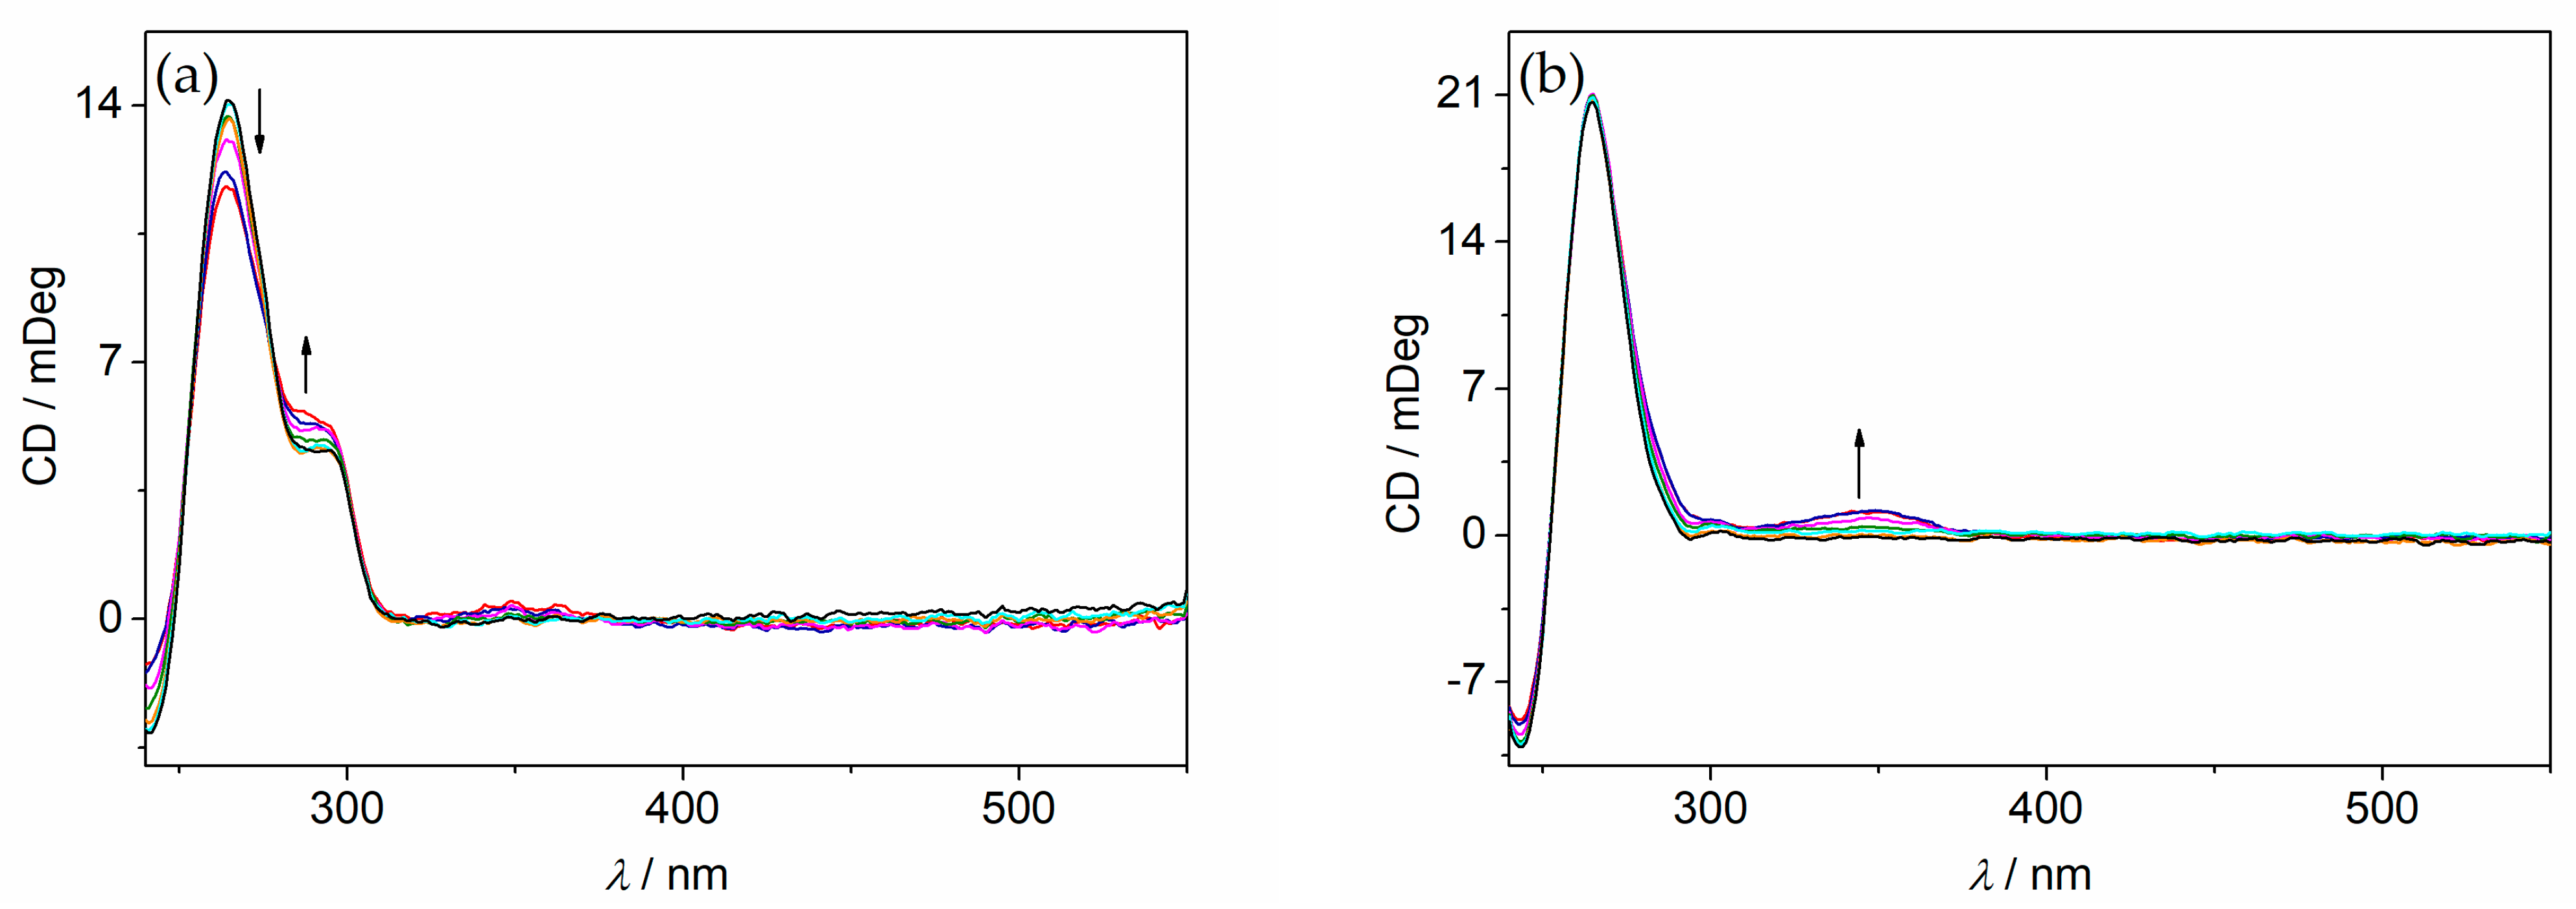
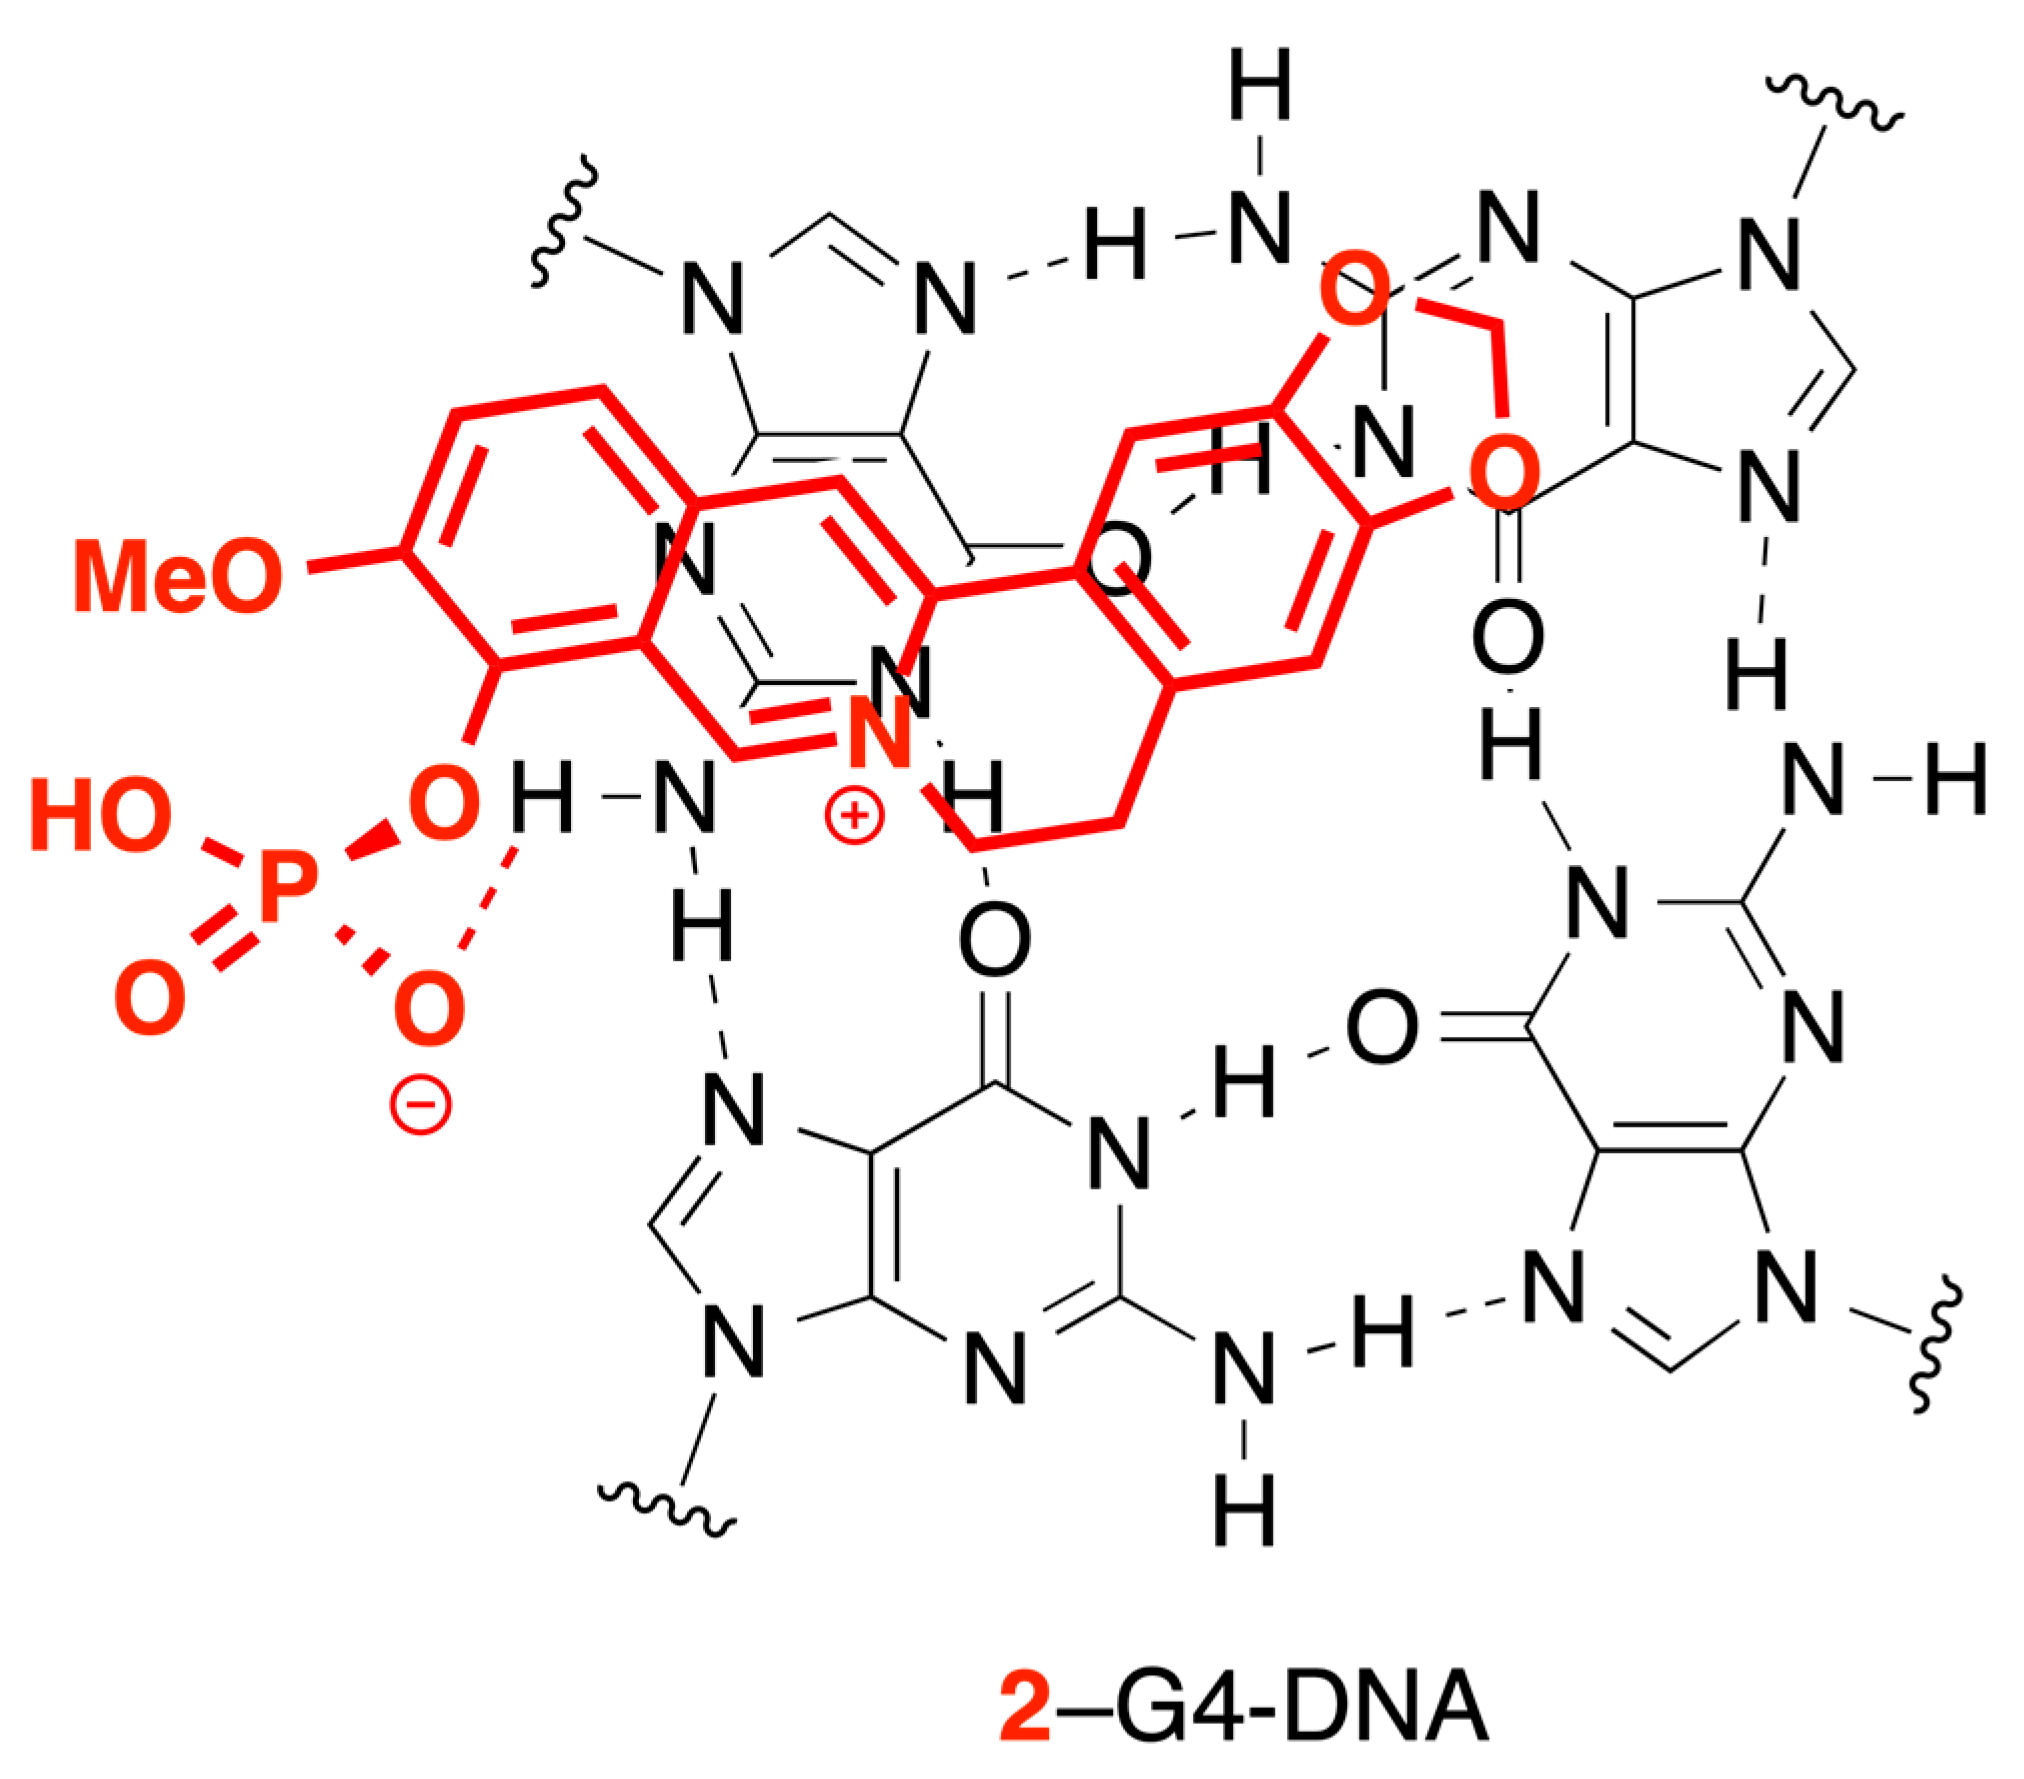
2.5. CD and LD Spectroscopy

Circular dichroism (CD) spectroscopy and flow linear dichroism (LD) spectroscopy were used to examine the interactions of ligand 2 with double-stranded ct DNA in more detail (Figure 3, Figure S8). Upon the addition of ligand 2, the CD signal of ct DNA at 278 nm continuously decreased and the intensity of the negative signal at 258 nm strongly increased at LDR = 2.0, which may be caused by a strong overlapping induced CD (ICD) signal of the absorption band of 2 at 290 nm or by changes of the secondary structure of the DNA during complex formation [64,65]. At the same time, a positive ICD signal developed with a maximum of 430 nm together with a strong bisignate ICD band with zero transition at the absorption maximum of 2 at 345 nm at LDR = 1.0–2.0, which indicates the aggregation of the ligand along the DNA backbone at high LDR [64,65]. To assess whether aggregation occurs exclusively in the presence of ct DNA, the absorption of a more concentrated solution of 2 (c = 500 µM) in a buffer solution was recorded at different temperatures (Figure S2). The absorption of the ligand did not change at different temperatures, which indicated that derivative 2 does not aggregate in the absence of DNA even at these relatively high concentrations.
The flow LD spectra of ct DNA-ligand mixtures revealed negative LD bands with peaks at 354 nm and 430 nm upon addition of the ligand at LDR = 0–0.5 (Figure 3B). Such negative LD bands originate from a coplanar alignment of the ligand relative to the DNA bases and prove the intercalation of the ligand into ct DNA as the dominant binding mode at low LDR [66] as it has already been found for the parent ligand 1a [67]. Other than derivate 2, however, 1a does not exhibit ICD signals under identical conditions [68], pointing to a different binding mode, specifically a different orientation within the intercalation pocket as compared to ligand 2. In the case of the intercalated berberine (1a), the π stacking of the isoquinolinium part with the DNA bases has been proposed, whereas the benzodioxole unit is accommodated in the groove [67]. Due to the steric hinderance and the negative charge of the phosphate substituent, this binding mode is rather improbable for ligand 2. Instead, in this case the benzodioxole unit more likely intercalates into the binding pocket and the bulky isoquinolinium-phosphate part points into the groove. In this particular binding mode, the negatively charged phosphate group has the ability to interact with amino groups of adenine, guanine, or cytosine via hydrogen bridging as already reported for sulfate or phosphate ions [43,44,45,46]. However, due to the strong electrostatic repulsion between neighboring ligands, the number of available intercalation sites is limited, leading to aggregation along the DNA backbone as additional binding mode at high LDR. Likewise, a known zwitterionic anthraquinone has been assumed to bind by outside-edge binding to DNA [50], which is in agreement with the aggregation of 2 at high LDR. Nevertheless, as a notable difference the ligand 2 also intercalates into DNA as confirmed by the LD spectroscopic investigations.
The binding interactions of ligand 2 with G4-DNA were also examined with CD spectroscopy (Figure 4). Upon the addition of 2 to oligonucleotide a2, a decrease of the CD signal at 265 nm and an increase of the shoulder at 290 nm were observed. Although these changes were only marginal, they may originate from a shift of the equilibrium from the parallel (260 nm) to the antiparallel (295 nm) conformation of the quadruplex [69,70]. In contrast, the characteristic DNA signals of 22AG, c-kit and c-myc only fluctuated a bit or did not even change at all, which indicated that the original conformation of these oligonucleotides remained intact upon association with ligand 2 [71]. Interestingly, only solutions of ligand 2 with antiparallel G4-DNA structures c-myc and c-kit exhibited ICD bands, whereas the hybrid-type 22AG and the mixed parallel/antiparallel a2, both of which contained loops above the terminal quartet, did not exhibit a significant ICD signal. Thus, weak positive ICD signals were detected at 354 nm after the addition of 2 to oligonucleotides c-myc and c-kit, which corresponded to the short-wavelength absorption band of the ligand. Since positive ICD signals are caused by a nondegenerative coupling of orthogonal transition dipole moments of the ligand and the DNA bases [70,72], the ICD can be used to deduce the relative orientation of the ligand within the binding site. In fact, it had been proposed recently that such a positive ICD band of berberine–adenine conjugates originates from terminal stacking with the ethano unit of the berberine pointing inside the quadruplex and the bulky substituents at the 9 position extending into the groove [29]. Since the latter 9-O-substituted berberine derivatives and 2 are assumed to have similar transition dipole moments, it is concluded that the positive ICD signal of 2 also indicates a resembling binding mode with c-myc and c-kit (Figure 5). In this binding mode, the phosphate substituent protrudes into the groove where it can coordinate by hydrogen bonding to an amino group of the quartet [44]. The intercalation of the ligand is excluded because this binding mode would require a thermodynamically unfavorable unwinding of the quadruplex structure, and it should lead to a significant change of the CD sinature of the G4-DNA, which we did not observe.
In contrast, no ICD signals of ligand 2 were observed in the presence of 22AG and a2, which is often proposed to indicate terminal π stacking [73,74], also in the case of the parent berberine 1a [28,75]. Without a clear positive or negative ICD signal, however, the orientation of the ligand in the binding site cannot be determined from this result, but the lack of a positive ICD at least shows that the ligand is positioned differently in the binding site of 22AG and a2 than with c-myc and c-kit. This discrepancy may be the result of the different structures of the G4-DNA forms. Specifically, 22AG and a2 contain adenine, guanine, and thymine residues close to the terminal quartets [76,77], whereas, for c-myc and c-kit, fewer binding sites are available at these particular positions. In the case of c-kit, only one amino group of an adenine base is accessible, and c-myc contains only one free thymine base at one of the terminal quartets [78,79]. Therefore, the π-stacked ligand has further opportunities to bind with the phosphate to the amino substituents in the loops of 22AG and a2. Furthermore, 22AG contains an adenine triplet above the terminal G-quartet, which offers an additional binding site for the phosphate group because it has been shown that anions bind well to the adenine quartet [45,46].

2.6. Fluorimetric Titrations

Upon the addition of DNA, the emission of ligand 2, which is hardly detectable in aqueous buffer solution, continuously increased and emission bands between 530 nm (22AG) and 544 nm (ct DNA) developed (Figure 6, Figure S4). Most notably, upon the addition of G4-DNA, a clear light-up effect was observed (Φfl = 0.01), whereas the emission after the addition of ct DNA still remained very low (Φfl < 0.01). Since the quenching of the fluorescence of 2 in an aqueous solution is mainly caused by a CT and conformational relaxation (see above), the partial suppression of both deactivation channels is proposed to cause the increased emission intensity of the DNA-bound ligand. Firstly, emission quenching by conformational motions is likely suppressed or at least hindered in the sterically constrained binding sites. Secondly, the deactivation of the excited state by a CT is suppressed in the less polar environment within the DNA binding site [55,56,80,81]. In the case of the complexation of ligand 2 and ct DNA, however, two different binding modes need to be considered. Upon aggregation along the DNA backbone at high LDR, the ligand is not completely shielded from the polar aqueous environment, so the excited state is still deactivated by CT. Moreover, the aggregation enables additional deactivation pathways by excitonic coupling or charge transfer between the aggregated molecules [82,83], leading, in combination with the CT, to a very low fluorescence of the DNA-bound aggregate. Moreover, upon intercalation into the duplex DNA, the conformational freedom is hindered and the ligand is somewhat shielded from the buffer solution. Overall, the combination of these effects upon binding of 2 to ct DNA results in a small but still significant increase in the emission intensity.
The more pronounced increase in the emission intensity of the G4-DNA-bound ligand 2 may indicate that the conformational flexibility of the ligand was suppressed more efficiently upon complexation to this DNA form, e.g., by a tight accommodation of the ligand in the binding site. Furthermore, the ligand was shielded from the aqueous environment, thus leading, in combination with the restriction of conformational flexibility, to a more pronounced light-up effect. Interestingly, the complexes of 2 with c-myc and c-kit, which showed a positive ICD, also exhibited slightly lower fluorescence quantum yields (c-myc: Φfl = 0. 008; c-kit: Φfl = 0.008) compared to the complexes with 22AG (Φfl = 0.011) and a2 (Φfl = 0.010). Although these differences were very small, especially considering the error limit, they may still indicate the different binding modes of 2 to the particular G4-DNA forms (see above), which in turn caused a slightly different extent of fluorescence quenching.

3. Materials and Methods

3.1. Equipment

Absorption: Varian Cary 100 Bio with baseline correction. Emission: Varian Cary Eclipse at 20 °C. Cuvettes: Quartz cells (10 mm × 4 mm). NMR spectra: Jeol ECZ 500 (1H: 500 MHz, 13C: 125 MHz) at 25 °C at 25 °C (DMSO-d6). NMR spectra were processed with the software MestReNova and referenced to the solvent DMSO-d6 (δ(DMSO-d5): 1H = 2.50 ppm, 13C: δ = 39.5 ppm). Elemental analyses data: HEKAtech EUROEA combustion analyzer, by Rochus Breuer, Organische Chemie I, Universität Siegen. Mass spectrometry (ESI): Finnigan LCQ Deca (U = 6 kV; working gas: Ar; auxiliary gas: N2; temperature of the capillary: 200 °C). Circular dichroism (CD) and flow-linear dichroism (LD): Chirascan CD spectrometer, Applied Photophysics. For LD spectra: High Shear Cuvette Cell Accessory (Applied Photophysics). The LD samples were recorded in a rotating cuvette with a shear gradient of 1200 s−1. Melting points (uncorrected): BÜCHI 545 (BÜCHI, Flawil, CH).

3.2. Materials

Berberrubine (1b) was synthesized according to published procedures [84]. Calf thymus DNA (ct DNA, type I; highly polymerized sodium salt; ε = 12824 cm−1M−1) [85] was purchased from SigmaAldrich (St. Louis, MO, USA) and used without further purification. Oligodeoxyribonucleotides (HPLC purified) d[A(GGGTTA)3GGG] (22AG), d[(ACAGGGGTGTGGGG)2] (a2), d[TGAG3TG3TAG3TG3TA] (c-myc), d[(AG3AG3CGCTG3AG2AG3)] (c-kit), d[CA2TCG2ATCGA2T2CGATC2GAT2G] (ds26), d[fluo-(GGGTAA)3GGG-tamra] (F21T), d[fluo-(ACAGGGGTGTGGGG)2-tamra] (Fa2T), d[fluo-TGAG3TG3TAG3TG3TA-tamra] (FmycT), and d[fluo-(AG3AG3CGCTG3AG2AG3)-tamra] (FkitT) (fluo = fluorescein, tamra = tetramethylrhodamine) were purchased from Metabion Int. AG (Planegg/Martinsried). The concentration of ct DNA is given in base pairs (bp).
The ct DNA was dissolved in a BPE buffer solution. Solutions of oligonucleotides were prepared in a K-phosphate buffer, heated to 95 °C for 5 min, and cooled slowly to room temperature within 4 h. K-phosphate buffer: 25 mM K2HPO4, 60 mM KCl; adjusted with 50 mM KH2PO4, 60 mM KCl to pH 7.0; BPE (biphosphate EDTA) buffer: 6.0 mM Na2HPO4, 2.0 mM NaH2PO4, 1.0 mM Na2EDTA; pH 7.0. All buffer solutions were prepared from purified water (resistivity 18 MΩ cm) and biochemistry-grade chemicals. The buffer solutions were filtered through a PVDF membrane filter (pore size 0.45 μm) prior to use.

3.3. Synthesis

10-Methoxy-5,6-dihydro-[1,3]dioxolo[4,5-g]isoquinolino[3,2-a]isoquinolin-7-ium-9-yl hydrogen phosphate. A mixture of 1b (321 mg, 1.00 mmol) and Et3N (153 µl) in CH2Cl2 (40 mL) was cooled to 0 °C and POCl3 (109 µl, 183 mg, 120 µmol) was added. The reaction mixture was stirred for 30 min at r.t. and the formed precipitate was filtered. The yellow crude was dissolved in an aqueous HCl solution (1 M, 20 mL) and the aqueous solution was extracted with CH2Cl2 (3 × 30 mL). The organic layer was washed with water (2 × 20 mL) and brine (20 mL) and dried with Na2SO4. The drying agent was filtered off and the solvent was removed by distillation to leave the product 2 as a yellow amorphous solid (177 mg, 441 µmol, 44%). To obtain an analytically pure sample, 2 was recrystallized from MeOH/EtOAc into product 2 as yellow needles; m.p. > 246 °C (dec.), 1H-NMR (500 MHz, DMSO-d6, Figure S9): δ = 3.21 (t, 3J = 6 Hz, 2H, 5-H), 3.87 (s, 3H, OCH3), 4.86 (t, 3J = 6 Hz, 2H, 6-H), 6.17 (s, 2H, OCH2O), 7.10 (s, 1H, 4-H), 7.81 (s, 1H, 1-H), 8.02 (d, 3J = 9 Hz, 1H, 12-H), 8.18 (d, 3J = 9 Hz, 1H, 11-H), 8.96 (s, 1 H, 13-H), 10.12 (s, 1H, 8-H). 13C NMR (125 MHz, DMSO-d6, Figure S10): δ = 26.5 (C5), 55.9 (C6), 57.1 (OCH3), 102.1 (OCH2O), 105.5 (C1), 108.5 (C4), 120.3 (C13), 120.5 (C13b), 122.1 (C8a), 123.5 (C12), 127.1 (C11), 130.5 (C4a), 133.0 (C12a), 137.0 (C13a), 138.6 (C9), 146.6 (C8), 147.7 (C2), 149.8 (C3), 150.9 (C10). MS (ESI+): m/z (%) = 302 (100) [M + H]+. El anal for C19H16NO7P × 1.5 H2O: calcd. (%) C 53.28, H 4.47, N 3.27 found (%) C 53.67, H 4.21, N 3.04.

4. Conclusions

In summary, a novel berberine-based DNA ligand with a phosphate substituent was synthesized that binds with high affinity to ct DNA and G4-DNA. With these particular properties, this derivative represents one of the few reported phosphate-substituted DNA ligands. Most notably, ligand 2 binds preferentially to G4-DNA relative to duplex DNA and exhibits a selective light-up effect upon binding to quadruplex-forming oligonucleotides, whereas the emission intensity increases to a much lesser extent upon binding to the double-stranded ct DNA. The significantly increased emission intensity in 2 upon association with G4-DNA is mainly caused by the binding mode, namely terminal π stacking, which shields the ligand from the polar aqueous environment and suppresses fluorescence quenching by a CT. Considering the selectivity of the light-up effect, this ligand has the potential to be employed for the fluorimetric detection of G4-DNA structures in biological samples.
Overall, it was demonstrated that a phosphate unit does not necessarily decrease the affinity of a DNA-binding ligand and that this substituent may even support the selective association with G4-DNA. Therefore, we propose that this observation may be used as starting point for the development of a novel type of DNA-binding ligand by combining other established cationic DNA intercalators, e.g., ethidium, acridinium, or quinolizinium, with a phosphate group.

Supplementary Materials

The following items are available online, Figure S1: Absorption and emission spectra of 2, Figure S2: Absorption spectra of 2 in a BPE buffer at different temperatures, Figure S3: Photometric titration of 2 with 22AG, c-kit and c-myc, Figure S4: Fluorimetric titration of 2 with 22AG, c-kit and c-myc, Figure S5: Fitting curves of binding isotherms from photometric titrations of 2 with DNA, Figure S6: Normalized changes in emission intensity of the dye-labeled oligonucleotides upon the addition of 2, Figure S7: Induced shift in the melting temperature, ∆Tm, of dye-labeled oligonucleotides upon addition of 2, Figure S8: CD spectra of oligonucleotides 22AG and c-kit in the absence and presence of 2, Figure S9: 1H-NMR spectrum of 2, Figure S10: 13C-NMR spectrum of 2. References [30,59,62,86,87] are cited in the supplementary materials.

Author Contributions

Conceptualization, P.J.W. and H.I.; methodology, P.J.W. and H.I.; experimental work (synthesis, analysis, and documentation), P.J.W.; writing—original draft preparation, P.J.W.; writing—review and editing, H.I.; project administration, H.I.; funding acquisition, H.I. All authors have read and agreed to the published version of the manuscript.

Funding

Generous support from the Deutsche Forschungsgemeinschaft and the University of Siegen is gratefully acknowledged.

Institutional Review Board Statement

Not applicable.

Informed Consent Statement

Not applicable.

Data Availability Statement

Data is available from the authors.

Acknowledgments

We thank Jennifer Hermann for her technical assistance.

Conflicts of Interest

The authors declare no conflict of interest.

Sample Availability

Samples of the compound 2 are available from the authors.

References

  1. Liu, H.; Lei, Y. A critical review: Recent advances in “digital” biomolecule detection with single copy sensitivity. Biosens. Bioelectron. 2021, 177, 112901. [Google Scholar] [CrossRef]
  2. Yang, X.; Lovell, J.F.; Murthy, N.; Zhang, Y. Topics in Medicinal Chemistry; Springer: Cham, Switzerland, 2020; Volume 34, pp. 33–53. [Google Scholar]
  3. Michel, B.Y.; Dziuba, D.; Benhida, R.; Demchenko, A.P.; Burger, A. Probing of nucleic acid structures, dynamics, and interactions with environment-sensitive fluorescent labels. Front. Chem. 2020, 8, 112. [Google Scholar] [CrossRef] [PubMed] [Green Version]
  4. Barnoy, E.A.; Popovtzer, R.; Fiixler, D. Fluorescence for biological logic gates. J. Biophotonics 2020, 13, e202000158. [Google Scholar] [CrossRef]
  5. Smith, S.J.; Nemr, C.R.; Kelley, S.O. Chemistry-driven approaches for ultrasensitive nucleic acid detection. J. Am. Chem. Soc. 2017, 139, 1020–1028. [Google Scholar] [CrossRef]
  6. Wiraja, C.; Yeo, D.C.; Lio, D.C.S.; Zheng, M.; Xu, C. Functional imaging with nucleic-acid-based sensors: Technology, application and future healthcare prospects. ChemBioChem 2019, 20, 437–450. [Google Scholar] [CrossRef]
  7. Yuan, J.-H.; Shao, W.; Chen, S.-B.; Huang, Z.-S.; Tan, J.-H. Recent advances in fluorescent probes for G-quadruplex nucleic acids. Biochem. Biophys. Res. Commun. 2020, 531, 18–24. [Google Scholar] [CrossRef]
  8. Suseela, Y.V.; Narayanaswamy, N.; Pratihar, S.; Govindaraju, T. Far-red fluorescent probes for canonical and non-canonical nucleic acid structures: Current progress and future implications. Chem. Soc. Rev. 2018, 47, 1098–1131. [Google Scholar] [CrossRef]
  9. Tateishi-Karimata, H.; Sugimoto, N. Chemical biology of non-canonical structures of nucleic acids for therapeutic applications. Chem. Commun. 2020, 56, 2379–2390. [Google Scholar] [CrossRef] [PubMed]
  10. Mathad, R.I.; Hatzakis, E.; Dai, J.; Yang, D. c-MYC promoter G-quadruplex formed at the 5′-end of NHE III1 element: Insights into biological relevance and parallel-stranded G-quadruplex stability. Nucleic Acids Res. 2011, 39, 9023–9033. [Google Scholar] [CrossRef]
  11. Rankin, S.; Reszka, A.P.; Huppert, J.; Zloh, M.; Parkinson, G.N.; Todd, A.K.; Ladame, S.; Balasubramanian, S.; Neidle, S. Putative DNA quadruplex formation within the human c-kit oncogene. J. Am. Chem. Soc. 2005, 127, 10584–10589. [Google Scholar] [CrossRef] [PubMed] [Green Version]
  12. Gatto, B.; Palumbo, M.; Sissi, C. Nucleic acid aptamers based on the G-quadruplex structure: Therapeutic and diagnostic potential. Curr. Med. Chem. 2009, 16, 1248–1265. [Google Scholar] [CrossRef]
  13. Rhodes, D.; Lipps, H.J. G-quadruplexes and their regulatory roles in biology. Nucleic Acids Res. 2015, 43, 8627–8637. [Google Scholar] [CrossRef] [Green Version]
  14. Varshney, D.; Spiegel, J.; Zyner, K.; Tannahill, D.; Balasubramanian, S. The regulation and functions of DNA and RNA G-quadruplexes. Nat. Rev. Mol. Cell Biol. 2020, 21, 459–474. [Google Scholar] [CrossRef] [PubMed]
  15. Kumari, B.; Yadav, A.; Pany, S.P.; Pradeepkumar, P.I.; Kanvah, S. Cationic red emitting fluorophore: A light up NIR fluorescent probe for G4-DNA. J. Photochem. Photobiol. B 2019, 190, 128–136. [Google Scholar] [CrossRef]
  16. Zhai, Q.; Gao, C.; Ding, J.; Zhang, Y.; Islam, B.; Lan, W.; Hou, H.; Deng, H.; Li, J.; Hu, Z.; et al. Selective recognition of c-MYC Pu22 G-quadruplex by a fluorescent probe. Nucleic Acids Res. 2019, 47, 2190–2204. [Google Scholar] [CrossRef] [Green Version]
  17. Karg, B.; Funke, A.; Ficht, A.; Sievers-Engler, A.; Lämmerhofer, M.; Weisz, K. Molecular recognition and visual detection of G-quadruplexes by a dicarbocyanine dye. Chem. Eur. J. 2015, 21, 13802–13811. [Google Scholar] [CrossRef]
  18. Yang, P.; De, C.A.; Teulade-Fichou, M.P.; Mergny, J.L.; Monchaud, D. Engineering bisquinolinium/thiazole orange conjugates for fluorescent sensing of G-quadruplex DNA. Angew. Chem. Int. Ed. 2009, 48, 2188–2191. [Google Scholar] [CrossRef]
  19. Xie, X.; Choi, B.; Largy, E.; Guillot, R.; Granzhan, A.; Teulade-Fichou, M.P. Asymmetric distyrylpyridinium dyes as red-emitting fluorescent probes for quadruplex DNA. Chem. Eur. J. 2013, 19, 1214–1226. [Google Scholar] [CrossRef]
  20. Zhang, L.; Liu, X.; Lu, S.; Liu, J.; Zhong, S.; Wei, Y.; Bing, T.; Zhang, N.; Shangguan, D. Thiazole orange styryl derivatives as fluorescent probes for G-quadruplex DNA. ACS Appl. Bio Mater. 2020, 3, 2643–2650. [Google Scholar] [CrossRef]
  21. Das, A.K.; Druzhinin, S.I.; Ihmels, H.; Müller, M.; Schönherr, H. Colorimetric and fluorimetric dna detection with a hydroxystyryl–quinolizinium photoacid and its application for cell imaging. Chem. Eur. J. 2019, 25, 12703–12707. [Google Scholar] [CrossRef] [PubMed] [Green Version]
  22. Das, A.K.; Ihmels, H.; Kölsch, S. Diphenylaminostyryl-substituted quinolizinium derivatives as fluorescent light-up probes for duplex and quadruplex DNA. Photochem. Photobiol. Sci. 2019, 18, 1373–1381. [Google Scholar] [CrossRef] [Green Version]
  23. Bhadra, K.; Kumar, G.S. Interaction of berberine, palmatine, coralyne, and sanguinarine to quadruplex DNA: A comparative spectroscopic and calorimetric study. Biochim. Biophys. Acta. 2011, 1810, 485–496. [Google Scholar] [CrossRef]
  24. Umar, M.I.; Ji, D.; Chan, C.-Y.; Kwok, C.K. G-quadruplex-based fluorescent turn-on ligands and aptamers: From development to applications. Molecules 2019, 24, 2416. [Google Scholar] [CrossRef] [PubMed] [Green Version]
  25. Monchaud, D. Chapter Five–Quadruplex detection in human cells. Annu. Rep. Med. Chem. 2020, 54, 133–160. [Google Scholar]
  26. Di Antonio, M.; Ponjavic, A.; Radzevičius, A.; Ranasinghe, R.T.; Catalano, M.; Zhang, X.; Shen, J.; Needham, L.-M.; Lee, S.F.; Klenerman, D.; et al. Single-molecule visualization of DNA G-quadruplex formation in live cells. Nat. Chem. 2020, 12, 832–837. [Google Scholar] [CrossRef] [PubMed]
  27. Xu, W.; Chan, M.K.; Kool, E.T. Fluorescent nucleobases as tools for studying DNA and RNA. Nature Chem. Rev. 2017, 9, 1043–1055. [Google Scholar] [CrossRef] [Green Version]
  28. Bhadra, K.; Kumar, G.S. Therapeutic potential of nucleic acid-binding isoquinoline alkaloids: Binding aspects and implications for drug design. Med. Res. Rev. 2011, 31, 821–862. [Google Scholar] [CrossRef]
  29. Becher, J.; Berdnikova, D.V.; Ihmels, H.; Stremmel, C. Synthesis and investigation of quadruplex-DNA-binding, 9-O-substituted berberine derivatives. Beilstein J. Org. Chem. 2020, 16, 2795–2806. [Google Scholar] [CrossRef]
  30. Pithan, P.M.; Decker, D.; Druzhinin, S.I.; Ihmels, H.; Schönherr, H.; Voß, Y. 8-Styryl-substituted coralyne derivatives as DNA binding fluorescent probes. RSC Adv. 2017, 7, 10660–10667. [Google Scholar] [CrossRef] [Green Version]
  31. Xu, L.; Hong, S.; Sun, N.; Wang, K.; Zhou, L.; Ji, L.; Pei, R. Berberine as a novel light-up i-motif fluorescence ligand and its application in designing molecular logic systems. Chem. Commun. 2016, 52, 179–182. [Google Scholar] [CrossRef]
  32. Zhou, C.-Q.; Yang, J.-W.; Dong, C.; Wang, Y.-M.; Sun, B.; Chen, J.-X.; Xu, Y.-S.; Chen, W.-H. Highly selective, sensitive and fluorescent sensing of dimeric G-quadruplexes by a dimeric berberine. Org. Biomol. Chem. 2016, 14, 191–197. [Google Scholar] [CrossRef]
  33. Duval, R.; Duplais, C. Fluorescent natural products as probes and tracersin biology. Nat. Prod. Rep. 2017, 34, 161–193. [Google Scholar] [CrossRef]
  34. Pang, B.; Zhao, L.-H.; Zhou, Q.; Zhao, T.-Y.; Wang, H.; Gu, C.-J.; Tong, X.-L.; Lee, H.C. Application of berberine on treating type 2 diabetes mellitus. Int. J. Endocrinol. 2015, 905749. [Google Scholar] [CrossRef] [PubMed] [Green Version]
  35. Gentry, E.J.; Jampani, H.B.; Keshavarz-Shokri, A.; Morton, M.D.; Velde, D.V.; Telikepalli, H.; Mitscher, L.; Shawar, R.; Humble, D.; Baker, W. Antitubercular natural products: Berberine from the roots of commercial Hydrastis canadensis powder. Isolation of inactive 8-oxotetrahydrothalifendine, canadine, beta-hydrastine, and two new quinic acid esters, hycandinic acid esters-1 and -2. J. Nat. Prod. 1998, 61, 1187–1193. [Google Scholar] [CrossRef]
  36. Yu, M.; Jin, X.; Liang, C.; Bu, F.; Pan, D.; He, Q.; Ming, Y.; Little, P.; Du, H.; Liang, S.; et al. Berberine for diarrhea in children and adults: A systematic review and meta-analysis. Ther. Adv. Gastroenterol. 2020, 13, 175628482096129. [Google Scholar] [CrossRef]
  37. Feng, X.; Sureda, A.; Jafari, S.; Memariani, Z.; Tewari, D.; Annunziata, G.; Barrea, L.; Hassan, S.T.S.; Šmejkal, K.; Malaník, M.; et al. Berberine in cardiovascular and metabolic diseases: From mechanisms to therapeutics. Theranostics 2019, 9, 1923–1951. [Google Scholar] [CrossRef] [PubMed]
  38. Islam, M.M.; Basu, A.; Hossain, M.; Sureshkumar, G.; Hotha, S.; Kumar, G.S. Enhanced DNA binding of 9-ω-amino alkyl ether analogs from the plant alkaloid berberine. DNA Cell Biol. 2011, 30, 123–133. [Google Scholar] [CrossRef]
  39. Gumenyuk, V.G.; Bashmakova, N.V.; Kutovyy, S.Y.; Yashchuk, V.M.; Zaika, L.A. Binding parameters of alkaloids berberine and sanguinarine with DNA. Ukr. J. Phys. 2011, 56, 524–533. [Google Scholar]
  40. Kundu, N.; Roy, A.; Banik, D.; Sarkar, N. Unveiling the mode of interaction of berberine alkaloid in different supramolecular confined environments: Interplay of surface charge between nano-confined charged layer and DNA. J. Phys. Chem. B 2016, 120, 1106–1120. [Google Scholar] [CrossRef]
  41. Díaz, M.S.; Freile, M.L.; Gutiérrez, M.I. Solvent effect on the UV/Vis absorption and fluorescence spectroscopic properties of berberine. Photochem. Photobiol. Sci. 2009, 8, 970–974. [Google Scholar] [CrossRef]
  42. Kostjukova, L.O.; Kostjukov, V.V. The electronic states and vibronic absorption spectrum of berberine in aqueous solution. Int. J. Quantum. Chem. 2020, 121, e26537. [Google Scholar] [CrossRef]
  43. Auffinger, P.; Bielecki, L.; Westhof, E. Anion binding to nucleic acids. Structure 2004, 12, 379–388. [Google Scholar] [CrossRef]
  44. Rypniewski, W.; Adamiak, D.A.; Milecki, J.; Adamiak, R.W. Noncanonical G(syn)–G(anti) base pairs stabilized by sulphate anions in two X-ray structures of the (GUGGUCUGAUGAGGCC) RNA duplex. RNA 2008, 14, 1845–1851. [Google Scholar] [CrossRef] [PubMed] [Green Version]
  45. Van der Wijst, T.; Guerra, C.F.; Swart, M.; Bickelhaupt, F.M.; Lippert, B. A Ditopic ion-pair receptor based on stacked nucleobase quartets. Angew. Chem. Int. Ed. 2009, 48, 3285–3287. [Google Scholar] [CrossRef]
  46. van der Wijst, T.; Lippert, B.; Swart, M.; Guerra, C.F.; Bickelhaupt, F.M. Differential stabilization of adenine quartets by anions and cations. J. Biol. Inorg. Chem. 2010, 15, 387–397. [Google Scholar] [CrossRef] [PubMed] [Green Version]
  47. Kawai, K.; Osakada, Y.; Fujitsuka, M.; Majima, T. Hole transfer in DNA and photosensitized DNA damage:  Importance of adenine oxidation. J. Phys. Chem. B 2007, 111, 2322–2326. [Google Scholar] [CrossRef]
  48. Takada, T.; Kawai, K.; Tojo, S.; Majima, T. Effects of interaction of photosensitizer with DNA and stacked G bases on photosensitized one-electron oxidation of DNA. J. Phys. Chem. B 2004, 108, 761–766. [Google Scholar] [CrossRef]
  49. Kumar, G.S.; He, Q.-H.; Behr-Ventura, D.; Tomasz, M. Binding of 2,7-diaminomitosene to DNA: Model for the recognition of DNA by activated mitomycin C. Biochemistry 1995, 34, 2662–2671. [Google Scholar] [CrossRef]
  50. Takenaka, S.; Ihara, T.; Hamano, M.; Takagi, M. A zwitterionic anthraquinone derivative: First zwitterionic DNA binding ligand. J. Chem. Soc. Chem. Commun. 1990, 18, 1271–1273. [Google Scholar] [CrossRef]
  51. Nicoludis, J.M.; Miller, S.T.; Jeffrey, P.D.; Barrett, S.P.; Rablen, P.R.; Lawton, T.J.; Yatsunyk, L.A. Optimized end-stacking provides specificity of N-Methyl mesoporphyrin IX for human telomeric G-quadruplex DNA. J. Am. Chem. Soc. 2012, 134, 20446–20456. [Google Scholar] [CrossRef]
  52. Nasab, M.G.; Hassani, L.; Nejad, S.M.; Norouzi, D. Interaction of hemin with quadruplex DNA. J. Biol. Phys. 2017, 43, 5–14. [Google Scholar] [CrossRef] [Green Version]
  53. Yaku, H.; Murashima, T.; Miyoshi, D.; Sugimoto, N. Anionic phthalocyanines targeting G-quadruplexes and inhibiting telomerase activity in the presence of excessive DNA duplexes. Chem. Commun. 2010, 46, 5740–5742. [Google Scholar] [CrossRef]
  54. Yaku, H.; Murashima, T.; Miyoshi, D.; Sugimoto, N. Specific binding of anionic porphyrin and phthalocyanine to the G-quadruplex with a variety of in vitro and in vivo applications. Molecules 2012, 17, 10586–10613. [Google Scholar] [CrossRef]
  55. Luo, X.-J.; Qin, Q.-P.; Huang, K.-B.; Liu, Y.-C.; Liang, H. Spectroscopic studies on the interaction of hemin with human telomeric G-quadruplex DNA. Asian J. Chem. 2013, 25, 6396–6400. [Google Scholar] [CrossRef]
  56. Uchiyama, M.; Momotake, A.; Kobayashi, N.; Yamamoto, Y. Specific binding of an anionic phthalocyanine derivative to G-quadruplex DNAs. Chem. Lett. 2020, 49, 530–533. [Google Scholar] [CrossRef]
  57. Grabowski, Z.R.; Rotkiewicz, K.; Rettig, W. Structural changes accompanying intramolecular electron transfer:  Focus on twisted intramolecular charge-transfer states and structures. Chem. Rev. 2003, 10, 3899–4032. [Google Scholar] [CrossRef]
  58. Mataga, N.; Kaifu, Y.; Koizumi, M. Solvent effects upon fluorescence spectra and the dipolemoments of excited molecules. Bull. Chem. Soc. Jpn. 1956, 29, 465–470. [Google Scholar] [CrossRef] [Green Version]
  59. Rurack, K.; Spieles, M. Fluorescence quantum yields of a series of red and near-infrared dyes emitting at 600−1000 nm. Anal. Chem. 2011, 83, 1232–1242. [Google Scholar] [CrossRef] [PubMed]
  60. Andrussow, L.; Schramm, B. Eigenschaften der Materie in ihren Aggregatzuständen; Transportphänomene I (Viskosität und Diffusion); Schäfer, K., Ed.; Springer: Berlin/Heidelberg, Germany, 1969. [Google Scholar]
  61. Paez, S.; Contreras, M. Densities and viscosities of binary mixtures of 1-propanol and 2-propanol with acetonitrile. J. Chem. Eng. Data 1989, 34, 455–459. [Google Scholar] [CrossRef]
  62. Stootman, F.H.; Fisher, D.M.; Rodger, A.; Aldrich-Wright, J.R. Improved curve fitting procedures to determine equilibrium binding constants. Analyst 2006, 131, 1145–1151. [Google Scholar] [CrossRef]
  63. De Cian, A.; Guittat, L.; Kaiser, M.; Saccà, B.; Amrane, S.; Bourdoncle, A.; Alberti, P.; Teulade-Fichou, M.-P.; Lacroix, L.; Mergny, J.-L. Fluorescence-based melting assays for studying quadruplex ligands. Methods 2007, 42, 183–195. [Google Scholar] [CrossRef]
  64. Nordén, B.; Rodger, A.; Dafforn, T. Linear Dichroism and Circular Dichroism. A Textbook on Polarized-Light Spectroscopy; RSC: Cambridge, UK, 2010. [Google Scholar]
  65. Šmidlehner, T.; Piantanida, I.; Pescitelli, G. Polarization spectroscopy methods in the determination of interactions of small molecules with nucleic acids–Tutorial. Beilstein J. Org. Chem. 2018, 14, 84–105. [Google Scholar] [CrossRef] [PubMed]
  66. Nordén, B.; Kurucsev, T. Analysing DNA complexes by circular and linear dichroism. J. Mol. Recognit. 1994, 7, 141–155. [Google Scholar] [CrossRef]
  67. Ferraroni, M.; Bazzicalupi, C.; Bilia, A.R.; Gratter, P. X-Ray diffraction analyses of the natural isoquinoline alkaloids Berberine and Sanguinarine complexed with double helix DNA d(CGTACG). Chem. Comm. 2011, 47, 4917–4919. [Google Scholar] [CrossRef] [PubMed]
  68. Nandi, R.; Debnath, D.; Maiti, M. Interactions of berberine with poly(A) and tRNA. Biochim. Biophys. Acta 1990, 1049, 339–342. [Google Scholar] [CrossRef]
  69. Dzubiel, D.; Ihmels, H.; Mahmoud, M.M.A.; Thomas, L. A comparative study of the interactions of cationic hetarenes with quadruplex-DNA forming oligonucleotide sequences of the insulin-linked polymorphic region (ILPR). Beilstein J. Org. Chem. 2014, 10, 2963–2974. [Google Scholar] [CrossRef] [PubMed] [Green Version]
  70. Vorlíčková, M.; Kejnovská, I.; Sagi, J.; Renčiuk, D.; Bednářová, K.; Motlová, J.; Kypr, J. Circular dichroism and guanine quadruplexes. Methods 2012, 57, 64–75. [Google Scholar] [CrossRef]
  71. Ihmels, H.; Mahmoud, M.M.A.; Patrick, B.O. Optical differentiation between quadruplex DNA and duplex DNA with a [2.2.2]heptamethinecyanine dye. J. Phys. Org. Chem. 2017, 30, e3736. [Google Scholar] [CrossRef] [Green Version]
  72. Jain, A.K.; Bhattacharya, S. Interaction of G-quadruplexes with nonintercalating duplex-DNA minor groove binding ligands. Bioconjug. Chem. 2011, 22, 2355–2368. [Google Scholar] [CrossRef]
  73. Yamashita, T.; Uno, T.; Ishikawa, Y. Stabilization of guanine quadruplex DNA by the binding of porphyrins with cationic side arms. Bioorg. Med. Chem. 2005, 13, 2423–2430. [Google Scholar] [CrossRef]
  74. Sun, H.; Tang, Y.; Xiang, J.; Xu, G.; Zhang, Y.; Zhang, H.; Xu, L. Spectroscopic studies of the interaction between quercetin and G-quadruplex DNA. Bioorg. Med. Chem. Lett. 2006, 16, 3586–3589. [Google Scholar] [CrossRef]
  75. Bazzicalupi, C.; Ferraroni, M.; Bilia, A.R.; Scheggi, F.; Gratteri, P. The crystal structure of human telomeric DNA complexed with berberine: An interesting case of stacked ligand to G-tetrad ratio higher than 1:1. Nucleic Acids Res. 2012, 41, 632–638. [Google Scholar] [CrossRef]
  76. Catasti, P.; Chen, X.; Moyzis, R.K.; Bradbury, E.M.; Gupta, G. Structure–function correlations of the insulin-linked polymorphic region. J. Mol. Biol. 1996, 264, 534–545. [Google Scholar] [CrossRef]
  77. Xu, Y.; Noguchi, Y.; Sugiyama, H. The new models of the human telomere d[AGGG(TTAGGG)3] in K+ solution. Bioorg. Med. Chem. 2006, 14, 5584–5591. [Google Scholar] [CrossRef]
  78. Phan, A.T.; Kuryavyi, V.; Burge, S.; Neidle, S.; Patel, D.J. Structure of an unprecedented G-quadruplex scaffold in the human c-kit promoter. J. Am. Chem. Soc. 2007, 129, 4386–4392. [Google Scholar] [CrossRef] [Green Version]
  79. Stump, S.; Mou, T.-C.; Sprang, S.R.; Natale, N.R.; Beall, H.D. Crystal structure of the major quadruplex formed in the promoter region of the human c-MYC oncogene. PLoS ONE 2018, 13, e0205584. [Google Scholar] [CrossRef] [PubMed] [Green Version]
  80. Cuervo, A.; Dans, P.D.; Carrascosa, J.L.; Orozco, M.; Gomila, G.; Fumagalli, L. Direct measurement of the dielectric polarization properties of DNA. Proc. Natl. Acad. Sci. USA 2014, 111, E3624–E3630. [Google Scholar] [CrossRef] [Green Version]
  81. Megyesi, M.; Biczók, L.; Jablonkai, I. Highly sensitive fluorescence response to inclusion complex formation of berberine alkaloid with cucurbit[7]uril. J. Phys. Chem. C 2008, 112, 3410–3416. [Google Scholar] [CrossRef]
  82. Le Bras, L.; Chaitou, K.; Aloïse, S.; Adamo, C.; Perrier, A. Aggregation-caused quenchingversuscrystallizationinduced emission in thiazolo[5,4-b]thieno[3,2-e]-pyridine (TTP) derivatives: Theoretical insights. Phys. Chem. Chem. Phys. 2018, 21, 46–56. [Google Scholar] [CrossRef] [PubMed]
  83. Xue, J.; Liang, Q.; Wang, R.; Hou, J.; Li, W.; Peng, Q.; Shuai, Z.; Qiao, J. Highly efficient thermally activated delayed fluorescence via J-aggregates with strong intermolecular charge transfer. Adv. Mater. 2019, 31, e1808242. [Google Scholar] [CrossRef]
  84. Jin, X.; Yan, L.; Li, H.-J.; Wang, R.-L.; Hu, Z.-L.; Jiang, Y.-Y.; Cao, Y.-B.; Yan, T.-H.; Sun, Q.-Y. Novel triazolyl berberine derivatives prepared via CuAAC click chemistry: Synthesis, anticancer activity and structure-activity relationships. Anti Cancer Agents Med. Chem. 2014, 15, 89–98. [Google Scholar] [CrossRef]
  85. Ren, J.; Chaires, J.B. Sequence and structural selectivity of nucleic acid binding ligands. Biochemistry 1999, 38, 16067–16075. [Google Scholar] [CrossRef]
  86. Bortolozzi, R.; Ihmels, H.; Thomas, L.; Tian, M.; Viola, G. 9-(4-Dimethylaminophenyl)-benzo[b]quinolizinium: A Near-Infrared Fluorophore for the Multicolor Analysis of Proteins and Nucleic Acids in Living Cells. Chem. Eur. J. 2013, 19, 8736–8741. [Google Scholar] [CrossRef]
  87. Duskova, K.; Lejault, P.; Benchimol, E.; Guillot, R.; Britton, S.; Granzhan, A.; Monchaud, D. DNA Junction Ligands Trigger DNA Damage and Are Synthetic Lethal with DNA Repair Inhibitors in Cancer Cells. J. Am. Chem. Soc. 2020, 142, 424–435. [Google Scholar] [CrossRef]
Scheme 1. Synthesis of 9-O-Hydrogenphosphonatoberberrubin (2).
Molecules 26 02566 sch001
Figure 1. Emission spectra of 2 (c = 10 µM, with 0.25% v/v DMSO) in glycerol at 20 °C, 30 °C, 40 °C, 50 °C, 60 °C, and 80 °C; λex = 430 nm. The arrows indicate the changes in the emission intensity with increasing temperature. Inset: Plot of the relative emission intensity at 528 nm versus the temperature of the solution.
Molecules 26 02566 g001
Figure 2. Photometric titration of 2 (c = 20 μM) with ct DNA (a) in a BPE buffer (cNa+ = 16 mM, pH 7.0, with 5% v/v DMSO) and with a2 (b) in a K-phosphate buffer (cK+ = 110 mM, pH 7.0, with 5% v/v DMSO). The arrows indicate the changes in absorption upon the addition of DNA. Inset: Plot of the absorption at 345 nm versus DNA concentration.
Molecules 26 02566 g002
Figure 3. CD spectra (a) and LD spectra (b) of ct DNA (cDNA = 20 μM) in the absence and presence of 2 at LDR = 0 (black), 0.05 (cyan), 0.2 (orange), 0.5 (green), 1.0 (magenta), 1.5 (blue), and 2.0 (red) in a BPE buffer solution (10 mM, pH 7.0; with 5% v/v DMSO). The arrows indicate the changes in absorption with increasing LDR.
Molecules 26 02566 g003
Figure 4. CD spectra of a2 (a, cDNA = 20 μM) and c-myc (b, cDNA = 20 μM) in the absence and presence of 2 at LDR = 0 (black), 0.05 (cyan), 0.2 (orange), 0.5 (green), 1.0 (magenta), 1.5 (blue), and 2.0 (red) in a K-phosphate buffer (cK+ = 110 mM, pH 7.0, with 5% v/v DMSO). The arrows indicate the changes in absorption with increasing LDR.
Molecules 26 02566 g004
Figure 5. The proposed association of ligand 2 at the terminal quartet of G4-DNA c-myc and c-kit.
Molecules 26 02566 g005
Figure 6. Fluorimetric titration of 2 (c = 20 μM, λex = 430 nm) with ct DNA (a) in a BPE buffer (cNa+ = 16 mM, pH 7.0, with 5% v/v DMSO) and with a2 (b) in a K-phosphate buffer (cK+ = 110 mM, pH 7.0, with 5% v/v DMSO); λex = 430 nm. The arrows indicate the changes in absorption upon addition of DNA. Inset: Plot of the relative fluorescence intensity versus cDNA; (c) pictures of the emission color of 2 in a K-phosphate buffer (i) and in the presence of ct DNA (ii) and 22AG (iii) (λex = 360 nm).
Molecules 26 02566 g006
Table 1. Absorption and emission properties of derivatives 1a and 2 in different solvents.
Solventλabsa/nmlg ε b λflc/nm νabsνfl d/cm−1Φfle
21a f221a f21a f21a f
MeOH4314293.98558540528047900.010.01
EtOH4314303.98537536458046000.020.03
1-PrOH431 3.94531 4369 0.04
MeCN4314303.91537537457946300.030.02
DMSO4304253.97547553497455000.01<0.01
Buffer424 3.92535 4893 <0.01
a Long-wavelength absorption maximum; c = 20 µM. b ε = Molar extinction coefficient in cm−1 M−1. c Fluorescence emission maximum; λex = 430 nm. d Stokes shift: Energy difference between absorption and emission maximum. e Fluorescence quantum yield relative to coumarin 153 in EtOH (Φfl = 0.544). Ref. [59]. f Ref. [41].
Table 2. Binding constants, Kb, and shifts of DNA melting temperature, ∆Tm, of 2 with ct DNA and G4-DNA, and fluorescence quantum yields, Φfl, of the DNA-bound ligands.
DNAKb/105 M−1 bΦfl cTm/°C d
ct DNA2.2 ± 0.2<0.01
22AG/F21Ta5.0 ± 0.60.013.6
c-kit/FkitTa6.9 ± 0.20.011.0
a2/Fa2Ta6.7 ± 0.20.010.6
c-myc/FmycT a5.9 ± 0.40.012.2
a Dye-labeled oligonucleotides: F21T = fluo-G3(TTAG3)3-tamra, Fa2T = fluo-(ACAG3TGT)2-tamra, FmycT = fluo-TGAG3TG3TAG3TG3TA-tamra, FkitT = fluo-AG3AG3CGCTG3AG2AG3-tamra, fluo = fluorescein, tamra = tetramethylrhodamine b Determined from photometric titrations (cf. Figure S5). c Fluorescence quantum yield relative to coumarin 153 in EtOH (Φfl = 0.544, Ref. [59]). d Determined from fluorimetric analysis of dye-labeled oligonucleotides, LDR = 5; cDNA = 0.2 mM (in oligonucleotides); KCl–LiCl–cacodylat buffer cK+ = 10 mM, cNa+ = 10 mM, cLi+ = 90 mM, pH 7.0) λex = 470 nm; λem = 515 nm; estimated error: ±0.5 °C.
Publisher’s Note: MDPI stays neutral with regard to jurisdictional claims in published maps and institutional affiliations.

