
Process Development for the Detoxification of Fermentation Inhibitors from Acid Pretreated Microalgae Hydrolysate

Abstract
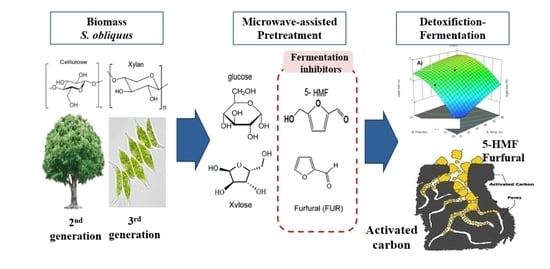
1. Introduction
2. Results and Discussion
2.1. Composition Analysis
2.2. Model Fitting
2.3. Perturbation Curves
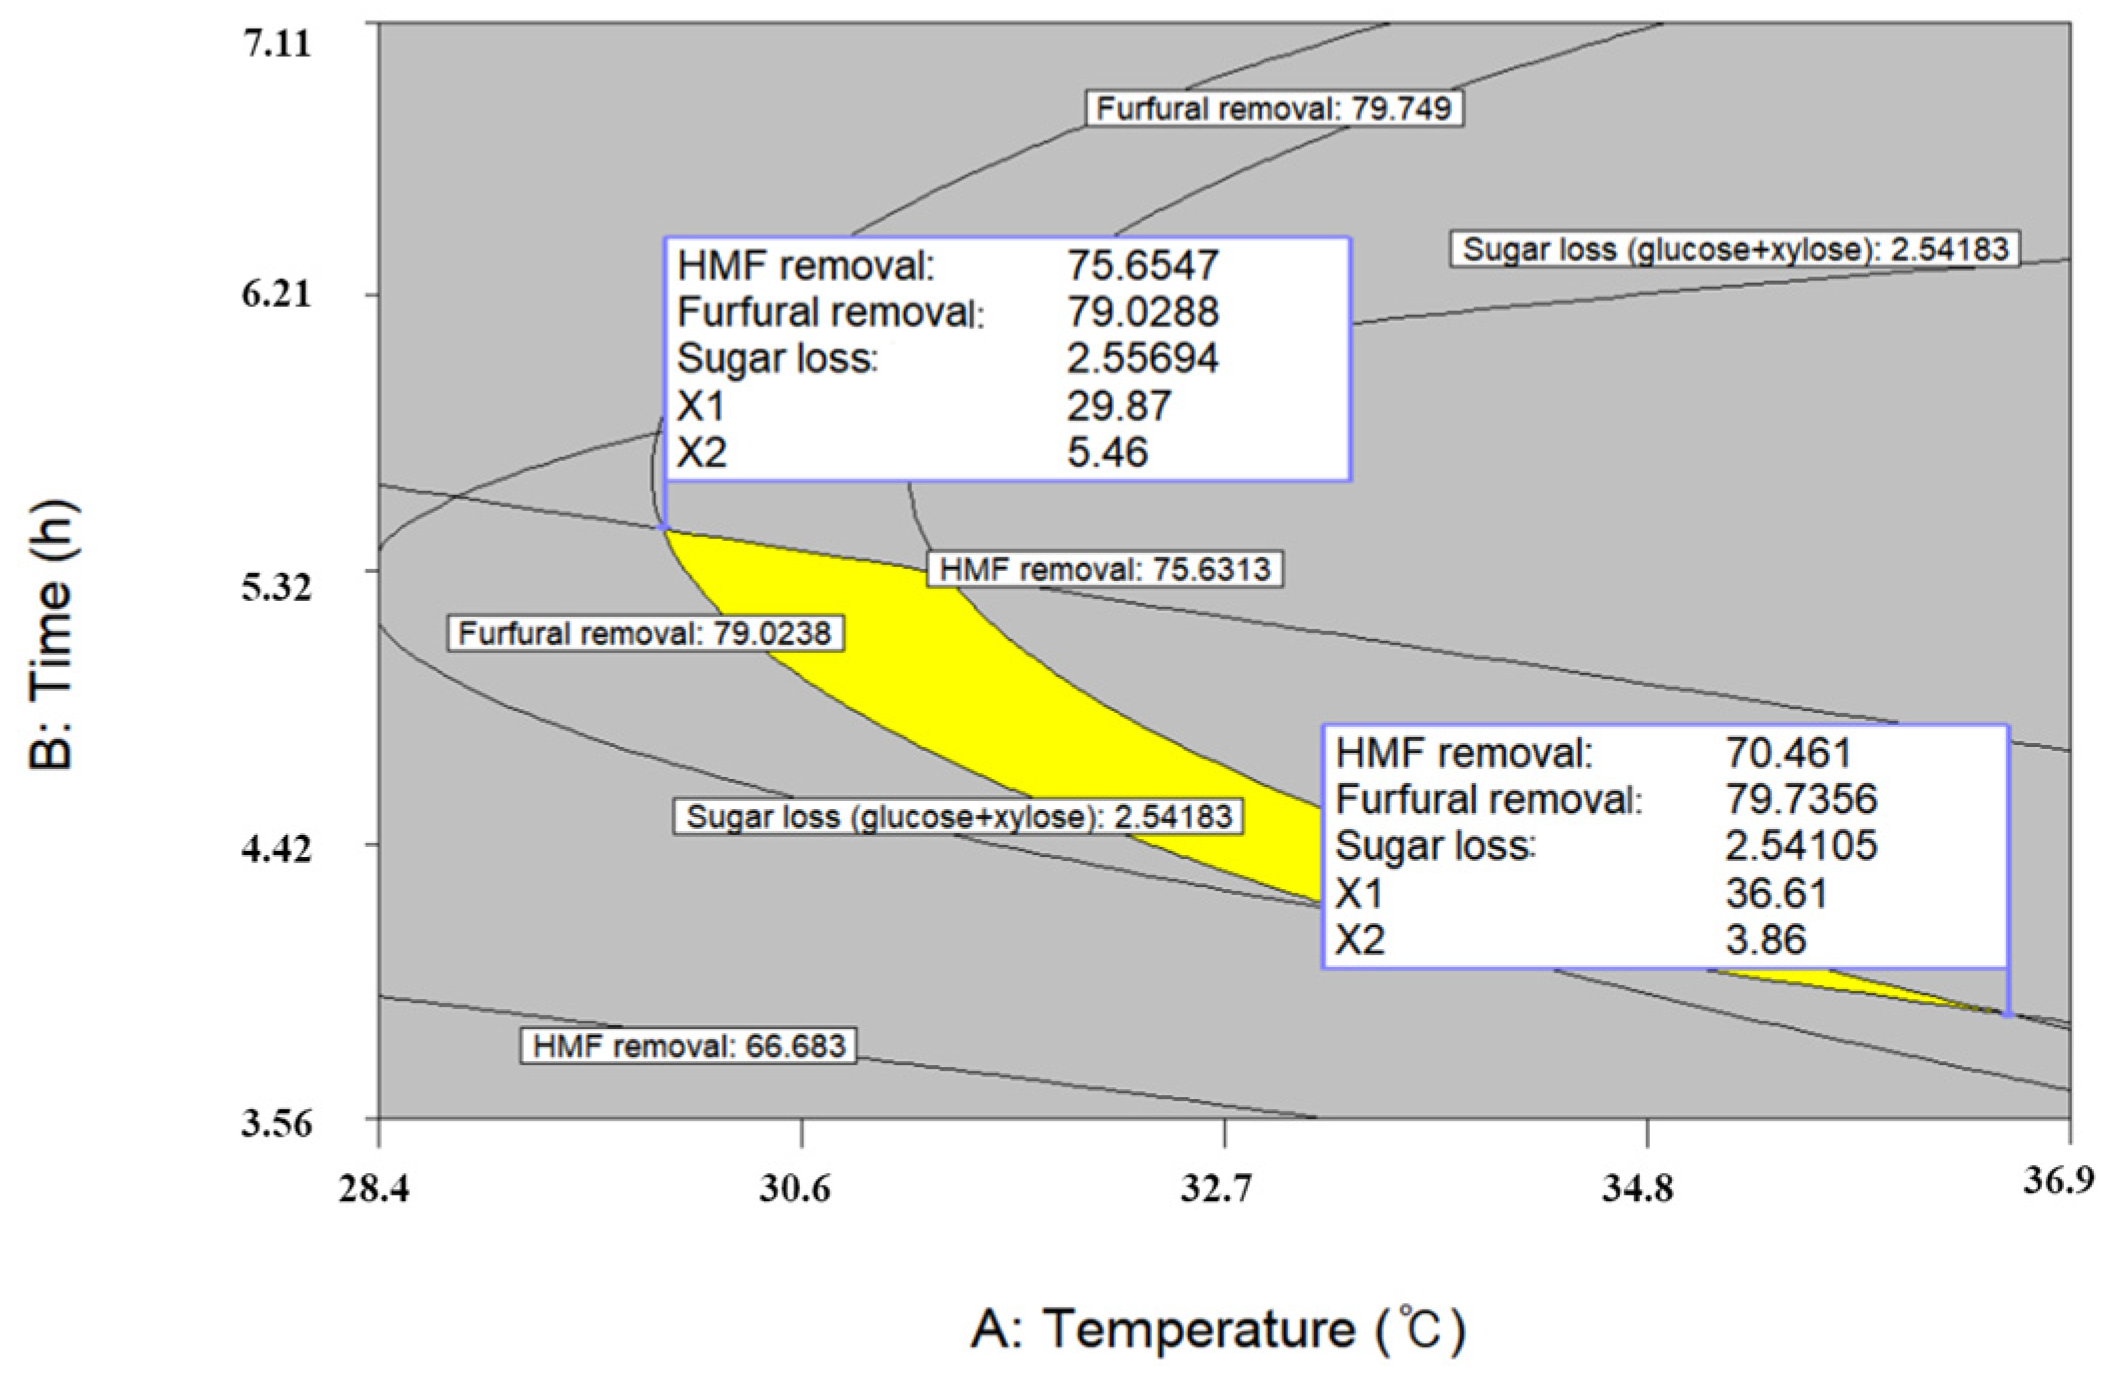
2.4. Maximizing 5-HMF and Furfural Removal
2.5. Minimization of Sugar Loss
2.6. Optimal Conditions for Detoxification
2.7. Ethanol Fermentation
3. Materials and Methods
3.1. Microalgae Strain and Cultivation Conditions
3.2. Composition Determination
3.3. Microwave-Assisted Pretreatment (MAP)
3.4. Experimental Design
3.5. Microorganism
3.6. Fermentation
3.7. Analysis Using GC and HPLC
4. Conclusions
Author Contributions
Funding
Institutional Review Board Statement
Informed Consent Statement
Data Availability Statement
Conflicts of Interest
Sample Availability
References
- Acharya, R.N.; Perez-Pena, R. Role of comparative advantage in biofuel policy adoption in Latin America. Sustainability 2020, 12, 1411. [Google Scholar] [CrossRef]
- Choi, H.Y.; Kim, J.H.; Pak, D.W. Comparison of pretreatment of fallen leaves for application evaluation by bio-ethanol raw material. KSEE 2014, 23, 251–256. [Google Scholar]
- Sunwoo, I.Y.; Ra, C.H.; Kwon, S.J.; Heo, J.H.; Kim, Y.J.; Kim, J.W.; Shin, J.H.; Ahn, E.J.; Cho, Y.K.; Kim, S.K. Ethanol production from red, brown and green seaweeds and biosorption of heavy metals by waste seaweed slurry from ethanol production. KSBB J. 2014, 29, 414–420. [Google Scholar] [CrossRef][Green Version]
- Lee, S.M.; Choi, I.S.; Kim, S.K.; Lee, J.H. Production of bio-ethanol from brown algae by enzymic hydrolysis. KSBB J. 2009, 24, 483–488. [Google Scholar]
- Shin, H.J.; Park, J.H.; Jung, W.K.; Cho, H.; Kim, S.W. Development of biorefinery process using microalgae. J. Korean Soc. Precis. Eng. 2011, 28, 154–167. [Google Scholar]
- Suarez Ruiz, C.A.; Baca, S.Z.; van den Broek, L.A.; van den Berg, C.; Wijffels, R.H.; Eppink, M.H.M. Selective fractionation of free glucose and starch from microalgae using aqueous two-phase systems. Algal Res. 2020, 46, 101801. [Google Scholar] [CrossRef]
- Lee, J.S.; Park, S.J.; Kim, J.O. Optimizing coagulation conditions of magnetic based ballast using response surface methodology. J. Korean Soc. Environ. Eng. 2017, 39, 689–697. [Google Scholar] [CrossRef]
- Park, Y.C.; Kim, J.S. Pretreatment of helianthus tuberosus residue by two-stage flow through process. Korean Chem. Eng. Res. 2015, 53, 417–424. [Google Scholar] [CrossRef]
- Yu, K.L.; Chen, W.H.; Sheen, H.K.; Ghang, J.S.; Lin, G.S.; Ong, H.G.; Show, P.L.; Ling, T.G. Bioethanol production from acid pretreated microalgal hydrolysate using microwave-assisted heating wet torrefaction. Fuel 2020, 279, 118435. [Google Scholar] [CrossRef]
- Ra, C.H.; Sunwoo, I.Y.; Kim, S.K. Bioethanol production from macroalgal biomass. J. Life Sci. Res. 2016, 26, 976–982. [Google Scholar] [CrossRef][Green Version]
- El-Dalatony, M.M.; Salama, E.S.; Kurade, M.B.; Hassan, S.H.A.; Oh, S.E.; Kim, S.J.; Jeon, B.H. Utilization of microalgal biofractions for bioethanol, higher alcohols, and biodiesel production: A review. Energies 2017, 10, 2110. [Google Scholar] [CrossRef]
- Choi, G.W.; Han, M.H.; Kim, Y. Development of glucoamylase & simultaneous saccharification and fermentation process for high-yield bioethanol. KSBB J. 2008, 23, 499–503. [Google Scholar]
- Cho, D.H.; Kim, Y.H. Evaluation of biological and physico-chemical detoxification methods for the removal of inhibitors in lignocellulose hydrolysate. KSBB J. 2009, 24, 415–419. [Google Scholar]
- Park, J.H.; Kim, J.S. Two-step acid hydrolysis method for producing fermentable sugar from lignocellulosic biomass. Korean Chem. Eng. Res. 2016, 54, 1–5. [Google Scholar] [CrossRef]
- Woo, S.H.; Kim, W.S.; Joo, H.J. CO2 adsorption rates and surface analysis of activated carbons. JKAIS 2008, 11, 411–414. [Google Scholar]
- Lee, S.W.; Bae, S.K.; Kwon, J.H.; Na, Y.S.; An, C.D.; Yoon, Y.S.; Song, S.K. Correlations between pore structure of activated carbon and adsorption characteristics of acetone vapor. J. Korean Soc. Environ. Eng. 2005, 27, 620–625. [Google Scholar]
- Kim, H.I.; Lee, M.E.; Kang, S.T.; Chung, J. Thermodynamic analysis of phenol adsorption by powdered activated carbon. J. Korean Soc. Environ. Eng. 2013, 35, 220–225. [Google Scholar] [CrossRef]
- Lee, Y.N.; Lee, S.B.; Lee, J.D. Characteristics of Lignin Removal in Cellulosic Ethanol Production Process. Appl. Chem. Eng. 2011, 1, 77–80. [Google Scholar]
- Alamabad, Z.S.; Pirkharrati, H.; Asadzadeh, F.; Kakelar, M.M. Application of response surface methodology for optimization of zinc elimination from a polluted soil using tartaric acid. Adsorpt. Sci. Technol. 2020, 38, 79–93. [Google Scholar] [CrossRef]
- Jeong, H.S.; Kim, Y.S.; Lee, J.J.; Chea, K.S.; Ahn, B.J.; Lee, S.M. Removal of 5-hydroxymethylfurfural and furfural in sugar hydrolysate by wood charcoal treatment. J. Korean Wood Sci. Technol. 2016, 44, 705–715. [Google Scholar] [CrossRef][Green Version]
- Sarawan, C.; Suinyuy, T.N.; Sewsynker-Sukai, Y.; Kana, E.B.G. Optimized activated charcoal detoxification of acid-pretreated lignocellulosic substrate and assessment for bioethanol production. Bioresour. Technol. 2019, 286, 121403. [Google Scholar] [CrossRef] [PubMed]
- Sadhukhan, B.; Mondal, N.K.; Chattoraj, S. Optimisation using central composite design (CCD) and the desirability function for sorption of methylene blue from aqueous solution onto Lemna major. Karbala Int. J. Mod. Sci. 2016, 2, 145–155. [Google Scholar] [CrossRef]
- Oh, S.J.; Rheem, S.S.; Sim, J.H.; Kim, S.K.; Baek, Y.G. Optimizing conditions for the growth of Lactobacillus casei YIT 9018 in tryptone-yeast extract-glucose medium by using response surface methodology. Appl. Environ. Micro. 1995, 61, 3809–3814. [Google Scholar] [CrossRef]
- Lee, M.G.; Cho, D.H.; Kim, Y.H.; Lee, J.W.; Lee, J.H.; Lee, S.W.; Cho, J.H.; Lee, D.H.; Kim, S.Y.; Park, C.H. Effect of biomass-derived inhibitors on ethanol production. KSBB J. 2009, 24, 439–445. [Google Scholar]
- Almeida, J.R.M.; Modig, T.; Petersson, A.; Hähn-Hägerdal, B.; Lidén, G.; Gorwa-Grauslund, M.F. Increased tolerance and conversion of inhibitors in lignocellulosic hydrolysates by Saccharomyces cerevisiae. J. Chem. Technol. Biotechnol. 2007, 82, 340–349. [Google Scholar] [CrossRef]
- Rahdar, S.; Taghavi, M.; Khaksefdi, R.; Ahmad, S. Adsorption of arsenic (V) from aqueous solution using modifed saxaulash: Isotherm and thermodynamic study. App. Water Sci. 2019, 9, 87. [Google Scholar] [CrossRef]
- Lee, J.J. Study on adsorption kinetic of amaranth dye on activated carbon. Clean Technol. 2011, 17, 97–102. [Google Scholar]
- Kamal, S.M.M.; Mohamad, N.L.; Abdullah, A.G.L.; Abdullah, N. Detoxification of sago trunk hydrolysate using activated charcoal for xylitol production. Procedia. Food Sci. 2011, 1, 908–913. [Google Scholar] [CrossRef][Green Version]
- Lee, N.R.; Lee, G.Y. Research on desorption and stability of benzene, toluene, acetone and n-hexane of activated carbon acquired from domestic market. J. Korean Soc. Occup. Environ. Hyg. 2014, 24, 353–358. [Google Scholar] [CrossRef][Green Version]
- Jang, S.; Lee, A.Y.; Lee, A.R.; Choi, G.; Kim, H.K. Optimization of ultrasound-assisted extraction of glycyrrhizic acid from licorice using response surface methodology. Int. Med. Res. 2017, 6, 388–394. [Google Scholar] [CrossRef]
- Aksu, Z.; Kabasakal, E. Batch adsorption of 2,4-dichlorophenoxy-acetic acid (2,4-D) from aqueous solution by granular activated carbon. Sep. Purif. Technol. 2004, 35, 223–240. [Google Scholar] [CrossRef]
- Sluiter, A.; Hames, B.; Ruiz, R.; Scarlata, C.; Sluiter, J.; Templeton, D.; Crocker, D. Determination of Structural Carbohydrates and Lignin in Biomass. Natl. Renew. Energy Lab. 2005. Available online: https://www.researchgate.net/profile/Tuomas-Mattila/publication/263710727_Production_of_manganese_peroxidase_and_laccase_in_a_solid-state_bioreactor_and_modeling_of_enzyme_production_kinetics/links/5640a5e908ae24cd3e408d08/Production-of-manganese-peroxidase-and-laccase-in-a-solid-state-bioreactor-and-modeling-of-enzyme-production-kinetics.pdf (accessed on 22 April 2021).
- Gao, X.; Kumar, R.; Wyman, C.E. Fast hemicellulose quantification via a simple one-step acid hydrolysis. Biotechnol. Bioeng. 2014, 111, 1088–1096. [Google Scholar] [CrossRef] [PubMed]
- Galdeano, M.C.; Mali, S.; Grossmann, M.V.E.; Yamashita, F.; García, M.A. Effects of plasticizers on the properties of oat starch films. Mater. Sci. Eng. 2009, 29, 532–538. [Google Scholar] [CrossRef]
- Rimamcwe, K.B.; Chavan, U.D. Antioxidant Activity and Nutritional Value of Roselle Seeds Flour. Int. J. Curr. Micro. App. Sci. 2017, 6, 2654–2663. [Google Scholar]
- Behera, S.K.; Meena, H.; Chakraborty, S.; Meikap, B.C. Application of response surface methodology (RSM) for optimization of leaching parameters for ash reduction from low-grade coal. Int. J. Min. Sci. Technol. 2018, 28, 621–629. [Google Scholar] [CrossRef]


| Components | S.obliquus * (g/100 g Dry Weight) | APH ** (g/L) | Conversion Rate *** (%) |
|---|---|---|---|
| Cellulose Starch | 30.8 13.8 | 38.1 (glucose) | 77.8 |
| Hemicellulose | 4.9 | 3.3 (xylose) | 61.7 |
| Lignin | 1.9 | - | - |
| Protein Ash | 15.5 14.2 | - - | - - |
| Lipid 5-HMF Furfural | 9.7 - - | - 1.17 0.55 | - 2.51 6.94 |
| Dry Weight (%) | |||
|---|---|---|---|
| Cellulose | Hemicellulose | Lignin | |
| Corn stover | 37.5 | 22.4 | 17.6 |
| Corn cob | 45.0 | 35.0 | 12.0 |
| Corn fiber | 14.3 | 16.8 | 8.4 |
| Barley straw | 41.6 | 19.6 | 17.7 |
| Rice straw | 35.0 | 25.0 | 12.0 |
| Wheat straw | 38.2 | 21.2 | 23.4 |
| Sugarcane bagasse | 40.0 | 24.0 | 25.0 |
| Switchgrass | 31.0 | 20.4 | 17.6 |
| Pine tree | 46.4 | 8.8 | 29.4 |
| Poplar | 49.9 | 17.4 | 18.1 |
| Variables | Coded and Actual Levels | |||||
|---|---|---|---|---|---|---|
| −1.68 | −1 | 0 | +1 | +1.68 | ||
| X1 | Temperature (°C) | 16.5 | 25.0 | 37.5 | 50 | 58.5 |
| X2 | Time (h) | 0.5 | 1.5 | 3.0 | 4.5 | 5.5 |
| X3 | 1 S-L ratio (w/v%) | 0.6 | 2.0 | 4.0 | 6.0 | 7.4 |
| Responses | Second-Order Polynomials | R2 | P |
|---|---|---|---|
| 5-HMF removal | Y1 = 70.180 + 6.43X1 + 8.15X2 + 20.792X3 + 0.2697X1X2 − 1.25X1X3 + 0.1547X2X3 − 0.7983X12 − 1.40X22 − 5.25X32 | 0.9727 | 0.0001 |
| Furfural removal | Y2 = 76.58 + 6.34X1 + 7.46X2 + 18.43X3 − 0.0276X1X2 − 1.97X1X3 − 0.4870X2X3 − 0.6308X12 − 2.11X22 − 5.18X32 | 0.9664 | 0.0021 |
| Sugar loss | Y2 = 2.38 + 0.1962X1 + 0.3891X2 + 0.5595X3 − 0.0488X1X2 + 0.1037X1X3 + 0.5012X2X3 − 0.0204X12 − 0.1406X22 − 0.0187X32 | 0.8755 | 0.0178 |
| HMF Removal (%) | Furfural Removal (%) | Sugar Loss (%) | |||||||
|---|---|---|---|---|---|---|---|---|---|
| Sum of Squares | F Value | p Value | Sum of Squares | F Value | p Value | Sum of Squares | F Value | p Value | |
| Model | 7708.43 | 27.76 | 0.0001 | 6302.57 | 22.35 | 0.0002 | 9.22 | 5.47 | 0.0178 |
| X1 | 564.70 | 18.30 | 0.0037 | 549.22 | 17.53 | 0.0041 | 0.5259 | 2.81 | 0.1377 |
| X2 | 907.51 | 29.41 | 0.0010 | 759.15 | 24.23 | 0.0017 | 2.07 | 11.04 | 0.0127 |
| X3 | 5905.02 | 191.39 | <0.0001 | 4640.72 | 148.10 | <0.0001 | 4.27 | 22.82 | 0.0020 |
| X1X2 | 0.5819 | 0.0189 | 0.8946 | 0.0061 | 0.0002 | 0.9893 | 0.0190 | 0.1015 | 0.7593 |
| X1X3 | 12.49 | 0.4047 | 0.5449 | 31.15 | 0.9941 | 0.3519 | 0.0861 | 0.4597 | 0.5195 |
| X2X3 | 0.1915 | 0.0062 | 0.9394 | 1.90 | 0.0606 | 0.8127 | 2.01 | 10.73 | 0.0136 |
| X12 | 7.18 | 0.2328 | 0.6442 | 4.49 | 0.1431 | 0.7164 | 0.0047 | 0.0251 | 0.8785 |
| X22 | 22.23 | 0.7204 | 0.4241 | 50.37 | 1.61 | 0.2454 | 0.2230 | 1.19 | 0.3114 |
| X32 | 310.94 | 10.08 | 0.0156 | 302.34 | 9.65 | 0.0172 | 0.0039 | 0.0210 | 0.8889 |
| Run No. | X1 | X2 | X3 | HMF Removal | Furfural Removal | Sugar Loss(Glucose + Xylose) |
|---|---|---|---|---|---|---|
| (%) | ||||||
| 1 | 25.0 | 1.5 | 2.0 | 31.9 | 40.0 | 1.82 |
| 2 | 50.0 | 1.5 | 2.0 | 42.2 | 53.3 | 2.42 |
| 3 | 25.0 | 4.5 | 2.0 | 39.0 | 48.5 | 1.51 |
| 4 | 50.0 | 4.5 | 2.0 | 56.8 | 66.5 | 1.65 |
| 5 | 25.0 | 1.5 | 6.0 | 73.8 | 79.4 | 1.53 |
| 6 | 50.0 | 1.5 | 6.0 | 85.5 | 89.7 | 2.28 |
| 7 | 25.0 | 4.5 | 6.0 | 88.0 | 90.7 | 2.96 |
| 8 | 50.0 | 4.5 | 6.0 | 97.4 | 96.1 | 3.78 |
| 9 | 16.5 | 3.0 | 4.0 | 53.7 | 60.4 | 2.14 |
| 10 | 58.5 | 3.0 | 4.0 | 78.5 | 83.9 | 2.36 |
| 11 | 37.5 | 0.5 | 4.0 | 39.6 | 49.4 | 0.88 |
| 12 | 37.5 | 5.5 | 4.0 | 85.9 | 86.5 | 2.94 |
| 13 | 37.5 | 3.0 | 0.6 | 20.1 | 28.3 | 0.92 |
| 14 | 37.5 | 3.0 | 7.4 | 86.9 | 90.3 | 3.59 |
| 15 | 37.5 | 3.0 | 4.0 | 66.1 | 75.0 | 2.56 |
| 16 | 37.5 | 3.0 | 4.00 | 74.0 | 79.6 | 2.24 |
| 17 | 37.5 | 3.0 | 4.00 | 57.9 | 76.1 | 2.35 |
Publisher’s Note: MDPI stays neutral with regard to jurisdictional claims in published maps and institutional affiliations. |
© 2021 by the authors. Licensee MDPI, Basel, Switzerland. This article is an open access article distributed under the terms and conditions of the Creative Commons Attribution (CC BY) license (https://creativecommons.org/licenses/by/4.0/).
Share and Cite
Hong, J.-W.; Gam, D.-H.; Kim, J.-H.; Jeon, S.-J.; Kim, H.-S.; Kim, J.-W. Process Development for the Detoxification of Fermentation Inhibitors from Acid Pretreated Microalgae Hydrolysate. Molecules 2021, 26, 2435. https://doi.org/10.3390/molecules26092435
Hong J-W, Gam D-H, Kim J-H, Jeon S-J, Kim H-S, Kim J-W. Process Development for the Detoxification of Fermentation Inhibitors from Acid Pretreated Microalgae Hydrolysate. Molecules. 2021; 26(9):2435. https://doi.org/10.3390/molecules26092435
Chicago/Turabian StyleHong, Ji-Woo, Da-Hye Gam, Jun-Hee Kim, Sung-Jin Jeon, Ho-Seob Kim, and Jin-Woo Kim. 2021. "Process Development for the Detoxification of Fermentation Inhibitors from Acid Pretreated Microalgae Hydrolysate" Molecules 26, no. 9: 2435. https://doi.org/10.3390/molecules26092435
APA StyleHong, J.-W., Gam, D.-H., Kim, J.-H., Jeon, S.-J., Kim, H.-S., & Kim, J.-W. (2021). Process Development for the Detoxification of Fermentation Inhibitors from Acid Pretreated Microalgae Hydrolysate. Molecules, 26(9), 2435. https://doi.org/10.3390/molecules26092435