
Hydrogen and Lithium Bonds—Lewis Acid Units Possessing Multi-Center Covalent Bonds


Abstract
:1. Introduction
2. Computational Methods
3. Results and Discussion
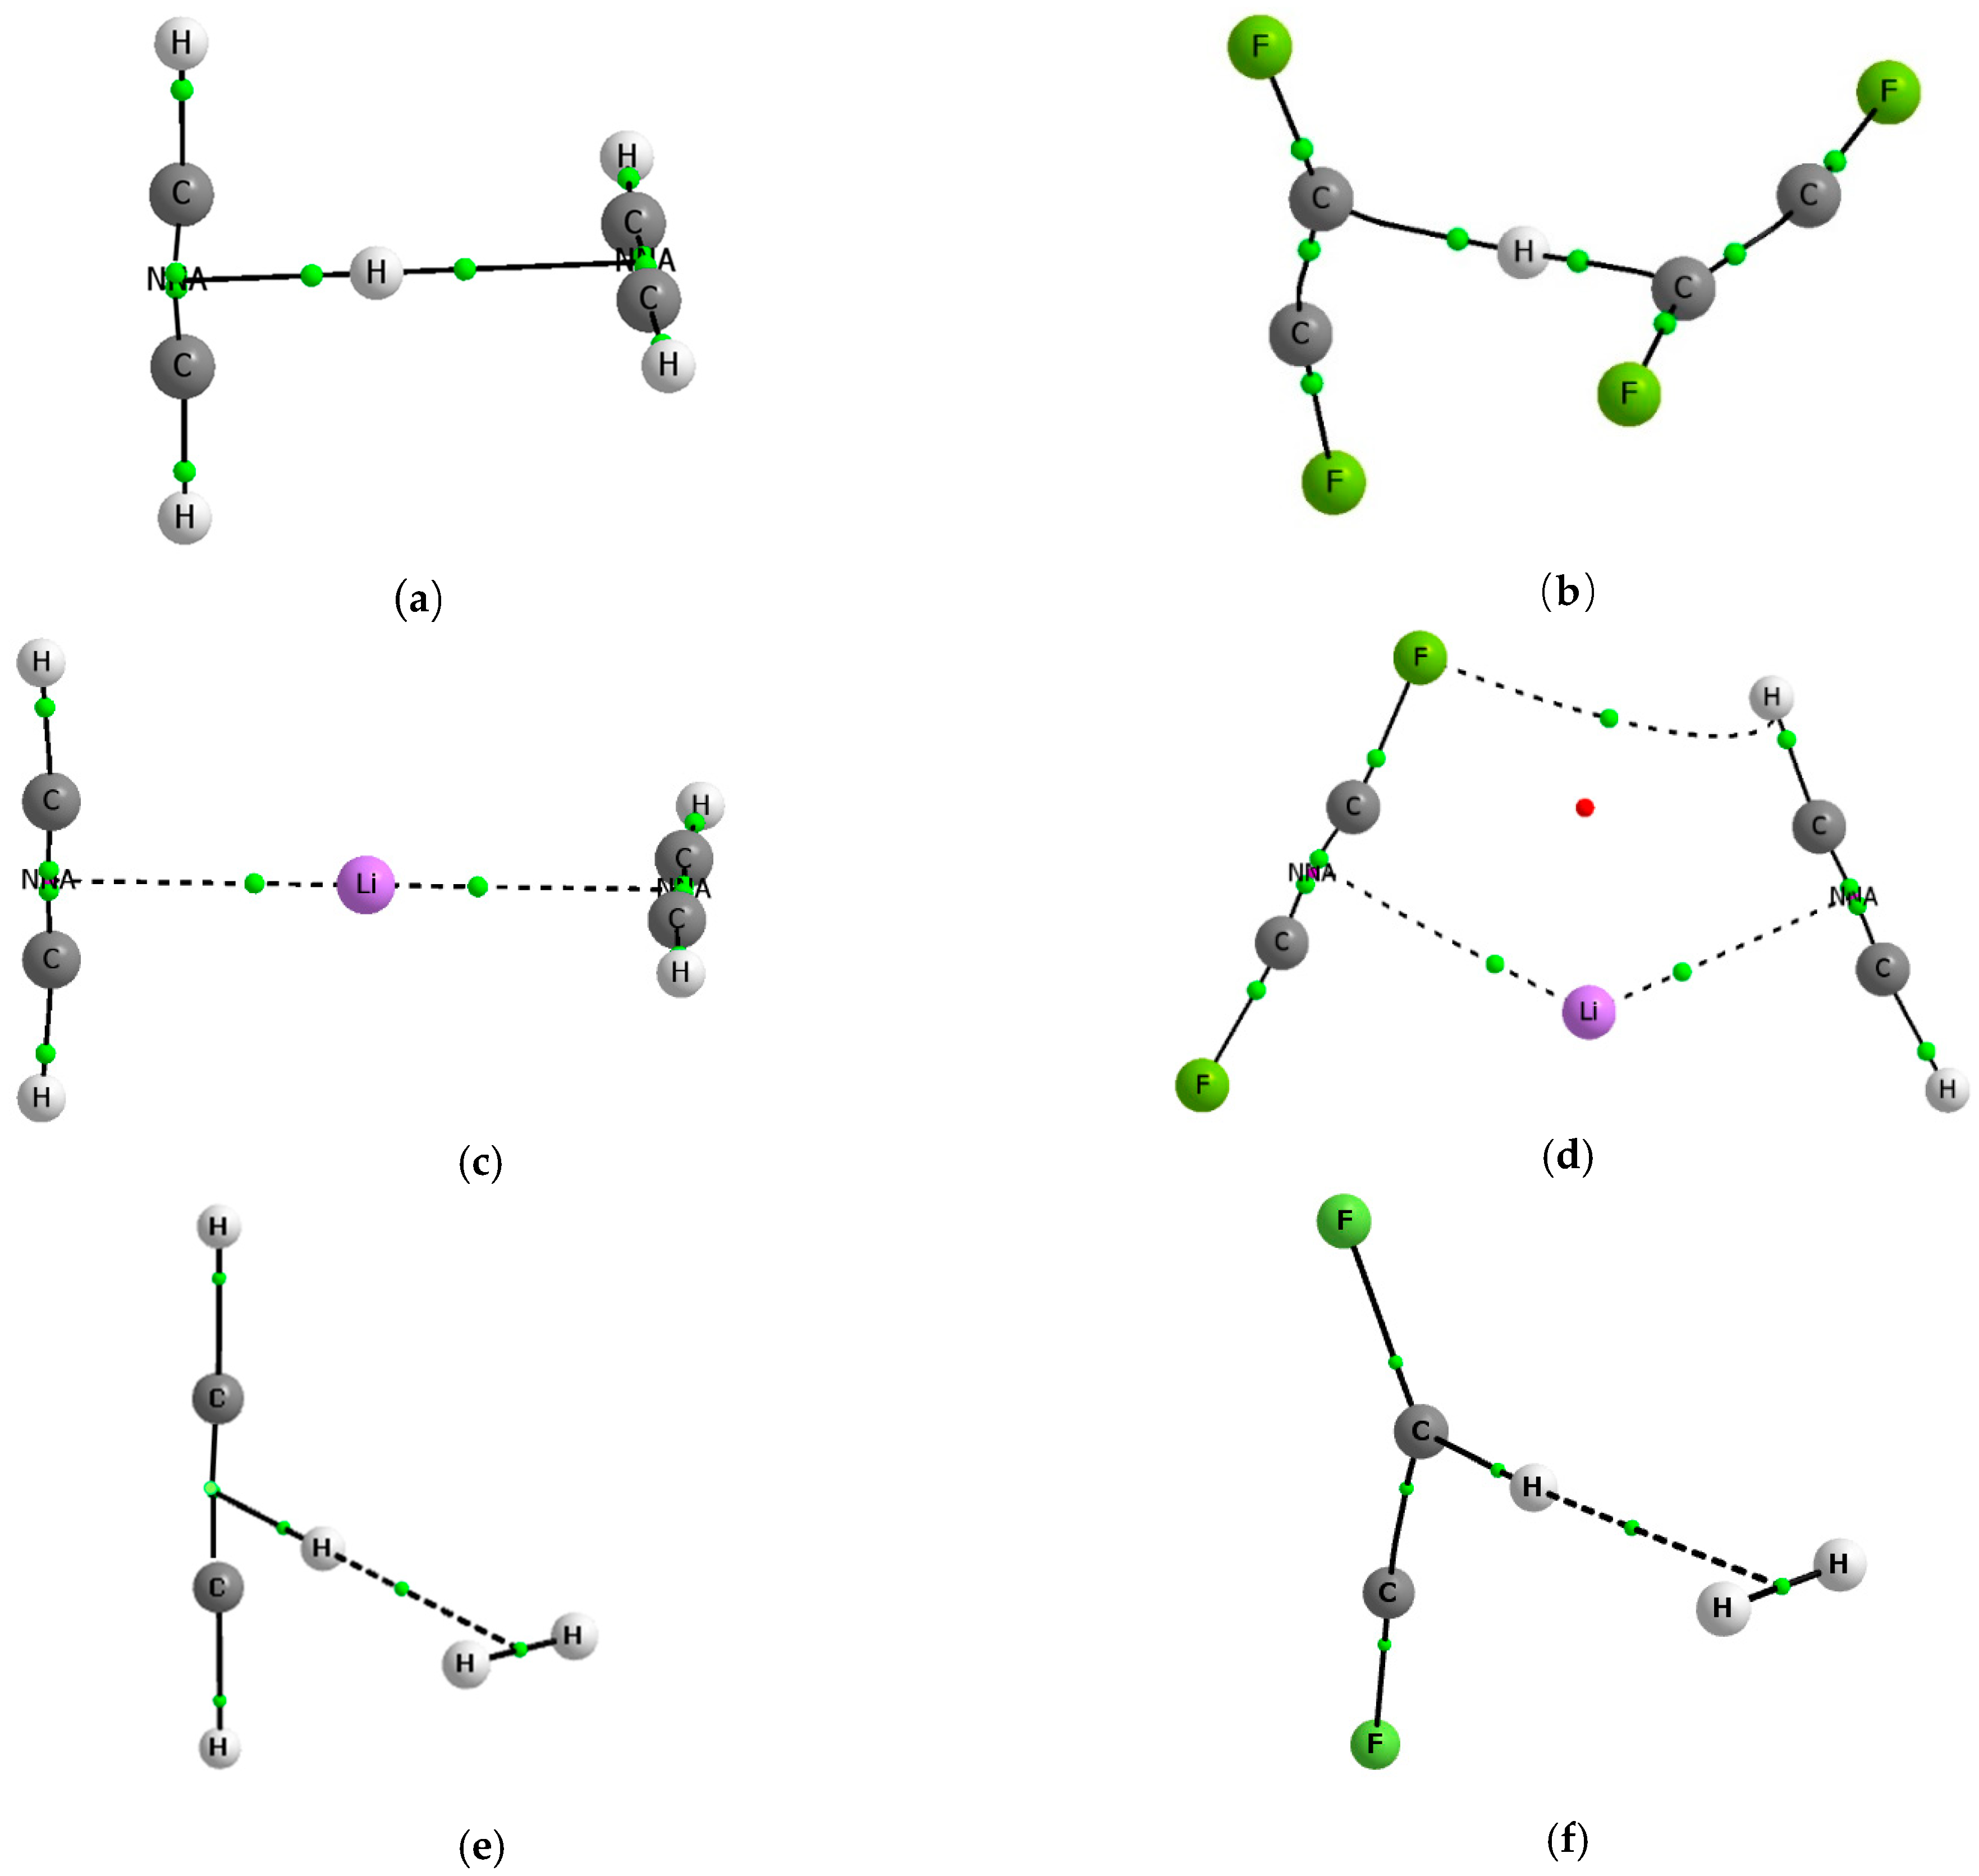
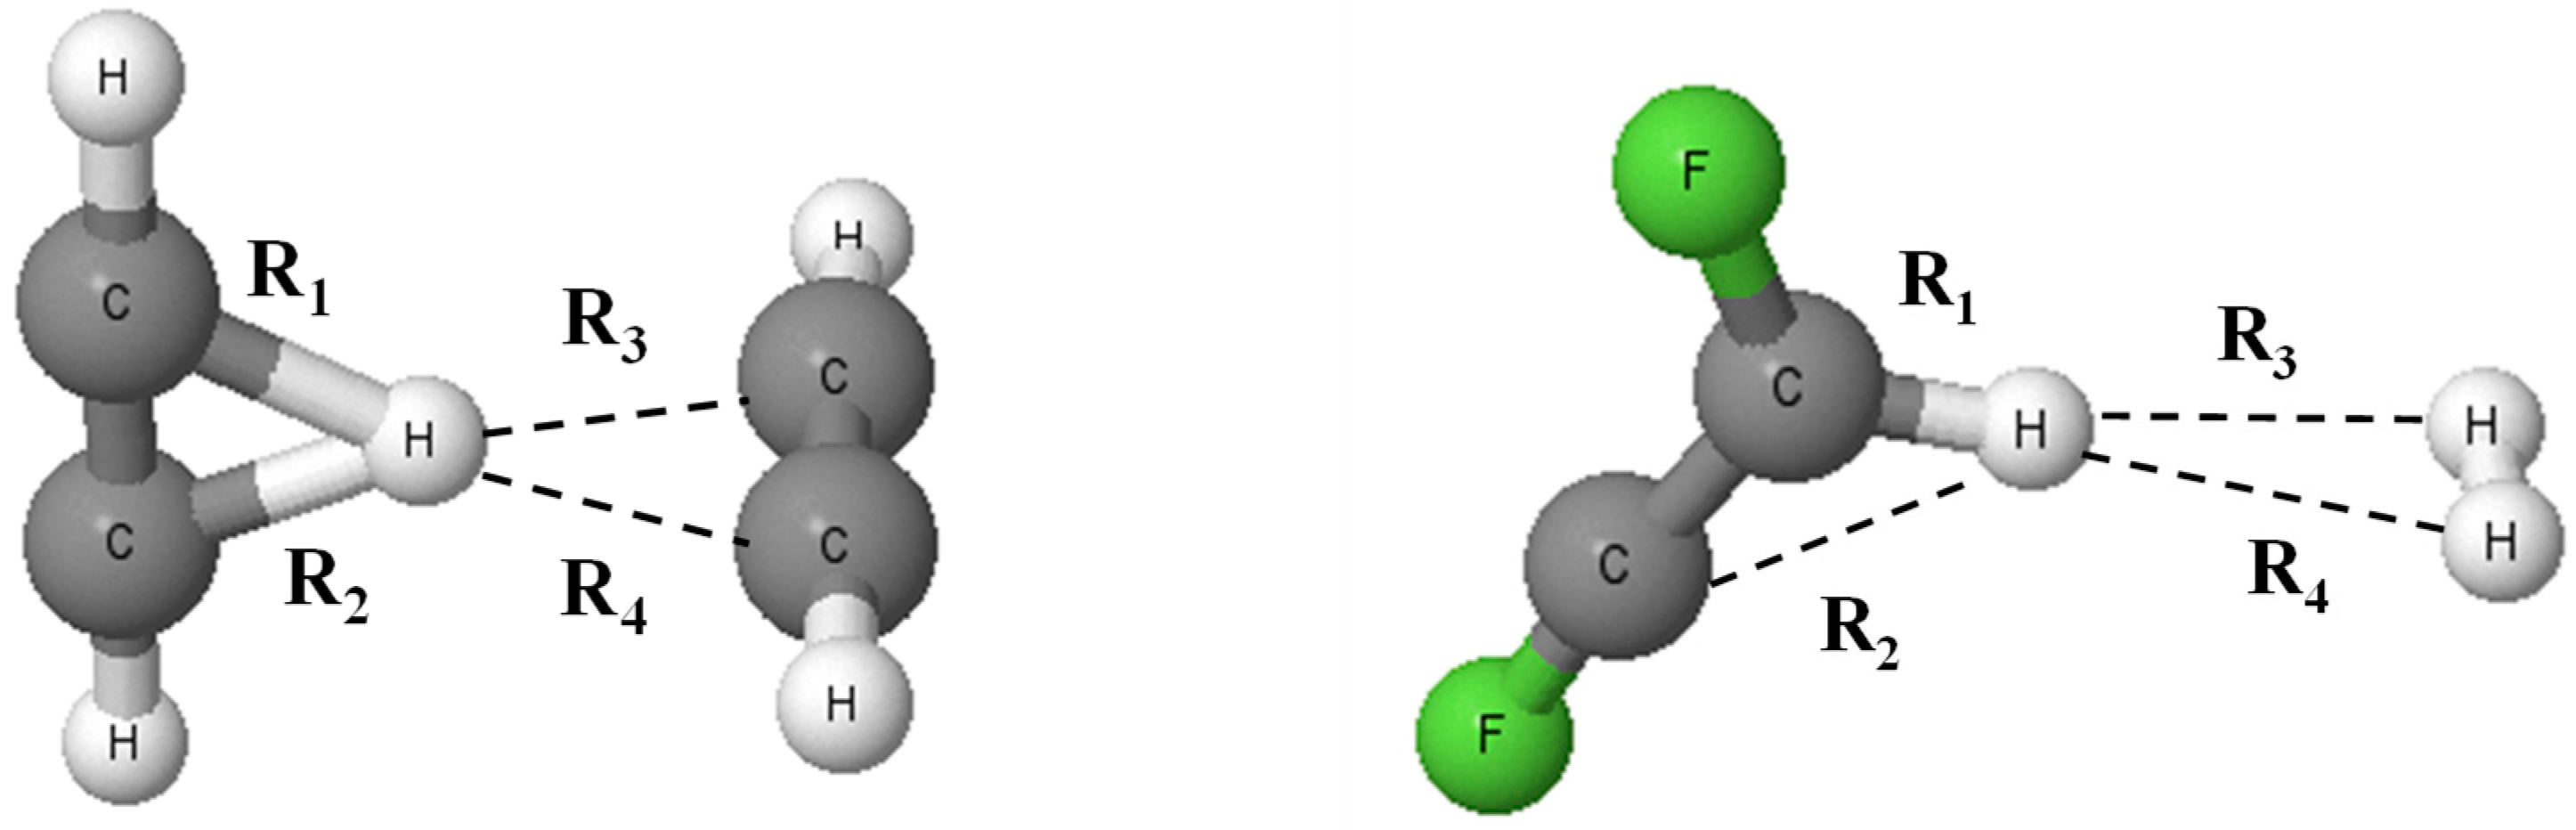
3.1. Geometries
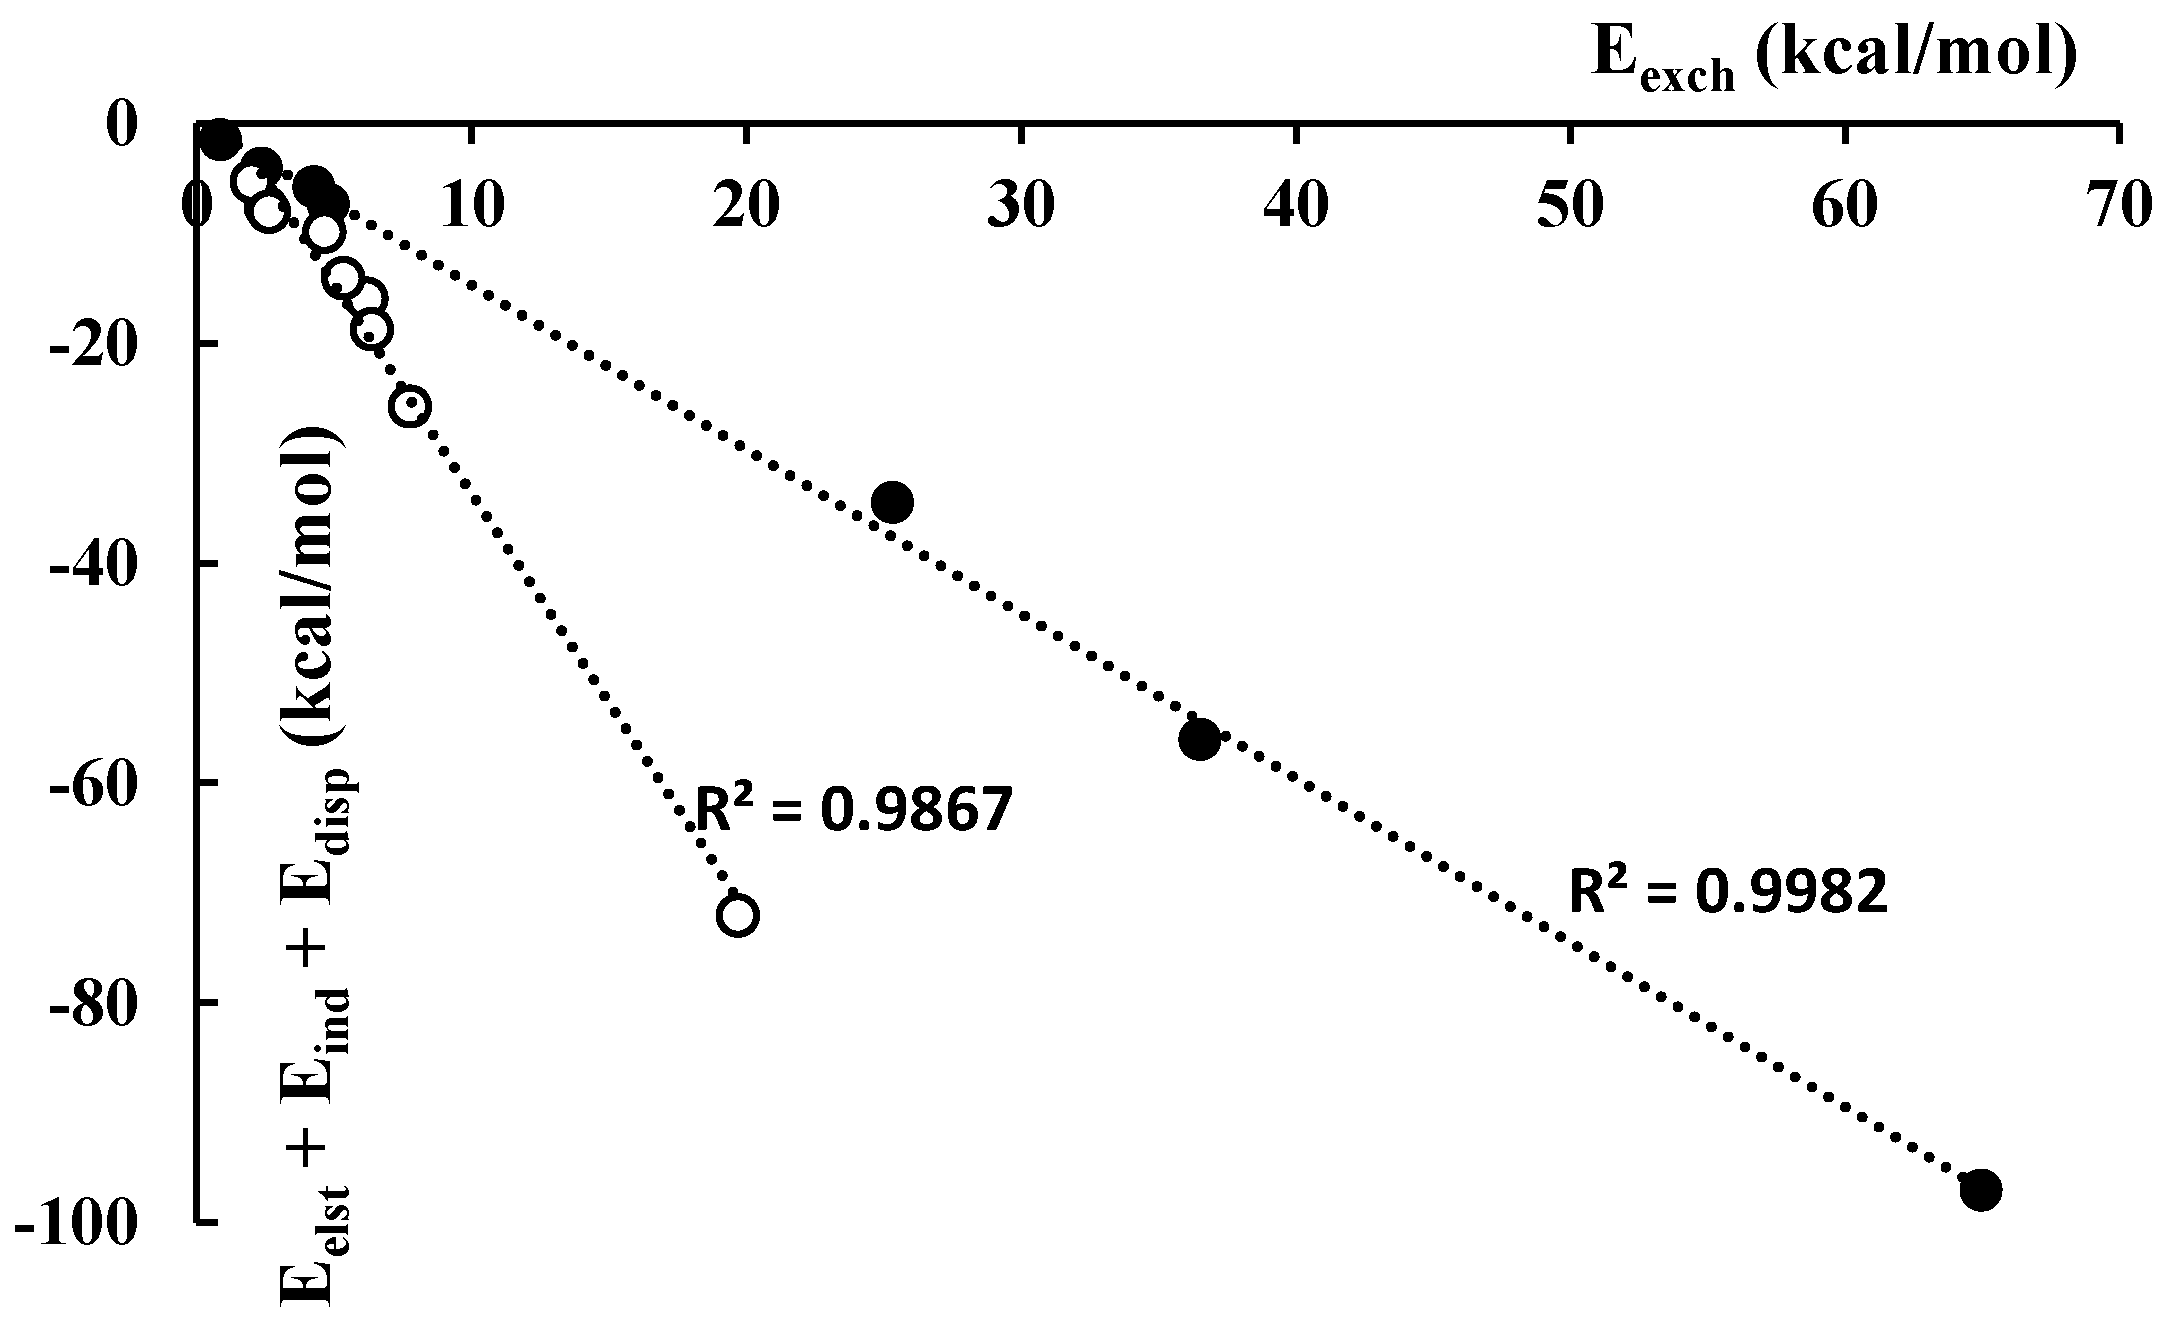
3.2. Energies
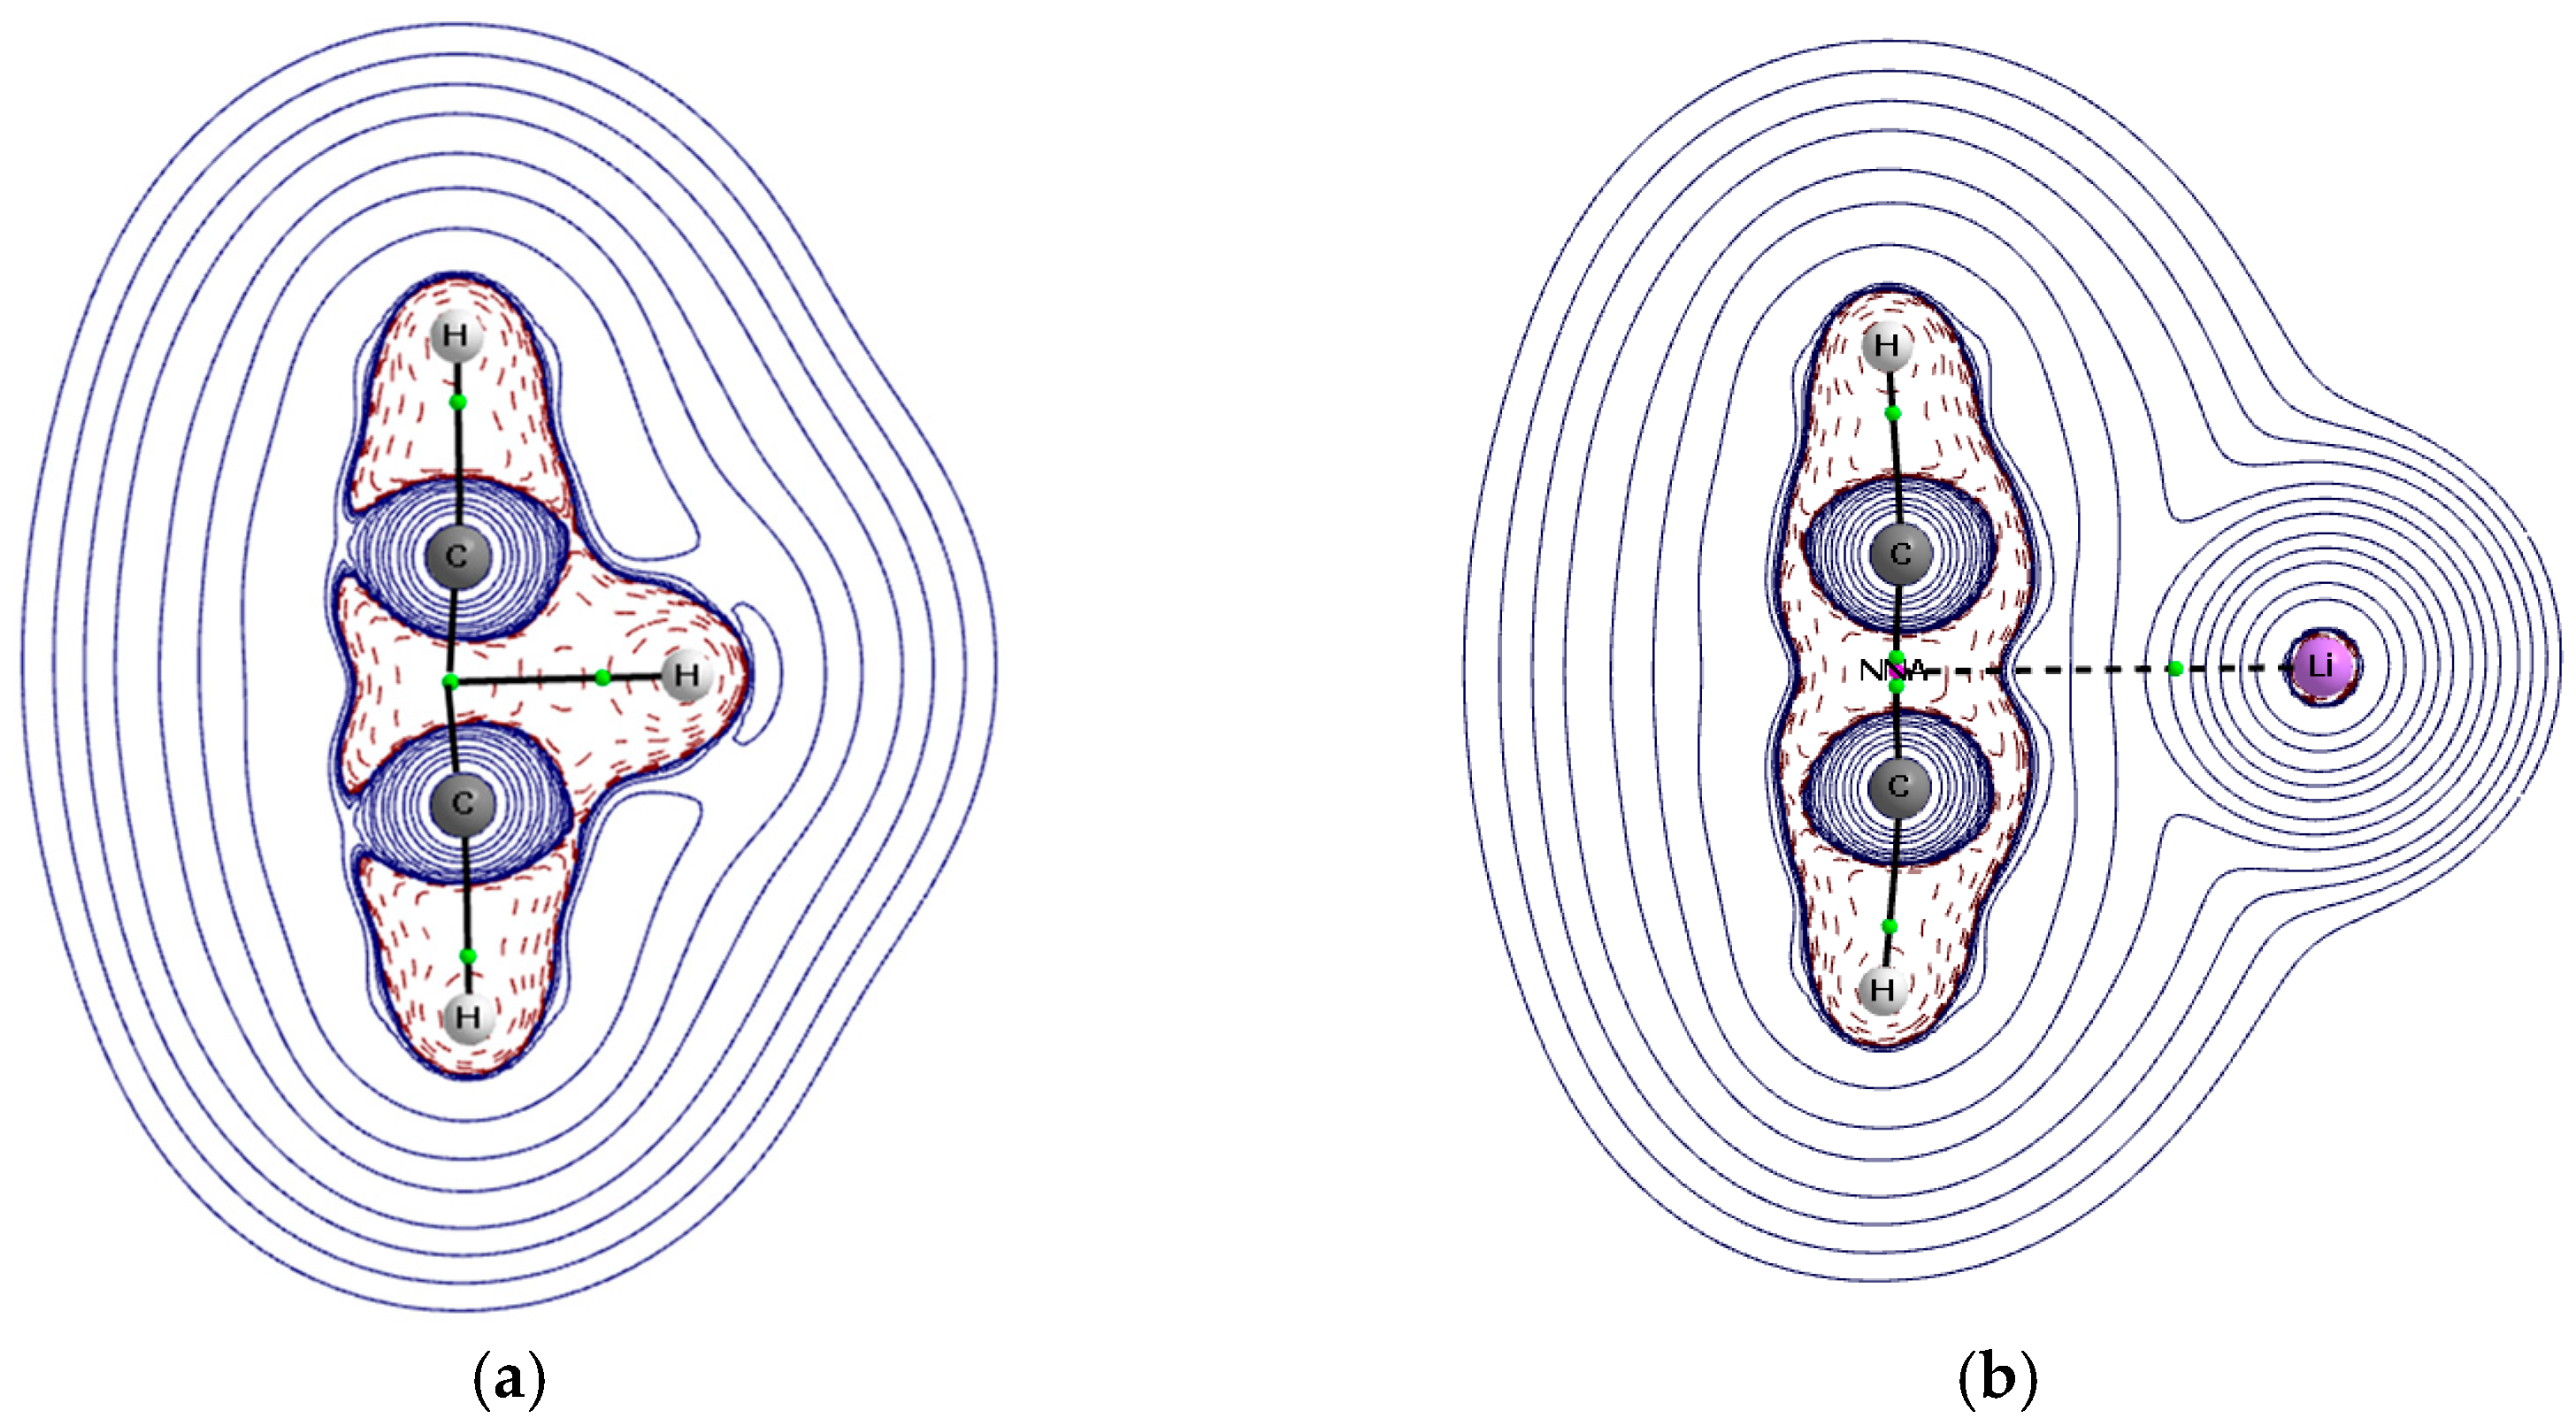
3.3. QTAIM Parameters
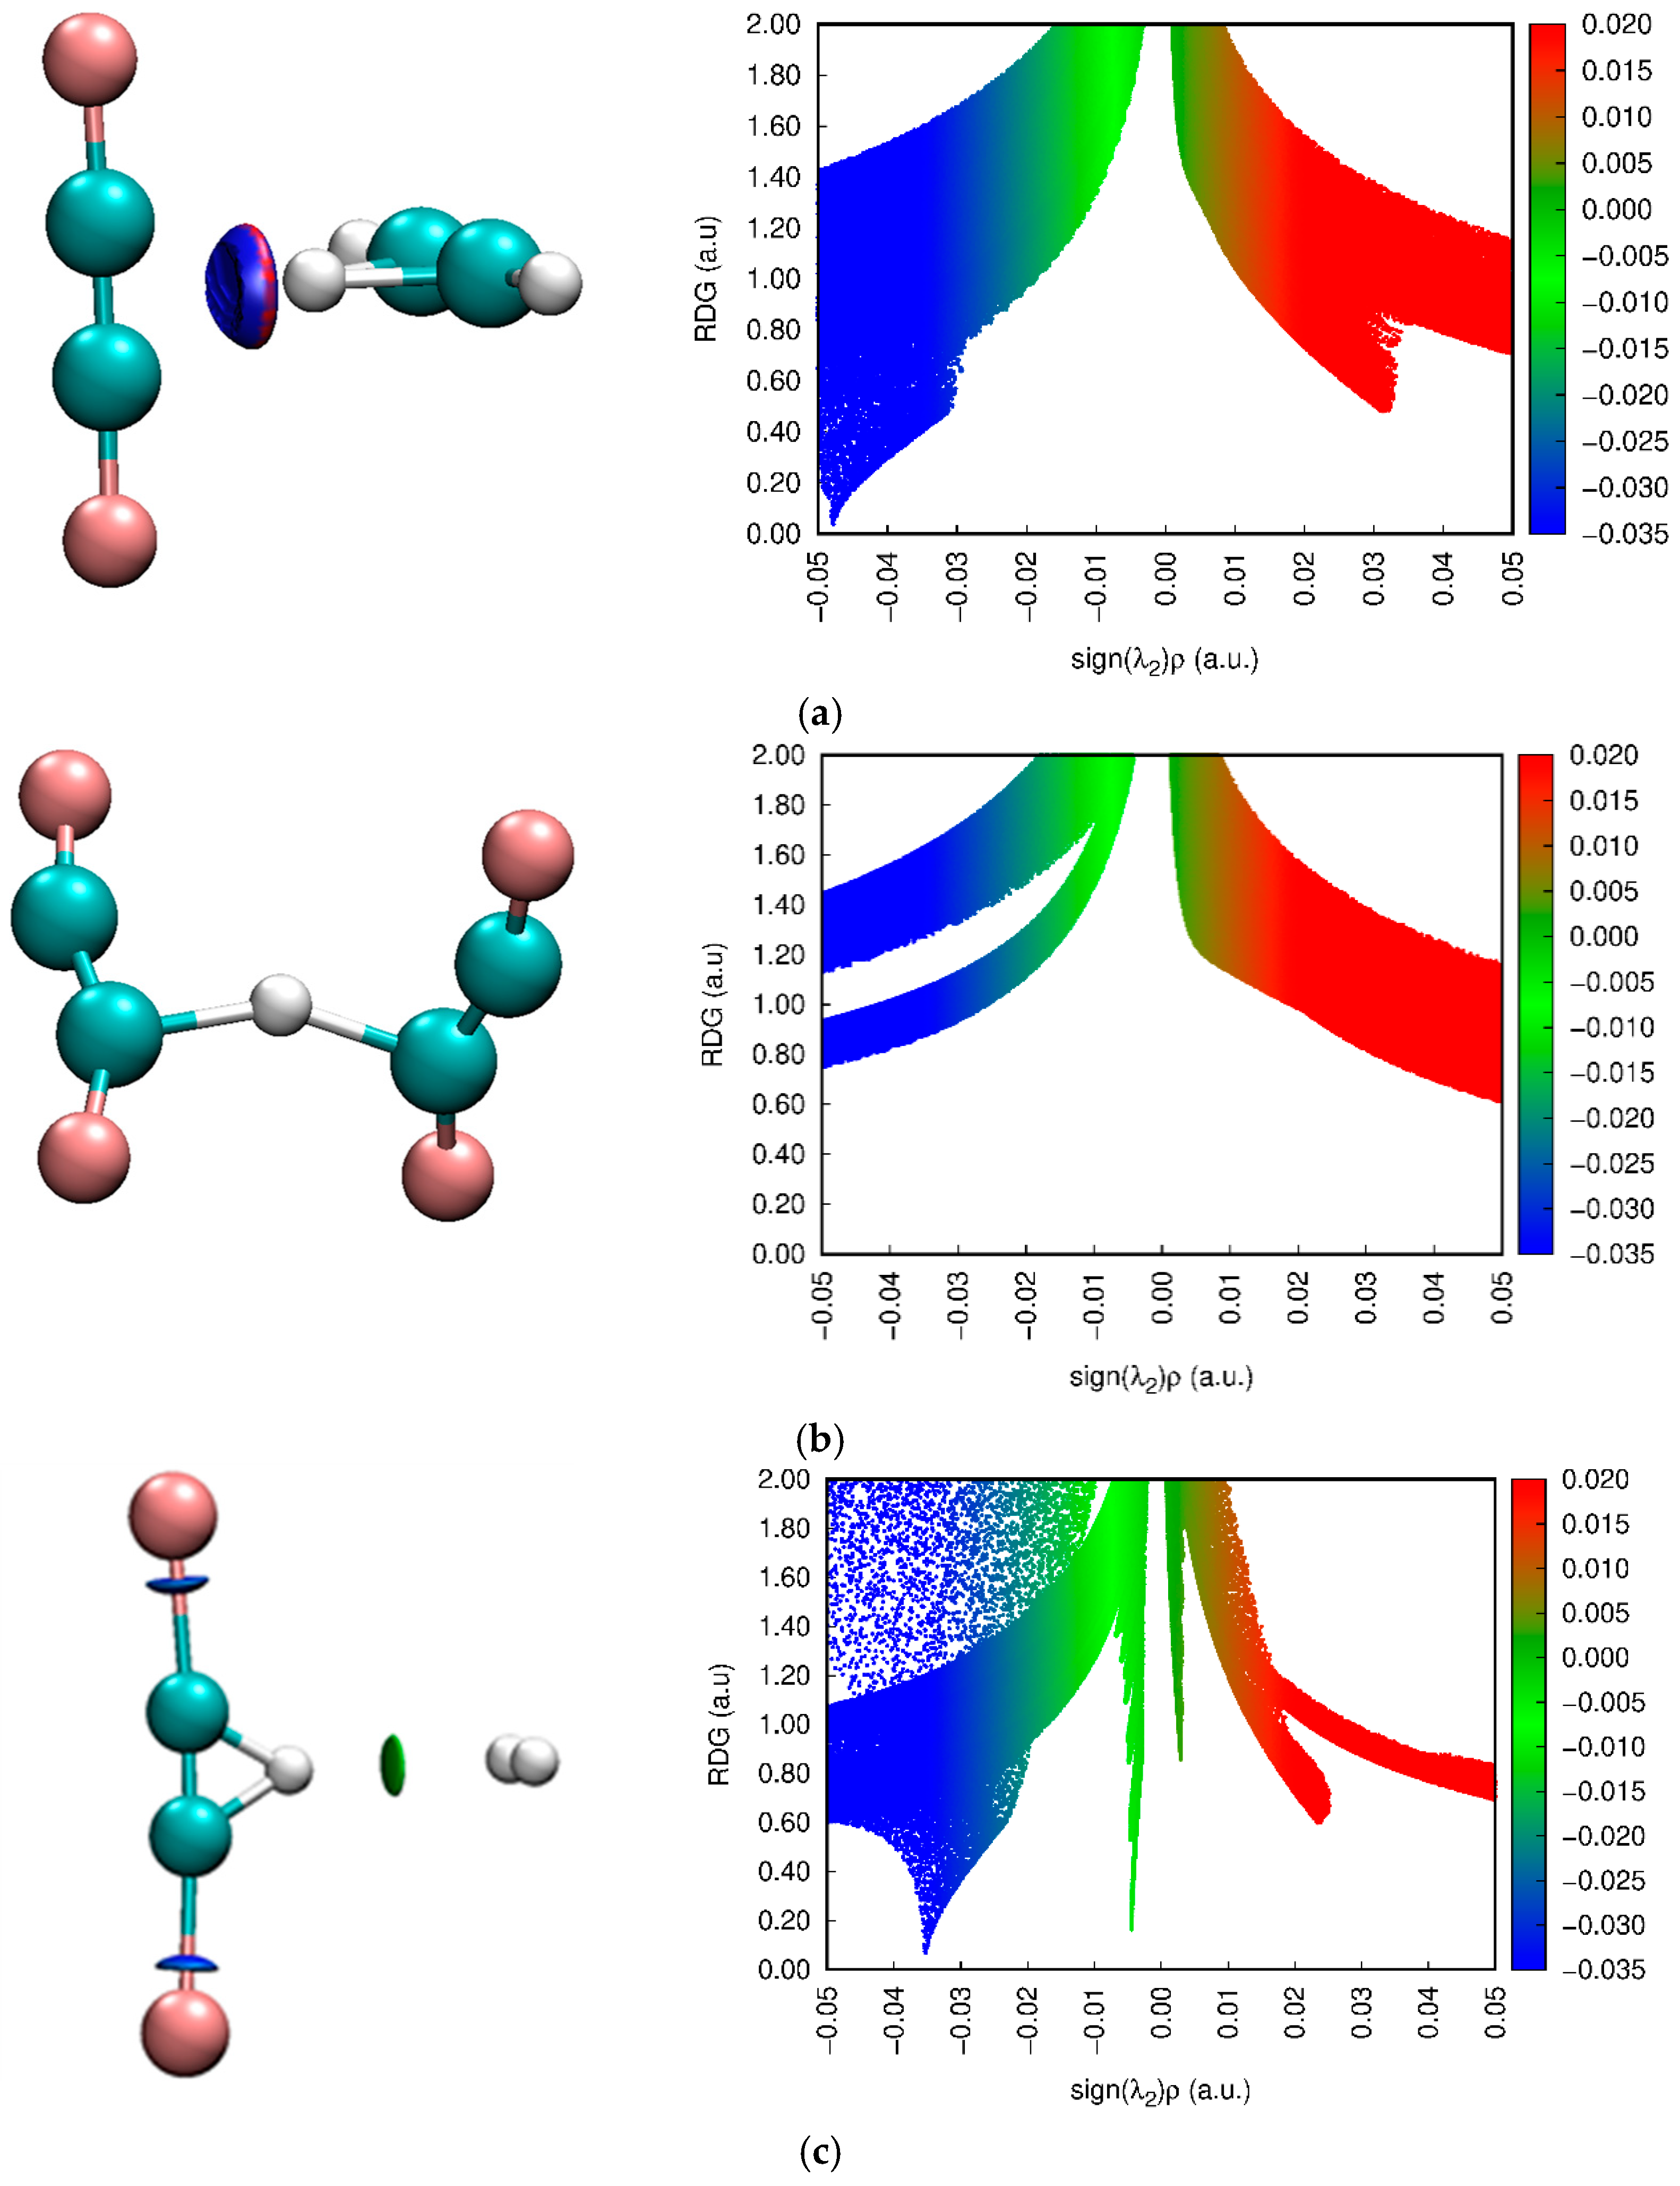
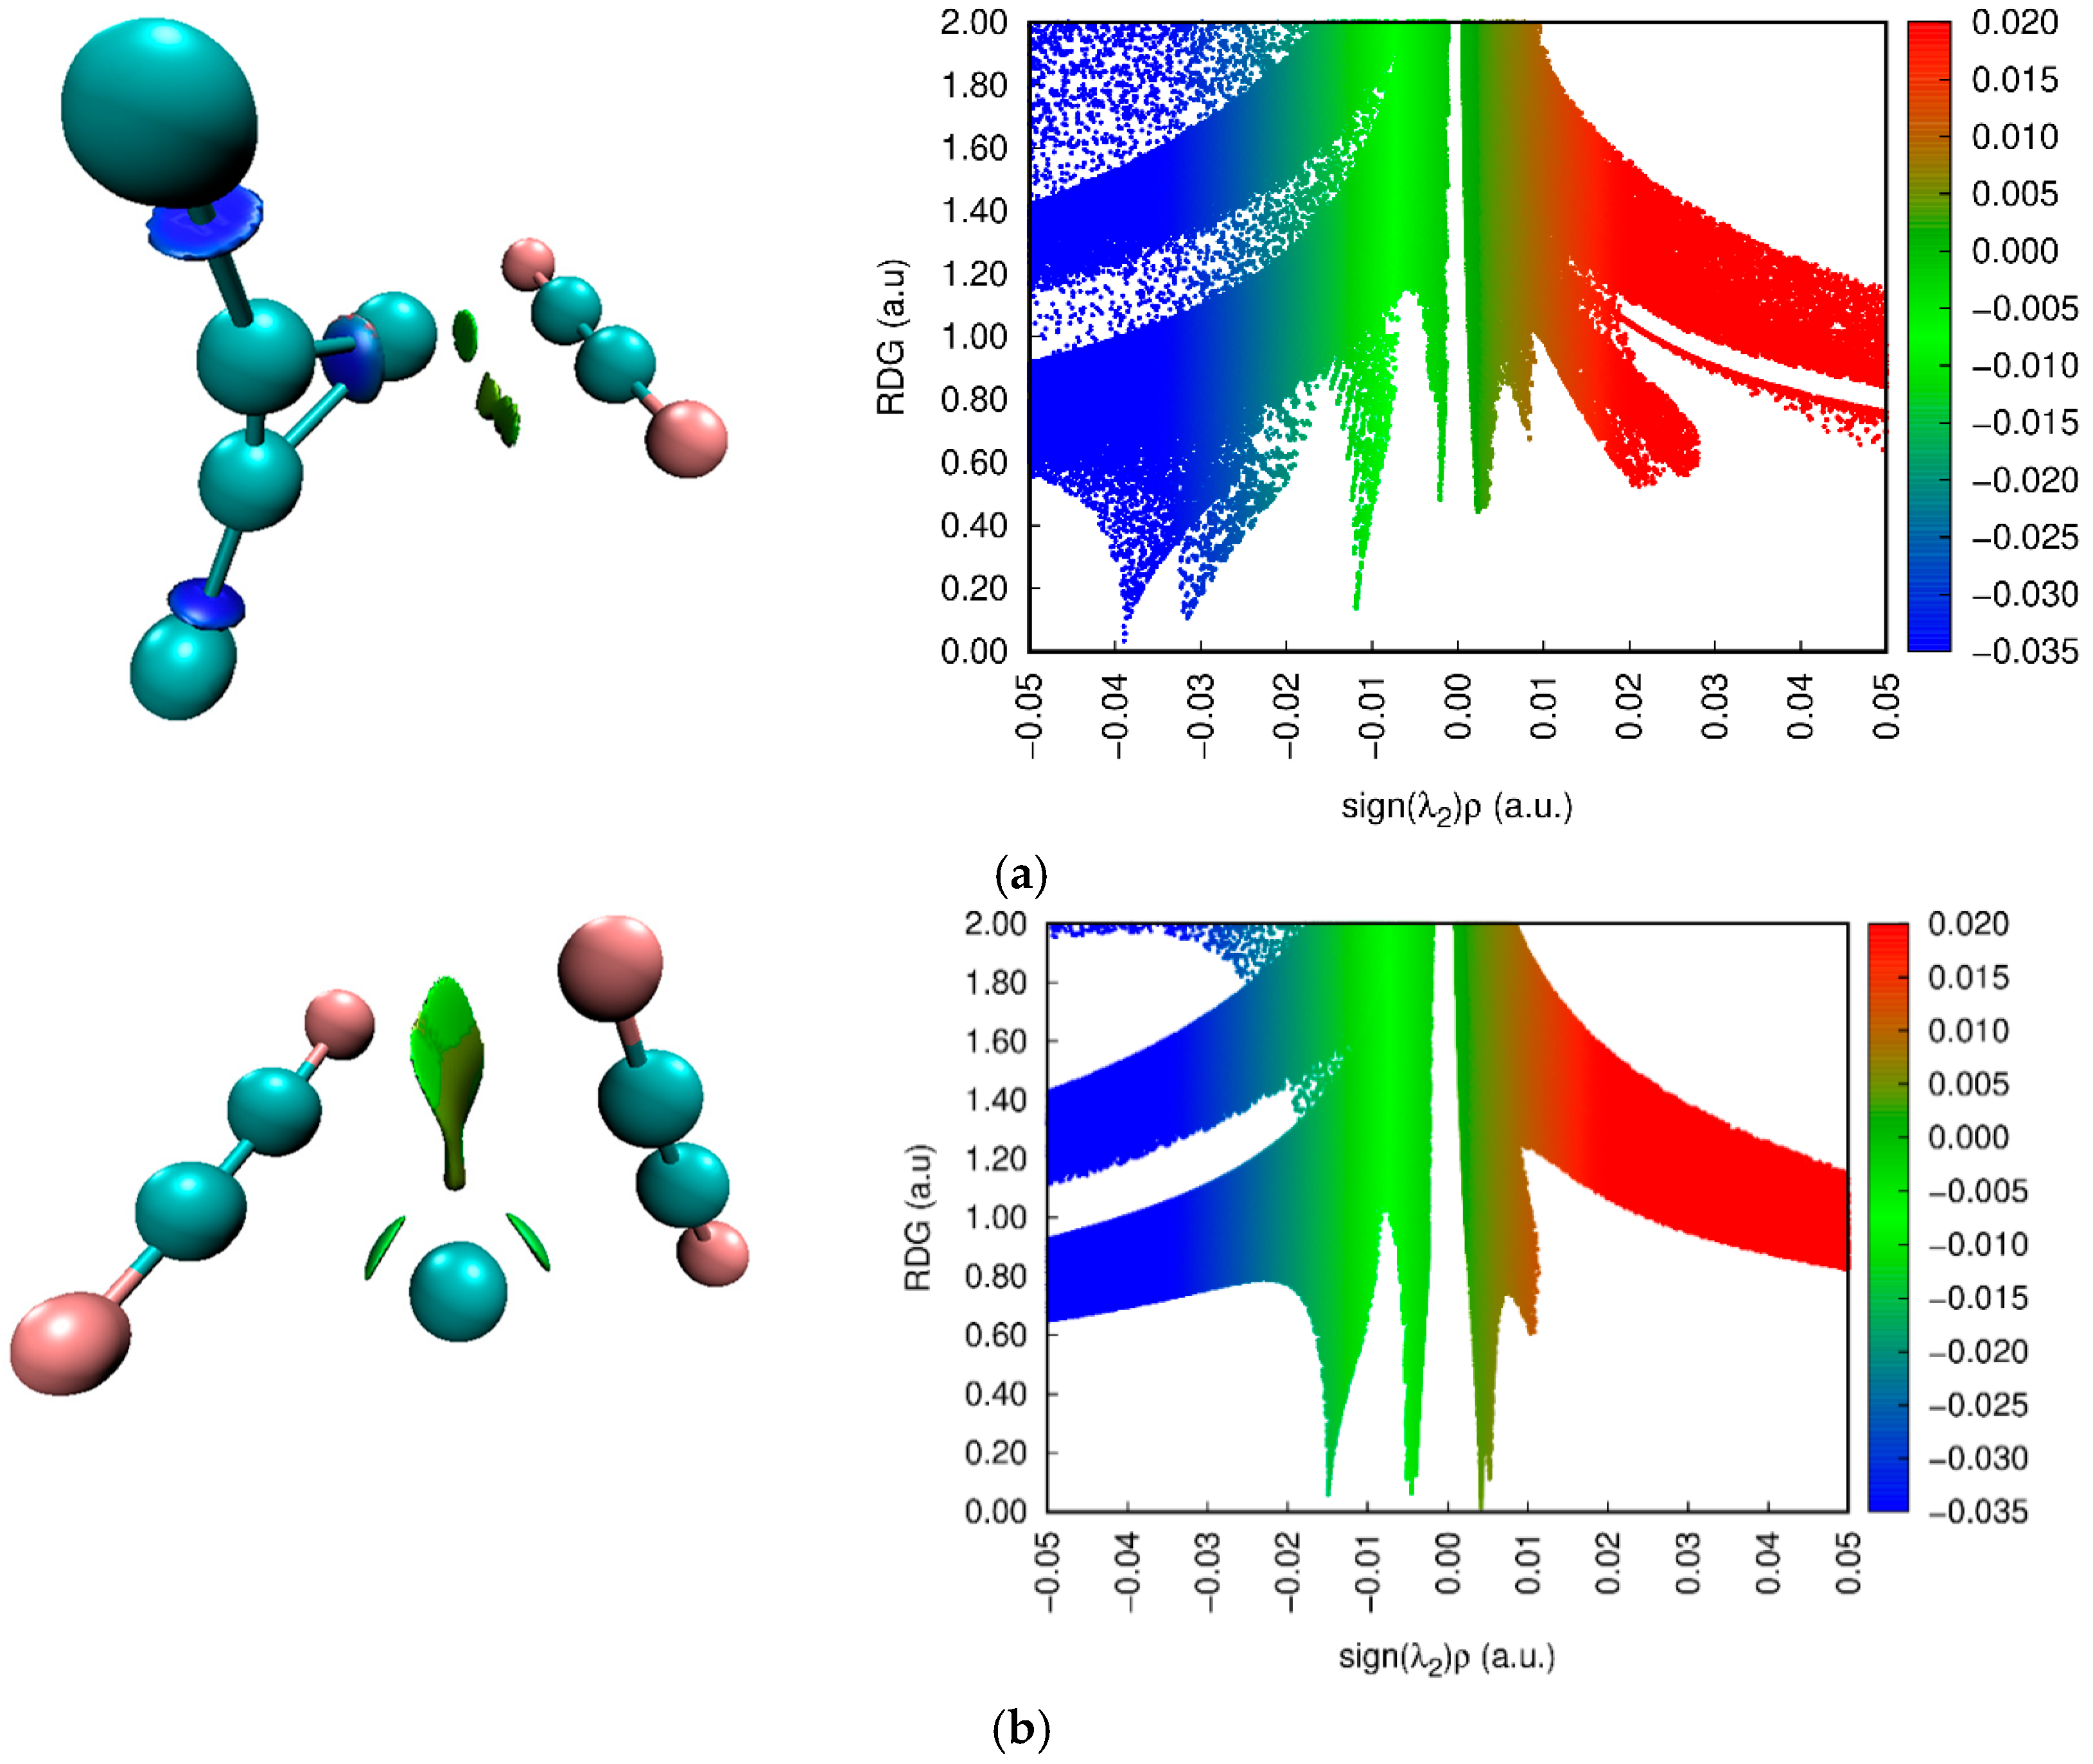
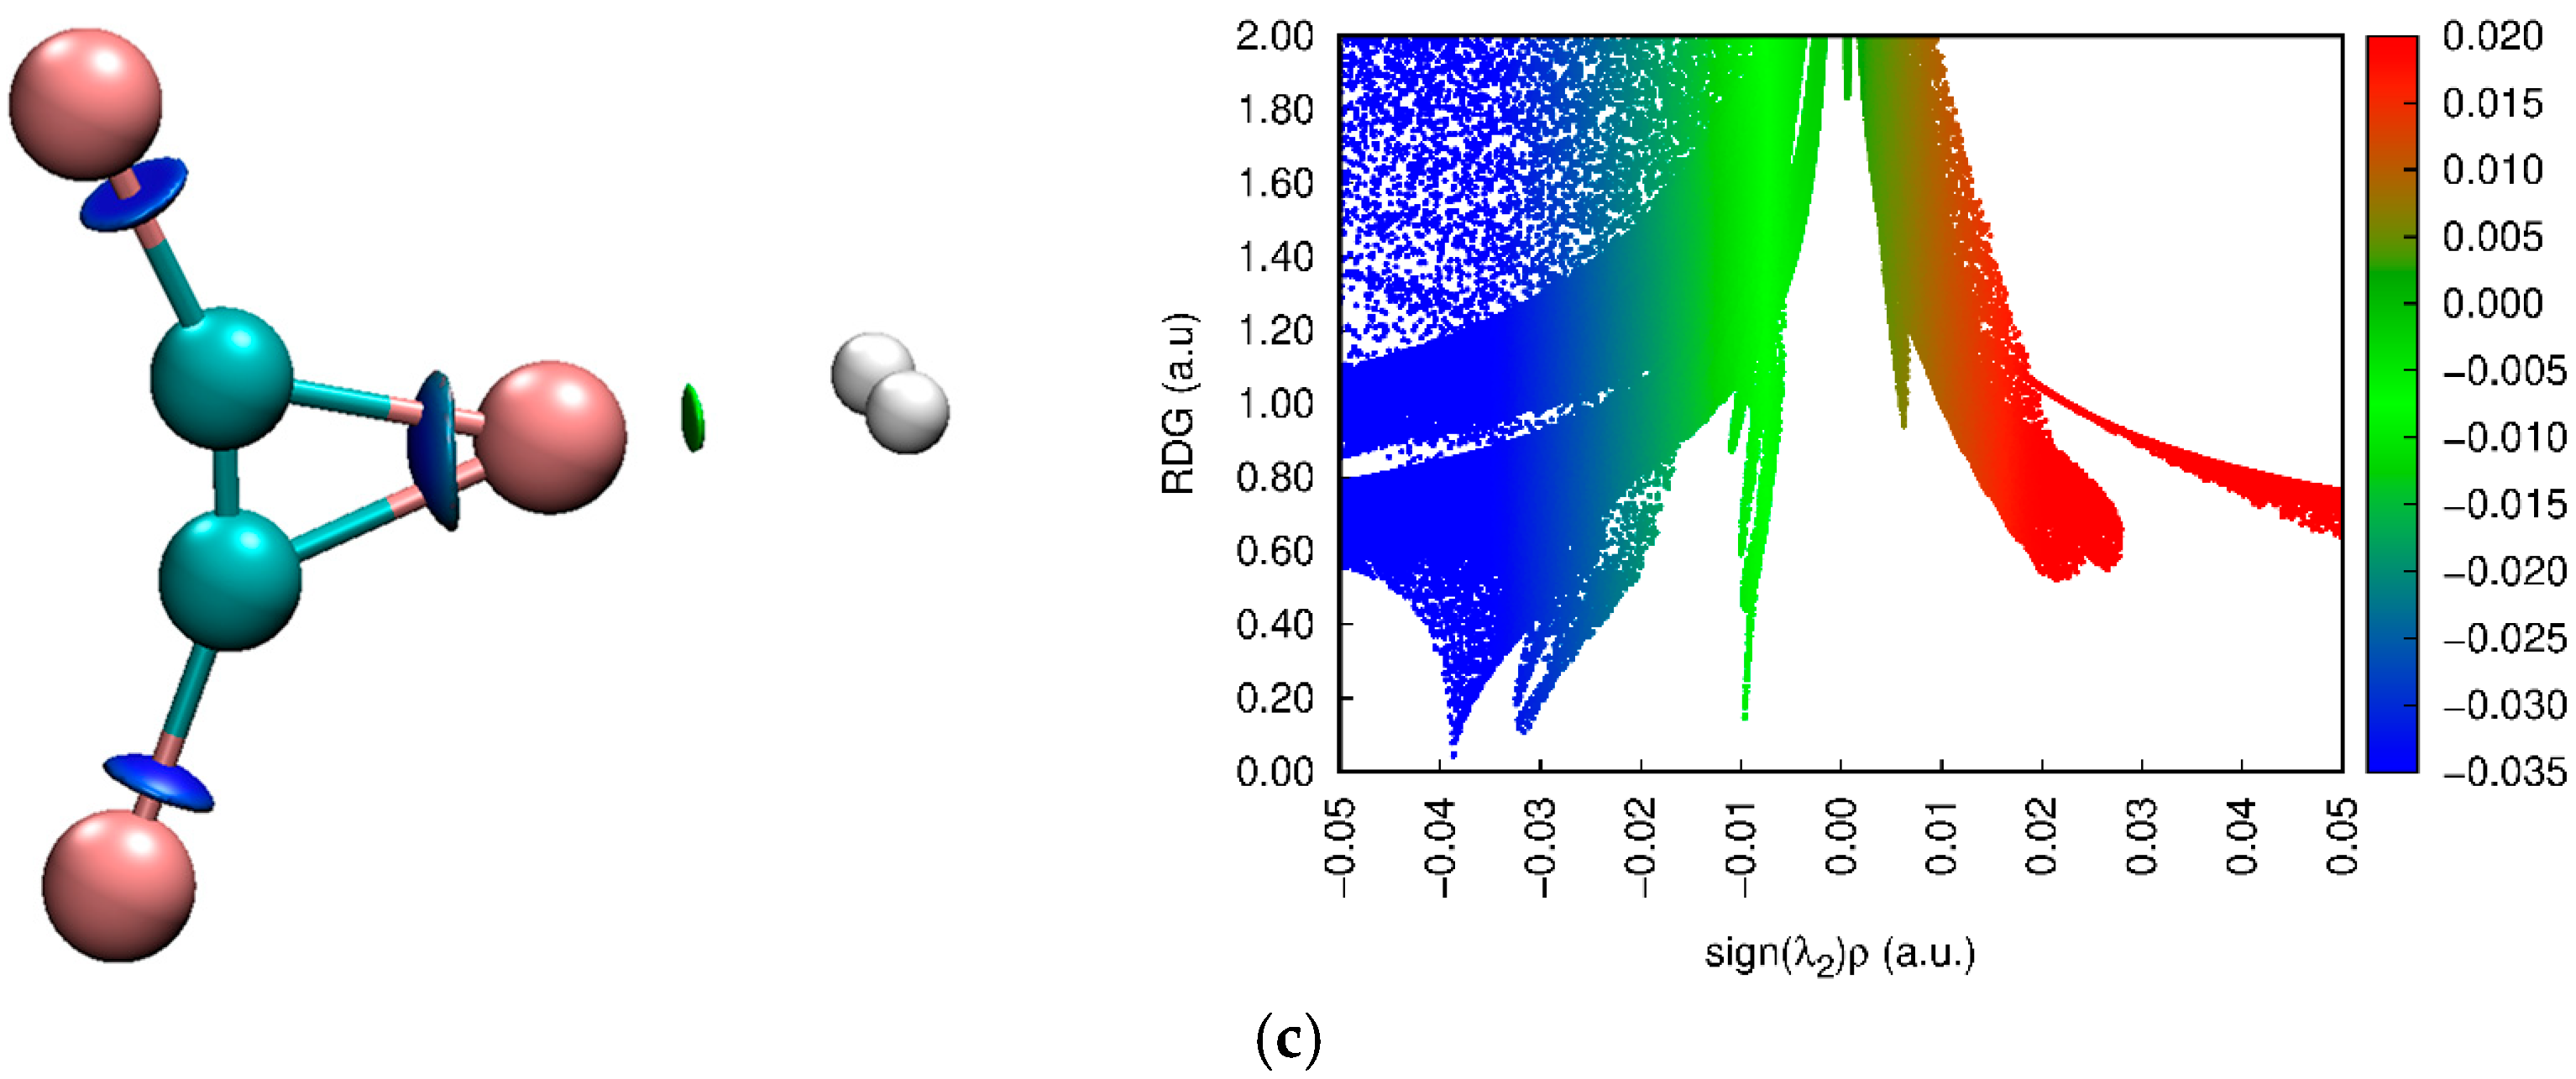
3.4. NCI Approach Results
4. Conclusions
Supplementary Materials
Author Contributions
Funding
Institutional Review Board Statement
Informed Consent Statement
Data Availability Statement
Conflicts of Interest
Sample Availability
References
- Constable, E.C. Through a Glass Darkly—Some Thoughts on Symmetry and Chemistry. Symmetry 2021, 13, 1891. [Google Scholar] [CrossRef]
- Grabowski, S.J. What is the Covalency of Hydrogen Bonding? Chem. Rev. 2011, 11, 2597–2625. [Google Scholar] [CrossRef]
- Weinhold, F.; Landis, C. Valency and Bonding, a Natural Bond Orbital Donor—Acceptor Perspective; Cambridge University Press: Cambridge, UK, 2005. [Google Scholar]
- Grabowski, S.J. Classification of So-Called Non-Covalent Interactions Based on VSEPR Model. Molecules 2021, 26, 4939. [Google Scholar] [CrossRef] [PubMed]
- Ziegler, T.; Rauk, A. A Theoretical Study of the Ethylene-Metal Bond in Complexes between Cu+, Ag+, Au+, Pt0, or Pt2+ and Ethylene, Based on the Hartree-Fock-Slater Transition-State Method. Inorg. Chem. 1979, 18, 1558–1565. [Google Scholar] [CrossRef]
- Nechaev, M.S.; Rayón, V.M.; Frenking, G. Energy Partitioning Analysis of the Bonding in Ethylene and Acetylene Complexes of Group 6, 8, and 11 Metals: (CO)5TM-C2Hx and Cl4TM-C2Hx (TM) Cr, Mo, W), (CO)4TM-C2Hx (TM) Fe, Ru, Os), and TM+-C2Hx (TM) Cu, Ag, Au). J. Phys. Chem. A 2004, 108, 3134–3142. [Google Scholar] [CrossRef]
- Grabowski, S.J.; Sokalski, W.A.; Leszczynski, J. Is a π···H+···π Complex Hydrogen Bonded? J. Phys. Chem. A 2004, 108, 1806–1812. [Google Scholar] [CrossRef]
- Douberly, G.E.; Ricks, A.M.; Ticknor, B.W.; McKee, W.C.; Schleyer, P.v.R.; Duncan, M.A. Infrared Photodissociation Spectroscopy of Protonated Acetylene and Its Clusters. J. Phys. Chem. A 2008, 112, 1897–1906. [Google Scholar] [CrossRef] [PubMed]
- Grabowski, S.J.; Ruipérez, F. π···H+···π Hydrogen Bonds and Their Lithium and Gold Analogues: MP2 and CASPT2 Calculations. ChemPhysChem 2017, 18, 2409–2417. [Google Scholar] [CrossRef]
- Reisinger, A.; Trapp, N.; Krossing, I.; Altmannshofer, S.; Herz, V.; Presnitz, M.; Scherer, W. Homoleptic Silver(I) Acetylene Complexes. Angew. Chem. Int. Ed. 2007, 46, 8295–8298. [Google Scholar] [CrossRef] [PubMed]
- Bader, R.F.W. Atoms in Molecules, a Quantum Theory; Oxford University Press: Oxford, UK, 1990. [Google Scholar]
- Matta, C.; Boyd, R.J. (Eds.) Quantum Theory of Atoms in Molecules: Recent Progress in Theory and Application; Wiley-VCH: Weinheim, Germany, 2007. [Google Scholar]
- Jeziorski, B.; Moszyński, R.; Szalewicz, K. Perturbation theory approach to intermolecular potential energy surfaces of van der Waals complexes. Chem. Rev. 1994, 94, 1887–1930. [Google Scholar] [CrossRef]
- Johnson, E.R.; Keinan, S.; Mori-Sánchez, P.; Contreras-García, J.; Cohen, A.J.; Yang, W. Reveling Noncovalent Interactions. J. Am. Chem. Soc. 2010, 132, 6498–6506. [Google Scholar] [CrossRef] [PubMed] [Green Version]
- Lefebvre, C.; Rubez, G.; Khartabil, H.; Boisson, J.-C.; Contreras-García, J.; Hénon, E. Accurately extracting the signature of intermolecular interactions present in the NCI plot of the reduced density gradient versus electron density. Phys. Chem. Chem. Phys. 2017, 19, 17928–17936. [Google Scholar] [CrossRef]
- Piela, L. Ideas of Quantum Chemistry; Elsevier Science Publishers: Amsterdam, The Netherlands, 2007; pp. 684–691. [Google Scholar]
- Koritsanszky, T.; Coppens, P. Chemical applications of X-ray charge-density analysis. Chem. Rev. 2001, 101, 1583–1627. [Google Scholar] [CrossRef]
- Stalke, D. (Ed.) Electron Density and Chemical Bonding I. Experimental Charge Density Studies; Springer: Berlin/Heidelberg, Germany, 2012. [Google Scholar]
- Gatti, C.; Macchi, P. (Eds.) Modern Charge-Density Analysis; Springer: New York, NY, USA, 2012. [Google Scholar]
- Frisch, M.J.; Trucks, G.W.; Schlegel, H.B.; Scuseria, G.E.; Robb, M.A.; Cheeseman, J.R.; Scalmani, G.; Barone, V.; Mennucci, B.; Petersson, G.A.; et al. Gaussian 16; Revision A.03; Gaussian, Inc.: Wallingford, CT, USA, 2016. [Google Scholar]
- Møller, C.; Plesset, M.S. Note on an Approximation Treatment for Many-Electron Systems. Phys. Rev. 1934, 46, 618–622. [Google Scholar] [CrossRef] [Green Version]
- Kendall, R.A.; Dunning, T.H., Jr.; Harrison, R.J. Electron Affinities of the First-Row Atoms Revisited. Systematic Basis Sets and Wave Functions. J. Chem. Phys. 1992, 96, 6796–6806. [Google Scholar] [CrossRef] [Green Version]
- Woon, D.E.; Dunning, T.H. Gaussian basis sets for use in correlated molecular calculations. III. The atoms aluminum through argon. J. Chem. Phys. 1993, 98, 1358. [Google Scholar] [CrossRef] [Green Version]
- Grabowski, S.J.; Sokalski, W.A. Different types of hydrogen bonds: Correlation analysis of interaction energy components. J. Phys. Org. Chem. 2005, 18, 779–784. [Google Scholar] [CrossRef]
- Boys, S.F.; Bernardi, F. The calculation of small molecular interactions by the differences of separate total energies. Some procedures with reduced errors. Mol. Phys. 1970, 19, 553–561. [Google Scholar] [CrossRef]
- Keith, T.A. AIMAll; Version 11.08.23; TK Gristmill Software: Overland Park, KS, USA, 2011; Available online: Aim.tkgristmill.com (accessed on 18 October 2021).
- Smith, D.G.A.; Burns, L.A.; Sirianni, D.A.; Nascimento, D.R.; Kumar, A.; James, A.M.; Schriber, J.B.; Zhang, T.; Zhang, B.; Abbott, A.S.; et al. Psi4NumPy: An Interactive Quantum Chemistry Programming Environment for Reference Implementations and Rapid Development. J. Chem. Theory Comput. 2018, 14, 3504–3511. [Google Scholar] [CrossRef] [Green Version]
- Parker, T.M.; Burns, L.A.; Parrish, R.M.; Ryno, A.; Sherrill, C.D. Levels of symmetry adapted theory (SAPT). I. Efficiency and performance for interaction energies. J. Chem. Phys. 2014, 140, 094106. [Google Scholar] [CrossRef]
- Narth, C.; Maroun, Z.; Boto, R.A.; Chaudret, R.; Bonnet, M.-L.; Piquemal, J.-P.; Contreras-García, J. A Complete NCI Perspective: From New Bonds to Reactivity. In Applications of Topological Methods in Molecular; Springer: Cham, Switzerland, 2016; pp. 491–528. [Google Scholar]
- Lu, T.; Chen, F. Multiwfn: A multifunctional wavefunction analyzer. J. Comput. Chem. 2012, 33, 580–592. [Google Scholar] [CrossRef]
- Humphrey, W.; Dalke, A.; Schulten, K. VMD: Visual molecular dynamics. J. Mol. Graph. 1996, 14, 33–38. [Google Scholar] [CrossRef]
- OriginLab Corporation. OriginPro; Version 2016; OriginLab Corporation: Northampton, MA, USA, 2016. [Google Scholar]
- Grabowski, S.J. Hydrogen Bonds with π and σ Electrons as the Multicenter Proton Acceptors: High Level ab Initio Calculations. J. Phys. Chem. A 2007, 111, 3387–3393. [Google Scholar] [CrossRef]
- Pauling, L. The Nature of the Chemical Bond; Cornell University Press: Ithaca, NY, USA, 1960. [Google Scholar]
- Kawaguchi, K.; Hirota, E. Infrared diode laser study of the hydrogen bifluoride anion: FHF− and FDF−. J. Chem. Phys. 1986, 84, 2953–2960. [Google Scholar] [CrossRef]
- Pylaeva, S.A.; Elgabarty, H.; Sebastiani, D.; Tolstoy, P.M. Symmetry and dynamics of FHF− anion in vacuum, in CD2Cl2 and in CCl4. Ab initio MD study of fluctuating solvent–solute hydrogen and halogen bonds. Phys. Chem. Chem. Phys. 2017, 19, 26107–26120. [Google Scholar] [CrossRef] [PubMed] [Green Version]
- Grabowski, S.J. [FHF]−—The Strongest Hydrogen Bond under the Influence of External Interactions. Crystals 2016, 6, 3. [Google Scholar] [CrossRef] [Green Version]
- Politzer, P.; Riley, K.E.; Bulat, F.A.; Murray, J.S. Perspectives on halogen bonding and other σ-hole interactions: Lex parsimoniae (Occam’s Razor). Comput. Theor. Chem. 2012, 998, 2–8. [Google Scholar] [CrossRef]
- Politzer, P.; Murray, J.S.; Clark, T. Halogen bonding: An electrostatically-driven highly directional noncovalent interaction. Phys. Chem. Chem. Phys. 2010, 12, 7748–7758. [Google Scholar] [CrossRef] [PubMed]
- Politzer, P.; Murray, J.S.; Clark, T. Halogen bonding and other σ-hole interactions: A perspective. Phys.Chem. Chem. Phys. 2013, 15, 11178–11189. [Google Scholar] [CrossRef]
- Grabowski, S.J. What can be learnt from a location of bond paths and from electron density distribution. In Applications of Topological Methods in Molecular; Springer: Cham, Switzerland, 2016; pp. 399–433. [Google Scholar]
- Bader, R.F.W. Pauli repulsions exist only in the eye of the beholder. Chem. Eur. J. 2006, 12, 2896–2901. [Google Scholar] [CrossRef] [PubMed]
- Bader, R.F.W. A bond path: A universal indicator of bonded interactions. J. Phys. Chem. A 1998, 102, 7314–7323. [Google Scholar] [CrossRef]
- Bader, R.F.W. Bond paths are not chemical bonds. J. Phys. Chem. A 2009, 113, 10391–10396. [Google Scholar] [CrossRef] [PubMed] [Green Version]
- Poater, J.; Solá, M.; Bickelhaupt, F.M. Hydrogen–Hydrogen Bonding in Planar Biphenyl, Predicted by Atoms-In-Molecules Theory, Does Not Exist. Chem. Eur. J. 2006, 12, 2889–2896. [Google Scholar] [CrossRef] [PubMed]
- Poater, J.; Solá, M.; Bickelhaupt, F.M. A Model of the Chemical Bond Must Be Rooted in Quantum Mechanics, Provide Insight, and Possess Predictive Power. Chem. Eur. J. 2006, 12, 2902–2905. [Google Scholar] [CrossRef]
- Reed, E.; Curtiss, L.A.; Weinhold, F. Intermolecular interactions from a natural bond orbital, donor-acceptor viewpoint. Chem. Rev. 1988, 88, 899–926. [Google Scholar] [CrossRef]
- Alabugin, I.V.; Manoharan, M.; Peabody, S.; Weinhold, F. Electronic basis of improper hydrogen bonding: A subtle balance of hyperconjugation and rehybridization. J. Am. Chem. Soc. 2003, 125, 5973–5987. [Google Scholar] [CrossRef]
- Grabowski, S.J. Understanding Hydrogen Bonds, Theoretical and Experimental Views; The Royal Society of Chemistry: Cambridge, UK, 2021. [Google Scholar]
- Pinchas, S. Infrared Absorption of Aldehydic C-H Group. Anal. Chem. 1955, 27, 2–6. [Google Scholar] [CrossRef]
- Pinchas, S. Infrared Absorption of Aldehydic C-H Group. Anal. Chem. 1957, 29, 334–339. [Google Scholar] [CrossRef]
- Hobza, P.; Havlas, Z. Blue-shifting hydrogen bonds. Chem. Rev. 2000, 100, 4253–4264. [Google Scholar] [CrossRef] [PubMed]
- Gu, Y.; Kar, T.; Scheiner, S. Fundamental Properties of the CH···O Interaction: Is It a True Hydrogen Bond? J. Am. Chem. Soc. 1999, 121, 9411–9422. [Google Scholar] [CrossRef]
- Kryachko, E.S. Neutral Blue-Shifting and Blue-Shifted Hydrogen Bonds. In Hydrogen Bonding—New Insights; Grabowski, S.J., Ed.; Springer: Dordrecht, The Netherlands, 2006; Chapter 8; pp. 293–336. [Google Scholar]
- Kollman, P.A.; Liebman, J.F.; Allen, L.C. The Lithium Bond. J. Am. Chem. Soc. 1970, 92, 1142–1150. [Google Scholar] [CrossRef]
- McDowell, S.A.C.; Hill, J.A.S.S. A theoretical study of hydrogen- and lithium-bonded complexes of F–H/Li and Cl–H/Li with NF3, NH3, and NH2(CH3). J. Chem. Phys. 2011, 135, 164303. [Google Scholar] [CrossRef] [PubMed]
- Lipkowski, P.; Grabowski, S.J. Could the lithium bond be classified as the σ-hole bond?—QTAIM and NBO analysis. Chem. Phys. Lett. 2014, 591, 113–118. [Google Scholar] [CrossRef]


| Complex | R1 | R2 | R3 | R4 |
|---|---|---|---|---|
| Protonated systems | ||||
| C2H3+ | 1.276 | 1.276 | - | - |
| C2F2H+ | 1.095 | 2.004 | - | - |
| C2Li2H+ | 1.254 | 1.254 | - | - |
| C2H3+-C2H2 | 1.405 | 1.406 | 1.828 | 1.828 |
| C2H3+-C2F2 | 1.363 | 1.364 | 1.927 | 1.929 |
| C2F2H+-C2F2 | 1.394 | 1.916 | 1.394 | 1.916 |
| C2Li2H+-C2F2 | 1.259 | 1.259 | 2.593 | 2.595 |
| C2H3+-H2 | 1.286 | 1.286 | 1.942 | 1.942 |
| C2F2H+-H2 | 1.100 | 1.995 | 2.117 | 2.117 |
| C2Li2H+-H2 | 1.255 | 1.255 | 2.569 | 2.569 |
| Lithium species | ||||
| C2H2Li+ | 2.327 | 2.327 | - | - |
| C2F2Li+ | 2.438 | 2.438 | - | - |
| C2Li3+ | 2.082 | 2.082 | - | - |
| C2H2Li+-C2H2 | 2.342 | 2.342 | 2.342 | 2.342 |
| C2H2Li+-C2F2 | 2.323 | 2.336 | 2.442 | 2.472 |
| C2F2Li+-C2F2 | 2.436 | 2.447 | 2.436 | 2.448 |
| C2Li3+-C2H2 | 2.102 | 2.102 | 2.397 | 2.397 |
| C2Li3+-C2F2 | 2.091 | 2.091 | 2.496 | 2.508 |
| C2Li3+-C2Li2 | 2.174 | 2.175 | 2.175 | 2.175 |
| C2H2Li+-H2 | 2.332 | 2.333 | 2.068 | 2.071 |
| C2F2Li+-H2 | 2.444 | 2.445 | 2.059 | 2.062 |
| C2Li3+-H2 | 2.089 | 2.089 | 2.126 | 2.126 |
| Complex | Eint | Ebin | Edef | BSSE |
|---|---|---|---|---|
| Protonated systems | ||||
| C2H3+-C2H2 | −20.3 | −15.9 | 4.3 | 1.1 |
| C2H3+-C2F2 | −10.7 | −8.3 | 2.4 | 1.2 |
| C2F2H+-C2F2 | −29.4 | −5.6 | 23.9 | 1.9 |
| C2Li2H+-C2F2 | −1.5 | −1.5 | 0.0 | 0.7 |
| C2H3+-H2 | −2.9 | −2.9 | 0.1 | 0.2 |
| C2F2H+-H2 | −1.8 | −1.8 | 0.0 | 0.2 |
| C2Li2H+-H2 | −0.6 | −0.6 | 0.0 | 0.1 |
| Lithium species | ||||
| C2H2Li+-C2H2 | −17.9 | −17.6 | 0.3 | 0.6 |
| C2H2Li+-C2F2 | −8.7 | −8.4 | 0.3 | 0.9 |
| C2F2Li+-C2F2 | −9.6 | −9.2 | 0.3 | 1.0 |
| C2Li3+-C2H2 | −12.2 | −12.0 | 0.2 | 0.7 |
| C2Li3+-C2F2 | −5.1 | −4.9 | 0.2 | 0.9 |
| C2Li3+-C2Li2 | −52.0 | −49.6 | 2.4 | 1.1 |
| C2H2Li+-H2 | −5.0 | −5.0 | 0.0 | 0.2 |
| C2F2Li+-H2 | −5.3 | −5.3 | 0.0 | 0.2 |
| C2Li3+-H2 | −3.3 | −3.3 | 0.0 | 0.2 |
| Complex | Eelst | Eexch | Eind | Edisp | |
|---|---|---|---|---|---|
| Protonated systems | |||||
| C2H3+-C2H2 | −19.29 | 36.50 | −27.45 | −9.33 | −19.56 |
| C2H3+-C2F2 | −7.93 | 25.30 | −19.19 | −7.38 | −9.19 |
| C2F2H+-C2F2 | −15.12 | 64.96 | −66.38 | −15.56 | −32.10 |
| C2Li2H+-C2F2 | −1.52 | 4.24 | −1.34 | −2.86 | −1.48 |
| C2H3+-H2 | −2.21 | 4.78 | −3.51 | −1.57 | −2.51 |
| C2F2H+-H2 | −1.33 | 2.35 | −1.86 | −0.88 | −1.72 |
| C2Li2H+-H2 | −0.53 | 0.84 | −0.28 | −0.61 | −0.58 |
| Lithium species | |||||
| C2H2Li+-C2H2 | −13.08 | 7.75 | −11.78 | −0.92 | −18.03 |
| C2H2Li+-C2F2 | −2.44 | 5.31 | −10.05 | −1.61 | −8.78 |
| C2F2Li+-C2F2 | −2.66 | 6.17 | −11.04 | −2.22 | −9.73 |
| C2Li3+-C2H2 | −10.28 | 6.37 | −7.08 | −1.36 | −12.36 |
| C2Li3+-C2F2 | −2.43 | 4.63 | −5.78 | −1.66 | −5.24 |
| C2Li3+-C2Li2 | −53.69 | 19.70 | −15.60 | −2.82 | −52.41 |
| C2H2Li+-H2 | −2.35 | 2.51 | −4.94 | −0.28 | −5.07 |
| C2F2Li+-H2 | −2.42 | 2.61 | −5.33 | −0.26 | −5.41 |
| C2Li3+-H2 | −1.94 | 1.98 | −2.97 | −0.40 | −3.32 |
| Complex | ρBCP * | HBCP * | ρBCP ** | HBCP ** |
|---|---|---|---|---|
| Protonated systems | ||||
| C2H3+-C2H2 | 0.152 | −0.106 | 0.057 | −0.020 |
| C2H3+-C2F2 | 0.168 | −0.120 | 0.048 | −0.014 |
| C2F2H+-C2F2 | 0.126 | −0.083 | 0.126 | −0.083 |
| C2Li2H+-C2F2 | 0.297 | −0.159 | 0.011 | 0.001 |
| C2H3+-H2 | 0.201 | −0.154 | 0.017 | 0.000 |
| C2F2H+-H2 | 0.281 | −0.327 | 0.011 | 0.001 |
| C2Li2H+-H2 | 0.208 | −0.161 | 0.004 | 0.001 |
| Lithium species | ||||
| C2H2Li+-C2H2 | 0.018 | 0.003 | 0.018 | 0.003 |
| C2H2Li+-C2F2 | 0.019 | 0.004 | 0.013 | 0.003 |
| C2F2Li+-C2F2 | 0.015 | 0.003 | 0.015 | 0.003 |
| C2Li3+-C2H2 | 0.031 | 0.003 | 0.015 | 0.003 |
| C2Li3+-C2F2 | 0.032 | 0.003 | 0.012 | 0.003 |
| C2Li3+-C2Li2 | 0.026 | 0.003 | 0.026 | 0.003 |
| C2H2Li+-H2 | 0.019 | 0.003 | 0.012 | 0.003 |
| C2F2Li+-H2 | 0.015 | 0.003 | 0.012 | 0.003 |
| C2Li3+-H2 | 0.032 | 0.003 | 0.010 | 0.003 |
| Complex | L.acid | QLi/H | QLa-part | L.base |
|---|---|---|---|---|
| Protonated systems | ||||
| C2H3+-C2H2 | 0.296 | 0.395 | −0.099 | 0.704 |
| C2H3+-C2F2 | 0.112 | 0.366 | −0.254 | 0.888 |
| C2F2H+-C2F2 | 0.655 | 0.311 | 0.345 | 0.345 |
| C2Li2H+-C2F2 | 0.164 | 0.222 | −0.058 | 0.836 |
| C2H3+-H2 | 0.978 | 0.333 | 0.645 | 0.022 |
| C2F2H+-H2 | 0.987 | 0.295 | 0.692 | 0.013 |
| C2Li2H+-H2 | 0.999 | 0.217 | 0.782 | 0.001 |
| Lithium species | ||||
| C2H2Li+-C2H2 | 0.409 | 0.931 | −0.522 | 0.591 |
| C2H2Li+-C2F2 | 0.220 | 0.938 | −0.718 | 0.780 |
| C2F2Li+-C2F2 | 0.972 | 0.944 | 0.028 | 0.028 |
| C2Li3+-C2H2 | 0.387 | 0.911 | −0.524 | 0.613 |
| C2Li3+-C2F2 | 0.208 | 0.916 | −0.708 | 0.792 |
| C2Li3+-C2Li2 | 0.950 | 0.900 | 0.050 | 0.050 |
| C2H2Li+-H2 | 0.985 | 0.948 | 0.037 | 0.015 |
| C2F2Li+-H2 | 0.984 | 0.954 | 0.030 | 0.016 |
| C2Li3+-H2 | 0.999 | 0.923 | 0.076 | 0.001 |
Publisher’s Note: MDPI stays neutral with regard to jurisdictional claims in published maps and institutional affiliations. |
© 2021 by the authors. Licensee MDPI, Basel, Switzerland. This article is an open access article distributed under the terms and conditions of the Creative Commons Attribution (CC BY) license (https://creativecommons.org/licenses/by/4.0/).
Share and Cite
Aarabi, M.; Gholami, S.; Grabowski, S.J. Hydrogen and Lithium Bonds—Lewis Acid Units Possessing Multi-Center Covalent Bonds. Molecules 2021, 26, 6939. https://doi.org/10.3390/molecules26226939
Aarabi M, Gholami S, Grabowski SJ. Hydrogen and Lithium Bonds—Lewis Acid Units Possessing Multi-Center Covalent Bonds. Molecules. 2021; 26(22):6939. https://doi.org/10.3390/molecules26226939
Chicago/Turabian StyleAarabi, Mohammad, Samira Gholami, and Sławomir J. Grabowski. 2021. "Hydrogen and Lithium Bonds—Lewis Acid Units Possessing Multi-Center Covalent Bonds" Molecules 26, no. 22: 6939. https://doi.org/10.3390/molecules26226939
APA StyleAarabi, M., Gholami, S., & Grabowski, S. J. (2021). Hydrogen and Lithium Bonds—Lewis Acid Units Possessing Multi-Center Covalent Bonds. Molecules, 26(22), 6939. https://doi.org/10.3390/molecules26226939