
Nanostructured Silicon as Potential Anode Material for Li-Ion Batteries

 , ,
, , 
Abstract
1. Introduction
2. Results and Discussions
3. Materials and Methods
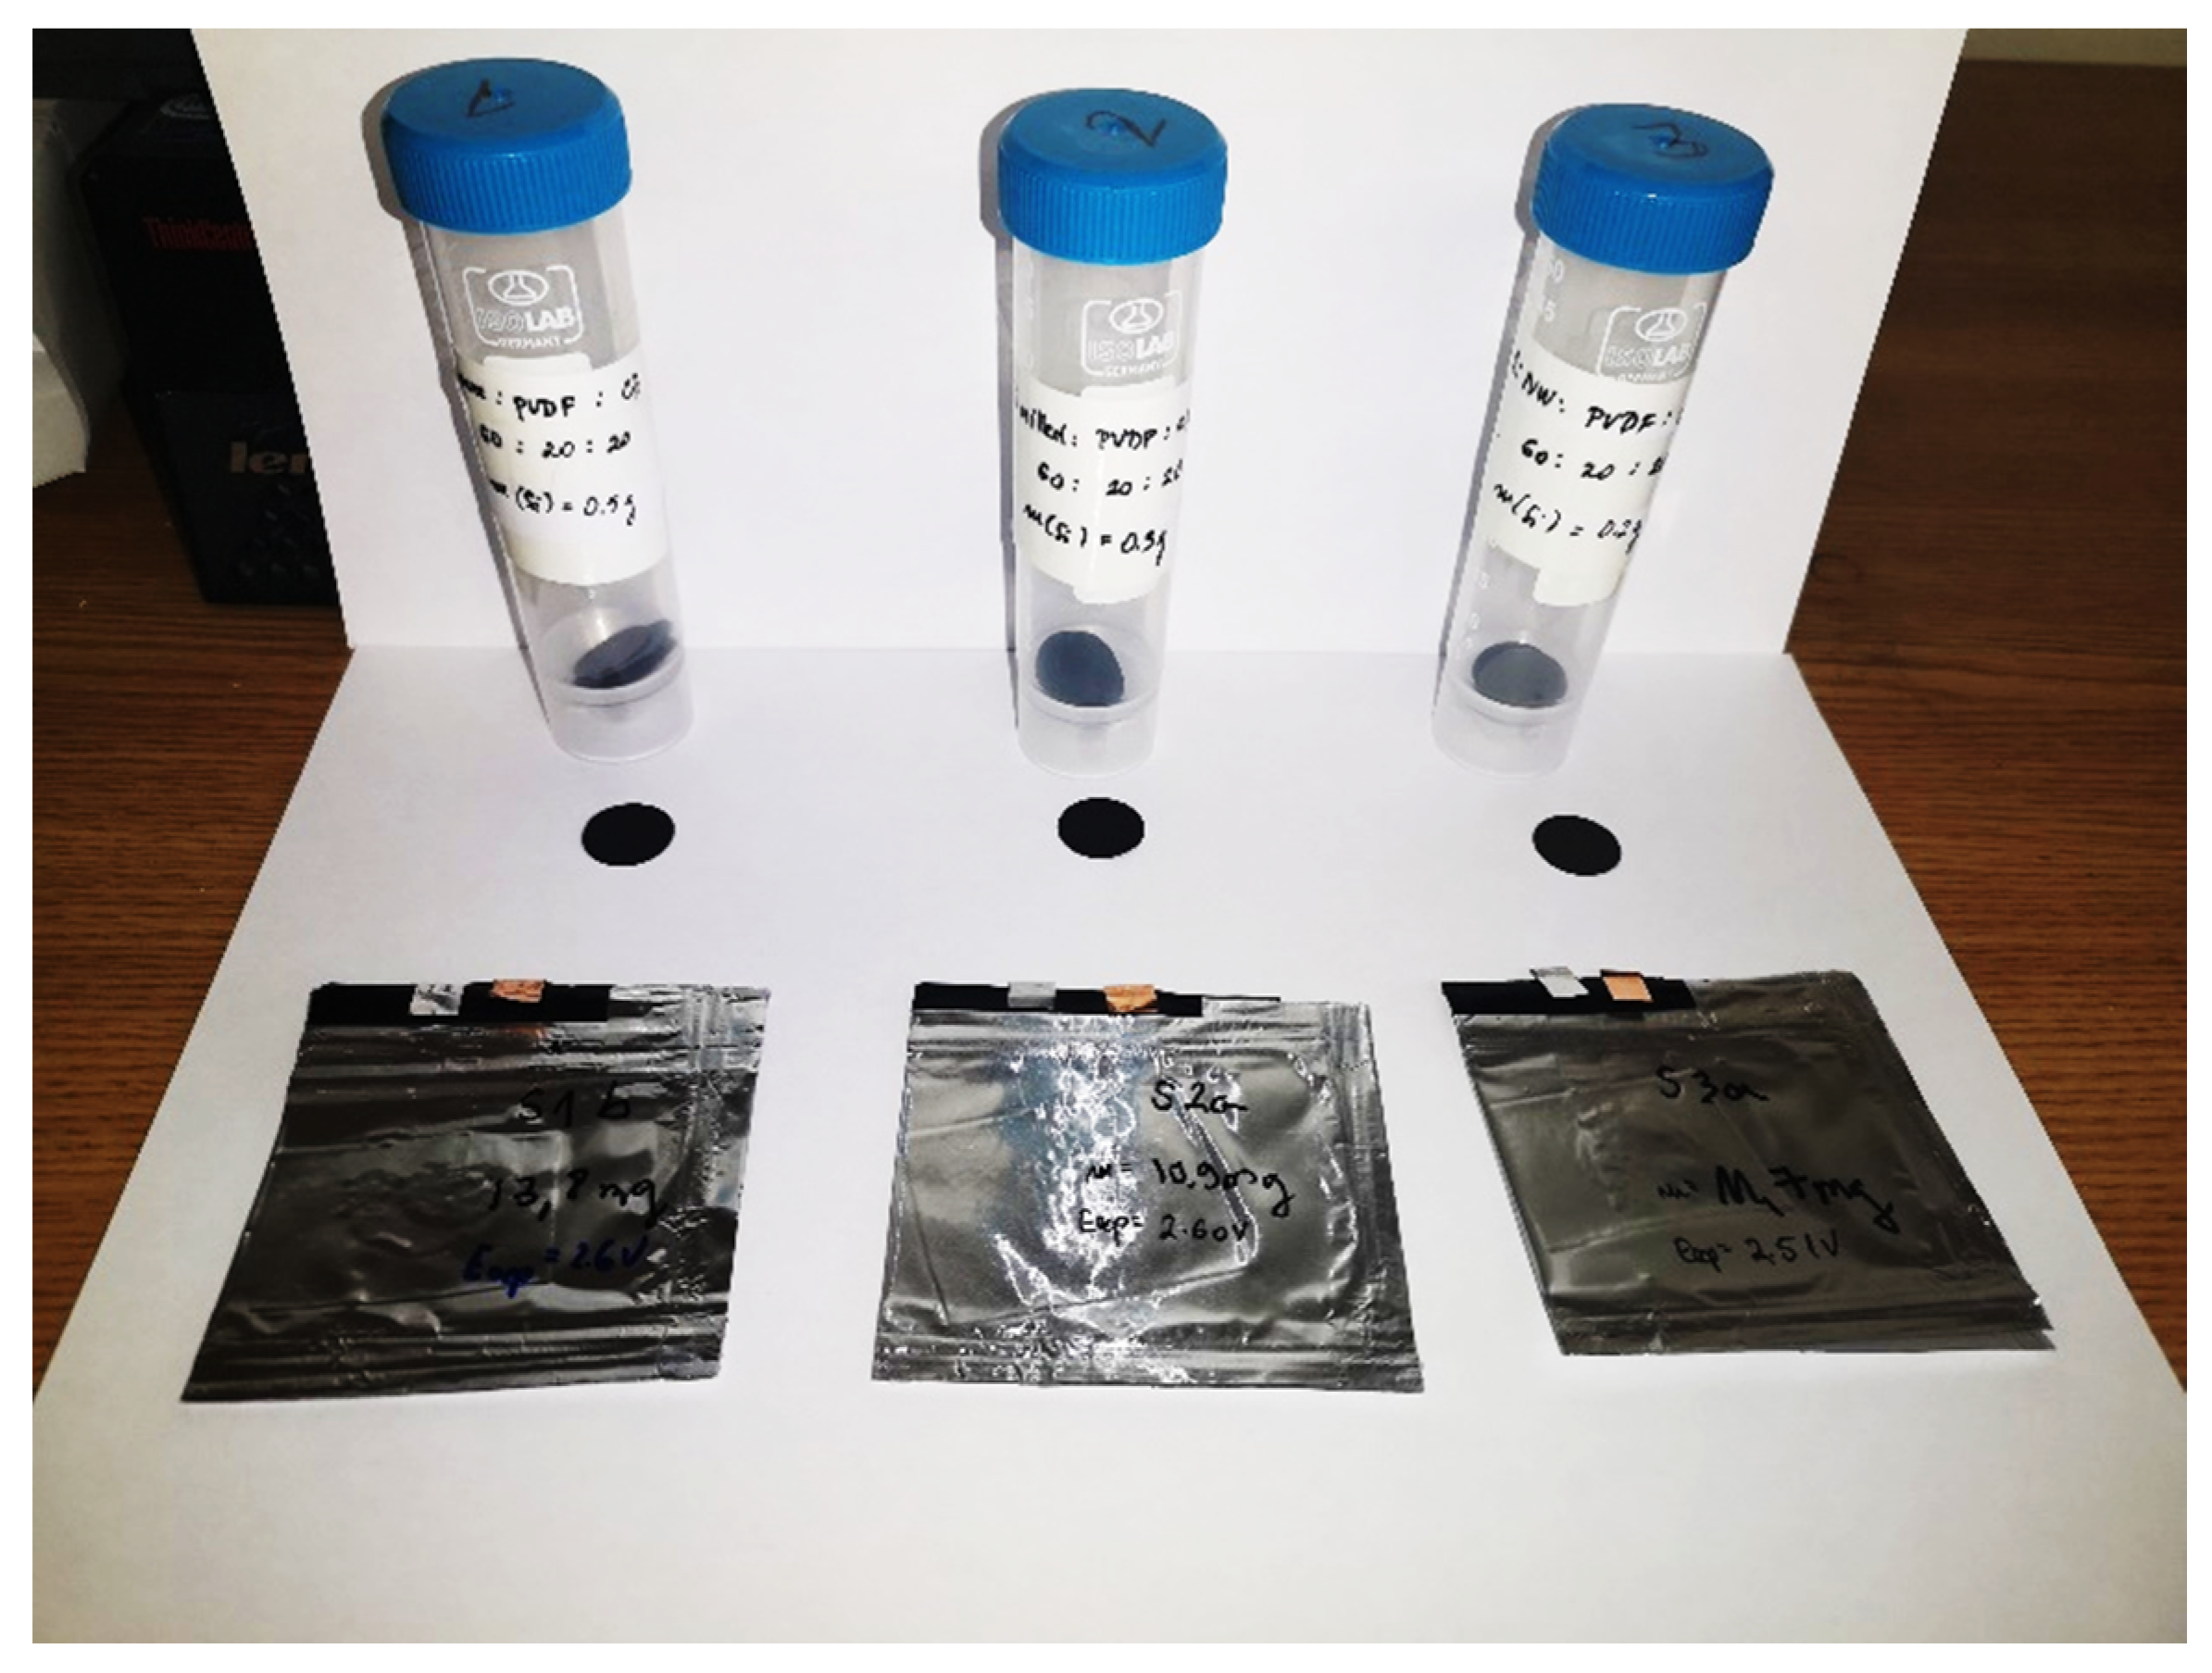
3.1. Sample Preparation
3.1.1. Sample S1
3.1.2. Sample S2
3.1.3. Sample S3
3.1.4. Electrode Preparation
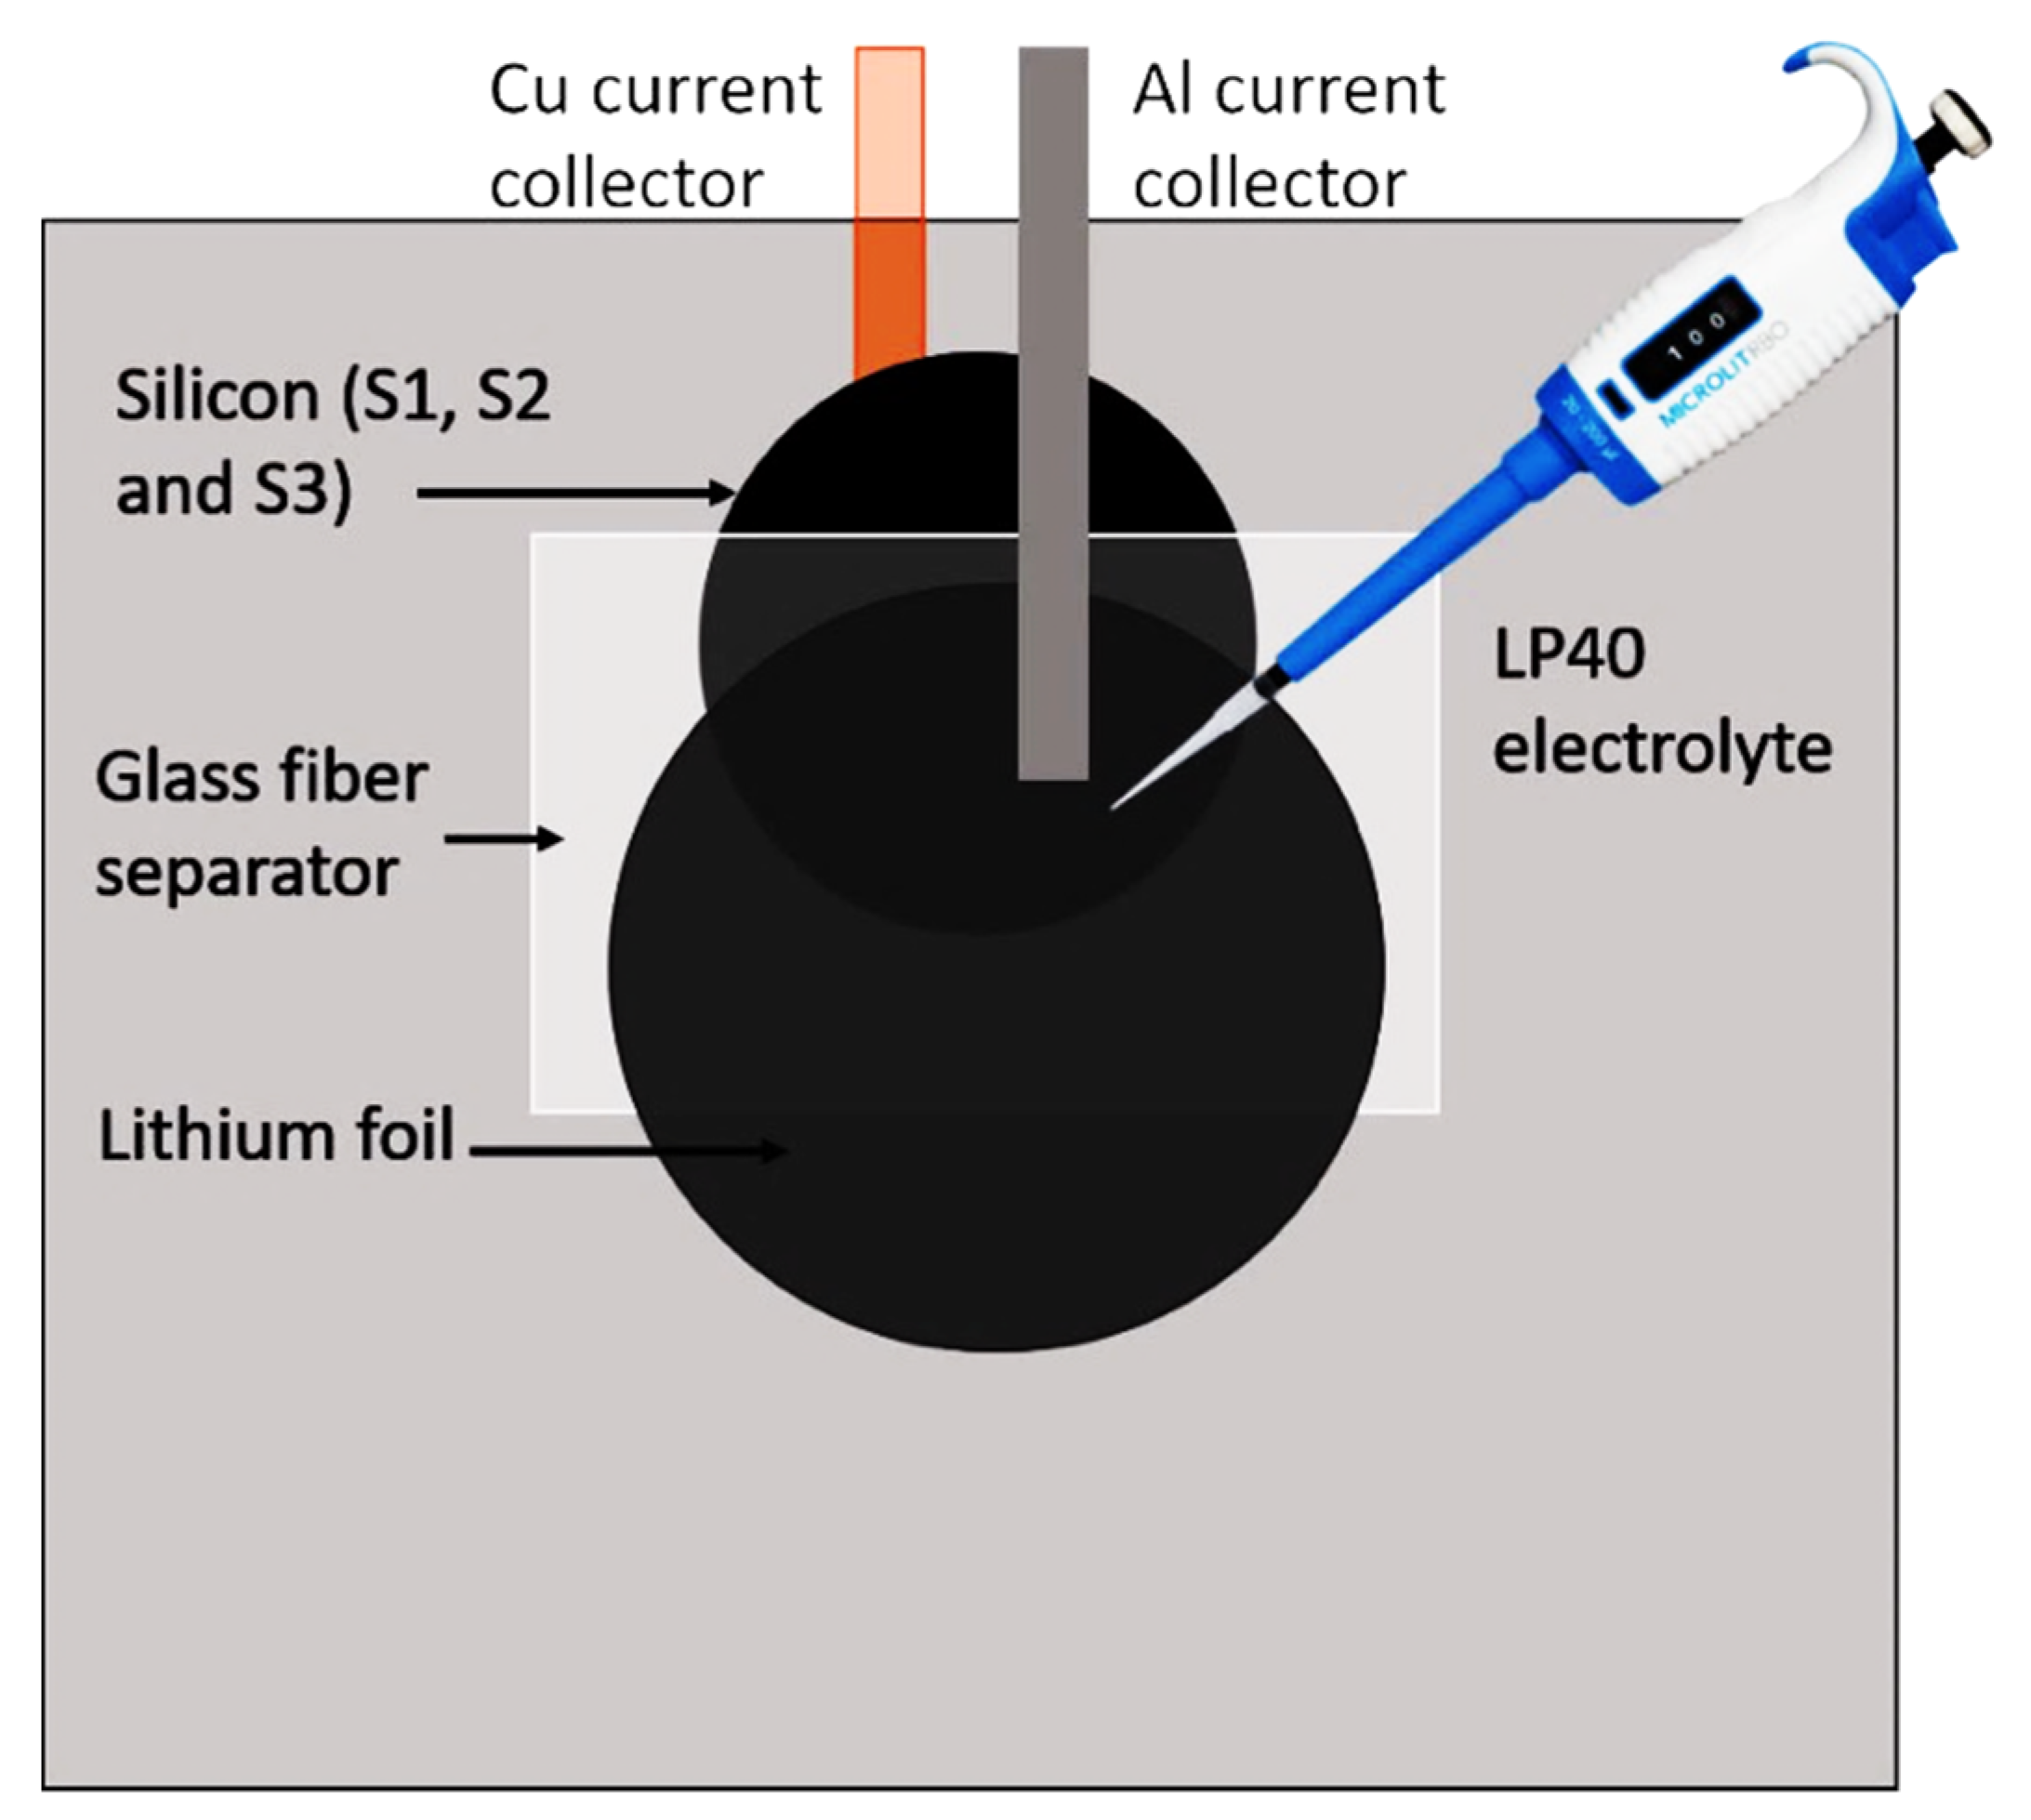
3.1.5. Battery Assembly
3.2. Instrumental Analysis
4. Conclusions
Author Contributions
Funding
Conflicts of Interest
References
- Jin, Y.; Zhu, B.; Lu, Z.; Liu, N.; Zhu, J. Challenges and recent progress in the development of Si anodes for lithium-ion battery. Adv. Energy Mater 2017, 7, 1700715. [Google Scholar] [CrossRef]
- Kasavajjula, U.; Wang, C.; Appleby, A.J. Nano- and bulk-silicon based insertion anodes for lithium-ion secondary cells. J. Power Sources 2007, 163, 1003–1039. [Google Scholar] [CrossRef]
- Lammer, M.; Königseder, A.; Gluschit, P.; Hacker, V. Influence of aging on the heat and gas emission from commercial lithium ion cells in case of thermal failure. J. Electrochem. Sci. Eng. 2018, 8, 101–110. [Google Scholar] [CrossRef]
- Zuo, X.; Zhu, J.; Műller-Buschbaum, P.; Cheng, Y.-J. Silicon based lithium ion battery anodes: A chronicle perspective review. Nano Energy 2017, 31, 113–143. [Google Scholar] [CrossRef]
- Lee, J.W.; Yogesh, K.; Anguchamy, K.; Popov, B.N. Simulation of charge-discharge cycling of lithium-ion batteries under low-earth-orbit conditions. J. Power Sources 2006, 162, 1395–1400. [Google Scholar] [CrossRef]
- Broussely, M.; Biensan, P.; Simon, B. Lithium insertion into host material s: The key to success for Li ion batteries. Electrochim. Acta 1999, 45, 3–22. [Google Scholar] [CrossRef]
- Mohri, M.; Yanagisawa, N.; Tajima, Y.; Mitate, H.; Nakajima, S.; Yoshida, M.; Yosimoto, Y.; Suzuki, T.; Wada, H. Recheargable lithium battery based on pyrolytic carbon as a negative electrode. J. Power Sources 1989, 26, 545–551. [Google Scholar] [CrossRef]
- Ozawa, K. Lithium-ion rechargeable batteries with LiCoO2 and carbon electrodes: The LiCoO2/C system. Solid State Ionics 1994, 69, 212–221. [Google Scholar] [CrossRef]
- Li, P.; Zhao, G.; Zheng, X.; Xu, X.; Yao, C.; Sun, W. Recent progress on silicon-based anode materials for practical lithium-ion battery applications. Energy Storage Mater. 2018, 15, 422–446. [Google Scholar] [CrossRef]
- Armand, M.; Tarascon, M. Building better batteries. Nature 2008, 451, 652–657. [Google Scholar] [CrossRef]
- Padhi, A.K.; Nanjundaswamy, K.S.; Goodenough, J.M. Phospho-olivines as positive-electrode materials for rechargeable lithium batteries. J. Electrochem. Soc. 1997, 144, 1188–1194. [Google Scholar] [CrossRef]
- Chekannikov, A.; Novikova, S.; Kulova, T.; Skundin, A.; Yaroslavtsev, A. Electrochemical study of doped LiFePO4 as a cathode material for lithium-ion battery. J. Electrochem. Sci. Eng. 2016, 6, 1–8. [Google Scholar] [CrossRef][Green Version]
- Dominko, R.; Bele, M.; Kokalj, A.; Gaberscek, M.; Jamnik, J. Li2MnSiO4 as a potential Li-battery cathode material. J. Power Sources 2007, 174, 457–461. [Google Scholar] [CrossRef]
- Dominko, R.; Bele, M.; Gaberscek, M.; Meden, A.; Remškar, M.; Jamnik, J. Structure and electrochemical performance of Li2MnSiO4 and Li2FeSiO4 as potential Li-battery cathode materials. Electrochem. Commun. 2006, 8, 217–222. [Google Scholar] [CrossRef]
- Huang, B.; Zhao, Z.; Sun, Y.; Wang, M.; Chen, L.; Gu, Y. Lithium-ion conductor LiAlO2 coated LiNi0.8Mn0.1Co0.1O2 as cathode material for lithium-ion batteries. Solid State Ionics 2019, 338, 31–38. [Google Scholar] [CrossRef]
- Salah, M.; Murphy, P.; Hall, C.; Francis, C.; Kerr, R.; Fabretto, M. Pure silicon thin-film anode for lithium-ion batteries: A review. J. Power Sources 2019, 414, 48–67. [Google Scholar] [CrossRef]
- Huang, B.; Pan, Z.; Su, X.; An, L. Tin-based materials as versatile anodes for alkali(earth)-ion batteries. J. Power Sources 2018, 395, 41–59. [Google Scholar] [CrossRef]
- Liu, L.; Xie, F.; Lyu, J.; Zhao, T.; Li, T.; Gill Choi, B. Tin-based anode materials with well-designed architectures for next-generation lithium-ion batteries. J. Power Sources 2016, 321, 11–35. [Google Scholar] [CrossRef]
- Simon, P.; Gogotsi, Y. Materials for electrochemical capacitors. Nat. Mater. 2008, 7, 845–854. [Google Scholar] [CrossRef]
- Kang, B.; Ceder, G. Battery materials for ultrafast charging and discharging. Nature 2009, 458, 190–193. [Google Scholar] [CrossRef]
- Arico, A.S.; Bruce, P.; Scrosati, B.; Tarascon, J.M.; Van Schalkwijk, W. Nanostructured materials for advanced energy conversion and storage devices. Nat. Mater. 2005, 4, 366–377. [Google Scholar] [CrossRef] [PubMed]
- Wang, M.S.; Song, W.I.; Fan, I.Z. Three-dimensional interconnected network of graphene-wrapped silicon/carbon nanofiber hybrids for binder-free anodes in lithium-ion batteries. ChemElectroChem 2015, 2, 1699–1706. [Google Scholar] [CrossRef]
- Jin, Y.; Li, S.; Kushima, A.; Zheng, X.; Sun, Y.; Xie, J.; Sun, J.; Xue, W.; Zhou, G.; Wu, J.; et al. Self-healing SEI enables full-cell cycling of a silicon-majority anode with a coulombic efficiency exceeding 99.9%. Energy Environ. Sci. 2017, 10, 580–592. [Google Scholar] [CrossRef]
- Li, J.; Xu, Q.; Li, G.; Yin, Y.; Wan, L.; Guo, Q. Research progress regarding Si-based anode materials toward practical application in high energy density Li-ion batteries. Mater. Chem. Front. 2017, 1, 1691. [Google Scholar] [CrossRef]
- Magasinski, A.; Dixon, P.; Hertzberg, B.; Kvit, A.; Ayala, J.; Yushin, G. High-performance lithium-ion anodes using a hierarchical bottom-up approach. Nat. Mater. 2010, 9, 353–358. [Google Scholar] [CrossRef]
- Wang, W.; Favors, Z.; Ionescu, R.; Ye, R.; Bay, H.H.; Ozkan, M.; Ozkan, C.S. Monodisperse porous silicon spheres as anode materials for lithium-ion batteries. Nature 2015, 5, 8781. [Google Scholar] [CrossRef]
- Ikonen, T.; Nissinen, T.; Pohjalainen, E.; Sorsa, O.; Kallio, T.; Lehto, V.P. Electrochemically anodized porous silicon: Towards simple and affordable anode material for Li-ion batteries. Nature 2017, 7, 7880. [Google Scholar] [CrossRef]
- Cui, L.F.; Yang, Y.; Hsu, C.M.; Cui, Y. Carbon-silicon core-shell nanowires as high capacity electrode for lithium ion batteries. Nano Lett. 2009, 9, 3370–3374. [Google Scholar] [CrossRef]
- Kim, B.; Ahn, Y.; Oh, J.; Tan, D.; Lee, J.; Moon, J. Highly porous carbon-coated silicon nanoparticles with canyon-like surfaces as high-performance anode material for Li-ion batteries. J. Mater. Chem. A 2018, 6, 3028–3037. [Google Scholar] [CrossRef]
- Li, Y.; Yan, K.; Lee, H.W.; Lu, Z.; Liu, N.; Cui, Y. Growth of conformal graphene cages on micrometer-sized silicon particles as stable battery anodes. Nature Energy 2016, 1. [Google Scholar] [CrossRef]
- Wang, M.S.; Wang, Z.Q.; Jia, R.; Yang, Y.; Zhu, F.Y.; Yang, Z.L.; Huang, Y.; Li, X.; Xu, W. Facile electrostatic self-assembly of silicon/reduced graphene oxide porous composite by silica assist as high-performance anode for Li-ion battery. Appl. Surf. Sci. 2018, 456, 379–389. [Google Scholar] [CrossRef]
- Li, J.; Lewis, R.B.; Dahn, J.R. Sodium Carboxymethyl cellulose- a potential binder for Si negative electrodes for Li-ion batteries. Electrochem. Solid-State Lett. 2007, 10, A17–A20. [Google Scholar] [CrossRef]
- Mi, H.; Yang, X.; Li, F.; Zhuang, X.; Chen, C.; Li, Y.; Zhang, P. Self-healing silicon-sodium alfinate-polyaniline composites originated from the enhancement hydrogen bonding for lithium-ion battery: A combined simulation and experiment study. J. Power Sources 2019, 412, 749–758. [Google Scholar] [CrossRef]
- Liu, J.; Zhang, Q.; Zhang, T.; Li, J.T.; Huang, L.; Sun, S.G. A robust ion-conductive biopolymer as a binder for Si anodes of Lithium-ion batteries. Adv. Funct. Mater. 2015, 25, 3599–3605. [Google Scholar] [CrossRef]
- Liu, D.; Zhao, Y.; Tan, R.; Tian, L.L.; Liu, Y.; Chen, H.; Pan, F. Novel conductive binder for high-performance silicon anode sin lithium ion batteries. Nano Energy 2017, 36, 206–212. [Google Scholar] [CrossRef]
- Ge, M.; Fang, X.; Rong, J.; Zhou, C. Review of porous silicon preparation and its application for lithium-ion battery anodes. Nanotechnology 2013, 24, 422001. [Google Scholar] [CrossRef]
- Xu, Y.; Borsa, D.M.; Mulder, F.M. Engineering the direct deposition of Si nanoparticles for improved performance in Li-ion batteries. J. Electrochem. Soc. 2019, 166, A5252–A5258. [Google Scholar] [CrossRef]
- Fang, G.; Deng, X.; Zou, J.; Zeng, X. Amorphous/ordered dual carbon coated silicon nanoparticles as anode to enhance cycle performance in lithium ion batteries. Electrochimica Acta 2019, 295, 498–506. [Google Scholar] [CrossRef]
- Hwang, C.; Lee, K.; Um, H.D.; Lee, Y.; Seo, K.; Song, H.K. Conductive and porous silicon nanowire anodes for lithium ion batteries. J. Electrochem. Soc. 2017, 164, A1564–A1568. [Google Scholar] [CrossRef]
- Chen, X.; Bi, Q.; Sajjad, M.; Wang, X.; Ren, Y.; Zhou, X.; Xu, W.; Liu, Z. One-dimensional porous silicon nanowires with large surface area for fast charge-discharge lithium-ion batteries. Nanomaterials 2018, 8, 285. [Google Scholar] [CrossRef]
- Schmerling, M.; Fenske, D.; Peters, F.; Schwenzel, J.; Busse, M. Lithiation behavior of silicon nanowire anodes for lithium-ion batteries: Impact of functionalization and porosity. Chem. Phys. Chem. 2018, 19, 123–129. [Google Scholar] [CrossRef] [PubMed]
- Zhang, F.; Wan, L.; Chen, J.; Li, X.; Yan, X. Crossed carbon skeleton enhances the electrochemical performance of porous silicon nanowires for lithium ion battery anode. Electrochimica Acta 2018, 280, 86–93. [Google Scholar] [CrossRef]
- Lutterotti, L.; Matthies, S.; Wenk, H.R. Texture analysis of complex earth materials from neutron diffraction spectra. In Proceedings of the 12th International Conference on Textures of Materials (ICOTOM-12), Montreal, Canada, 9–13 August 1999; p. 1599. [Google Scholar]
- Thommes, M.; Kaneko, K.; Neimark, A.V.; Olivier, J.P.; Rodriguez-Reinoso, F.; Rouquerol, J.; Sing, K.S.W. Physisorption of gases, with special reference to the evaluation of surface area and pore size distribution (IUPAC Technical Report). Pure Appl. Chem. 2015, 87, 1051–1069. [Google Scholar] [CrossRef]
- Rouquerol, F.; Sing, K.S.W.; Maurin, G.; Rouquerol, J.; Llewellyn, P. Adsorption by Powders and Porous Solids; Academic Press: Cambridge, MA, USA, 2012. [Google Scholar]
- Gunko, V.M.; Voronin, E.F.; Mironyuk, I.F.; Leboda, R.; Skubiszewska-Zieba, J.; Pakhlov, E.M.; Guzenko, N.V.; Chuiko, A.A. The effect of heat, adsoprtion and mechanochemical treatments on stuck structure and adsorption properties of fumed silicas. Colloids Surf. A Physicochem. Eng. Aspects 2003, 218, 125–135. [Google Scholar] [CrossRef]
- Lowell, S.; Shields, J.E.; Thomas, M.A.; Thommes, M. Characterization of Porous Solids and Powders: Surface Area, Pore Size and Density, 3rd ed.; Springer: Dordrecht, The Netherland, 2006. [Google Scholar]
- Klassen, T.; Oehring, M.; Bormann, R. Microscopic mechanisms of metastable phase formation during ball milling of intermetallic TiAl phases. Acta Mater. 1997, 45, 3935–3948. [Google Scholar] [CrossRef]
- Kulnitskiy, B.; Annenkov, M.; Perezhogin, I.; Popov, M.; Ovsyannikov, D.; Blank, V. Mutual transformation between crystalline phases in silicon after treatment in a planetary mill: HRTEM studies. Acta Cryst. 2016, B72, 733–737. [Google Scholar] [CrossRef]
- Balzar, D.; Ledbetter, H. Voigt-function in Fourier analysis of size- and strain-broadened X-ray diffraction peaks. J. Appl. Cryst. 1993, 26, 97–103. [Google Scholar] [CrossRef]
- Warren, B.E. X-ray Diffraction; Addison-Wesley: Boston, MA, USA, 1969. [Google Scholar]
- Balzar, D. BREADTH—a program for analyzing diffraction line broadening. J. Appl. Cryst. 1995, 28, 244–245. [Google Scholar] [CrossRef]
- Howard, S.A. A system for X-ray powder diffraction pattern analysis. Adv. X-Ray Anal. 1989, 32, 523–530. [Google Scholar]
- Štefanić, G.; Krehula, S.; Štefanić, I. Phase development during high-energy ball-milling of zinc oxide and iron—the impact of grain size on the source and the degree of contamination. Dalton Trans. 2015, 4, 18870–18881. [Google Scholar] [CrossRef]
- Unifantowicz, P.; Vaucher, S.; Lewandowska, M.; Kurzydlowski, K.J. Structural changes of silicon upon high-energy milling investigated by Raman spectroscopy. J. Phys. Condens. Matter 2008, 20, 025205. [Google Scholar] [CrossRef]
- Ristić, D.; Ivanda, M.; Furić, K.; Chiasera, A.; Moser, E.; Ferrari, M. Thermal decomposition of silicon-rich oxides deposited by the LPCVD method. Croatica Chemica Acta 2012, 85, 91–96. [Google Scholar] [CrossRef]
- Ouertani, R.; Hamdi, A.; Amri, C.; Khalifa, M.; Ezzaouia, H. Formation of silicon nanowire packed films from metallurgical-grade silicon powder using two-step metal-assisted chemical etching method. Nanoscale Res. Lett. 2014, 9, 574. [Google Scholar] [CrossRef] [PubMed]
- Majoul, N.; Aouida, S.; Bessais, B. Progress of porous silicon APTES-functionalization by FTIR investigations. Appl. Surf. Sci. 2015, 331, 388–391. [Google Scholar] [CrossRef]
- Obrovac, M.; Christensen, L. Structural changes in silicon anodes during lithium insertion/extraction. Electrochem. Solid-State Lett. 2004, 7, A93–A96. [Google Scholar] [CrossRef]
- Gauthier, M.; Mazouzi, D.; Reyter, D.; Lestriez, B.; Moreau, P.; Guyomard, D.; Roue, L. A low-cost and high-performance ball-milled Si-based negative electrode for high-energy Li-ion batteries. Energy Environ. Sci. 2013, 6, 2145. [Google Scholar] [CrossRef]
- To, W.K.; Tsang, C.H.; Li, H.H.; Huang, Z. Fabrication of n-Type Mesoporous Silicon Nanowires by One-Step Etching. Nano Lett. 2011, 11, 5252–5258. [Google Scholar] [CrossRef]
- Rietveld, H.M. A profile refinement method for nuclear and magnetic structures. J. Appl. Cryst. 1969, 2, 65–71. [Google Scholar] [CrossRef]


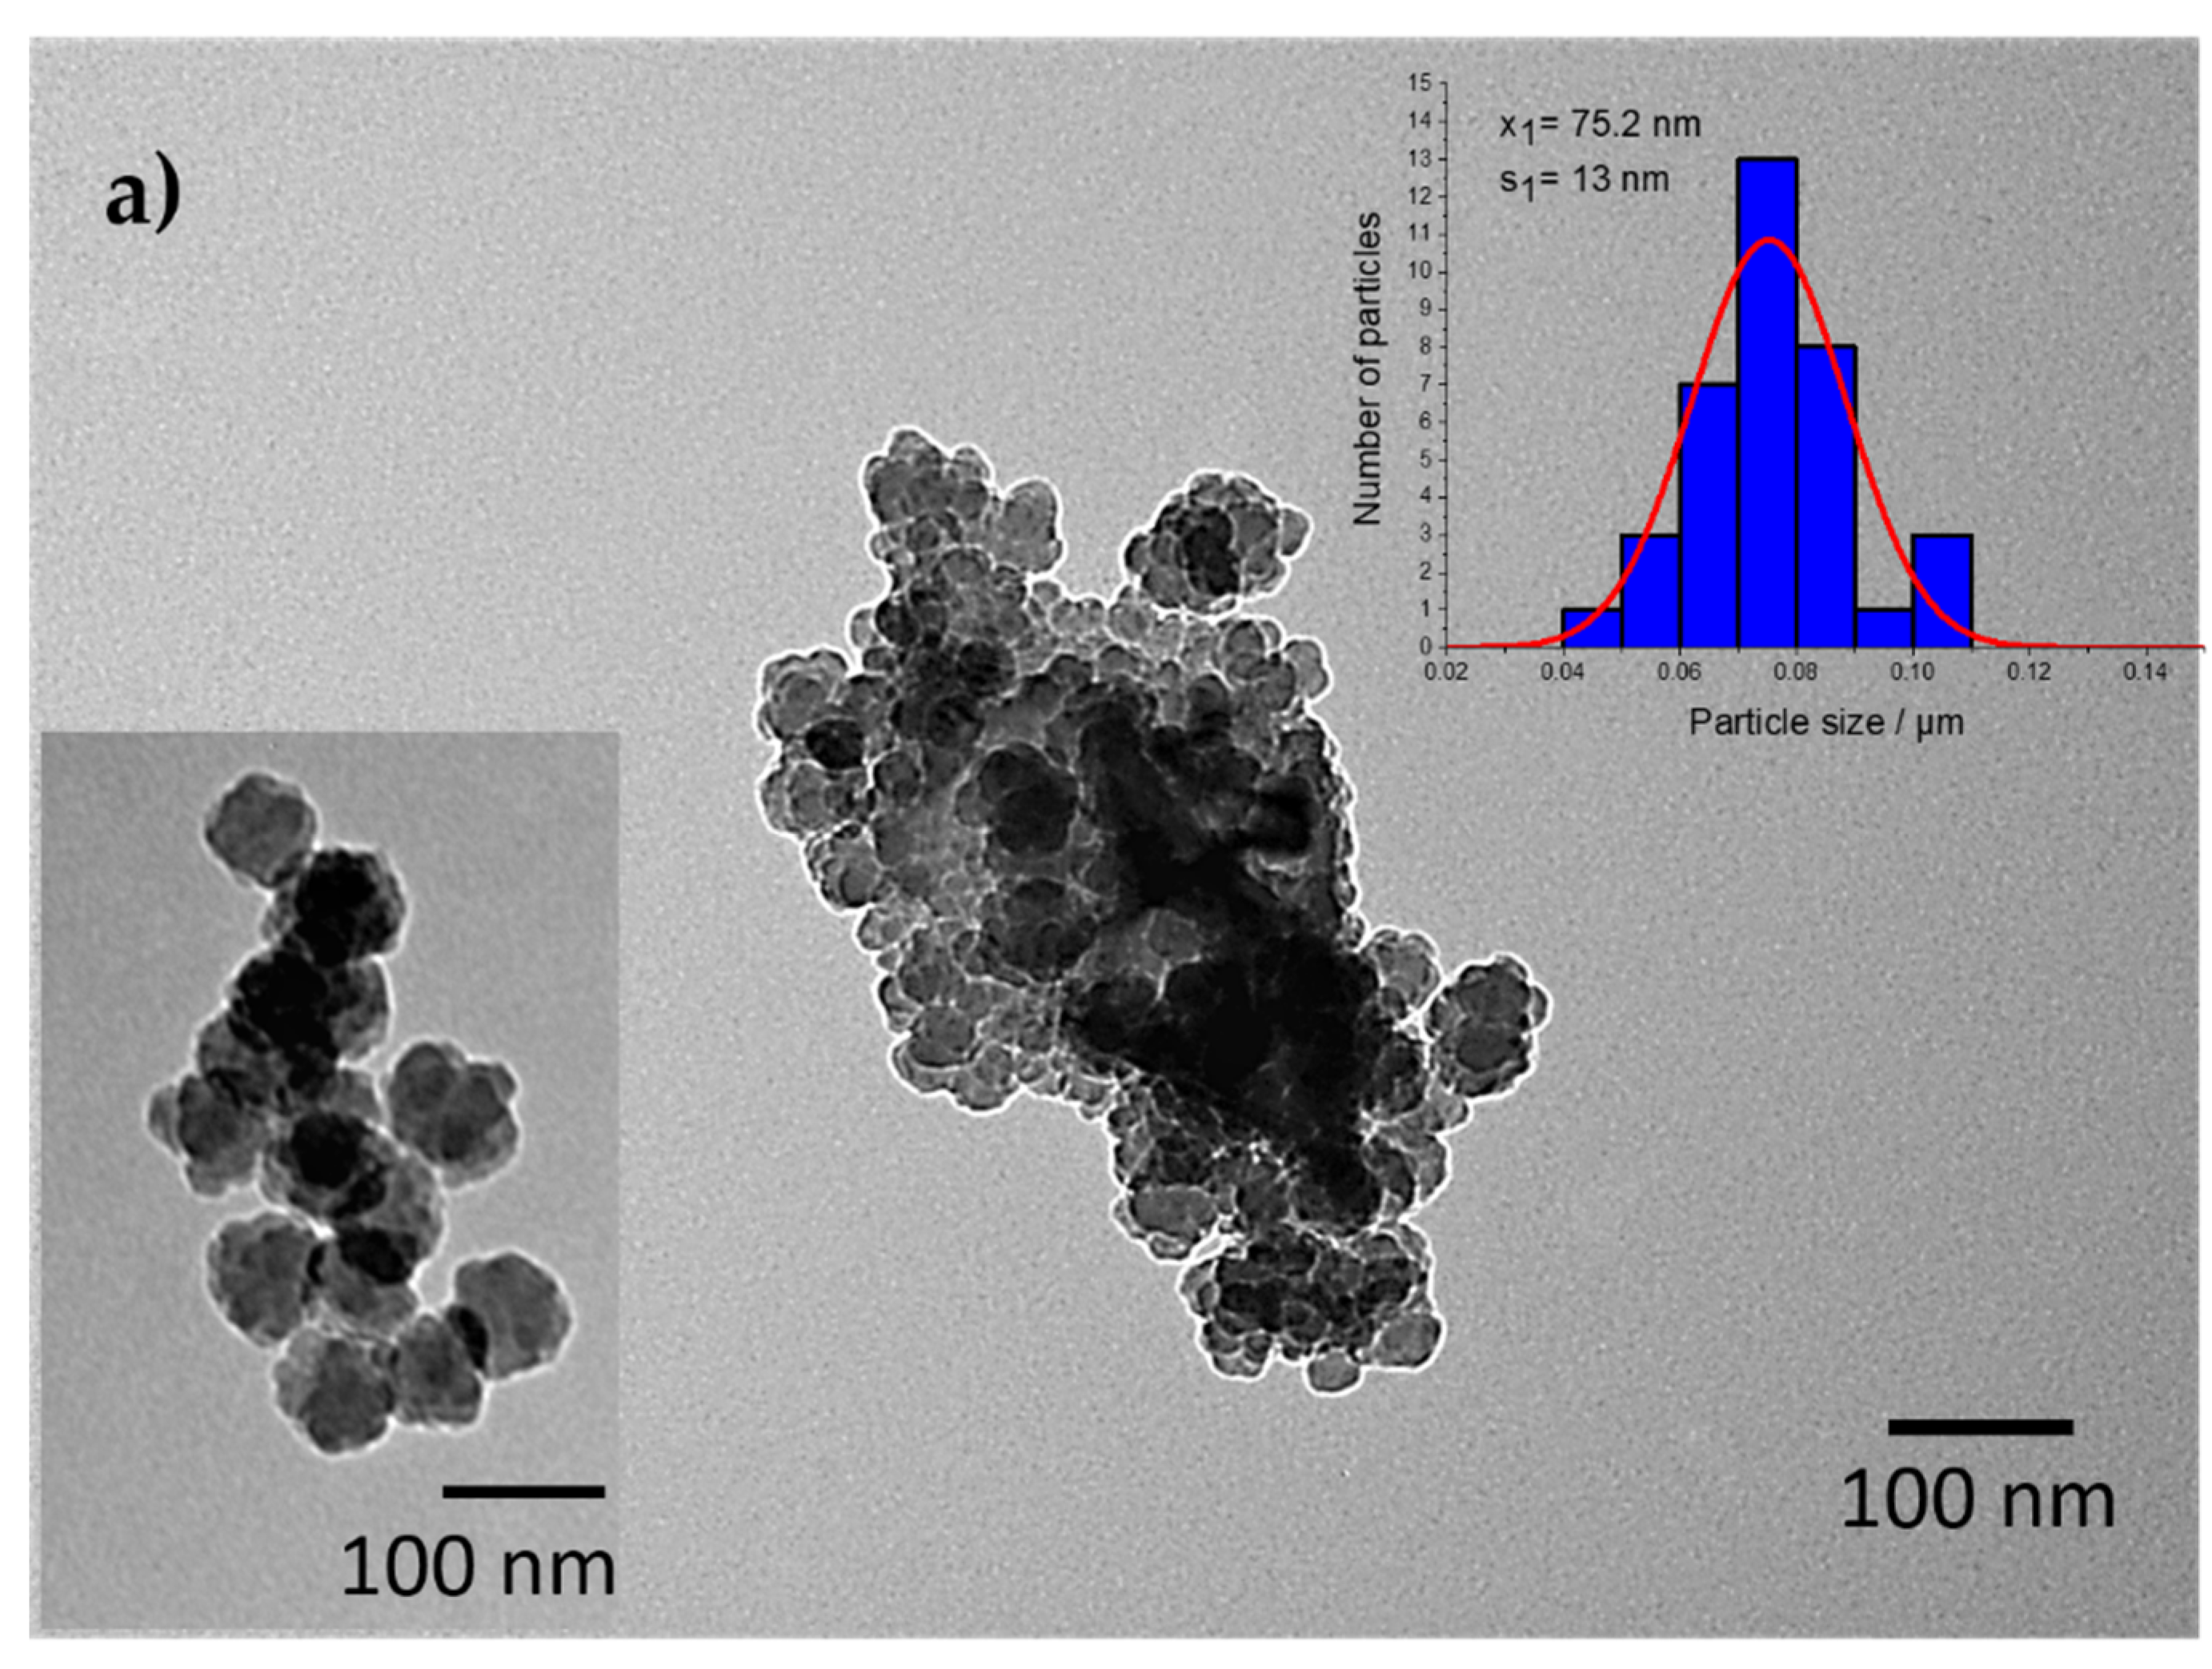
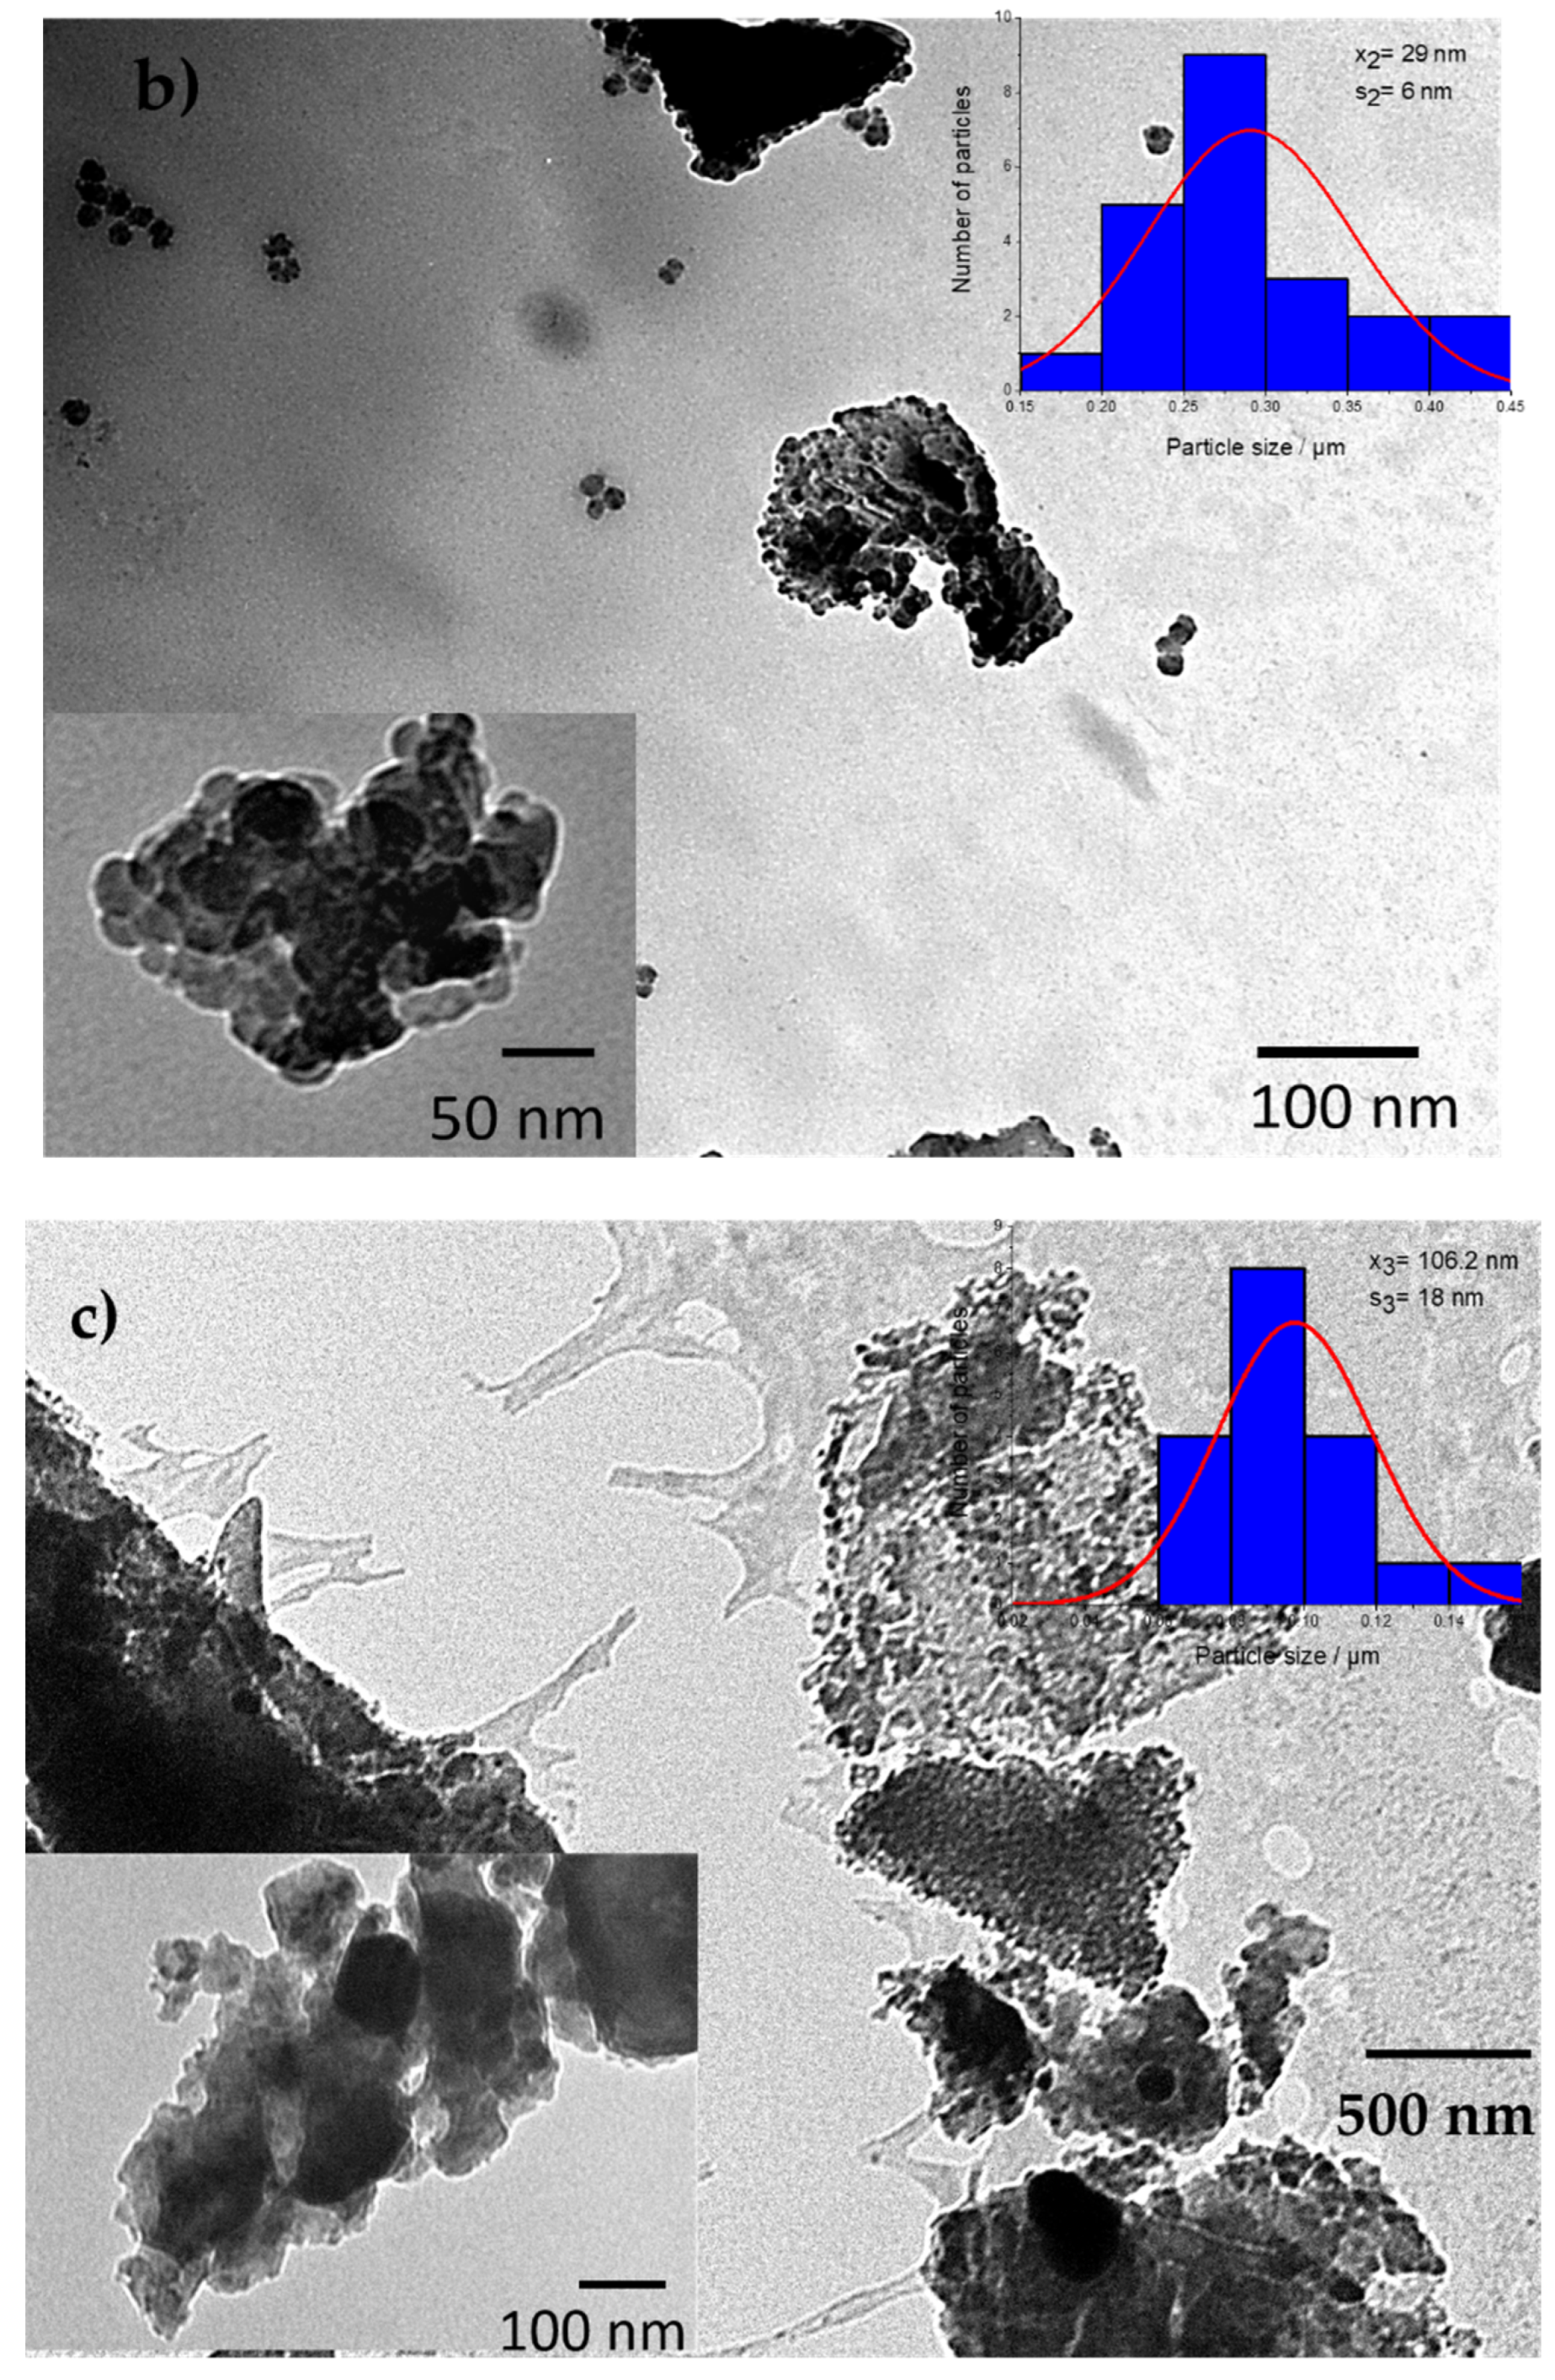
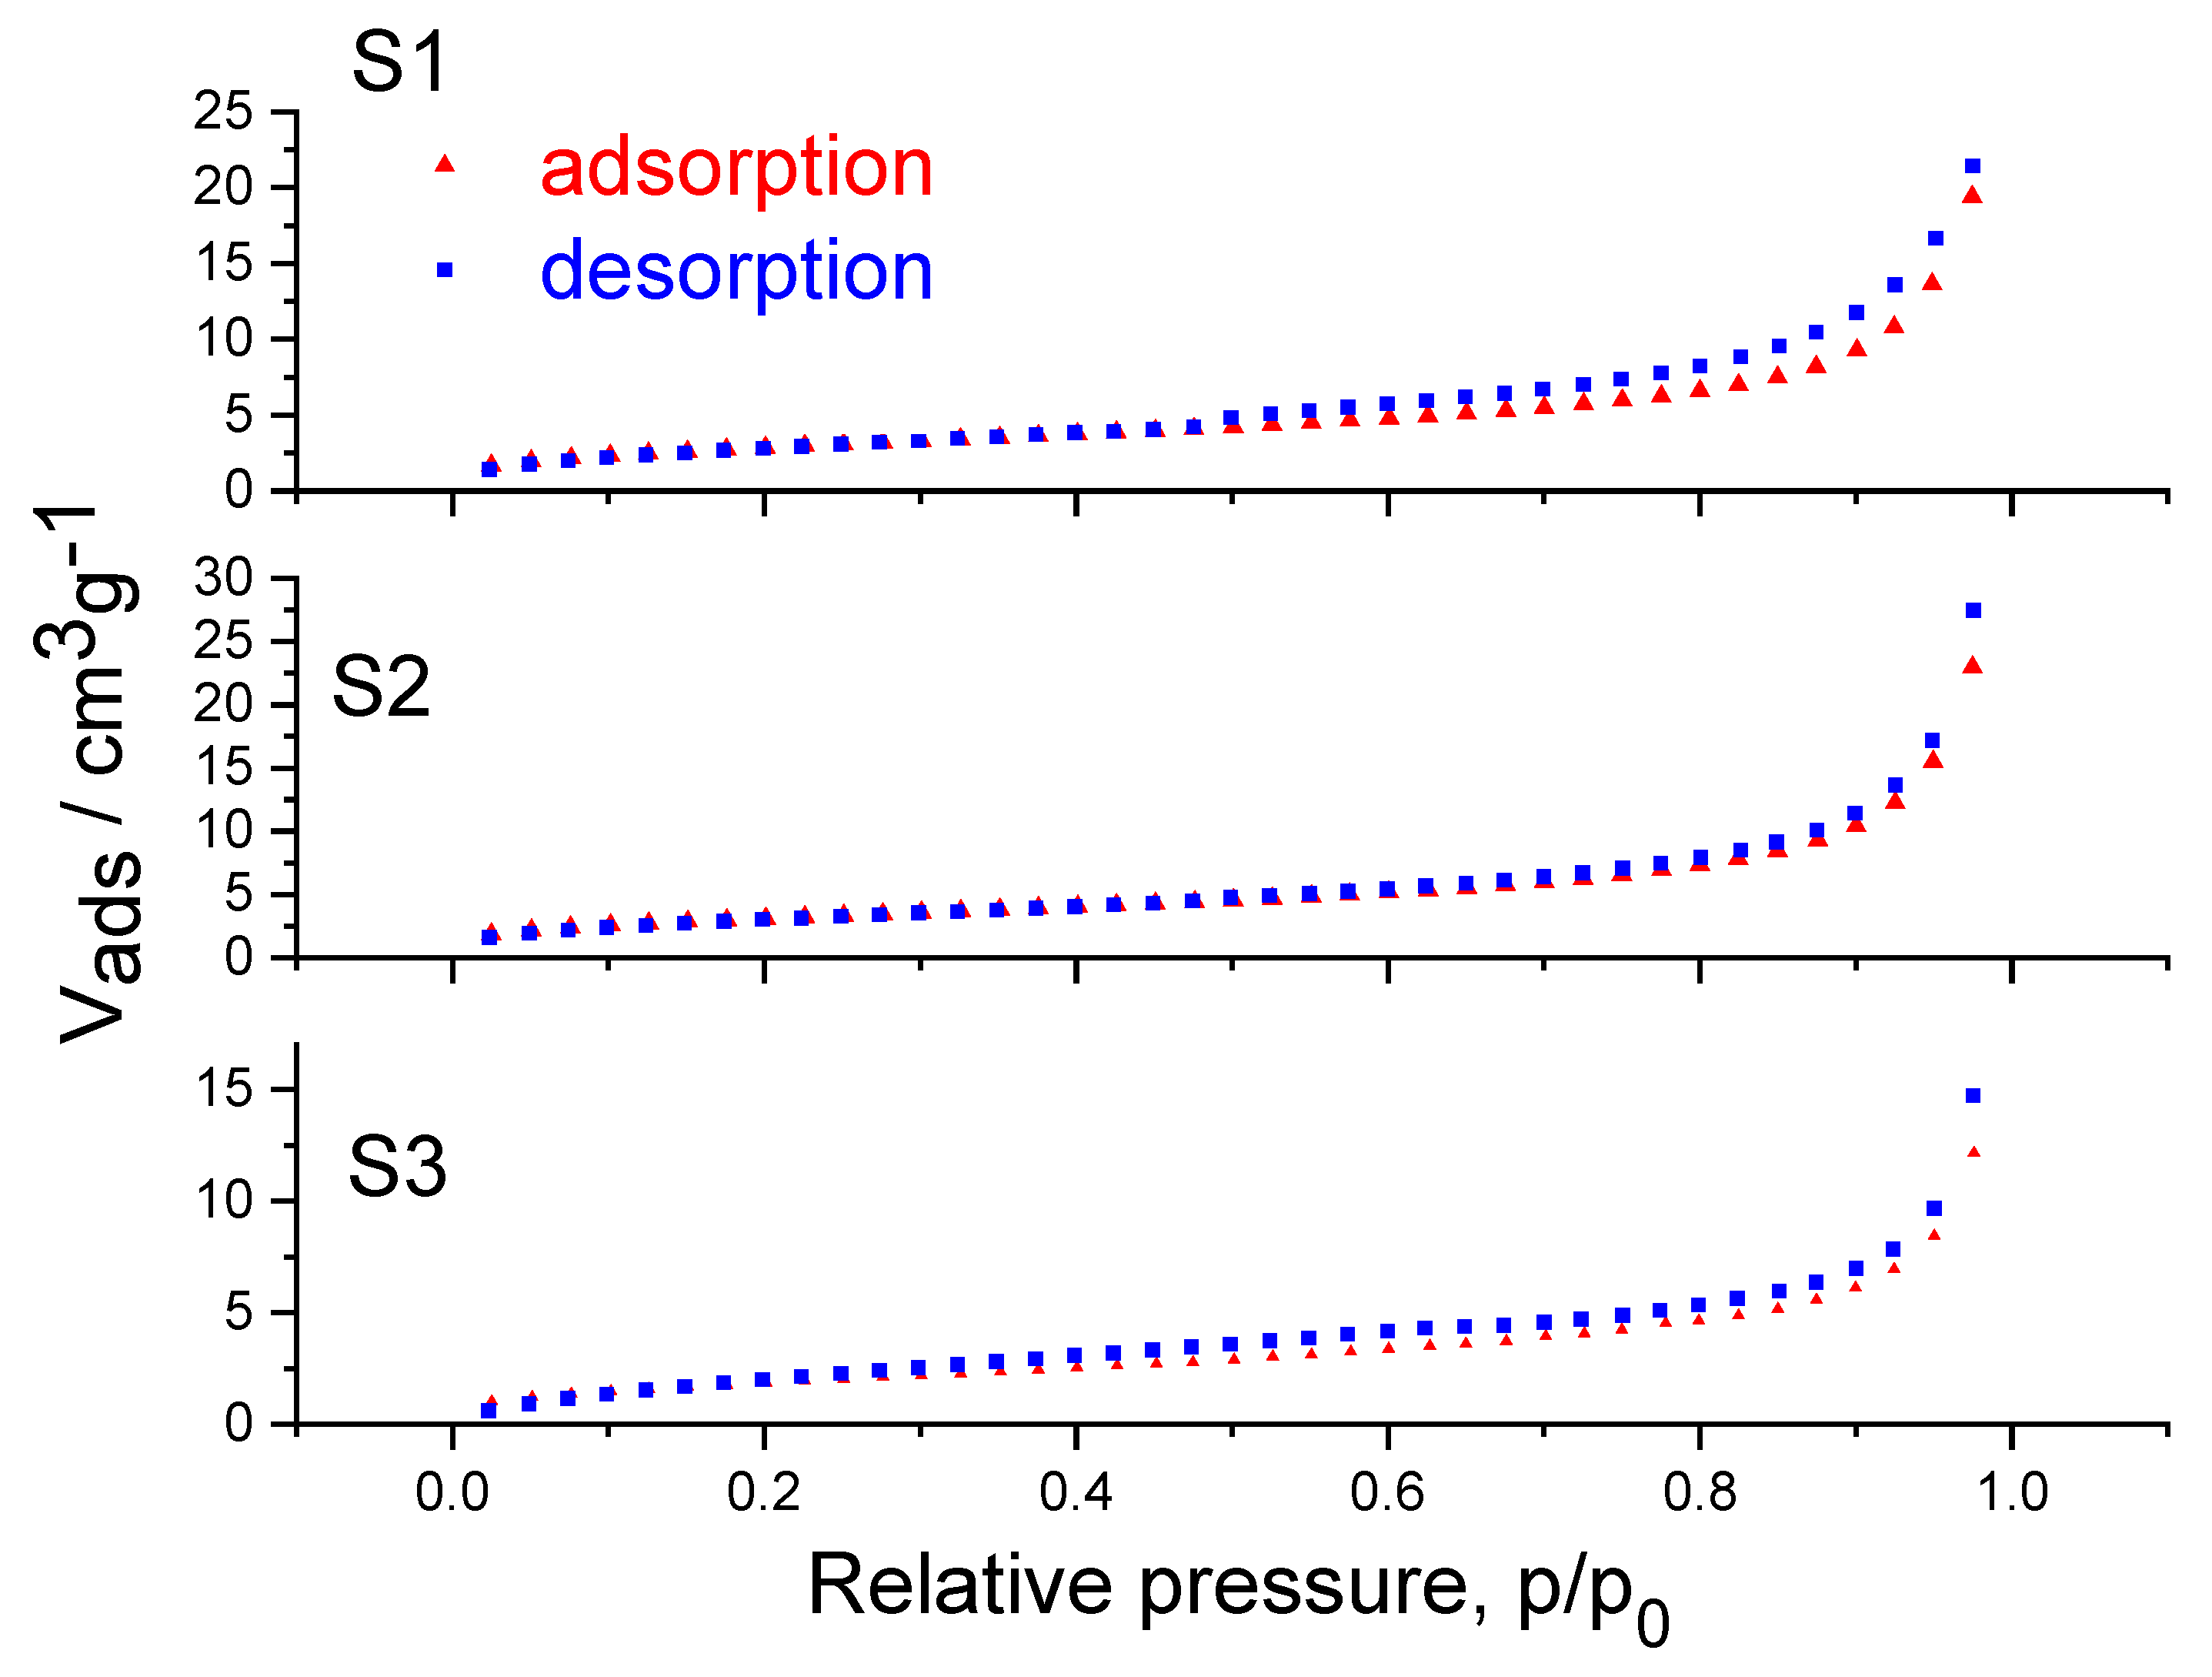
| Sample | Average Particle Size/nm | Surface Area/m2g−1 |
|---|---|---|
| S1 | ~75.2 nm (+/− 13) | 10.6 |
| S2 | ~29 nm (+/− 6) | 16.7 |
| S3 | ~106.2 nm (+/− 18) | 7.2 |
| Sample | Phase | Double-Voigt Method | |
|---|---|---|---|
| Dv/nm | RMSS × 103 | ||
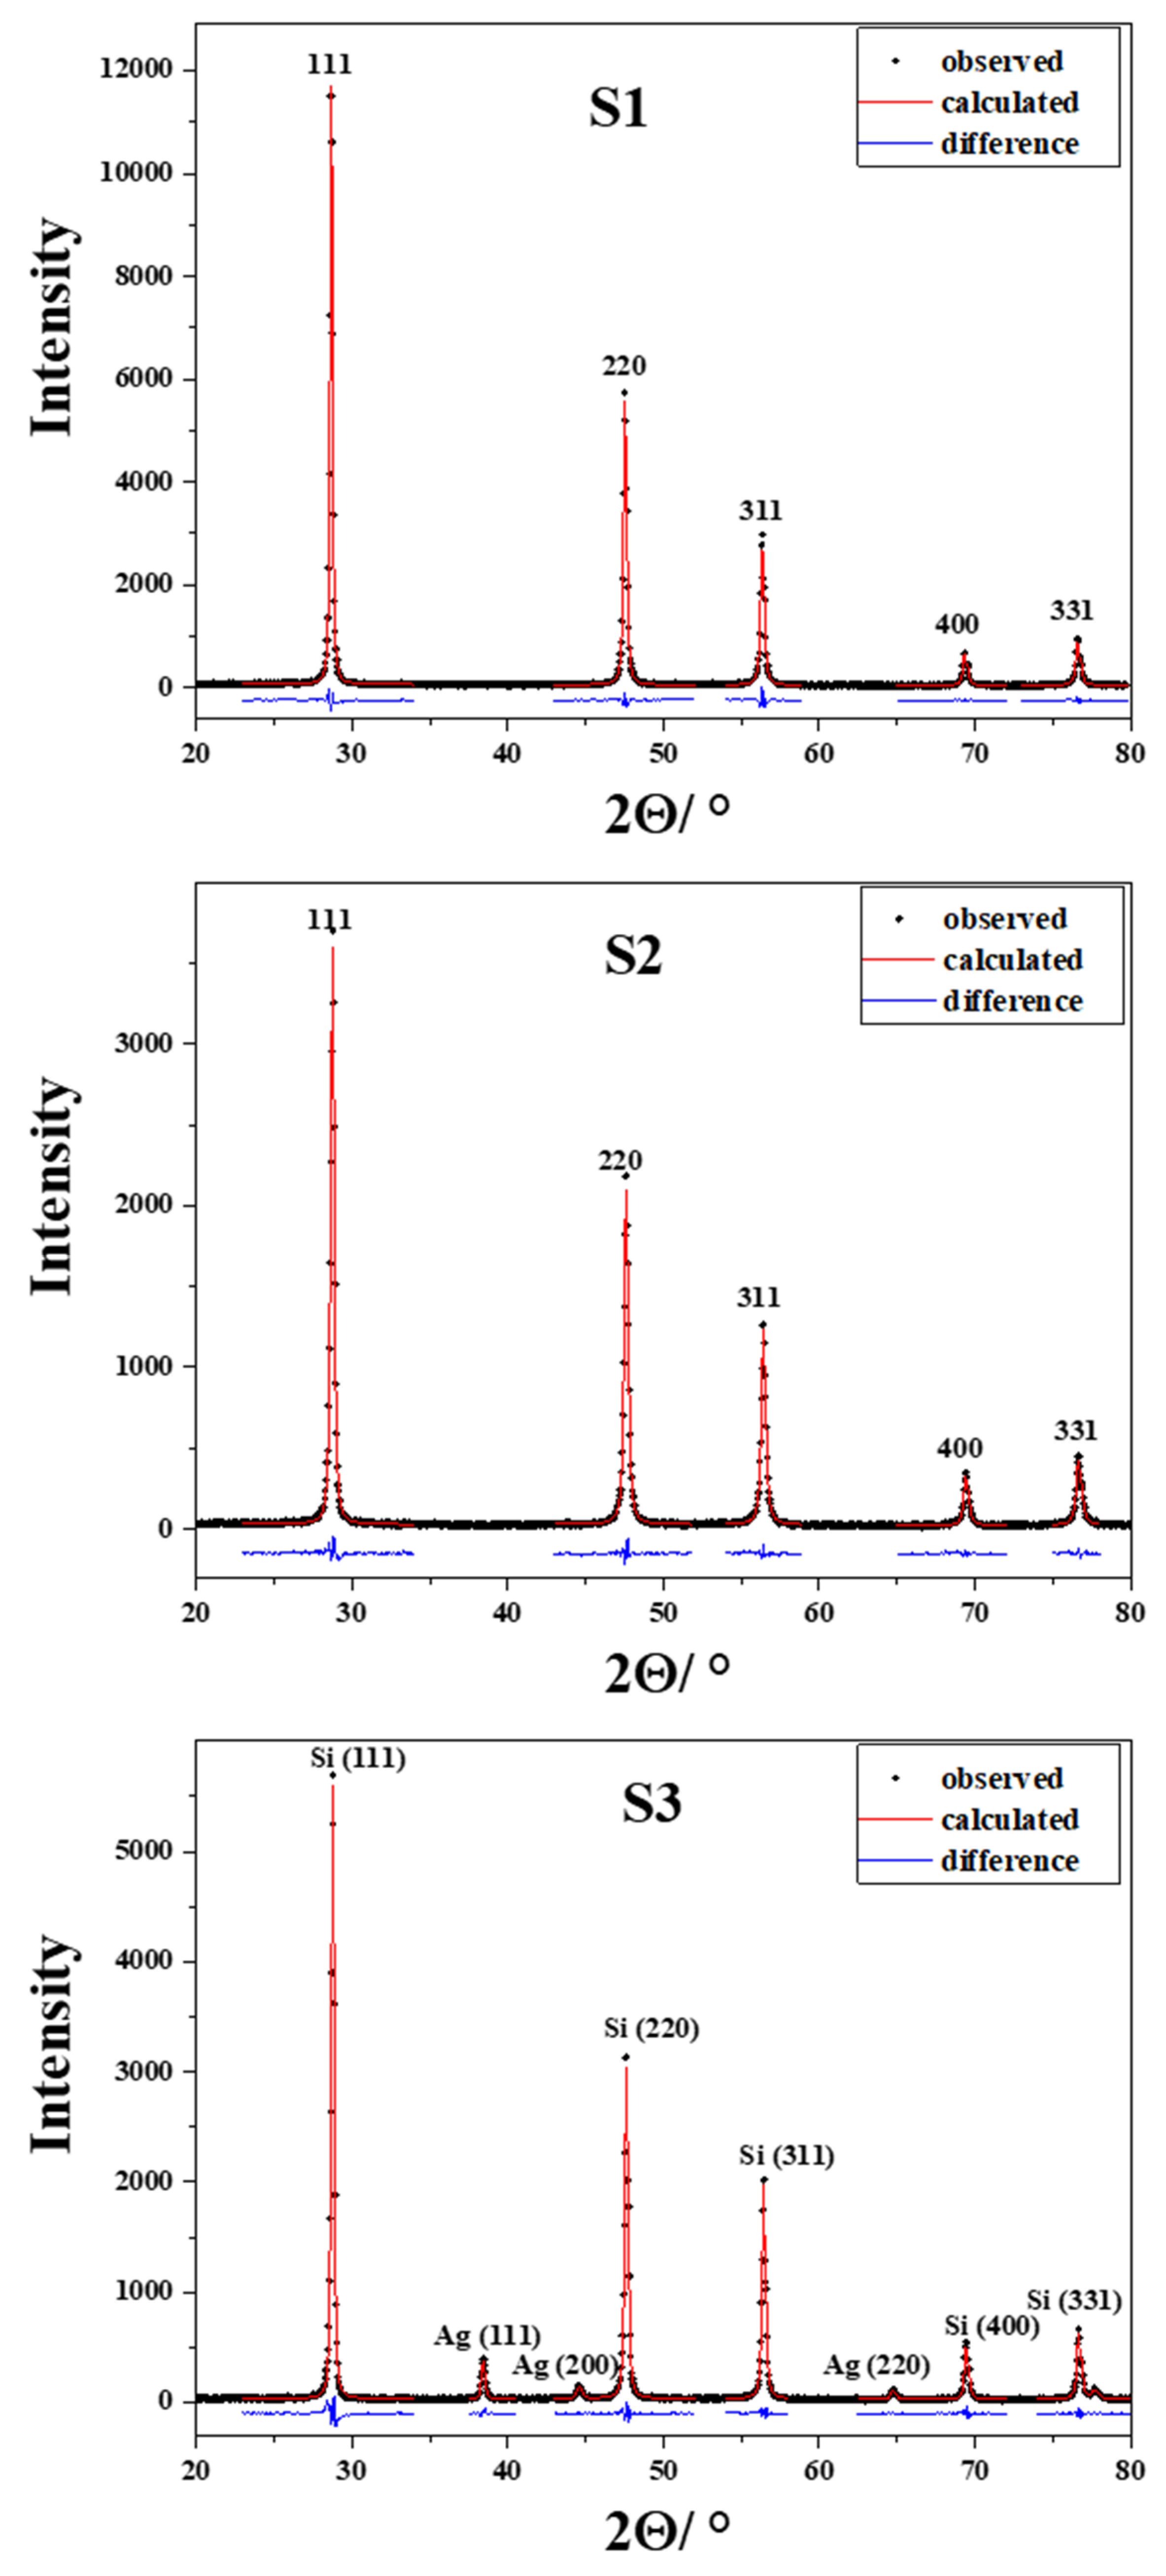
| S1 | Si | 49(2) | 0.98(6) |
| S2 | Si | 32(1) | 1.20(8) |
| S3 | Si | 35(1) | 0.97(5) |
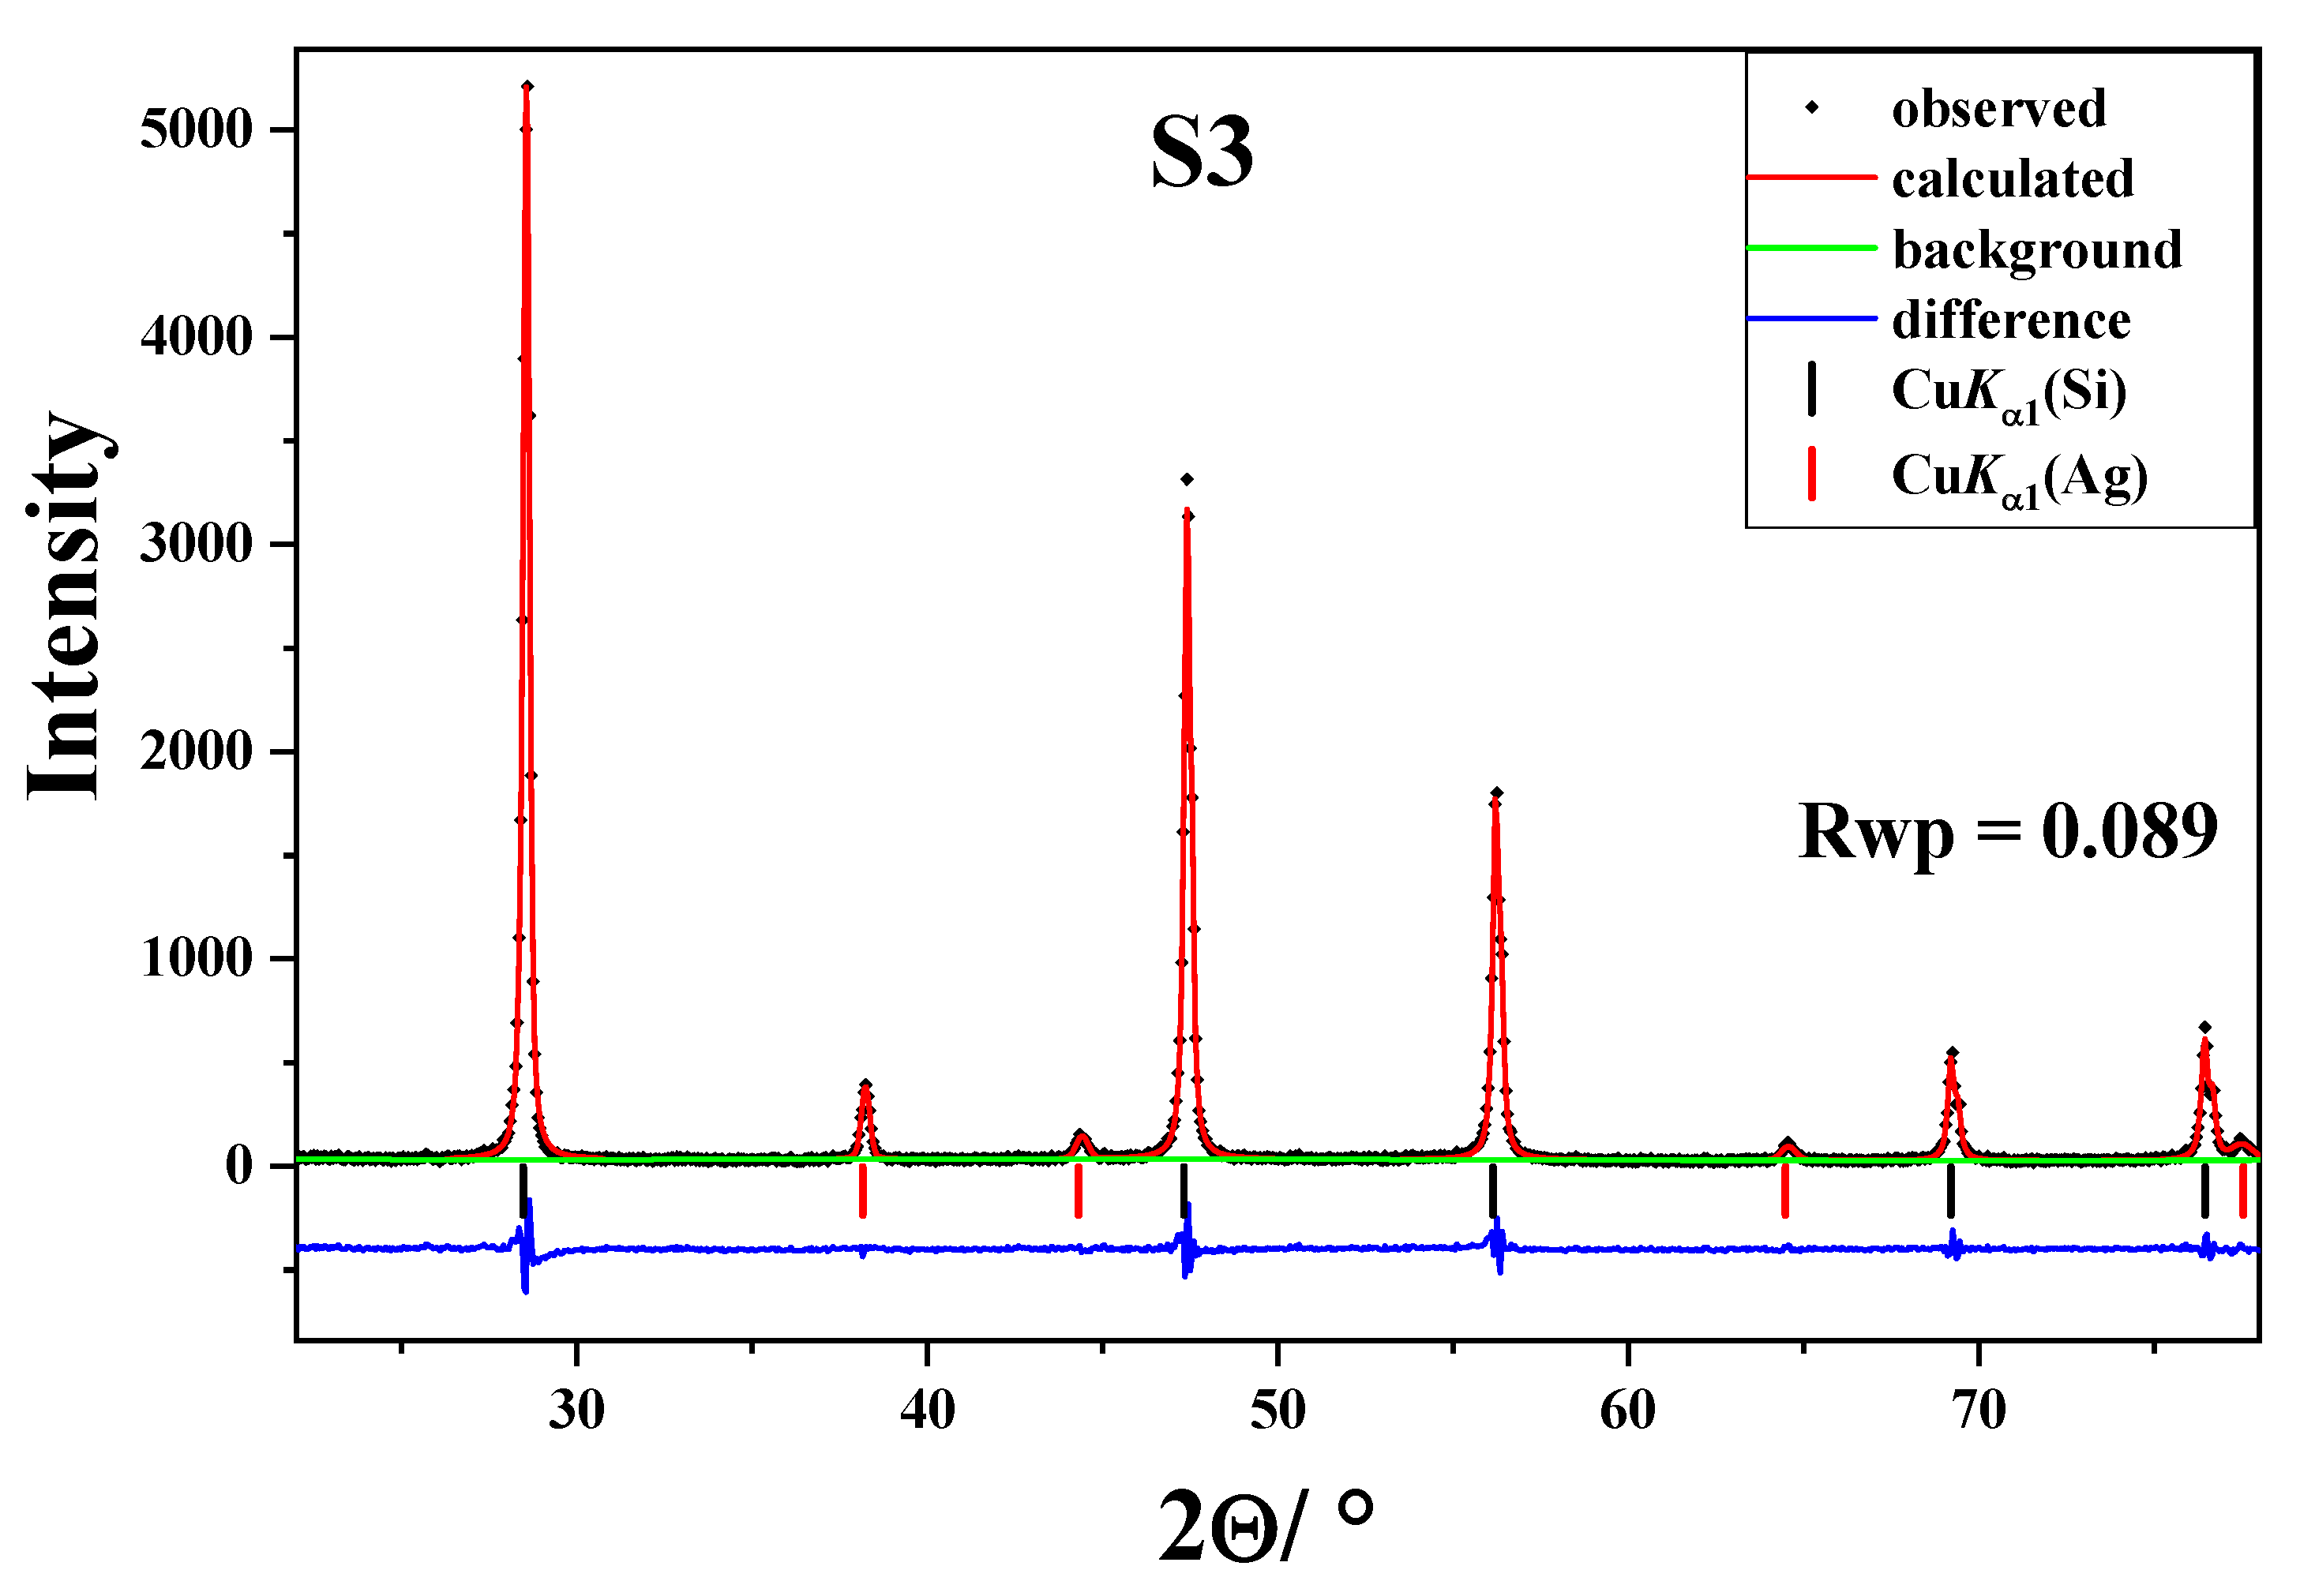
| Ag | 33(2) | 1.36(18) | |
© 2020 by the authors. Licensee MDPI, Basel, Switzerland. This article is an open access article distributed under the terms and conditions of the Creative Commons Attribution (CC BY) license (http://creativecommons.org/licenses/by/4.0/).
Share and Cite
Raić, M.; Mikac, L.; Marić, I.; Štefanić, G.; Škrabić, M.; Gotić, M.; Ivanda, M. Nanostructured Silicon as Potential Anode Material for Li-Ion Batteries. Molecules 2020, 25, 891. https://doi.org/10.3390/molecules25040891
Raić M, Mikac L, Marić I, Štefanić G, Škrabić M, Gotić M, Ivanda M. Nanostructured Silicon as Potential Anode Material for Li-Ion Batteries. Molecules. 2020; 25(4):891. https://doi.org/10.3390/molecules25040891
Chicago/Turabian StyleRaić, Matea, Lara Mikac, Ivan Marić, Goran Štefanić, Marko Škrabić, Marijan Gotić, and Mile Ivanda. 2020. "Nanostructured Silicon as Potential Anode Material for Li-Ion Batteries" Molecules 25, no. 4: 891. https://doi.org/10.3390/molecules25040891
APA StyleRaić, M., Mikac, L., Marić, I., Štefanić, G., Škrabić, M., Gotić, M., & Ivanda, M. (2020). Nanostructured Silicon as Potential Anode Material for Li-Ion Batteries. Molecules, 25(4), 891. https://doi.org/10.3390/molecules25040891