Article

High Voltage Electrical Discharges as an Alternative Extraction Process of Phenolic and Volatile Compounds from Wild Thyme (Thymus serpyllum L.): In Silico and Experimental Approaches for Solubility Assessment

1
Faculty of Food Technology and Biotechnology, University of Zagreb, 10000 Zagreb, Croatia
2
Department of Industrial Engineering, University of Salerno, 84084 Fisciano, Italy
3
ProdAl Scarl University of Salerno, 84084 Fisciano, Italy
4
GREEN Team Extraction, Université d’Avignon et des Pays du Vaucluse-INRA, UMR408, 84000 Avignon, France
*
Authors to whom correspondence should be addressed.
Molecules 2020, 25(18), 4131; https://doi.org/10.3390/molecules25184131
Submission received: 30 July 2020 / Revised: 31 August 2020 / Accepted: 4 September 2020 / Published: 10 September 2020
(This article belongs to the Special Issue Bioactive Compounds of Fruits, Vegetables and Mushrooms)

Abstract

:
The objective of this study was to evaluate the potential of green solvents for extractions of bioactive compounds (BACs) and essential oils from wild thyme (Thymus serpyllum L.) using theoretical and experimental procedures. Theoretical prediction was assessed by Hansen solubility parameters (HSPs) and conductor-like screening model for realistic solvents (COSMO-RS), to predict the most suitable solvents for extraction of BACs. An experimental procedure was performed by nonthermal technology high voltage electrical discharge (HVED) and it was compared with modified conventional extraction (CE). Obtained extracts were analyzed for chemical and physical changes during the treatment. Theoretical results for solution of BACs in ethanol and water, as green solvents, were confirmed by experimental results, while more accurate data was given by COSMO-RS assessment than HSPs. Results confirmed high potential of HVED for extraction of BACs and volatile compounds from wild thyme, in average, 2.03 times higher yield of extraction in terms of total phenolic content was found compared to CE. The main phenolic compound found in wild thyme extracts was rosmarinic acid, while the predominant volatile compound was carvacrol. Obtained extracts are considered safe and high-quality source reach in BACs that could be further used in functional food production.

1. Introduction

Nowadays, there is growing interest among consumers in functional food production. Functional foods can be defined as natural dietary items that, besides providing nutrients and energy, have health-promoting, disease-preventing, or medicinal properties [1]. Spices and aromatic herbs have been used for culinary purposes since antiquity, but also in traditional medicine for their potential to improve health [2].
Thymus serpyllum L., known as a wild thyme, is a species belonging to the Lamiaceae family that grows autochthonously in the Mediterranean area. This plant is rich in polyphenolic compounds and essential oils and shows antiseptic, antioxidative, anthelmintic, diaphoretic, antispasmodic, expectorant, carminative, analgesic and diuretic properties [3,4,5]. In order to produce functional foods from wild thyme, it is important to extract its bioactive compounds (BACs) and essential oils and obtain high-quality natural products. Conventional methods for extraction, like Soxhlet extraction, distillation or maceration, usually have a low production efficiency and are time- and energy-consuming methods that use high amounts of organic solvents and high temperatures. For that reason, some thermally sensitive nutritional compounds, like phenols and antioxidants, may be lost during processing [6].
Usually, the extraction from plant sources is carried out using organic solvents due to their high hydrophobicity. These solvents mostly come from nonrenewable resources and are volatile, flammable and toxic solvents that are not environmentally acceptable. One of the most used solvents is n-hexane due to its low polarity, easy removal from the final product and stability [7].
With the goal of overcoming these disadvantages, various green extraction methods have been developed. According to the definition, “green extraction is based on the development of extraction processes designed to reduce energy consumption, while using alternative solvents and renewable natural products, and ensuring a safe and high quality extract/product” [8]. In this line, some environmental directives and legislation are reducing solvent emissions and promoting the use of alternative eco-friendly solvents (EU Directive 1999/13/EC). Examples of green solvents include limonene, pinene, vegetable oils, supercritical CO2, ionic liquids, deep eutectic solvents or naturally- based deep eutectic solvents (NaDES) that are produced from eco-friendly and low-cost components and specially designed to be used in extraction processes [9,10]. Water and ethanol are also considered as green solvents that are extensively used as they are the cheapest and most available solvents for extraction processes [11].
The replacement of conventional solvents with the most appropriate green solvents enabling one to improve the extraction efficiency, is generally a costly as well as a time-consuming task. For these reasons, theoretical computational models were developed in order to predict the solute-solvent solubility, enabling researchers to reduce solvent and energy consumption, while maximizing the extraction efficiency [12]. Currently, two predictive models are being used as reliable tools to select the most suitable solvents for extraction of target BACs, namely the Hansen solubility parameters (HSPs) that explain the dissolution behavior of solvents and solutes, and the conductor- like screening model for realistic solvents (COSMO-RS) that is a statistical thermodynamics approach based on the results of quantum chemical calculations that provide explanations of the mechanisms of dissolution [13,14].
Within the green extraction principles, various innovative technologies, such as high voltage electrical discharge (HVED), were developed in order to improve the extraction efficiency while reducing solvent, energy, and hazards, and accordingly impact less to the environment [15]. Specifically, HVED is a nonthermal technology based on the phenomenon of electrical breakdown in liquids, which induces physical (e.g., shock waves) and chemical (e.g., formation of free radical species) processes. During the treatment, a gas is flown in the reactor resulting in gas ionization, and accordingly, cold plasma is being formed. These phenomena affect the plant cell, by inducing cell disintegration, a process where electric field is increasing the permeability of the cell membrane, resulting in membrane pores and enhancing the release of intracellular components [16]. Several extractions of bioactive compounds from plant materials were reported with HVED, such as peanut shells [17], pomegranate peel [18], sesame cake [19], grapefruit peels [20], and orange peel [21]. However, to date, no literature data was found on HVED-assisted extraction of valuable compounds from wild thyme.
Obtained plant extracts could be used for functional food production, but also in other spheres of food industry, as colorants, preservatives and other different kind of additives [22,23]. Furthermore, plant extracts could be further preserved by encapsulation methods for controlled release of BACs [24] in food industry [25], but in other industries as well, such as cosmetics [26] or agriculture [27], and in various fields of pharmaceutical industry and medicine due to plants’ natural biological properties [28,29].
The aim of this study was to evaluate the potential of green solvents for extraction of BACs and essential oils from wild thyme. Both theoretical and experimental analysis were performed. For theoretical analysis, HSPs and COSMO-RS software were used. Further experimental analysis was performed by means of HVED as a green nonthermal technology to extract BACs and volatile compounds from wild thyme in comparison with modified conventional extraction (CE).

2. Results

2.1. Theoretical Prediction

The solubility of wild thyme BACs in different green solvents was evaluated by theoretical models using HSPs and COSMO-RS software. Results are presented as comparison with the conventionally used solvent n-hexane (first column). Further green solvents chosen for analysis were ethyl acetate, methyl acetate, ethyloleate, ethanol, 1-butanol, isopropanol, methanol, limonene, α-pinene, cymene, β-myrcene, cyclopentyl methyl ether (CPME), dimethylcarbonate (DMC), 2-methyltetrahydrofuran (MeTHF) and water.
Assessment with HSPs allowed relative energy difference (RED) results (Table 1), the estimation of solvent capacity to dissolve solutes. RED values < 1 represent very good solubility (green color); 1–3 presents medium solubility (yellow color); while results > 3 present poor solubility > 3 (red color). Results showed that water showed low solubility for all assessed wild thyme compounds. On the other side, cyclopentyl methyl ether (CPME) showed highest potential for extractions from wild thyme and very good solubility for carene, α-thujene, α-terpinene, δ-terpinene, borneol, α-cadinol, linalool, piperitone, β-caryophyllene, copaene, α-cubebene, β-elemene, β-cadinene, δ-cadinene, isospathulenol, α-tocopherol, and ascorbic acid.
The COSMO-RS software integrates a quantum chemistry approach that allows the calculation of various properties such as the relative solubility of a compound in several solvents [30]. Results of probability of solubility assessed by COSMO-RS theoretical prediction are given in Table 2. Results from 0–20% present low probability of solubility (red color); 20–60% medium probability of solubility (yellow color); and 60–100% high probability of solubility (green color). Water was presented as a solvent with lowest potential to solvate BACs from wild thyme, however, it is expected that water will have high potential for solubility of quinic acid, caffeic acid and ascorbic acid. The best solubility of BACs from wild thyme was presented with MeTHF where all evaluated compounds showed a high probability of solubility.
The qualitative modelling using principal component analysis (PCA) to identify potential grouping and correlations between HSPs and COSMO-RS results was performed. PCA graph including both components and HSPs and COSMO-RS variables is given in Figure 1.

2.2. Experimental Procedure

Extracts obtained by CE and HVED were analyzed for changes during the extraction, therefore, physical and chemical parameters of extracts were measured. Physical parameter results, including pH, conductivity, temperature and power used for HVED treatment, are given in Table 3. Also, cell disintegration index (Zp) was calculated.
Furthermore, chemical analyses of wild thyme extracts were performed. In order to compare extraction efficiency of BACs by means of HVED, compared to CE, obtained extracts were analyzed by spectrophotometric methods—total phenolic content (TPC) and antioxidant activity (2,2-diphenyl-2-picrylhydrazyl (DPPH) free radical assay and ferric reducing antioxidant power (FRAP) assay). Results are given in Figure 2. Extraction yields are presented as g GAE/g of sample × 100 and expressed as percentages (%).
In order to quantify individual phenolic compounds, an ultra performance liquid chromatography-tandem mass spectrometry characterization (UPLC-MS/MS) analysis was performed. Wild thyme extracts were analyzed for apigenin, carnosol, diosmetin, hydroxytyrosol, luteolin, oleanolic acid, quercetin, rosmarinic acid, p-cymene, thymol, carvacrol and camphor, results are given in Table 4.
The analysis of volatile compounds from wild thyme extracts was performed by HS-SPME/GC-MS method. Analyzed compounds included 1,8-cineol, linalool, thymol and carvacrol, and results are shown in Table 5.
Statistical analysis was performed in in XLStat (MS Excel 2010). An analysis of covariance (ANCOVA) was used to analyze the impact of independent variables: treatment time, voltage, ethanol content and treatment type (CE, HVED—nitrogen or HVED—argon) to measured physical and chemical parameters. For UPLC-MS/MS and GC-MS results, all individual (data not shown) and total of all compounds was assessed. The p-values present the statistical significance of each of the factor and it was significant at p ≤ 0.05, and are shown as bolded in Table 6.
Furthermore, in order to assure safe and high-quality final product, residue levels of pesticides and metals has been analyzed. At the moment, trace content of metals and pesticides in foods are regulated via European Commission Regulations No 1881/2006 and No 396/2005, respectively. Regulations for dietary supplements were chosen as the nearest category to evaluate health safety requirements for wild thyme and provide maximum residue levels (MRLs). Results of analyzed pesticides levels in dried wild thyme is given in Table 7.
Results of residue levels of metals found in dried wild thyme and selected extracts are given in Table 8. Due to possible abrasion of electrodes during the treatment with HVED, content of metals was analyzed also in wild thyme extract obtained by HVED. For this purpose, extract TN8 was chosen that was treated with highest voltage (25 kV), nitrogen, for longer time (9 min) and highest ethanol content (50%), since highest abrasion is expected in such extract.

3. Discussion

The extraction of BACs and volatile compounds from wild thyme was assessed by theoretical and experimental procedures. Theoretical prediction was calculated by computational simulation methods using HSPs and COSMO-RS software, while experimental analysis was done by HVED as a nonthermal extraction technology. For better comparison, both methods were performed at room temperature.

3.1. Theoretical Prediction of Solubility of Wild Thyme Compounds in Green Solvents

3.1.1. Wild Thyme Compounds Solubility in Green Solvents by HSPs

The solubility of wild thyme compounds in selected green solvents assessed by HSPs is given in Table 1 and presented as a comparison with conventionally used n-hexane (first column). Results are shown as a RED value that estimates the potential of a solvent to dissolve solutes. RED values from 0–1 present very good solubility, medium solubility is 1–3, and poor solubility > 3. It is clear that some alternative (green) solvents have better solubility then n-hexane and for that reason, it is not the best solvent for extraction of wild thyme BACs from theoretical perspective. According to solvent with highest number of very good soluble compounds, followed by medium and poor solubility, the order of solvents that could be used for better solubility of wild thyme compounds was as following: CPME > limonene > ethyloleate > cymene > β-myrcene > MeTHF > α-pinene > n-hexane > ethylacetate > DMC > methylacetate > 1-butanol > isopropanol > ethanol > methanol > water. It can be concluded from the results that wild thyme compounds have the lowest solubility in water, followed by primary alcohols (ethanol, 1-butanol and methanol) and secondary alcohol isopropanol. On the other side, these solvents are the cheapest green solvents that is the great advantage for their usage. CPME showed the highest theoretical prediction for solution of wild thyme compounds.
A classical rule “like dissolves like” can be applied to theoretical prediction for solvent-solute solubility. According to this rule, more polar solvents will have higher probability of solubility for polar compounds, while non-polar solvents will have a tendency to dissolve less polar or non-polar solutes. This was shown with HSPs results, where non-polar (or weakly polar) solvents like n-hexane, limonene, CPME, methylacetate, ethyloleate, cymene, β-myrcene and α-pinene had higher probability of solubility of less polar compounds such as hydrophobic thymol, α-thujene, piperitone and other.

3.1.2. Wild Thyme Compounds Solubility in Green Solvents Assessed by COSMO-RS Software

The COSMO-RS software was also used for evaluation of solubility of wild thyme compounds in selected green solvents. Results are presented in probability of solubility (%) where low probability is marked with red color, medium probability with yellow color, and high probability of solubility with green color. Similar trend was shown as with HSPs, but higher potential for solution of solutes was predicted with COSMO-RS software. Results showed that MeTHF has the highest probability of solubility of wild thyme compounds, and that all solvents, except water, have higher potential for solution during extractions with wild thyme, compared to n-hexane. Solvents are ranked as follows: MeTHF > CPME > ethyl acetate > methyl acetate > 1-butanol > ethyl oleate > isopropanol > ethanol > methanol > DMC > limonene > cymene > β-myrcene > α-pinene > n-hexane > water.
These results show the solubility of each individual compound in the solvent, but the extraction does not depend only on solubility, but also on the quantity of each compound in the plant. Therefore, experimental analysis was performed. Taking into consideration results obtained by two theoretical prediction methods, it was decided to perform extraction using green solvents with potential to replace n-hexane: water, ethanol, limonene, α-pinene, DMC and ethyl acetate. Since no electrical discharge was achieved with limonene, α-pinene, DMC and ethylacetate, for further analysis, only water and aqueous ethanol 25% and 50% (v/v) were taken.

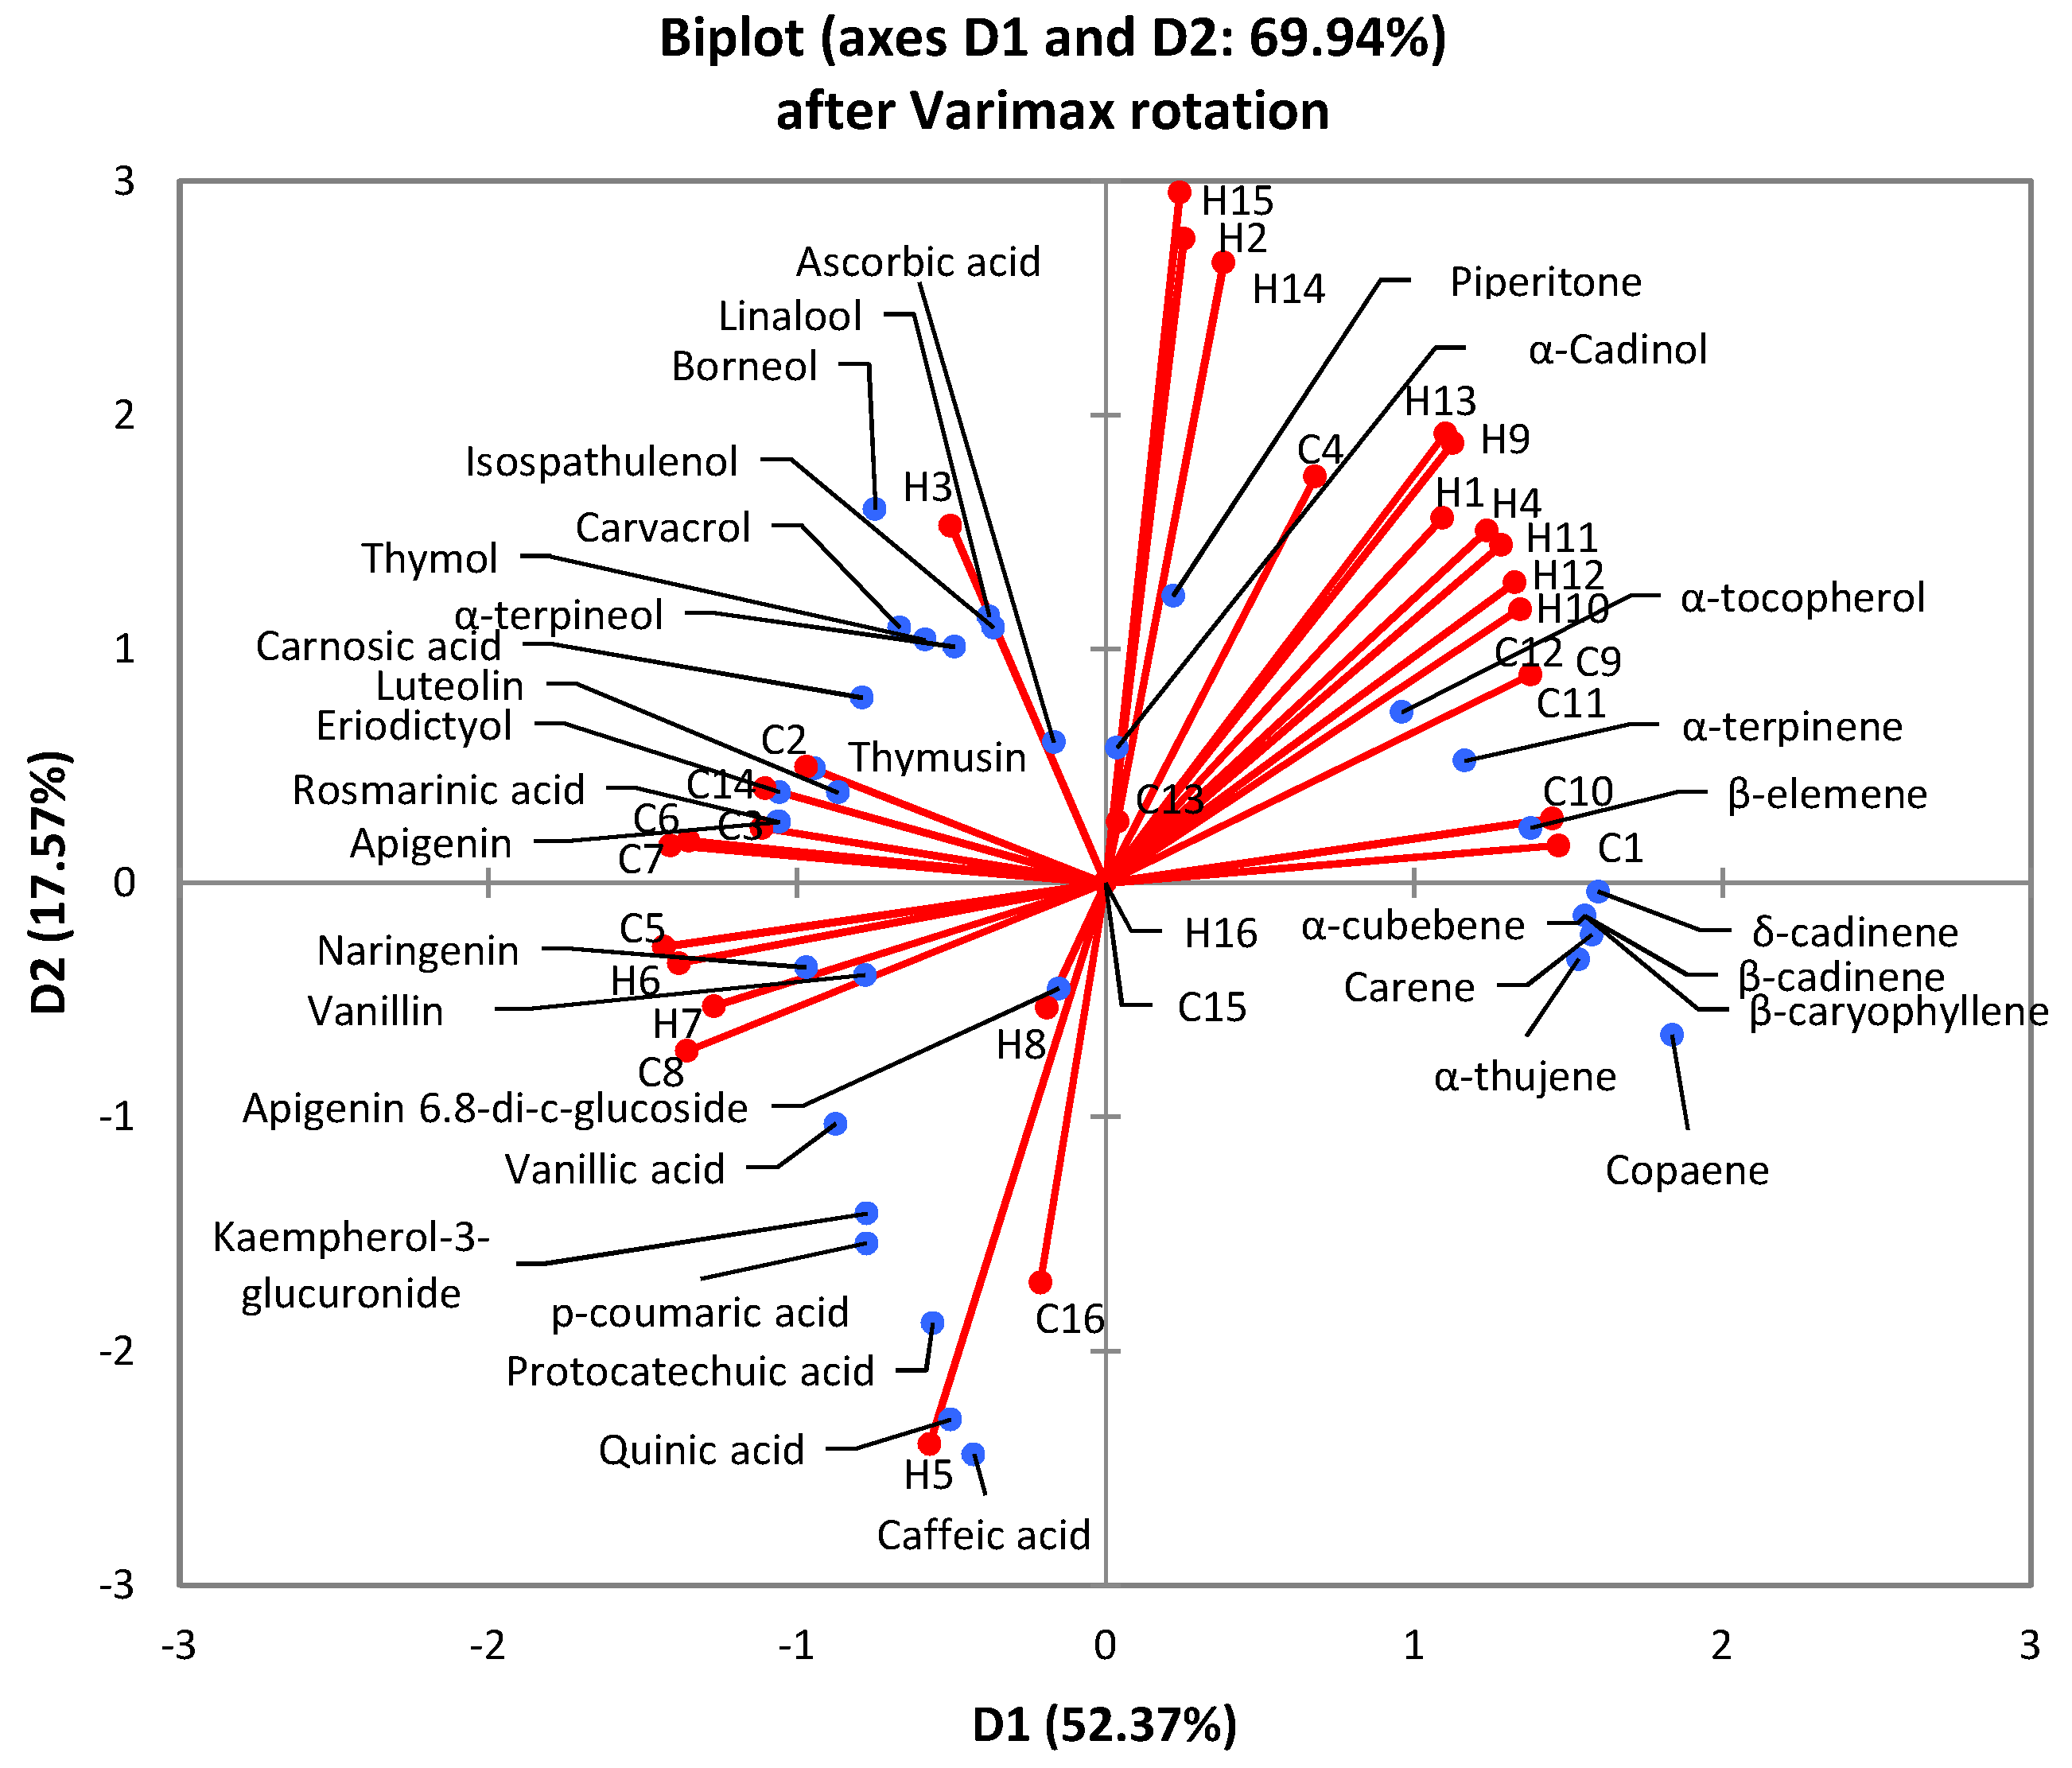
3.1.3. Principal Component Analysis (PCA) of Theoretical Prediction Results

The PCA analysis was conducted in order to correlate the results from HSPs and COSMO-RS software. The biplot of PCA assessment is given in Figure 1. A total of 52.37% of variance was clarified in the observed data set. The biplot showed that analysed compounds have spread over all quadrants, while HSPs and COSMO-RS parameters were placed in first, second and third quadrants. A grouping of selected compounds from the same group (i.e., oxygenated monoterpenes, sesquiterpenes, flavonons, etc.) is notable, where all compounds from the same group were grouped in the same quadrant or at least, at the same side of x or y axis, except monoterpenes that were placed in first, second and fourth quadrants. Additionally, grouping of solvents was also notable. For example, short chain alcohols (ethanol, methanol, 1-butanol and isopropanol) were placed all in the third quadrant according to HSPs and in second and third quadrants according to COSMO-RS results. All monoterpenes, regarding the analysed method, were placed in the first quadrant of the PCA biplot.
It is clear that neither of solvents showed completely different results with two theoretical prediction models, i.e., no solvents were placed in inversely proportional quadrants (I-III or II-IV). Furthermore, most solvents were placed in the same quadrant with HSPs and COSMO-RS prediction including n-hexane (1), methyl acetate (3), ethyl oleate (4), ethanol (5), methanol (8), limonene (9), α-pinene (10), cymene (11), β-myrcene (12), and CPME (13). For that reason, it can be concluded that similar data are given with HSPs and COSMO-RS results, although some differences could be noted, especially with higher probability of solution given with COSMO-RS data (Table 2).

3.2. Experimental Assessment of Extraction of Wild Thyme Bioactive Compounds by Means of High Voltage Electrical Discharge (HVED)

3.2.1. Physical Properties of Wild Thyme Etracts Obtained by HVED Compared to Conventional Extraction

The aim of the experimental analysis was to extract BACs from wild thyme by HVED extraction. During the HVED treatment, a gas is flowing through the needle (electrode) and it is being ionized forming a cold plasma. The type of gas used in the treatment since different gas ionize at different voltages and different radical species are being formed during discharge. Therefore, different results could be obtained with different gases [31]. For that reason, it was difficult to obtain electrical discharges with nitrogen under 20 kV so 20 and 25 kV were chosen for nitrogen treatments, while lower voltages of 15 and 20 kV were chosen for argon treatments.
Results of physical parameters, including pH, conductivity, temperature before and after the treatment and power used during HVED treatment, are given in Table 3. pH of wild thyme extracts ranged from 5.12 ± 0.18 to 6.31 ± 0.15 meaning that all extracts were slightly acidic, and no significant changes in pH were noted between HVED extracts and extracts obtained by CE. Electrical conductivity was in range from 89.0 ± 6.3 μS/cm (extract TA11) to 646.0 ± 30.1 μS/cm (extract TA2). Statistical analysis of influence of main effect (treatment time, voltage, ethanol content and treatment type) to results of physical parameters is shown in Table 6. Statistically significant influence (p ≤ 0.05) to pH and conductivity had only ethanol content. With higher ethanol content, pH increased, while conductivity decreased. Regarding the temperature of extracts, it was shown that the maximum measured temperature after the HVED treatment was 37.8 ± 1.3°C. For statistical analysis, a temperature difference calculated as a difference after and before HVED treatment, was taken in account for statistics. Maximum temperature difference was 12.2 °C for sample TA2 treated for 9 min with argon at 15 kV and water as a solvent, where also the highest conductivity was noted. Temperature difference was higher with longer treatment time, higher voltage, argon and lower ethanol content, while statistically significant influence was noted for all parameters except voltage. Regarding the power used for HVED treatment, statistically significant influence of treatment time and voltage was observed, where longer treatment time and higher voltage increased power. This trend was statistically confirmed for treatment time and voltage.
Additionally, Zp was used to select the optimal HVED treatment conditions where the highest cell membrane permeabilization degree was achieved. According to results (Table 3), the highest permeabilization happened in extract TA2 (9 min, 15 kV, 0% of ethanol), sample where highest conductivity and highest temperature difference was noted, indicating the highest yield of extraction, although it was not proven with results of phenolic compounds and antioxidants (Figure 2). Zp lowered with higher ethanol content and increased with higher voltage applied. These results indicate potential use of Zp for assessment of electroporation during HVED treatment. However, statistical data showed that only ethanol content had a significant influence to the electrical conductivity, and Zp accordingly. Therefore, no clear conclusions could be provided regarding Zp index.

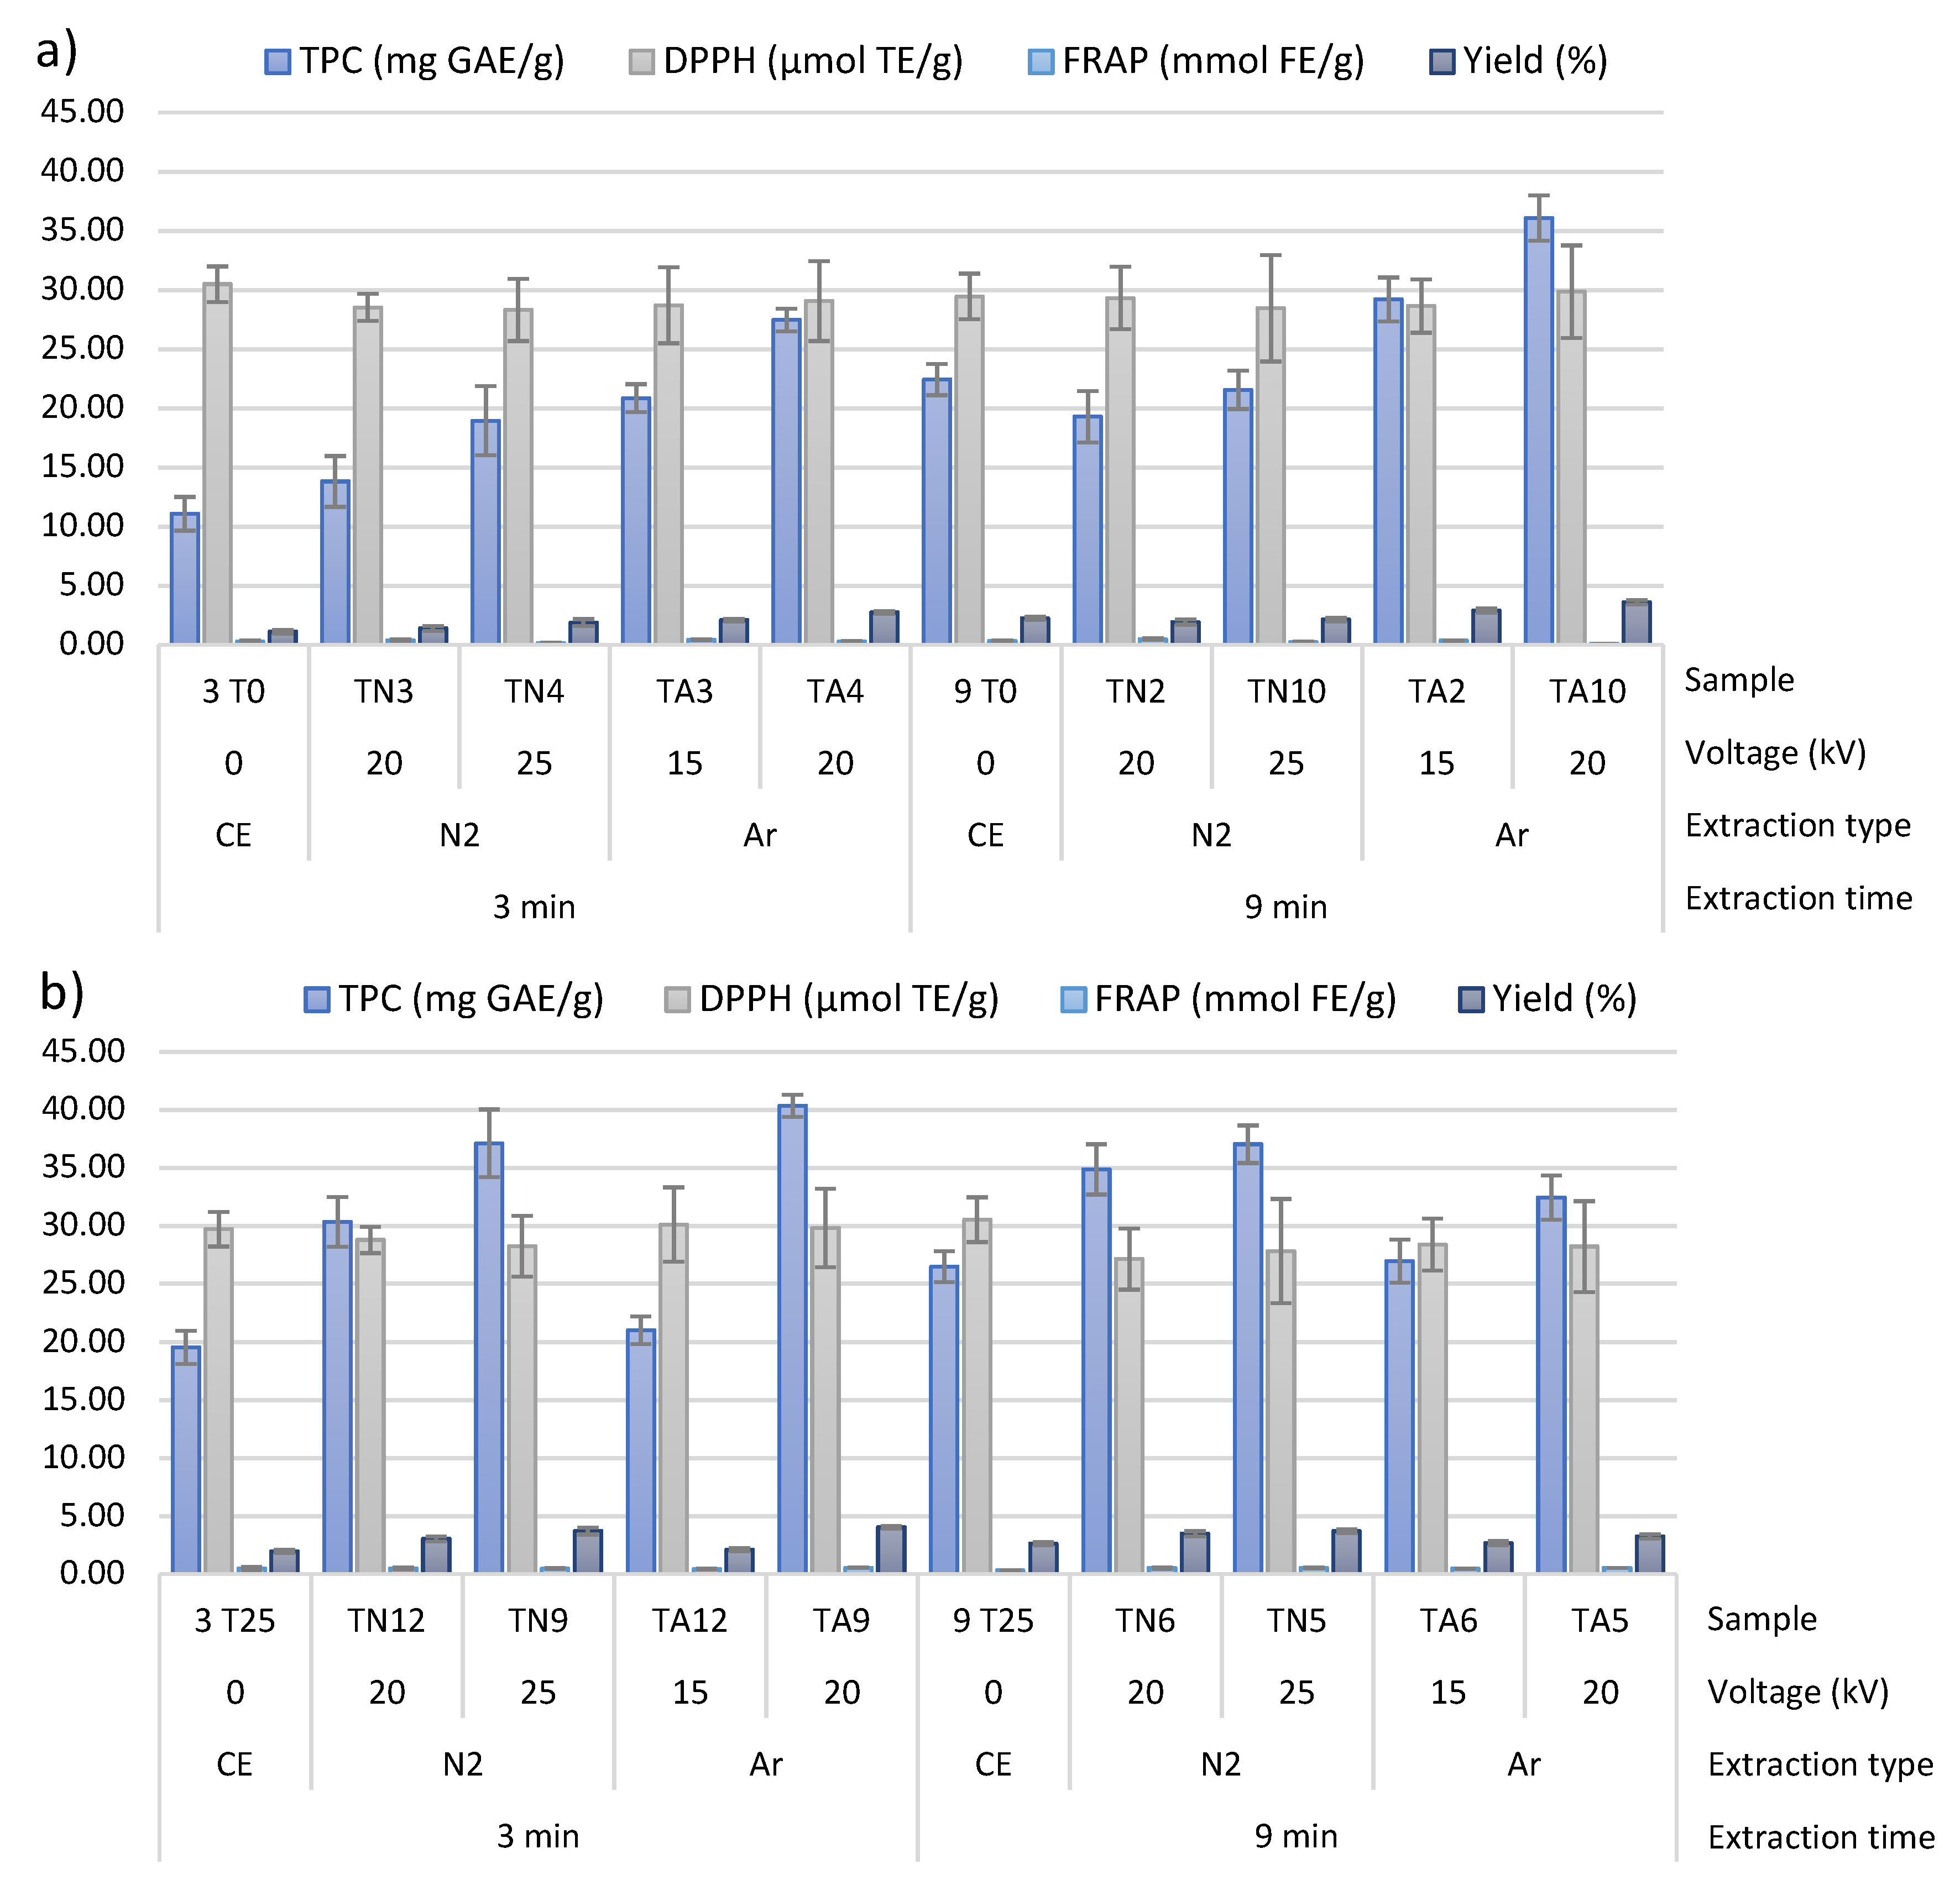
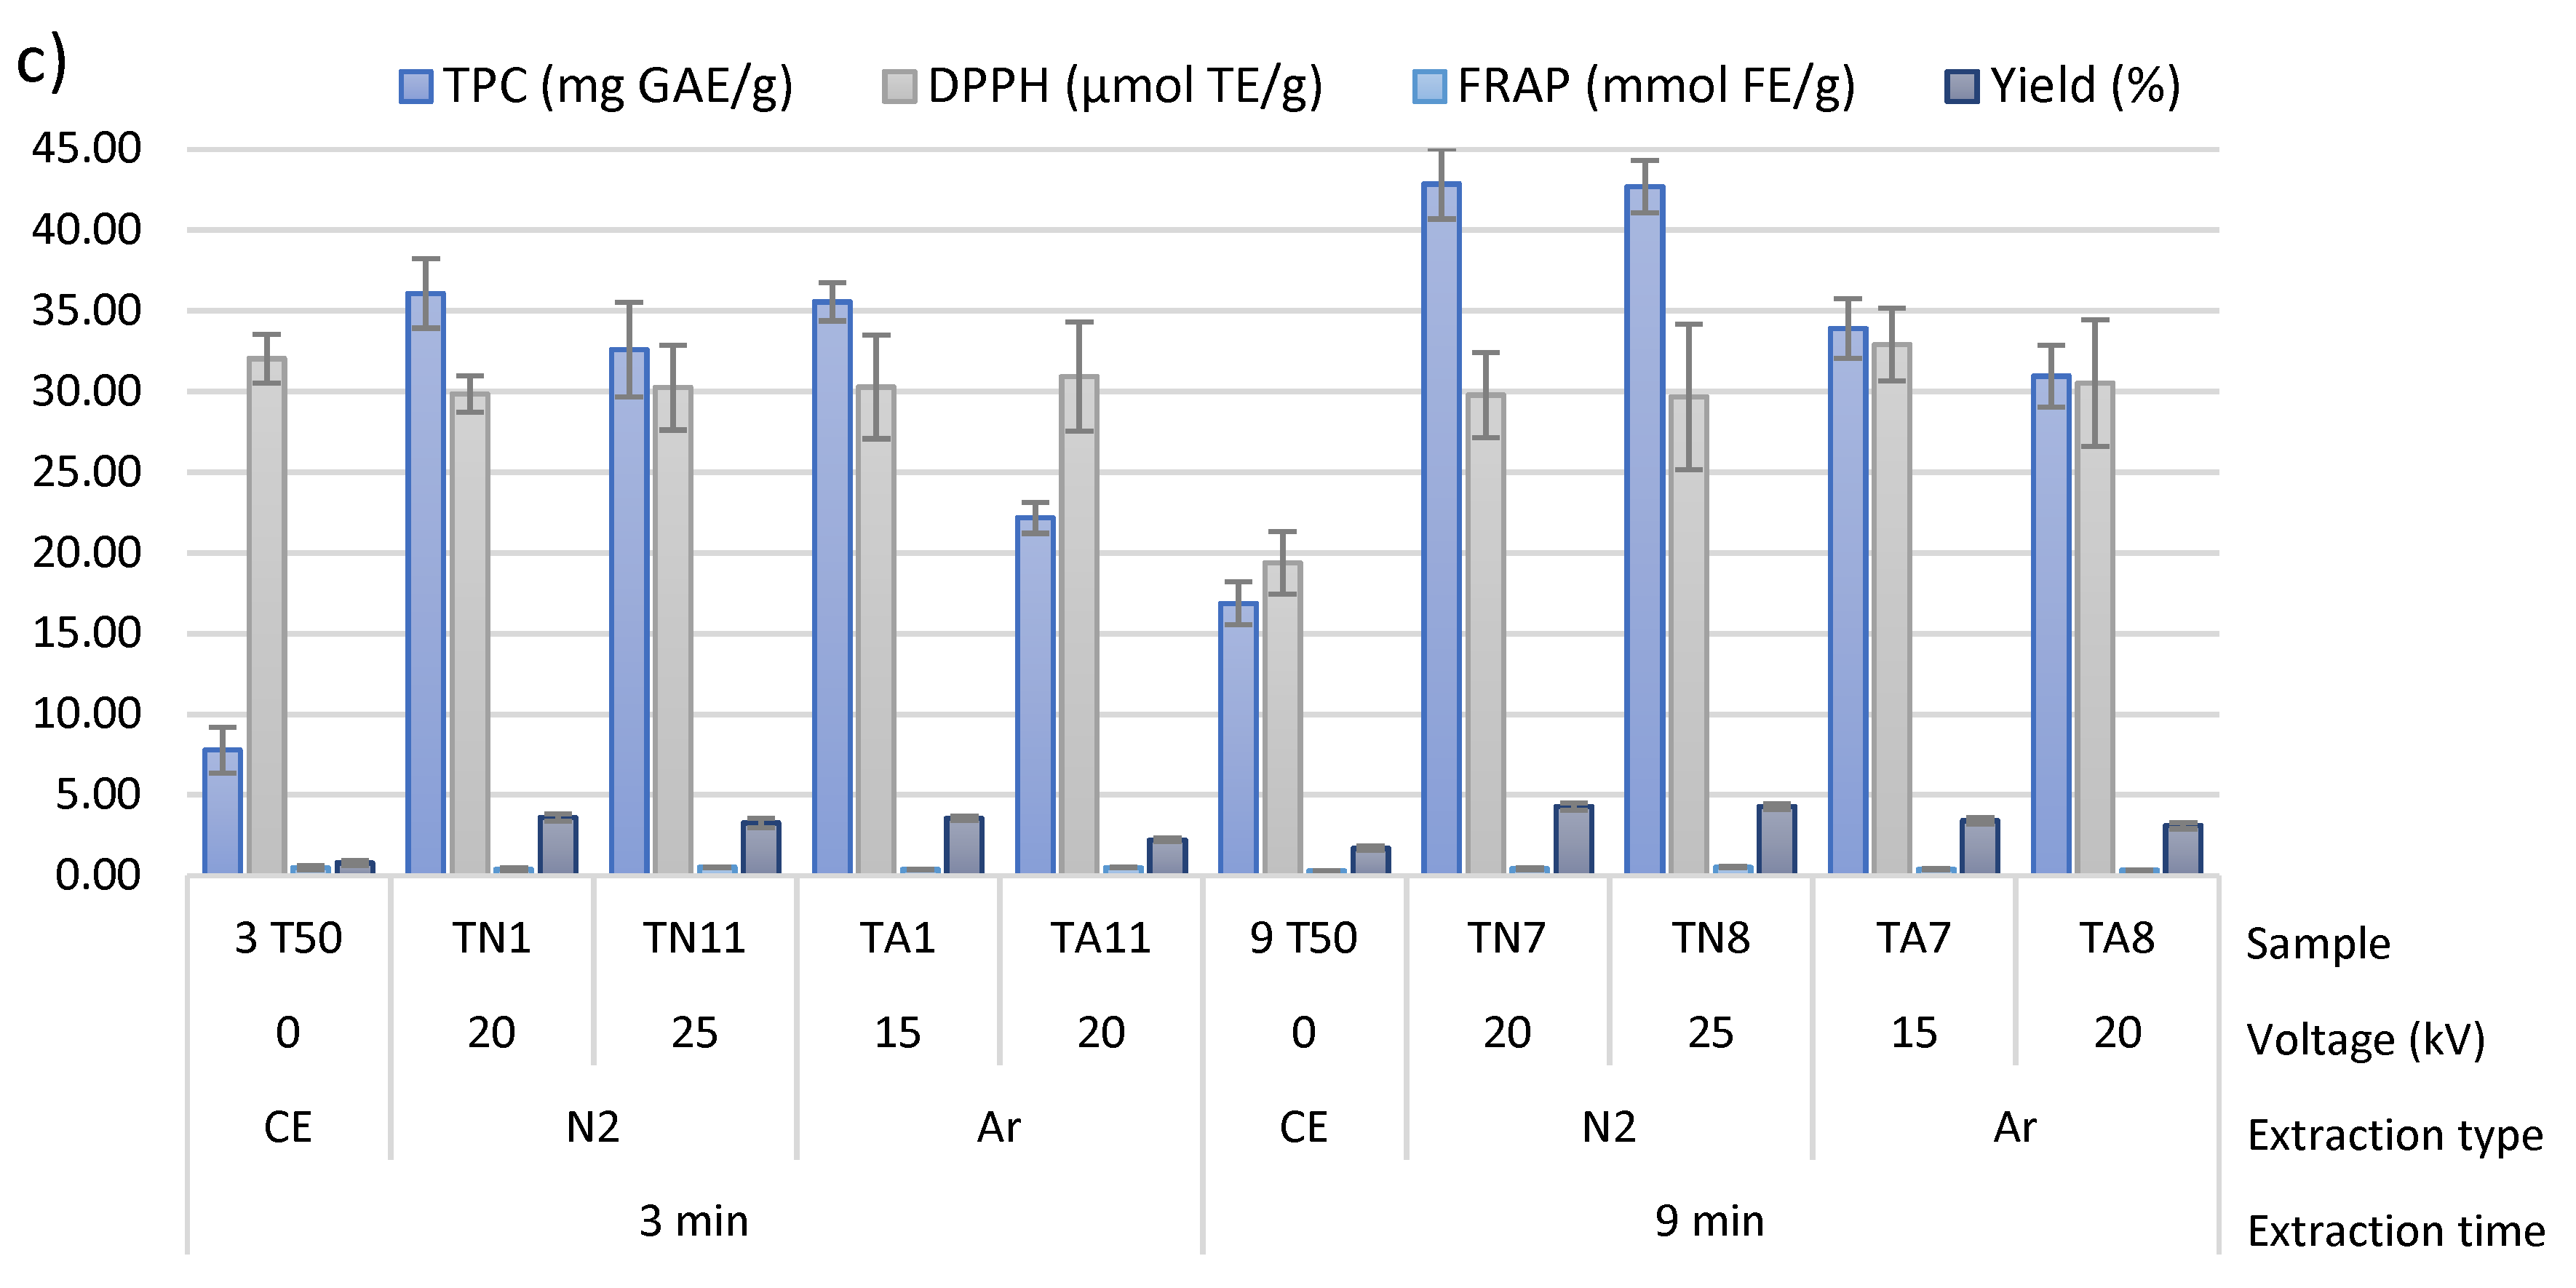
3.2.2. Effect of HVED-Assisted Extraction on Recovery of Bioactive Compounds from Wild Thyme

BACs are generally used in various industries such as food, cosmetic and pharmaceutical industries, especially due to the their antioxidative, antiseptic and antitumor capacity [32]. Extraction of BACs from wild thyme was performed by HVED as a green extraction technology in order to obtain high-quality extracts reach in BACs that could be used for functional food production. The obtained extracts were analyzed for total phenolic content and antioxidant activity (DPPH and FRAP) and compared with modified CE (Figure 2).
HVED extraction showed higher results for all measured methods including TPC, DPPH and FRAP. The highest content of TPC was found in extract TN7 that was extracted using HVED, nitrogen at 20 kV, and with 50% ethanol (42.86 ± 2.38 mg GAE/g, Figure 2c). The highest antioxidant activity was found in extracts obtained by HVED using argon: TA7 and TA9 for DPPH and FRAP methods, respectively. Better extraction of polyphenols and antioxidants was enhanced generally with longer treatment time, higher ethanol content and higher voltage. TPC and DPPH were higher for treatment with nitrogen than argon, while FRAP values were higher for argon treatment. In order to define the best extraction parameters, it is necessary to establish the amount of BACs extracted according to the defined experimental design. Statistically significant influence of ethanol content was noted for TPC and FRAP, while longer treatment time significantly influenced to DPPH results (Table 6). Based on the model, the extraction yield was expressed as percentage of extracted polyphenols per g of sample (g GAE/g of sample). Therefore, yield of extraction was in line with results of TPC and the same trend was noted. The highest yield of extraction was seen for extract TN7 extracted with HVED using nitrogen for 9 min, at 20 kV with 50% of ethanol. In average, HVED extraction showed 2.03 higher yield of extraction compared to CE under same extraction conditions (ethanol content and time of extraction), and it was 2.07 times higher for nitrogen and 1.99 times higher for extraction with argon. A correlation analysis between TPC, DPPH and FRAP showed that the highest correlation was found between TPC and FRAP (0.259). Although these correlations were not high, all methods showed positive correlations. This is not an unusual occurrence since each of this method is based on different mechanism and is performed in different conditions.
Jovanović et al. measured TPC in wild thyme extracts after extraction with 1:30 solid-to-solvent ratio and 50% ethanol. With these conditions, results were 26.6, 29.8 and 32.7 mg GAE/L for extraction by maceration, heat and ultrasound-assisted techniques, respectively [5]. These results are much lower compared to HVED, since extract TN7 that had the highest TPC (42.86 ± 2.38 mg GAE/g) had the equivalent of 214.31 mg GAE/L. Đukić et al. evaluated various conventional (Soxhlet and macerate extraction) and non-conventional extraction (ultrasound, microwave and subcritical water extractions) methods from wild thyme. The results showed that the highest TPC and antioxidant activity was found using subcritical water extraction (141.12 ± 0.23 mg GAE/g and 170.32 ± 0.87 mg AA/G) [33]. Although these results seems higher compared to our study, no conclusions could be made regarding the best extraction method since different analytical methods were used and different solvents with different solvent to solid ratio were used.

3.2.3. Effect of HVED on Phenolic Composition of the Extracts

Results of the performed UPLC-MS/MS analysis from wild thyme extracts have shown (Table 4) that the main compounds in wild thyme extracts were in the following order, according to their average content in all extracts: rosmarinic acid, oleanolic acid, luteolin, apigenin, diosmetin, hydroxytyrosol, quercetin, carnosol, camphor, thymol, p-cymene, and carvacrol. Rosmarinic acid was found to be the main phenolic compound found in wild thyme extracts, which was already confirmed by Jovanović et al. [5]. Rosmarinic acid was found in higher concentrations in HVED extracts compared to CE and it was higher with higher concentrations of ethanol, up to 50% in extracts. Chromatograms of representative extracts obtained by CE (Figure S1) and HVED (Figure S2) present the main components found by UPLC-MS/MS and their differences. The most pharmacological importance of rosmarinic acid is its antioxidant and anti-diabetic properties [34]. For that reason, wild thyme extracts are a valuable source for functional food production. Apigenin, carnosol, luteolin, oleanolic acid, quercetin, rosmarinic acid and camphor were found to be statistically significant higher with higher ethanol content. Also, luteolin and cymene significantly depended on treatment type. The sum of all BACs measured by UPLC-MS/MS was compared with results of TPC and correlation of 0.384 (Table S1) was found between UPLC-MS/MS results and TPC, which is the highest correlation compared to DPPH and FRAP.
Experimental results have confirmed theoretical results obtained by HSPs and COSMO-RS software. Apigenin, luteolin and rosmarinic acid were confirmed to be better soluble with higher ethanol content of the solvent, which was also indicated by the theoretical results (Table 1 and Table 2). Although theoretical results showed better solubility of these compounds in ethanol, compared to water, still poor solubility was expected in both solvents calculated by HSPs (Table 1). Low probability of solubility (red color, Table 2) was also expected by COSMO-RS prediction in water. However, for apigenin, luteolin and rosmarinic acid, a very high probability (100%) was predicted for solution in ethanol. Therefore, it can be concluded that experimental results confirmed theoretical results regarding higher solubility of wild thyme compounds in ethanol compared to water. On the other hand, better results are given with COSMO-RS software than HSPs since high concentrations of apigenin, luteolin and especially rosmarinic acid were found after extraction with HVED.

3.2.4. Effect of HVED on the Content of Volatile Compounds in Wild Thyme Extracts

Results of HS-SPME/GC-MS analysis of volatile compounds from wild thyme extracts are given in Table 5. Carvacrol and thymol were already measured by UPLC-MS/MS, but very low concentrations were found by this methods (< 3 ng/mL), so these volatile compounds were measured also by HS-SPME/GC-MS. Results showed that monoterpenoid phenol carvacrol (0.47–21.86%) was the predominant volatile compounds found in wild thyme extracts, followed by linalool, thymol, and finally, 1,8-cineole that was found in small amounts (0.96–3.46%). A similar trend was found in a study where wild thyme essential oil was extracted by supercritical carbon dioxide as another green extraction method, and carvacrol and thymol were found as main compounds in the extract. That study demonstrated that oil rich fraction of the CO2 extract yields were 0.3–0.5% [35]
All measured compounds were found in higher concentrations in HVED extracts, compared to CE. 1,8-cineol and linalool were higher in HVED extracts obtained with nitrogen, while thymol and carvacrol were higher in extracts where argon was used. The differences between CE and HVED treated extracts in the same extraction conditions are presented in Figure S3a–c. The influence of ethanol content was difficult to assess, since overlapping of peaks profile happened with ethanol peak in chromatograms. For that reason, most extracts containing ethanol do not have available data for compound concentration. However, a traceability of results is visible in HVED extracts with nitrogen (RN2-RN6 and RN9-RN10) and argon (RA2-RA6 and RA9-RA10), except for linalool that was found in extracts MA5 and MA6, while it was not found in extracts MN5 and MN6. Similar results were presented in study by Sonmezdag et al., where thymol and carvacrol were found to be the main components of essential oil of wild thyme, assessed by GC-MS [36].
Results of thymol, carvacrol and linalool were compared with theoretical prediction models where low solubility was expected in water measured with both methods (HSPs and COSMO-RS) and in ethanol when calculated by HSPs. However, very good solubility of carvacrol and thymol (100%) was expected in ethanol, while medium solubility was expected for linalool (52.48%) evaluated by COSMO-RS software. Since it was difficult to evaluate experimentally extracts containing ethanol, no clear correlations can be drawn with theoretical results. On the other hand, COSMO-RS results showed lower probability of solubility of linalool, compared to thymol and carvacrol, which was proven with experimental results.

3.2.5. Determination of Pesticides and Heavy Metals in Wild Thyme Samples

High levels of pesticides and metals in food could cause serious toxicological effects. For that reason, it is important to monitor level of pesticides and metals even in raw material, in order to assure high-quality final product. The results of pesticides from dried wild thyme are given in Table 7. Residue levels of pesticides were determined according to EC Regulation No 396/2005. This Regulation include EU Pesticides database with all active substance of pesticide (EC 1107/2009) and their MRLs (EC 396/2005). Results showed that residue levels of all pesticides measure in wild thyme were lower than limit of quantitation of the method. For that reason, no exact data are provided. For most results, limit of quantification was below MRL and for other data it was not possible to quantify exact level and analyze if it was below MRL.
Residue level of heavy metals was determined according to EC Regulation No 1881/2006. Results showed that levels of heavy metals lead (Pb), cadmium (Cd) and mercury (Hg) in dried wild thyme sample were below MRLs for each substance (Table 8). Further analysis of safety and quality included analysis of other metals (chromium (Cr), nickel (Ni), manganese (Mn), iron (Fe), copper (Cu) and zinc (Zn)). These metals were measured in dried wild thyme material and in HVED extract (TN8). For these metals, no MRL data is provided because these are not included in EC Regulations. Although results are given for dried wild thyme per kilogram of plant and for extract per kilogram of final extract, it is clear that levels of Ni, Mn, Fe, Cu and Zn decreased, while level of Cr significantly increased. It could have happened because of abrasion of electrodes during HVED treatment and release of metals, such as Cr, in a solvent. However, it is possible to obtain safe and high-quality final extract of wild thyme since dried plant is considered as safe for human use. Detailed analyzes should be performed regarding levels of metals released in extracts during HVED treatment.

4. Materials and Methods

4.1. Theoretical Prediction

4.1.1. Hansen Solubility Parameters (HSPs)

HSPs is a method for characterization of solute-solvent interactions according to the classical “like dissolves like” rule. A detailed concept of HSPs is described in paper by Aissou et al. [30]. For solvent optimization, a simple composite affinity parameter, the RED number, has been calculated to determine the solubility between solvents and solutes:
RED = R a R o
where Ro is the radius of a Hansen solubility sphere and Ra is the distance of a solvent from the center of the Hansen solubility sphere. The Hansen solubility sphere is determined by three Hansen parameters: dispersion (δd), polar (δp) and hydrogen bonding (δh) where R0 determines the radius of the sphere in Hansen space and its center is the three Hansen parameters.
A potentially good solvent has RED number smaller than 1 (the compound has similar properties and will dissolve), while medium and poor solvents have RED values of from one to three and more than 3, respectively. The chemical structures of the solvents and solutes discussed in this article could be mutually transformed by JChemPaint version 3.3 (GitHub Pages, San Francisco, CA, USA) to their simplified molecular input line entry syntax (SMILES) notations, which were subsequently used to calculate the solubility parameters of the solvents and compounds (HSPiP Version 4.0, Hansen Solubility, Hørsholm, Denmark).

4.1.2. Conductor-Like Screening Model for Real Solvents (COSMO-RS) Software

The COSMO-RS software is a statistical thermodynamic method for molecular description and solvent screening based on a quantum-chemical approach [37]. The prediction is based on a two-step procedure—microscopic and macroscopic. The procedure was explained in details by Aissou et al. [30]. The COSMOthermX program (version C30 release 13.01) was used to calculate the relative solubility between the solid compound and the liquid solvent in terms of the logarithm of the solubility in mole fractions (log10(xsolub)). The logarithm of the best solubility was set to 0 and all other solvents were given relative to the best solvent. Also, the logarithm was transformed into probability of solubility (%). The calculation was performed at room temperature (20 °C). As an example, Figure 3 depicts the molecular structure of thymol and its sigma surface.

4.2. Experimental Procedure

4.2.1. Plant Materials

Dried wild thyme (Thymus serpyllum L.) material was used for extractions. It was provided by local specialized herb store (Suban d.o.o., Samobor, Croatia). Plant material was collected during the flowering season in 2017, in the northwestern part of Croatia, dried naturally, and stored in polyethylene bags in a dark and dry place, at ambient temperature until extractions. Measured plant particle size distribution was measured by the laser particle size analyzer Mastersizer 2000 (Malvern Instruments GmbH, Herrenberg, Germany) and results were as following: d(0.1) ≤ 158.4 μm; d(0.5) ≤ 289.0 μm; d(0.9) ≤ 457.4 μm. All extractions were performed using 1 ± 0.01 g of herb material added to 50 mL of extracting solvent (distilled water, 25% and 50% aqueous ethanol (v/v)) based on preliminar study results were different solvent to herb ratios were used and higher range of ethanol content.

4.2.2. High Voltage Electrical Discharge (HVED) and Conventional Extraction

For high voltage electric discharge generation, a IMP-SSPG-1200 generator (Impel group d.o.o., Zagreb, Croatia) was used previously described in more detail by Nutrizio et al. [38]. Previously optimized extraction parameters were set to frequency of 100 Hz, pulse width of 400 ns, voltage of 15 and 20 kV for argon gas and 20 and 25 kV for nitrogen gas, and treatment time of 3 and 9 min. The extraction was performed in a 100 mL beaker shaped reactor where the herb-mixture was transferred. The gap between electrodes was 15 mm. Argon and nitrogen gases were flowed in through the needle with the flow 0.75 L min−1. Power used during the HVED treatment was measured directly from the HVED instrument. A modified conventional extraction (CE) method was performed for comparison purposes, with same extraction conditions as HVED: at (room) temperature by dissolving the dried thyme material (1 g) in the solvent (50 mL) with light magnetic stirring during 3 or 9 min. Both extractions, HVED and conventional, were performed in duplicates.

4.2.3. Physical Properties of Wild Thyme Extracts

The pH and electrical conductivity of extracts were measured immediately after HVED treatment using a pH and conductivity meter HI-2030-edge (Hanna Instruments, Bedfordshire, UK). Temperature was measured using an infrared thermometer PCE-777 (PCE Instruments Ltd., Southampton Hampshire, UK).
Electrical conductivity measurements of the extracts were used to quantify the degree of cell permeabilization induced by HVED treatment of given intensity. The results are presented as cell disintegration index (Zp) and are calculated according to literature data for pulsed electric fields [39] with some modifications, expressed as follows:
Z p = σ t σ i σ d σ i
where σt is the actual measured conductivity value of the extract, σi is the conductivity of the extract obtained from untreated samples (intact cell tissue), while σd is the highest value of conductivity, related to the maximally damaged cell tissue. For each treatment condition investigated the Zp value ranged between 0 (for intact tissue) and 1 (for fully permeabilized tissue).

4.2.4. Determination of Total Phenolic Content (TPC)

TPC of thyme extracts was determined using Folin-Ciocalteu method as previously described [38]. The calibration curve was prepared using 50 to 500 mg/L of gallic acid in ethanol. The concentration of TPC was expressed in mg of gallic acid equivalents per gram of sample (mg GAE/g of sample). All measurements were performed in duplicates.

4.2.5. Determination of Antioxidant Capacity

2,2-Diphenyl-2-Picrylhydrazyl (DPPH) Free Radical Assay

DPPH assay of thyme extracts was determined according to previously reported procedure [38]. The results were calculated using calibration curve for Trolox and expressed as µmol of Trolox equivalents per gram of samples (µmol TE/g of sample).

Ferric Reducing Antioxidant Power (FRAP) Assay

The FRAP assay was conducted as previously reported [40]. FRAP values were calculated according to the calibration curve for FeSO4·7H2O and expressed as µmol of Fe2+ equivalents (FE) per gram of sample (µmol FE/g of sample).

4.2.6. Ultra Performance Liquid Chromatography-Tandem Mass Spectrometry Characterization of Phenolic Compounds (UPLC-MS/MS)

Method for UPLC-MS/MS (Expert Ultra LC 110, Eksigent, Redwood city, CA, USA; 4500 QTRAP SCIEX, Redwood city, CA, USA) reference conditions [41] were conducted using a Luna Omega 3 μm Polar C18 100 Å, 100 × 4.6 mm column (YMC America, Inc., Allentown, PA, USA) at a thermostatted column temperature of 40 °C, automatic sampling temperature 4 °C, and injection volume 10 μL using the original wild thyme extract concentration obtained by CE and HVED. Mobile phases consisted of: A 100% H2O with 0.1% HCOOH (v/v) and B 100% acetonitrile with 0.1% HCOOH (v/v) with mobile phase flow 0.40 mL/min. Gradient was set as follows: 1 min 10% B, 2 min 10% B, 15 min 90% B, 25 min 90% B, 27 min 10% B, 30 min 10% B. Determination conditions for MS/MS detector were: ionization -negative ionisation mode atmospheric pressure - negative ionization at atmospheric pressure; ionization temperature: 500 °C, i.e., gas temperature combining the mobile phase at the exit from the capillary before ionization; curtain gas 30 psi, temperature of 500 °C, ion souce gas 1–50 psi, ion souce gas 2–55 psi. Voltage on the electrode after capillary and next to ionization (ion spray voltage) was −4500 V. Limit of detection for all compounds was 0.10 ng/mL. A post-acquisition data processing was done in MultiQuant 3.0.2. Software, v3.022950.0, 2015.

4.2.7. Headspace Solid-Phase Microextraction (HS-SPME) Followed by Gas Chromatography and Mass Spectrometry Analysis (GC-MS)

HS-SPME was performed with manual SPME holder using three fiber covered with DVB/CAR/PDMS (Supelco Co., Bellefonte, PA, USA). For HS-SPME, the finely samples 2 mL were placed separately in 10 mL glass vials and hermetically sealed. The vials were maintained at 60 °C during equilibration (15 min) and extraction (45 min). Thereafter, the SPME fiber was withdrawn and inserted into GC-MS injector (250 °C) for 6 min for thermal desorption. The procedure was similar as reported [42]. GC-MS analyses were done on an Agilent 7890A Gas Chromatograph (Agilent Technologies, Palo Alto, CA, USA) equipped with a mass spectrometer (MSD) model 5977E (Agilent Technologies) and HP-5MS capillary column (5% phenyl-methylpolysiloxane, Agilent J & W). The GC conditions were same as reported previously by Jerković et al. (2016). The oven temperature was set at 70 °C for 2 min, then increased from 70 to 200 °C (3 °C/min) and held at 200 °C for 18 min; the carrier gas was helium (1.0 mL/min). The compounds identification was based on the comparison of their retention indices (RI), determined relatively to the retention times of n-alkanes (C9–C25), with those reported in the literature [43] and those from Wiley 9 (Wiley, New York, NY, USA) and NIST 14 (National Institute of Standards and Technology; Gaithersburg, MD, USA) mass spectral database. The percentage composition of the samples was computed from the GC peak areas using the normalization method (without correction factors).

4.2.8. Determination of Pesticides and Metals in Thyme Samples

The analysis of pesticides was performed by modified procedures according to national regulations HRN EN ISO 12393-1, 12393-2 and 12393-3: 2013, extraction with petroleum ether/dichloromethane and determination using the GC-ECD Varian CP-3800 instrument (Varian, Inc., Walnut Creek, CA, USA).
Metal trace content was determined according to the HRN EN ISO 14084: 2005 procedure, or by wet sample digestion by HNO3 (microwave digestion) with microwave reaction system Multiwave 3000 (Anton Paar GmbH, Graz, Austria). Determination of metals were conducted on the Perkin Elmer AAS Analyst 800 and ICP-MS Perkin Elmer NexION 300X (PerkinElmer, Inc., Waltham, MA, USA), while Hg traces were determined by the Leco AMA254 Hg analyzer (LECO Inc., St. Joseph, MI, USA).

4.2.9. Experimental Design and Statistical Analysis

The experiment was designed in STATGRAPHICS Centurion (StatPoint Technologies, Inc, Warrenton, VA, USA) software and it is presented in Table 9. All experimental results are shown for extracts obtained by HVED and modified conventional extraction (CE) for comparison. Each sample denotes different process parameters, where T stands for thyme, N for nitrogen gas used during HVED treatment and A for argon. Multi-factor categorical design consisted of 12 experimental trials per gas (argon and nitrogen). The three chosen independent variables for HVED assisted extraction were: treatment time (3 and 9 min), voltage applied during HVED (15 kV or 20 kV for argon, and 20 kV or 25 kV for nitrogen) and concentration of ethanol (0%, 25% or 50%). For HVED extraction, numbers 1–12 are the order of conducted treatment, and in CE extraction, 3 and 9 are referred to treatment time while 0, 25, and 50 stands for concentration of an ethanol solvent (%). A total of 30 extracts were prepared in duplicates and all results are given as average ± standard deviation (SD).
Statistical analysis was performed in XLStat (MS Excel 2010). The PCA analysis of theoretical prediction results (using HSPs and COSMO-RS) was performed in XLStat (MS Excel 2010). The PCA was used as a multivariate statistical analysis tool in the processing of the theoretical results to detect qualitative similarities or differences between two different prediction models. Coding of results was performed before modelling with the purpose of uniformed results: 0 (red color in Table 1 and Table 2), 1 (yellow color) and 2 (green color). A PCA model after Varimax rotation was chosen.
ANCOVA was used to analyze the impact of independent variables: treatment time, voltage, ethanol content and treatment type (CE, HVED—nitrogen or HVED—argon) to measured physical and chemical parameters. For UPLC-MS/MS and GC-MS results, all individual (data not shown) and sum of concentrations of all compounds was assessed. The p-values present the statistical significance of each of the factor, and it was significant at p ≤ 0.05.

5. Conclusions

In this work the potential of green extraction of BACs from wild thyme by theoretical and experimental approach was demonstrated. The results of experimental study confirmed the potential of HVED for extractions of wild thyme bioactive compounds using water and ethanol. Extraction yield of polyphenols and antioxidants was enhanced with longer treatment time, higher ethanol content and higher voltage, and it was higher for treatment with nitrogen than argon. In average, HVED extraction showed 2.03 higher yield of extraction compared to CE under same extraction conditions (ethanol content and time of extraction), and it was 2.07 times higher for nitrogen and 1.99 times higher for extraction with argon. The main phenolic compound found in wild thyme extracts was rosmarinic acid, while the predominant volatile compound was monoterpenoid phenol carvacrol. Furthermore, experimental results confirmed theoretical results since higher solubility of wild thyme bioactive compounds was found in ethanol than water. However, more accurate results were obtained using COSMO-RS software, compared to HSPs. Wild thyme extracts obtained by HVED are considered as safe, in terms of pesticides and metals levels, and present a high-quality source of valuable BACs for further use in functional food production.
HVED was presented as fast and effective nonthermal technology where thermolabile BACs are being preserved and recovered in high concentrations. Furthermore, HVED has a potential to be scaled-up to industrial level to replace less environmentally acceptable conventional extraction methods. Finally, the results from this study encourage further investigation of HVED as a green extraction method and its comparison with other green extraction methods.

Supplementary Materials

The following are available online, Table S1: Correlations between TPC, DPPH, FRAP and sum of all measured compounds by UPLC-MS/MS and GC-MS methods, Figure S1: UPLC-MS/MS chromatograms of main compounds from extract 3 T0: a) apigenin) and b) rosmarinic acid, Figure S2: UPLC-MS/MS chromatograms of main compounds from extract TN8: a) apigenin), b) luteolin, c) rosmarinic acid, and d) oleanolic acid, Figure S3: GC-MS chromatograms of extracts: a) 3 TO, b) TN4, c) TA4 and d) chemical formulas of main compounds found in wild thyme extracts.

Author Contributions

Conceptualization, A.R.J. and M.N.; Methodology, M.N., A.R.J., G.P.; Software, F.C.; Validation, A.R.J.; Formal Analysis, M.N., D.C.; Investigation, M.N., S.C., L.M., F.C., M.B.; Resources, A.R.J.; Data Curation, M.N. and A.R.J.; Writing—Original Draft Preparation, M.N.; Writing—Review & Editing, G.P., A.R.J.; Visualization, M.N.; Supervision, A.R.J., G.P., G.F.; Project Administration, A.R.J.; Funding Acquisition, A.R.J. and M.N. All authors have read and agreed to the published version of the manuscript.

Funding

This research was funded by Croatian Science Foundation: “High voltage discharges for green solvent extraction of bioactive compounds from Mediterranean herbs” grant number [IP-2016-06-1913]. The work of doctoral student Marinela Nutrizio has been fully supported by the “Young researchers’ career development project—training of doctoral students” of the Croatian Science Foundation funded by the European Union from the European Social Fund.

Acknowledgments

Authors would like to thank Renata Fajfer and Paula Žurga from Teaching Institute for Public health of Primorje-Gorski Kotar County for help with analyses of pesticides and metals, also, we would like to thank Igor Dubrović for help with UPLC-MS/MS analysis and analysis of pesticides and metals, and Zvonimir Marijanović for SPME/GC-MS analysis.

Conflicts of Interest

The authors declare no conflict of interest.

References

  1. Varzakas, T.; Kandylis, P.; Dimitrellou, D.; Salamoura, C.; Zakynthinos, G.; Proestos, C. Innovative and Fortified Food: Probiotics, Prebiotics, GMOs, and Superfood. In Preparation and Processing of Religious and Cultural Foods; Elsevier: Amsterdam, The Netherlands, 2018; pp. 67–129. ISBN 9780081018927. [Google Scholar]
  2. Viuda-Martos, M.; Ruiz Navajas, Y.; Sánchez Zapata, E.; Fernández-López, J.; Pérez-Álvarez, J.A. Antioxidant activity of essential oils of five spice plants widely used in a Mediterranean diet. Flavour Fragr. J. 2010, 25, 13–19. [Google Scholar] [CrossRef]
  3. Hussain, A.I.; Anwar, F.; Chatha, S.A.S.; Latif, S.; Sherazi, S.T.H.; Ahmad, A.; Worthington, J.; Sarker, S.D. Chemical composition and bioactivity studies of the essential oils from two Thymus species from the Pakistani flora. Lwt-Food Sci. Technol. 2013, 50, 185–192. [Google Scholar] [CrossRef]
  4. Rasooli, I.; Mirmostafa, S.A. Antibacterial properties of Thymus pubescens and Thymus serpyllum essential oils. Fitoterapia 2002, 73, 244–250. [Google Scholar] [CrossRef]
  5. Jovanović, A.A.; Đorđević, V.B.; Zdunić, G.M.; Pljevljakušić, D.S.; Šavikin, K.P.; Gođevac, D.M.; Bugarski, B.M. Optimization of the extraction process of polyphenols from Thymus serpyllum L. herb using maceration, heat- and ultrasound-assisted techniques. Sep. Purif. Technol. 2017, 179, 369–380. [Google Scholar] [CrossRef] [Green Version]
  6. Chemat, F.; Rombaut, N.; Meullemiestre, A.; Turk, M.; Perino, S.; Fabiano-Tixier, A.-S.; Abert-Vian, M. Review of Green Food Processing techniques. Preservation, transformation, and extraction. Innov. Food Sci. Emerg. Technol. 2017, 41, 357–377. [Google Scholar] [CrossRef]
  7. Yara-Varón, E.; Fabiano-Tixier, A.S.; Balcells, M.; Canela-Garayoa, R.; Bily, A.; Chemat, F. Is it possible to substitute hexane with green solvents for extraction of carotenoids? A theoretical versus experimental solubility study. RSC Adv. 2016, 6, 27750–27759. [Google Scholar] [CrossRef] [Green Version]
  8. Chemat, F.; Abert-Vian, M.; Fabiano-Tixier, A.S.; Strube, J.; Uhlenbrock, L.; Gunjevic, V.; Cravotto, G. Green extraction of natural products. Origins, current status, and future challenges. Trac Trends Anal. Chem. 2019, 118, 248–263. [Google Scholar] [CrossRef]
  9. Häckl, K.; Kunz, W. Some aspects of green solvents. Comptes Rendus Chim. 2018, 21, 572–580. [Google Scholar] [CrossRef]
  10. Benvenutti, L.; Zielinski, A.A.F.; Ferreira, S.R.S. Which is the best food emerging solvent: IL, DES or NADES? Trends Food Sci. Technol. 2019, 90, 133–146. [Google Scholar] [CrossRef]
  11. Chemat, F.; Vian, M.A.; Cravotto, G.; Chemat, F.; Vian, M.A.; Cravotto, G. Green Extraction of Natural Products: Concept and Principles. Int. J. Mol. Sci. 2012, 13, 8615–8627. [Google Scholar] [CrossRef] [Green Version]
  12. Zhou, T.; McBride, K.; Linke, S.; Song, Z.; Sundmacher, K. Computer-aided solvent selection and design for efficient chemical processes. Curr. Opin. Chem. Eng. 2020, 27, 35–44. [Google Scholar] [CrossRef]
  13. del Pilar Sánchez-Camargo, A.; Bueno, M.; Parada-Alfonso, F.; Cifuentes, A.; Ibáñez, E. Hansen solubility parameters for selection of green extraction solvents. TrAC—Trends Anal. Chem. 2019, 118, 227–237. [Google Scholar]
  14. Sicaire, A.-G.; Filly, A.; Vian, M.; Fabiano-Tixier, A.-S.; Chemat, F. Cosmo-RS-Assisted Solvent Screening for Green Extraction of Natural Products. In Handbook of Green Chemistry; Wiley-VCH Verlag GmbH & Co. KGaA: Weinheim, Germany, 2018; pp. 117–138. [Google Scholar]
  15. Chemat, F.; Abert Vian, M.; Fabiano-Tixier, A.-S.; Nutrizio, M.; Režek Jambrak, A.; Munekata, P.E.S.; Lorenzo, J.M.; Barba, F.J.; Binello, A.; Cravotto, G. A review of sustainable and intensified techniques for extraction of food and natural products. Green Chem. 2020, 22, 2325–2353. [Google Scholar] [CrossRef] [Green Version]
  16. Sarkis, J.R.; Boussetta, N.; Tessaro, I.C.; Marczak, L.D.F.; Vorobiev, E. Application of pulsed electric fields and high voltage electrical discharges for oil extraction from sesame seeds. J. Food Eng. 2015, 153, 20–27. [Google Scholar] [CrossRef]
  17. Yan, L.-G.; Deng, Y.; Ju, T.; Wu, K.; Xi, J. Continuous high voltage electrical discharge extraction of flavonoids from peanut shells based on “annular gap type” treatment chamber. Food Chem. 2018, 256, 350–357. [Google Scholar] [CrossRef] [PubMed]
  18. Xi, J.; He, L.; Yan, L. Continuous extraction of phenolic compounds from pomegranate peel using high voltage electrical discharge. Food Chem. 2017, 230, 354–361. [Google Scholar] [CrossRef]
  19. Sarkis, J.R.; Boussetta, N.; Blouet, C.; Tessaro, I.C.; Marczak, L.D.F.; Vorobiev, E. Effect of pulsed electric fields and high voltage electrical discharges on polyphenol and protein extraction from sesame cake. Innov. Food Sci. Emerg. Technol. 2015, 29, 170–177. [Google Scholar] [CrossRef]
  20. El Kantar, S.; Rajha, H.N.; Boussetta, N.; Vorobiev, E.; Maroun, R.G.; Louka, N. Green extraction of polyphenols from grapefruit peels using high voltage electrical discharges, deep eutectic solvents and aqueous glycerol. Food Chem. 2019, 295, 165–171. [Google Scholar] [CrossRef]
  21. El Kantar, S.; Boussetta, N.; Rajha, H.N.; Maroun, R.G.; Louka, N.; Vorobiev, E. High voltage electrical discharges combined with enzymatic hydrolysis for extraction of polyphenols and fermentable sugars from orange peels. Food Res. Int. 2018, 107, 755–762. [Google Scholar] [CrossRef]
  22. Tayel, A.A.; Almabady, N.A.; Sorour, N.M.; Diab, A.M. Application of natural plant extracts as colorants, preservatives, and anti-listerial agents in processed fish products. J. Food Saf. 2018, 38, e12435. [Google Scholar] [CrossRef]
  23. Bouarab Chibane, L.; Degraeve, P.; Ferhout, H.; Bouajila, J.; Oulahal, N. Plant antimicrobial polyphenols as potential natural food preservatives. J. Sci. Food Agric. 2019, 99, 1457–1474. [Google Scholar] [CrossRef] [PubMed] [Green Version]
  24. Niu, B.; Shao, P.; Luo, Y.; Sun, P. Recent advances of electrosprayed particles as encapsulation systems of bioactives for food application. Food Hydrocoll. 2020, 99, 105376. [Google Scholar] [CrossRef]
  25. Froiio, F.; Mosaddik, A.; Morshed, M.T.; Paolino, D.; Fessi, H.; Elaissari, A. Edible Polymers for Essential Oils Encapsulation: Application in Food Preservation. Ind. Eng. Chem. Res. 2019, 58, 20932–20945. [Google Scholar] [CrossRef]
  26. Yang, S.; Liu, L.; Han, J.; Tang, Y. Encapsulating plant ingredients for dermocosmetic application: An updated review of delivery systems and characterization techniques. Int. J. Cosmet. Sci. 2020, 42, 16–28. [Google Scholar] [CrossRef] [PubMed]
  27. Jurić, S.; Sopko Stracenski, K.; Król-Kilińska, Ż.; Žutić, I.; Uher, S.F.; Đermić, E.; Topolovec-Pintarić, S.; Vinceković, M. The enhancement of plant secondary metabolites content in Lactuca sativa L. by encapsulated bioactive agents. Sci. Rep. 2020, 10, 1–12. [Google Scholar] [CrossRef] [Green Version]
  28. Armendáriz-Barragán, B.; Zafar, N.; Badri, W.; Galindo-Rodríguez, S.A.; Kabbaj, D.; Fessi, H.; Elaissari, A. Plant extracts: From encapsulation to application. Expert Opin. Drug Deliv. 2016, 13, 1165–1175. [Google Scholar] [CrossRef]
  29. Santana, Á.L.; Macedo, G.A. Challenges on the processing of plant-based neuronutraceuticals and functional foods with emerging technologies: Extraction, encapsulation and therapeutic applications. Trends Food Sci. Technol. 2019, 91, 518–529. [Google Scholar] [CrossRef]
  30. Aissou, M.; Chemat-Djenni, Z.; Yara-Varón, E.; Fabiano-Tixier, A.S.; Chemat, F. Limonene as an agro-chemical building block for the synthesis and extraction of bioactive compounds. Comptes Rendus Chim. 2017, 20, 346–358. [Google Scholar] [CrossRef]
  31. Mir, S.A.; Siddiqui, M.W.; Dar, B.N.; Shah, M.A.; Wani, M.H.; Roohinejad, S.; Annor, G.A.; Mallikarjunan, K.; Chin, C.F.; Ali, A. Promising applications of cold plasma for microbial safety, chemical decontamination and quality enhancement in fruits. J. Appl. Microbiol. 2019, 129, 474–485. [Google Scholar] [CrossRef] [Green Version]
  32. Vasile, C.; Sivertsvik, M.; Miteluţ, A.; Brebu, M.; Stoleru, E.; Rosnes, J.; Tănase, E.; Khan, W.; Pamfil, D.; Cornea, C.; et al. Comparative Analysis of the Composition and Active Property Evaluation of Certain Essential Oils to Assess their Potential Applications in Active Food Packaging. Materials 2017, 10, 45. [Google Scholar] [CrossRef]
  33. Dukić, D.; Mašković, P.; Vesković Moračanin, S.; Kurćubić, V.; Milijašević, M.; Babić, J. Conventional and unconventional extraction methods applied to the plant, Thymus serpyllum L. In Proceedings of the IOP Conference Series: Earth and Environmental Science, Zlatibor, Serbia, 1–4 October 2017; Institute of Physics Publishing: Bristol, UK, 2017; Volume 85, p. 12064. [Google Scholar]
  34. Ngo, Y.L.; Lau, C.H.; Chua, L.S. Review on rosmarinic acid extraction, fractionation and its anti-diabetic potential. Food Chem. Toxicol. 2018, 121, 687–700. [Google Scholar] [CrossRef] [PubMed]
  35. Oszagyán, M.; Simándi, B.; Sawinsky, J.; Kéry, A. A comparison between the oil and supercritical carbon dioxide extract of hungarian wild thyme (Thymus serpyllum L.). J. Essent. Oil Res. 1996, 8, 333–335. [Google Scholar] [CrossRef]
  36. Sonmezdag, A.S.; Kelebek, H.; Selli, S. Characterization of aroma-active and phenolic profiles of wild thyme (Thymus serpyllum) by GC-MS-Olfactometry and LC-ESI-MS/MS. J. Food Sci. Technol. 2016, 53, 1957–1965. [Google Scholar] [CrossRef] [PubMed] [Green Version]
  37. Klamt, A. Prediction of the mutual solubilities of hydrocarbons and water with COSMO-RS. Fluid Phase Equilib. 2003, 206, 223–235. [Google Scholar] [CrossRef] [Green Version]
  38. Nutrizio, M.; Maltar-Strmečki, N.; Chemat, F.; Duić, B.; Jambrak, A.R. High-Voltage Electrical Discharges in Green Extractions of Bioactives from Oregano Leaves (Origanum vulgare L.) Using Water and Ethanol as Green Solvents Assessed by Theoretical and Experimental Procedures. Food Eng. Rev. 2020, 1–14. [Google Scholar] [CrossRef]
  39. Bobinaitė, R.; Pataro, G.; Lamanauskas, N.; Šatkauskas, S.; Viškelis, P.; Ferrari, G. Application of pulsed electric field in the production of juice and extraction of bioactive compounds from blueberry fruits and their by-products. J. Food Sci. Technol. 2015, 52, 5898–5905. [Google Scholar] [CrossRef]
  40. Žuntar, I.; Putnik, P.; Bursać Kovačević, D.; Nutrizio, M.; Šupljika, F.; Poljanec, A.; Dubrović, I.; Barba, F.J.; Režek Jambrak, A. Phenolic and Antioxidant Analysis of Olive Leaves Extracts (Olea europaea L.) Obtained by High Voltage Electrical Discharges (HVED). Foods 2019, 8. [Google Scholar] [CrossRef] [Green Version]
  41. Arranz, E.; Santoyo, S.; Jaime, L.; Fornari, T.; Reglero, G.; Guri, A.; Corredig, M. Improved Bioavailability of Supercritical Rosemary Extract Through Encapsulation in Different Delivery Systems After In Vitro Digestion. Food Dig. 2015, 6, 30–37. [Google Scholar] [CrossRef]
  42. Jerković, I.; Marijanović, Z.; Kuś, P.M.; Tuberoso, C.I.G. Comprehensive Study of Mediterranean (Croatian) Propolis Peculiarity: Headspace, Volatiles, Anti-Varroa-Treatment Residue, Phenolics, and Antioxidant Properties. Chem. Biodivers. 2016, 13, 210–218. [Google Scholar] [CrossRef]
  43. El-Sayed, A.M. The Pherobase: Database of Insect Pheromones and Semiochemicals. 2009. Available online: http://www.vifabio.de/iqfBio/detail/1643 (accessed on 30 July 2020).
Sample Availability: Samples of the compounds are not available from the authors.
Figure 1. Biplot of the principal component analysis applied on data based on theoretical prediction models including (i) evaluated compounds (marked blue) and (ii) Hansen solubility parameters and COSMO-RS parameters (marked red). H-Hansen solubility parameters, C-COSMO-RS parameters, 1—n-hexane, 2—ethyl acetate, 3—methyl acetate, 4—ethyloleate, 5—ethanol, 6—1-butanol, 7—isopropanol, 8—methanol, 9—limonene, 10—α-pinene, 11—cymene, 12—β-myrcene, 13—cyclopentyl methyl ether, 14—dimethylcarbonate, 15—2-methyltetrahydrofuran, 16—water.
Molecules 25 04131 g001
Figure 2. Determination of bioactive compounds—total phenolic compounds (TPC) values, antioxidant activity (DPPH, FRAP) and yield—measurements for CE and HVED treated samples when: (a) water was used as a solvent, (b) 25% ethanol was used as a solvent, (c) 50% ethanol was used as a solvent. Extraction type: CE—conventional extraction, N2—HVED extraction with nitrogen, Ar-HVED extraction with argon.
Molecules 25 04131 g002aMolecules 25 04131 g002b
Figure 3. Chemical structure of thymol and translation to sigma surface in COSMO-RS software. The red zone represents the negative charge density of the molecule and the positive values of the sigma, green zones represent non-polar surface of the molecule.
Molecules 25 04131 g003
Table 1. Relative energy difference (RED) results by Hansen solubility parameters (HSPs) of bioactive compounds from wild thyme for green solvents in comparison with n-hexane.
Solventsn-HexaneEthyl AcetateMethyl AcetateEthyloleateEthanol1-ButanolIsopropanolMethanolLimoneneα-PineneCymeneβ-MyrceneCPMEDMCMeTHFWater
Monoterpenes
Carvacrol2.521.211.971.433.432.372.564.580.961.641.291.491.121.760.939.34
Thymol2.521.211.971.433.432.372.564.580.961.641.291.491.121.760.939.34
Carene0.941.753.050.404.773.643.825.860.720.000.590.320.772.651.1810.75
α-thujene1.101.703.030.414.733.623.805.820.630.200.400.370.702.561.0910.72
α-terpinene1.351.462.660.404.343.213.405.460.300.470.510.380.522.350.8710.32
δ-terpinene1.331.422.630.354.333.203.105.440.340.460.540.340.482.320.8415.50
Oxygenated monoterpenes
Borneol2.280.911.721.223.332.232.424.460.901.501.301.280.901.630.719.30
α-terpineol2.370.981.681.323.262.152.344.400.971.581.381.371.011.670.829.22
α-Cadinol1.891.242.350.823.952.853.045.080.320.990.690.860.612.020.679.91
Linalool2.101.021.861.073.492.372.564.630.731.321.171.110.801.820.729.46
Piperitone1.821.182.620.804.223.193.375.280.741.020.630.880.551.860.5710.19
Sesquiterpenes
β-caryophyllene1.041.732.970.424.683.543.735.780.610.140.570.330.742.631.1510.65
Copaene1.021.973.290.654.993.864.054.090.830.290.550.590.972.831.3610.97
α-cubebene1.171.752.980.504.673.533.725.790.520.250.460.430.772.641.1510.64
β-elemene0.831.773.120.425.923.733.914.850.870.180.680.350.802.651.2110.84
β-cadinene1.101.692.940.404.643.513.695.740.550.180.500.320.702.581.0910.62
δ-cadinene0.931.853.150.504.863.733.915.950.770.100.600.420.862.731.2610.84
Oxygenated Sesquiterpenes
Isospathulenol1.971.262.250.923.842.732.924.990.391.090.830.950.722.050.769.79
Diterpenes
Carnosic acid2.991.692.051.943.292.262.464.481.382.101.721.981.662.091.489.09
Triterpenes
Rosmarinic acid4.562.952.763.493.112.552.694.202.933.653.183.533.172.852.918.29
Flavanons
Naringenin4.862.952.703.762.822.502.603.763.303.983.523.823.392.593.067.92
Eriodictyol4.532.752.893.443.312.852.984.262.993.643.133.503.082.432.778.55
Flavonoids
Apigenin4.372.782.613.303.072.432.594.192.743.463.013.352.992.742.748.35
Luteolin4.062.662.893.013.592.873.044.072.453.132.623.052.722.682.508.98
Thymusin4.252.682.573.183.112.442.604.232.633.342.883.232.872.652.628.45
Kaempherol-3-glucuronide5.733.622.854.642.172.402.412.854.244.914.534.714.263.103.906.71
Apigenin 6.8-di-c-glucoside3.872.122.422.783.182.522.674.222.352.992.512.852.421.932.118.75
Other Oxygenated
Quinic acid6.234.022.905.201.572.372.271.824.895.515.215.274.823.434.445.70
Caffeic acid5.944.033.154.872.462.472.593.274.385.094.714.924.533.714.226.66
Protocatechuic acid5.994.013.154.912.412.602.623.164.445.144.754.974.563.624.236.61
p-coumaric acid5.253.362.604.182.282.112.183.273.704.404.024.233.843.103.537.14
Vanillin4.742.692.473.642.612.342.433.493.253.903.463.713.252.202.897.84
Vanillic acid5.033.062.423.942.252.042.113.233.484.183.784.003.582.723.257.32
Vitamins (antioxidants)
α-tocopherol1.401.532.720.484.393.263.445.510.240.480.440.460.592.400.9210.36
Ascorbic acid7.845.704.566.793.073.923.832.976.407.076.726.856.415.126.054.79
Relative energy difference (RED): very good solubility 0–1 (green color); medium solubility 1–3 (yellow color); poor solubility > 3 (red color). CPME—cyclopentyl methyl ether, DMC—dimethylcarbonate, MeTHF—2-methyltetrahydrofuran.
Table 2. The conductor like screening model for realistic solvents (COSMO-RS) probability of solubility (%) of bioactive compounds from wild thyme for green solvents in comparison with n-hexane.
Solventsn-HexaneEthyl AcetateMethyl AcetateEthyloleateEthanol1-ButanolIsopropanolMethanolLimoneneα-PineneCymeneβ-MyrceneCPMEDMCMeTHFWater
Monoterpenes
Carvacrol10.96100.00100.00100.00100.00100.00100.00100.0030.9016.9834.6733.11100.00100.00100.000.03
Thymol16.98100.00100.00100.00100.00100.00100.0070.7938.9024.5545.7143.65100.00100.00100.000.01
Carene91.5455.1337.70100.0011.8123.9218.754.2999.2997.7192.2193.5299.4524.4095.920.00
α-thujene93.3351.2933.88100.0010.4722.3918.623.8998.4098.8689.1391.2097.7221.3893.330.00
α-terpinene87.1060.2641.69100.0012.0223.9919.054.27100.0095.5095.5097.72100.0027.54100.000.00
γ-terpinene87.1058.8841.69100.0011.4822.9118.204.1799.9195.5095.5097.72100.0026.9298.860.00
Oxygenated monoterpenes
Borneol11.22100.0089.1381.2885.11100.00100.0041.6917.7813.4916.9816.60100.0038.02100.000.02
α-terpineol11.2275.8657.5450.1260.2687.1077.6230.9020.4214.4520.8920.4297.7231.62100.000.02
α-Cadinol32.35100.0081.28100.0041.6870.7963.0914.1242.6535.4838.0137.15100.0030.90100.000.00
Linalool13.18100.0093.3364.5752.4870.7966.0725.7025.7017.3828.1826.92100.0048.98100.000.01
Piperitone32.35100.0089.1285.1191.20100.00100.0051.2872.4446.7787.0983.1787.0970.79100.000.06
Sesquiterpenes
β-caryophyllene99.9553.7033.11100.007.9418.6214.122.34100.00100.0089.1289.53100.0018.19100.000.00
Copaene100.0031.6217.7893.326.0215.4811.221.4793.32100.0074.1375.8595.498.9189.120.00
α-cubebene100.0037.1521.3797.726.3016.2111.481.6297.72100.0081.2881.28100.0010.9697.720.00
β-elemene83.1779.4354.95100.0010.0019.4915.483.23100.0091.20100.0099.83100.0032.35100.000.00
β-cadinene100.0045.7027.54100.007.0716.9812.581.8699.83100.0085.1185.11100.0014.45100.000.00
δ-cadinene100.0047.8628.18100.007.7618.1913.802.1899.54100.0085.1185.11100.0015.13100.000.00
Oxygenated Sesquiterpenes
Isospathulenol13.4899.9069.1861.6547.8675.8574.1320.8921.8716.2121.3720.41100.0028.84100.000.00
Diterpenes
Carnosic acid0.86100.00100.00100.00100.00100.00100.00100.003.371.413.893.49100.00100.00100.000.00
Triterpenes
Rosmarinic acid0.00100.00100.0034.92100.00100.00100.00100.000.070.010.130.11100.00100.00100.000.02
Flavanons
Naringenin0.00100.00100.0076.03100.00100.00100.00100.000.070.010.120.10100.00100.00100.000.31
Eriodictyol0.00100.00100.00100.00100.00100.00100.00100.000.030.000.050.04100.00100.00100.000.89
Flavonoids
Apigenin0.00100.00100.0025.70100.00100.00100.00100.000.020.000.030.03100.00100.00100.000.18
Luteolin0.00100.00100.0054.95100.00100.00100.00100.000.010.000.020.04100.00100.00100.000.46
Thymusin0.02100.00100.0033.11100.00100.00100.00100.000.280.060.520.46100.00100.00100.000.00
Kaempherol-3-glucuronide0.00100.00100.0021.11100.00100.00100.00100.000.000.000.000.00100.00100.00100.000.46
Apigenin 6.8-di-c-glucoside0.009.7017.800.00100.00100.00100.00100.000.000.000.000.001.630.17100.003.04
Other Oxygenated
Quinic acid0.00100.00100.000.21100.00100.00100.00100.000.000.000.000.0080.7512.09100.0066.50
Caffeic acid0.00100.00100.000.19100.00100.00100.00100.000.000.000.000.00100.0020.89100.0085.11
Protocatechuic acid0.00100.00100.00100.00100.00100.00100.00100.000.030.010.050.04100.00100.00100.0048.04
p-coumaric acid0.00100.00100.0013.27100.00100.00100.00100.000.020.000.030.03100.00100.00100.002.57
Vanillin1.07100.00100.0020.8967.6150.1258.8854.954.902.097.597.0872.4491.20100.000.17
Vanillic acid0.01100.00100.007.94100.00100.00100.00100.000.110.030.180.16100.0093.33100.001.29
Vitamins (antioxidants)
Ascorbic acid0.00100.00100.000.50100.00100.00100.00100.000.000.000.000.00100.0025.91100.00100.00
α-tocopherol66.24100.00100.00100.0015.1942.9333.221.8689.3367.9473.8769.41100.0023.24100.000.00
COSMO-RS: Low probability of solubility 0–20% (red color); medium probability of solubility 20–60% (yellow color); high probability of solubility 60–100% (green color). CPME—cyclopentyl methyl ether, DMC—dimethylcarbonate, MeTHF—2-methyltetrahydrofuran.
Table 3. Values of pH, conductivity (μS/cm) for CE and HVED treated samples, starting temperature (°C), final temperature (°C), power (kW) and cell disintegration index after HVED treatments.
SamplepHConductivity (μS/cm)Starting Temperature (°C)Final Temperature (°C)Power (kW)ZpExtraction Type
3 T05.91 ± 0.20621.0 ± 13.220.6 ± 0.1///CE
9 T05.77 ± 0.17560.0 ± 22.320.6 ± 0.4///
3 T256.06 ± 0.29319.0 ± 12.520.9 ± 0.9///
9 T256.03 ± 0.23283.7 ± 2.620.9 ± 1.2///
3 T506.28 ± 0.34133.8 ± 12.120.2 ± 0.3///
9 T506.28 ± 0.18121.8 ± 9.120.4 ± 0.1///
TN16.13 ± 0.12169.0 ± 2.323.3 ± 1.323.9 ± 1.712.0 ± 0.00.15HVED extraction
TN25.82 ± 0.71522.0 ± 12.124.7 ± 0.227.5 ± 0.516.0 ± 1.00.28
TN35.82 ± 0.32566.0 ± 20.424.7 ± 0.825.3 ± 0.414.0 ± 2.00.41
TN45.83 ± 0.61556.0 ± 13.225.1 ± 0.725.3 ± 1.312.0 ± 0.00.33
TN56.04 ± 0.19299.0 ± 12.825.0 ± 0.425.5 ± 0.522.0 ± 1.00.15
TN66.02 ± 0.81256.0 ± 8.123.8 ± 0.125.1 ± 0.912.0 ± 1.00.05
TN76.31 ± 0.15118.0 ± 11.322.4 ± 1.125.2 ± 1.511.0 ± 2.00.02
TN86.22 ± 0.33115.0 ± 12.722.8 ± 0.324.7 ± 0.617.0 ± 0.00.01
TN96.08 ± 0.71263.0 ± 20.124.2 ± 0.224.5 ± 1.317.0 ± 3.00.02
TN105.77 ± 0.11612.0 ± 30.424.4 ± 0.632.1 ± 2.022.0 ± 1.00.73
TN116.24 ± 1.02114.0 ± 12.524.6 ± 1.225.2 ± 0.620.0 ± 1.00.06
TN126.15 ± 0.26169.0 ± 20.124.5 ± 2.125.1 ± 1.912.0 ± 0.00.03
TA16.13 ± 0.4294.7 ± 11.825.0 ± 0.825.1 ± 2.28.0 ± 1.00.02
TA25.39 ± 0.38646.0 ± 30.125.6 ± 1.137.8 ± 1.312.0 ± 2.01.00
TA35.40 ± 0.27590.0 ± 13.725.3 ± 0.229.0 ± 0.99.0 ± 0.00.59
TA45.55 ± 0.16608.0 ± 14.625.2 ± 2.027.9 ± 1.414.0 ± 1.00.72
TA55.76 ± 0.21351.0 ± 13.921.3 ± 0.531.2 ± 2.316.0 ± 2.00.28
TA65.50 ± 0.34280.0 ± 7.125.0 ± 0.428.5 ± 0.910.0 ± 0.00.10
TA75.12 ± 0.18109.6 ± 9.623.6 ± 1.725.1 ± 1.19.0 ± 1.00.00
TA86.12 ± 1.12116.4 ± 11.520.4 ± 2.327.4 ± 0.817.0 ± 2.00.06
TA95.88 ± 0.51246.2 ± 12.425.1 ± 0.126.1 ± 1.214.0 ± 0.00.13
TA105.60 ± 0.40605.0 ± 17.423.2 ± 0.432.3 ± 0.116.0 ± 1.00.67
TA116.19 ± 0.1889.0 ± 6.323.6 ± 2.424.1 ± 0.212.0 ± 1.00.01
TA125.91 ± 0.26222.7 ± 20.323.8 ± 1.525.2 ± 0.69.0 ± 0.00.08
/—not applicable.
Table 4. UPLC-MS/MS analysis of extractive compounds from thyme (measurements for CE and HVED treated samples) (ng/mL).
SampleConcentration (ng/mL)Extraction Type
ApigeninCarnosolDiosmetinHydroxytyrosolLuteolinOleanolic AcidQuercetinRosmarinic Acidp-CymeneThymolCarvacrolCamphor
3 T012.1140.10131.05112.543101.7184.9200.2203611.0570.1470.1000.0230.497CE
9 T0N/D0.546N/D49.436N/D58.755N/D1.9831.2550.0230.0031.177
3 T25N/D0.2843.85153.0341.109N/D1.0731050.1200.0180.8570.0030.145
9 T2545.8790.27332.35527.798226.458N/D1.7946010.6661.1490.0100.0980.138
3 T5066.0730.35428.43214.164170.078458.3801.6164665.1320.0290.041N/D10.301
9 T50105.8463.49154.15533.044318.747810.72444.7255906.8460.9260.0010.00115.601
TN173.9981.82566.33533.949262.150345.39530.2995156.8600.1220.0000.0001.178HVED extraction
TN221.9000.11635.95042.139233.2297.6582.3284291.2150.0380.9070.4290.134
TN316.6180.08335.84025.589157.5883.7131.4564393.2770.0010.0270.0081.860
TN423.7330.12239.98633.498225.2594.5121.5804586.6890.0370.0000.0000.017
TN538.6060.24232.40726.316211.0223.3391.8845047.9260.0072.9570.000N/D
TN632.6620.24929.81622.327189.079N/D1.0884722.6600.002N/D0.0010.056
TN792.6013.29066.70231.581293.050559.38839.9525294.1040.0480.0000.0022.243
TN898.11111.18763.43137.787306.3481044.09265.7915510.9940.0780.0000.0002.328
TN936.4920.29133.54628.701207.4965.1632.0205231.4900.0010.0000.0000.067
TN10N/D0.0250.0880.0360.8711.106N/D42.9690.0280.0000.0000.628
TN1191.8704.08364.15131.035285.800561.81343.7095319.6950.0000.0000.0000.045
TN1256.2680.45239.58625.776218.79619.8023.7784843.1990.0090.0000.0000.016
TA182.7336.73259.87231.115260.344869.00260.7585367.0130.0541.0112.1101.519
TA221.4970.162128.078285.617227.3395.0902.6314342.9360.0570.0000.000N/D
TA322.7600.23939.42833.397183.6565.5412.0974649.8840.0090.0000.0000.010
TA423.1280.11844.78033.985216.38312.7482.0164701.5040.0010.0000.000N/D
TA533.8640.22030.66027.678209.5743.9461.5794711.4500.0060.0000.001N/D
TA648.5150.44343.00032.625306.7003.7381.7724890.8860.1310.0000.0000.025
TA788.65513.18755.12432.586262.343699.07837.6235314.0260.1020.0000.0000.041
TA886.0627.81958.72828.403290.954755.54650.0805199.188N/D0.0000.0000.023
TA932.6340.32226.48625.103167.6774.2452.1974882.020N/D0.0000.0010.218
TA1040.0400.10774.451145.722431.03910.13238.5754767.4690.0990.1460.0001.458
TA1198.4644.02552.70328.518254.466818.49050.9605097.0630.0600.0000.0000.038
TA1229.7570.15927.22620.202177.4833.5951.1504825.1540.0450.0010.0020.356
N/D—not detected.
Table 5. GC-MS analysis of volatile compounds from wild thyme (measurements for CE and HVED treated samples) (%).
SampleArea (%)Extraction Type
1,8-Cineole
(RI = 1038)
Linalool
(RI = 1103)
Thymol
(RI = 1302)
Carvacrol
(RI = 1310)
3 T01.4014.979.1214.78CE
9 T0/0.210.480.47
3 T25////
9 T251.7215.039.4315.20
3 T50/0.300.761.21
9 T50////
TN1////HVED extraction
TN21.4111.369.2115.30
TN32.3013.2810.5217.52
TN43.4613.9910.0817.70
TN5//1.372.71
TN6//1.142.44
TN7////
TN8////
TN9//1.492.49
TN100.9613.0011.5021.86
TN11////
TN12////
TA1////
TA21.486.019.8717.49
TA31.599.9010.0617.09
TA41.2211.4410.4117.88
TA5/0.922.764.33
TA6/0.611.862.85
TA7////
TA8////
TA9//1.031.71
TA101.2714.4211.5020.55
TA11////
TA12////
/—not detected, RI—retention index.
Table 6. Analysis of covariance (ANCOVA) for pH, conductivity, temperature difference, power, TPC, FRAP, DPPH, yield of extraction and sum of all compounds measured by UPLC-MS/MS and GC-MS methods. The p-values present the statistical significance of each of the factors.
p-Value*
Main EffectTreatment TimeVoltageEthanol ContentTreatment Type
pH0.7090.092<0.00010.183
Conductivity 0.4470.426<0.00010.158
Temperature difference0.0000.3710.0170.014
Power0.015<0.00010.2900.110
Zp0.3740.619<0.00010.142
TPC0.1250.3240.0170.735
DPPH0.0230.9040.6230.463
FRAP0.3580.4230.0300.531
Yield0.1250.3240.0170.735
Sum UPLC-MS/MS0.5490.9770.0000.427
Sum GC-MS<0.00010.006<0.00010.332
* p ≤ 0.05 is statistically significant; TPC—total phenolic content, DPPH—2,2-diphenyl-2-picrylhydrazyl free radical assay, FRAP—ferric reducing antioxidant power assay, UPLC-MS/MS—ultra performance liquid chromatography-tandem mass spectrometry characterization, GC-MS—gas chromatography and mass spectrometry analysis.
Table 7. Residue levels and maximum residue levels (MRLs) of pesticides (mg/kg) in wild thyme sample.
PesticidesMRL (mg/kg)Content (mg/kg)
Alachlor0.02<0.005
Aldrin and dieldrin (aldrin and dieldrin combined expressed as dieldrin)0.01<0.002
Captan (sum of captan and THPI, expressed as captan)0.06<0.020
DDT (sum of p,p′-DDT, o,p′-DDT, p-p′-DDE and p,p′-TDE (DDD) expressed as DDT)0.05<0.004
Endosulfan (sum of α- and β-isomers and endosulfan-sulphate expressed as endosulfan)0.05<0.002
Endrin0.01<0.004
Heptachlor (sum of heptachlor and heptachlor epoxide expressed as heptachlor)0.01<0.002
Hexachlorobenzene0.01<0.002
Hexachlorocyclohexane, α-isomer0.01<0.002
Hexachlorocyclohexane, β-isomer0.01<0.002
Iprodione20.00<0.010
Lindane (γ-isomer of hexachlorocyclohexane )0.01<0.002
Methoxychlor0.01<0.010
Tolylfluanid (sum of tolylfluanid and dimethylaminosulfotoluidide expressed as tolylfluanid)0.05<0.020
Vinclozolin0.02<0.002
MRL—maximum residue level, DDT—dichlorodiphenyltrichloroethane, DDE—dichlorodiphenyldichloroethylene, TDE—tetrachlorodiphenylethane, DDD—dichlorodiphenyldichloroethane.
Table 8. Residue levels and maximum residue levels (MRL) of metals (mg/kg) in dried wild thyme and in wild thyme extract.
MetalsMRL (mg/kg)Dried Wild Thyme (mg/kg)Extract (mg/kg)
Lead (Pb)3.000<0.050/
Cadmium (Cd)1.0000.120/
Mercury (Hg)0.1000.019/
Chromium (Cr)/12.00056.550
Nickel (Ni)/20.0606.450
Manganese (Mn)/115.00040.750
Iron (Fe)/1581.00025.350
Copper (Cu)/8.4005.700
Zinc (Zn)/42.00013.000
MRL—maximum residue level.
Table 9. Denotation of samples, experimental design and process parameters.
SampleHigh Voltage Treatment Time
(min)
Voltage
(kV)
Ethanol Content
(%)
Stirring
(min)
Extraction Type
3 T00003CE
9 T00009
3 T2500253
9 T2500259
3 T5000503
9 T5000509
TN1320500HVED extraction
TN292000
TN332000
TN432500
TN5925250
TN6920250
TN7920500
TN8925500
TN9325250
TN1092500
TN11325500
TN12320250
TA1315500
TA291500
TA331500
TA432000
TA5920250
TA6915250
TA7915500
TA8920500
TA9320250
TA1092000
TA11320500
TA12315250

