Article

Fatty Acid and Stable Carbon Isotope Composition of Slovenian Milk: Year, Season, and Regional Variability

1
Department of Environmental Sciences, Jožef Stefan Institute, Jamova cesta 39, 1000 Ljubljana, Slovenia
2
Jožef Stefan International Postgraduate School, Jamova cesta 39, 1000 Ljubljana, Slovenia
3
Computer Systems, Jožef Stefan Institute, Jamova cesta 39, 1000 Ljubljana, Slovenia
4
Department of Animal Science, Chair of Nutrition, Biotechnical Faculty, Groblje 3, 1230 Domžale, Slovenia
*
Author to whom correspondence should be addressed.
Molecules 2020, 25(12), 2892; https://doi.org/10.3390/molecules25122892
Submission received: 26 May 2020 / Revised: 19 June 2020 / Accepted: 21 June 2020 / Published: 23 June 2020
(This article belongs to the Special Issue Isotopic Techniques for Food Science)

Abstract

:
This study examined the percentage and stable isotope ratios of fatty acids in milk to study seasonal, year, and regional variability. A total of 231 raw cow milk samples were analyzed. Samples were taken twice per year in 2012, 2013, and 2014, in winter and summer, covering four distinct geographical regions in Slovenia: Mediterranean, Alpine, Dinaric, and Pannonian. A discriminant analysis model based on fatty acid composition was effective in discriminating milk according to the year/season of production (86.9%), while geographical origin discrimination was less successful (64.1%). The stable isotope composition of fatty acids also proved to be a better biomarker of metabolic transformation processes in ruminants than discriminating against the origin of milk. Further, it was observed that milk from Alpine and Mediterranean regions was healthier due to its higher percentage of ω-3 polyunsaturated fatty acid and conjugated linoleic acid.

Graphical Abstract

1. Introduction

There is an increasing interest in the quality of foodstuffs, and agricultural research continues to focus on improving the nutrient profile of food products. Milk is a valuable commodity that is consumed directly, as well as being a minor and major ingredient in many food products [1]. It is also rich in nutrients, a resource of proteins (2.6–4.2%), vitamins (0.1%), minerals (0.7%), and fatty acids (95–96% of total milk fat), and is considered by many as an essential part of a healthy diet [2,3]. In Europe, milk provides 9% of the dietary energy supply, 19% of the dietary protein supply, and between 12–14% of dietary fat supply [4].
According to the Agriculture and Rural Development, Analysis and Outlook Unit European’s farms produced 172.2 million tonnes of raw milk in 2018, a number that they expect to increase to 179 million tonnes by 2030, but at a slower pace (+0.6%) than in 2008–2019, and represents a year-on-year increase of 1.6 million tonnes (+1% per year on average) [5]. In Slovenia, dairy farmers produced 564,000 tons of cows’ milk in 2019 (1.2% less than in 2018), and 164,000 tons of drinking milk, which represents a decrease of more than 2% compared to 2018. Despite the decrease, imports increased by almost 13% [6]. Consumers prefer milk with favorable sensory qualities, such as flavor, which depends on animal management factors, including breed, lactation stage, processing techniques, and diet regime. However, diet is considered the primary and the most sensitive factor responsible for creating a specific milk flavor [7] and also a significant factor affecting its fatty acid (FA) composition. These differences also reflect differences in regional dairy production systems, and linking a milk product to a specific region is of high importance as a recognition of quality [1]. Quality linked to geographical origin has created significant interest in building local and regional food systems across Europe, including Slovenia.
Lipid content and FA profile are considered to have an important role in the human diet [7,8]. For example, certain milk FAs, such as linoleic and α-linolenic FAs (C18:2ω-6 and C18:3ω-3), are essential and cannot be synthesized by the human body [2]. Further, a lower proportion of saturated fatty acids (SFA) and a higher proportion of unsaturated fatty acids (UFA), especially polyunsaturated fatty acids (PUFA), is desirable [9]. The consumption of SFA (especially lauric (C12:0), myristic (C14:0), and palmitic acids (C16:0)) [9] is associated with cardiovascular disease, while UFAs are considered as beneficial for human health. Other functional food components are omega-3 polyunsaturated FA (ω-3 PUFAs), which improve neurological functions and are essential in early human development years, and conjugated linoleic acid (CLA), which has anti-carcinogenic, anti-diabetic, anti-atherogenic effects [10,11].
Farmers can significantly alter the FA composition of milk by managing the nutrition of their dairy cows [12]. Fresh forages (especially grass) in the diet enhance the concentration of unsaturated FA, such as α-linoleic acid and CLA, and decrease the levels of SFA, while adding grass conservation products (hay or silage) increases the proportion of SFA in milk [13]. Besides, the total SFA concentration of milk fat is usually lower in summer compared to winter due to the higher consumption of summer forage crops that have a higher content of PUFAs. The higher content of monounsaturated fatty acids (MUFA) and PUFA in milk from cows grazing in highland regions can be attributed to differences in the botanical composition since higher botanical diversity and energy shortage in cows grazing in mountain pastures modifies the bacterial population and lipid accumulation of UFAs in the rumen [14]. Fatty acid composition of milk fat has also been used as a criterion to detect adulteration of milk, such as the substitution of part of the fat or proteins of plant or animal origin and admixtures of milk of different species. The method to characterize the matrixes according to the animal species can be greatly improved when combined with the content of triacylglycerols [15].
The effects of feeding regime can also be tracked using stable isotope analysis using isotope ratio mass spectrometry (IRMS). In dairy products, the isotope composition is also primarily determined by the cows’ diet, as well as their metabolisms [16]. Differences in stable C isotope abundance is mainly the result of the different ingested proportion of feeds derived from C3 and C4 plants. The metabolism of C4 plants, such as corn or sugar, uses a different biosynthetic pathway to fix atmospheric CO2 compared to C3 plants (grass and cereals), resulting in the accumulation of the heavier 13C isotope compared to C3 plants, which leads to higher δ13C values. These differences also show up in the isotopic composition of FAs [17,18]. Since the spectrum of plants used for feeding purposes depends mainly on local soil and climatic condition, stable isotope composition can also encompass information about the geographical origin of dairy products useful for authenticity control.
Up to now, studies have focused on stable isotope ratio measurements of δ13C, δ15N, and δ34S values in casein, δ2H, δ18O in milk water [19,20,21,22] and Sr in dry milk samples [21]. One of the most recent significant advances has been the development of compound-specific stable isotope analysis (CSIA) that enables the identification of relevant biomarkers, such as fatty acids, in food authenticity studies. Some studies have even looked at the correlation between long-chain FAs (α-linolenic FA-C18:3ω-3, eicosapentaenoic FA-C20:5ω-3) and stable isotope measurements to distinguish between organic and conventionally produced milk [17,23]. In another study, the authors investigated the relationship between the carbon isotope compositions of CLA in milk and fatty acids in different dietary sources (C3 versus C4 plants) to understand the transformation of FA from diet to milk [17]. The results suggested that the δ13C-change in CLA did not originate from the microbial biohydrogenation in the rumen, but most probably from endogenous desaturation of t11–18:1.
Only a few studies, however, have focused on δ13C and δ2H values in milk fatty acids. Ehtesham and co-workers [24] demonstrated that δ2H values in precipitation were highly correlated with the δ2H values in bulk milk and specific fatty acids (butyric, myristic, palmitic, and oleic acid). Separation of milk powder origin to geographic sub-regions within New Zealand has been achieved, with clear discrimination between South Island and North Island and with significant clustering of regions. Further, a linear discriminant analysis (LDA) model based on δ2H and δ13C values of butyric, myristic, palmitic, and oleic fatty acids has provided the best separation of samples from the Northern and Southern parts of New Zealand [1]. Ehtesham et al. [25] also focused on the relationship between δ2H and the FAs in milk and the water component of milk (feed and farm water). The authors found that the δ2H values of FAs in feed and δ2H values of farm water were related to the δ2H values of milk FAs, milk solids, and milk water and could be used as a biogeochemical marker surrogate to environmental conditions. This approach can also be applied to determine the dietary regime and geographical origin of milk products where the water has been removed (milk powder) or is altered in the case of processed milk products (cheese and butter).
The main objective of this study was to evaluate both the need and options for origin tracing, focusing on Slovenian milk. In 2016, the Slovenian Ministry of Agriculture, Forestry, and Food began a three-year project to promote and raise awareness of the importance and characteristics of locally produced and processed foods. During this time, the protective mark “Selected Quality” national scheme and the “Selected Quality-Slovenia” was established. Nowadays, most milk and dairy products, produced and processed in Slovenia, use the “Selected Quality - Slovenia” protective mark. This mark indicates that the products have the following distinguishing properties: (i) the origin of raw milk—the milk and other dairy products are produced entirely in the same country, Slovenia; (ii) milk quality—excellent microbiological quality of milk; (iii) freshness of raw milk—it’s 15 h at most from the takeover of milk at the collection site to its acceptance into the processing plant. Therefore, to protect the obtain mark and prevent possible fraud, a robust screening method to determine the authenticity and regional traceability of milk is needed. In this study, two methods (fatty acid composition and isotope ratios of carbon within fatty acids) were applied. Additionally, the effect of the production year and season on the FA composition of milk was also investigated. Finally, the FA profiles pertaining to the milk’s essential and beneficial components were also studied, and a comparative study was made to examine the differences in the quality of milk from different geographic regions in Slovenia.

2. Results and Discussion

2.1. Milk Fatty Acids Composition

2.1.1. Influence of the Year and Season of Production and Impact of Feed

The amount of individual fatty acids, as well as SFA, MUFA, PUFA, ω-3 PUFA, ω-6 PUFA, and ω-6:ω-3, according to year, season, and feeding regime (corn/non-corn) are given in Table 1. As expected, SFAs were the most abundant FA groups in milk, followed by MUFA and PUFA. The most abundant FA was C16:0, ΣC18:1 cis and trans isomers, C18:0, and C14:0, which is in agreement with the published data [26,27]. Time (year/season) was revealed as an important factor influencing fatty acid composition, but not all fatty acids were equally affected. The effect of the year of production (2012, 2013, 2014) on FA composition was investigated using the thirty-five FAs detected in both summer and winter. The results revealed a significant variation in the amount of FA with year except for C12:0, C13:0, C14:0, C14:1, C15:0, C15:0, C17:0, C18:2ω-6, C18:3ω-3, and C22:1ω-9. The year 2012 produced the lowest amount of ∑SFA (67.76 ± 2.49% of total FA) and the highest amount of ∑MUFA (27.26 ± 2.10% of total FAs) and CLA (rumenic acid-C18:2c9,t11; 0.86 ± 0.28% of total FAs). Furthermore, 2012 also had the lowest percentage of C16:0 (32.60 ± 2.13% of total FAs) and hypercholesterolemia FAs (HFA; C12:0 + C14:0 + C16:0) (48.13 ± 2.97% of total FA) and the highest percentage of cis and trans isomers C18:1ω-9 (23.7 ± 2.17% of total FA).
The percentage of PUFA, ω-6 PUFA, and ω-3 PUFA was higher in 2013 (4.05 ± 0.98%, 2.61 ± 0.58%, 0.84 ± 0.34% of total FAs, respectively) compared to 2012 (3.69 ± 1.14%, 2.31 ± 0.24%, 0.70 ± 0.22% of total FAs, respectively) and 2014 (3.55 ± 0.56%, 2.30 ± 0.33%, 0.71 ± 0.21% of total FAs, respectively), while the ratio ω-6:ω-3 was lower in 2013 (3.36 ± 0.79% of total FAs) in comparison to 2012 (3.64 ± 1.14% of total FAs). The difference in FA composition according to production year depended mainly on diet and altitude, whereas animal-related factors, i.e., lactation stage, breed, milk yield, and proportion of primiparous cows in the herd, were not significant [28].
A lower C16:0 and HFA percentage, as well as a higher amount of CLA and C18:1ω-9, most likely results from increased grazing [9]. However, the amount of each FA depends on lipid metabolism in the rumen and the mammary gland and the release of FAs from body reserves during a period of negative energy balance during early lactation since diet (especially type of forage, lipid supplements, forage:concentrate ratio, starch level, and their interactions) can influence metabolic processes in the rumen and the composition of rumen biome [9]. Variations in FA composition can also be explained, in part, by the micro-environmental conditions influencing the quality of feed. The composition of forage and plant lipids is influenced by factors, such as species, growth stage, temperature, and light intensity. Besides, environmental temperature and humidity can affect both milk yield and FA composition since dairy cows are sensitive to climatic variations. The production of the short-chain FAs (C6:0–C8:0) and C18:0 decrease at the higher temperatures and humidity. In this study, 2013 and 2012 were exceptionally hot and wet years, respectively, and there were no differences in the levels C6:0–C10:0 FAs (Table 1).
The results showed no significant seasonal effects (p > 0.05) on the percentage of C15:0, C16:1, C20:1ω-9, C20:3ω-6, C21:0, C20:3ω-3, C20:4ω-6, C20:5ω-5, C22:0, and C24:0, although the percentage of total SFAs was lower in summer (68.04 ± 3.20% of total FA) than in winter (70.40 ± 2.06% of total FA, p < 0.05). The percentage of MUFAs of total FA was significantly higher (p < 0.05) in summer (26.30 ± 3.23%) than in winter (24.20 ± 1.87%) due to increased amounts of C18:1 in summer compared to winter (p < 0.05). The percentage of PUFAs in summer (4.11 ± 0.87% of total FA) was higher than in winter (3.43 ± 0.33% of total FA, p < 0.05). On average, amounts of SFA decreased in the summer and increased in the winter, whereas the amount of PUFAs increased in summer and decreased in winter. The percentage of ω-3 PUFA was also higher in summer than in winter. Differences in FA percentage related to the season could be explained by differences in the cow’ dietary regimes since during the summer, the cows typically graze on pasture or are fed fresh forage. Replacing grass silages with corn silage increases the concentration of medium-chain saturated FAs (C6:0 to C14:0) and C18:2ω-6 and decreases the concentration of C16:0, C18:0, C18:3ω-3, and C20:5ω-3 in milk fat. Replacing grass silage with corn silage will decrease the amount of total ω-3 PUFA and increase the amount of ω-6 PUFA in milk, leading to an elevated ω-6:ω-3 ratio [12,21,23]. The effect of replacing grass with corn silage on the CLA content of milk is inconclusive. Studies have shown that corn silage-based diets increase the CLA content of milk fat compared with grass-based diets [24,25], while others have found no differences in CLA content of milk fat from cows offered grass or corn silage-based diets [21,26,27]. The present study indicated that the percentage of C18:2ω-6 and CLA was higher during the summer. However, higher environmental temperatures during the summer also affected the FA composition of milk, and milk fat in summer was lower in C16:0 relative to C18:0 than in milk fat from the same cows during winter. Although these changes were related to changes in blood plasma lipids, such observations were confounded by dietary changes.
As part of this study, the data were analyzed using a clustering approach based on the percentage of FA, production year, season, and corn silage and cereals in the diet. The δ13C values of casein fraction were also used to characterize the presence of corn silage at a threshold limit of −23.5‰, i.e., samples with δ13C values higher than −23.5‰ indicated the presence of corn in the diet [16]. Before clustering, the Silhouette curve method was applied to estimate the optimum number of clusters [29]. In this study, the best split was achieved using 14 clusters. The partition around medoids (PAM) method was then applied, which divided the milk samples into 14 clusters (Figure 1). The results showed that the production year and season and the presence of corn silage and cereals in the animal’s diet played a significant role in the clustering. Figure 1 also shows the combined effects of year and season. Production year had a more significant effect on FA composition than the season. Specific FAs showed no global pattern of differentiation and were probably influenced by micro-factors, such as temperature, humidity, feeding regime, lactation stage, breed, and processing techniques.
Multivariate analysis was used to identify the key factors responsible for discriminating between production year and season. In this case, 231 samples consisting of authentic Slovenian milk samples collected in summer and winter 2012 (12 s, 12 w), 2013 (13 s, 13 w), and 2014 (14 s, 14 w) were statistically evaluated. Figure 2 presents the results of the discriminant analysis (DA) as a discriminant function score plot (a) and a discriminant loadings plot (b). In the functional score plot, each group (centroid) was represented by a scatter plot, while in the loadings plot, they appeared as a set of vectors, indicating the degree of association of the corresponding initial variables with the first two discriminant functions (F1 and F2).
In latter, the degree of distribution of each parameter in the classes was revealed. Except for the 2013 and 2014 winter samples (13 w and 14 w, respectively), good separation between year and season of production was achieved. The most influential parameter for the summer/winter 2012 (12 s/12 w) classes (see top left of biplot a) was C20:4ω-6 (direction of its vector was towards the right part of the biplot), while CLA separated 12 s from 12 w. Winter samples 2013 (13 w) and 2014 (14 w) overlapped, while the separation between summer classes 14 s and 13 s was likely a result of the higher percentage of C17:0iso, C20:1ω-9, C18:3ω-6, C20:3ω-3 (bottom left (a)). A leave-one-out cross-validation (LOOCV) classified 86.9% of the samples correctly.

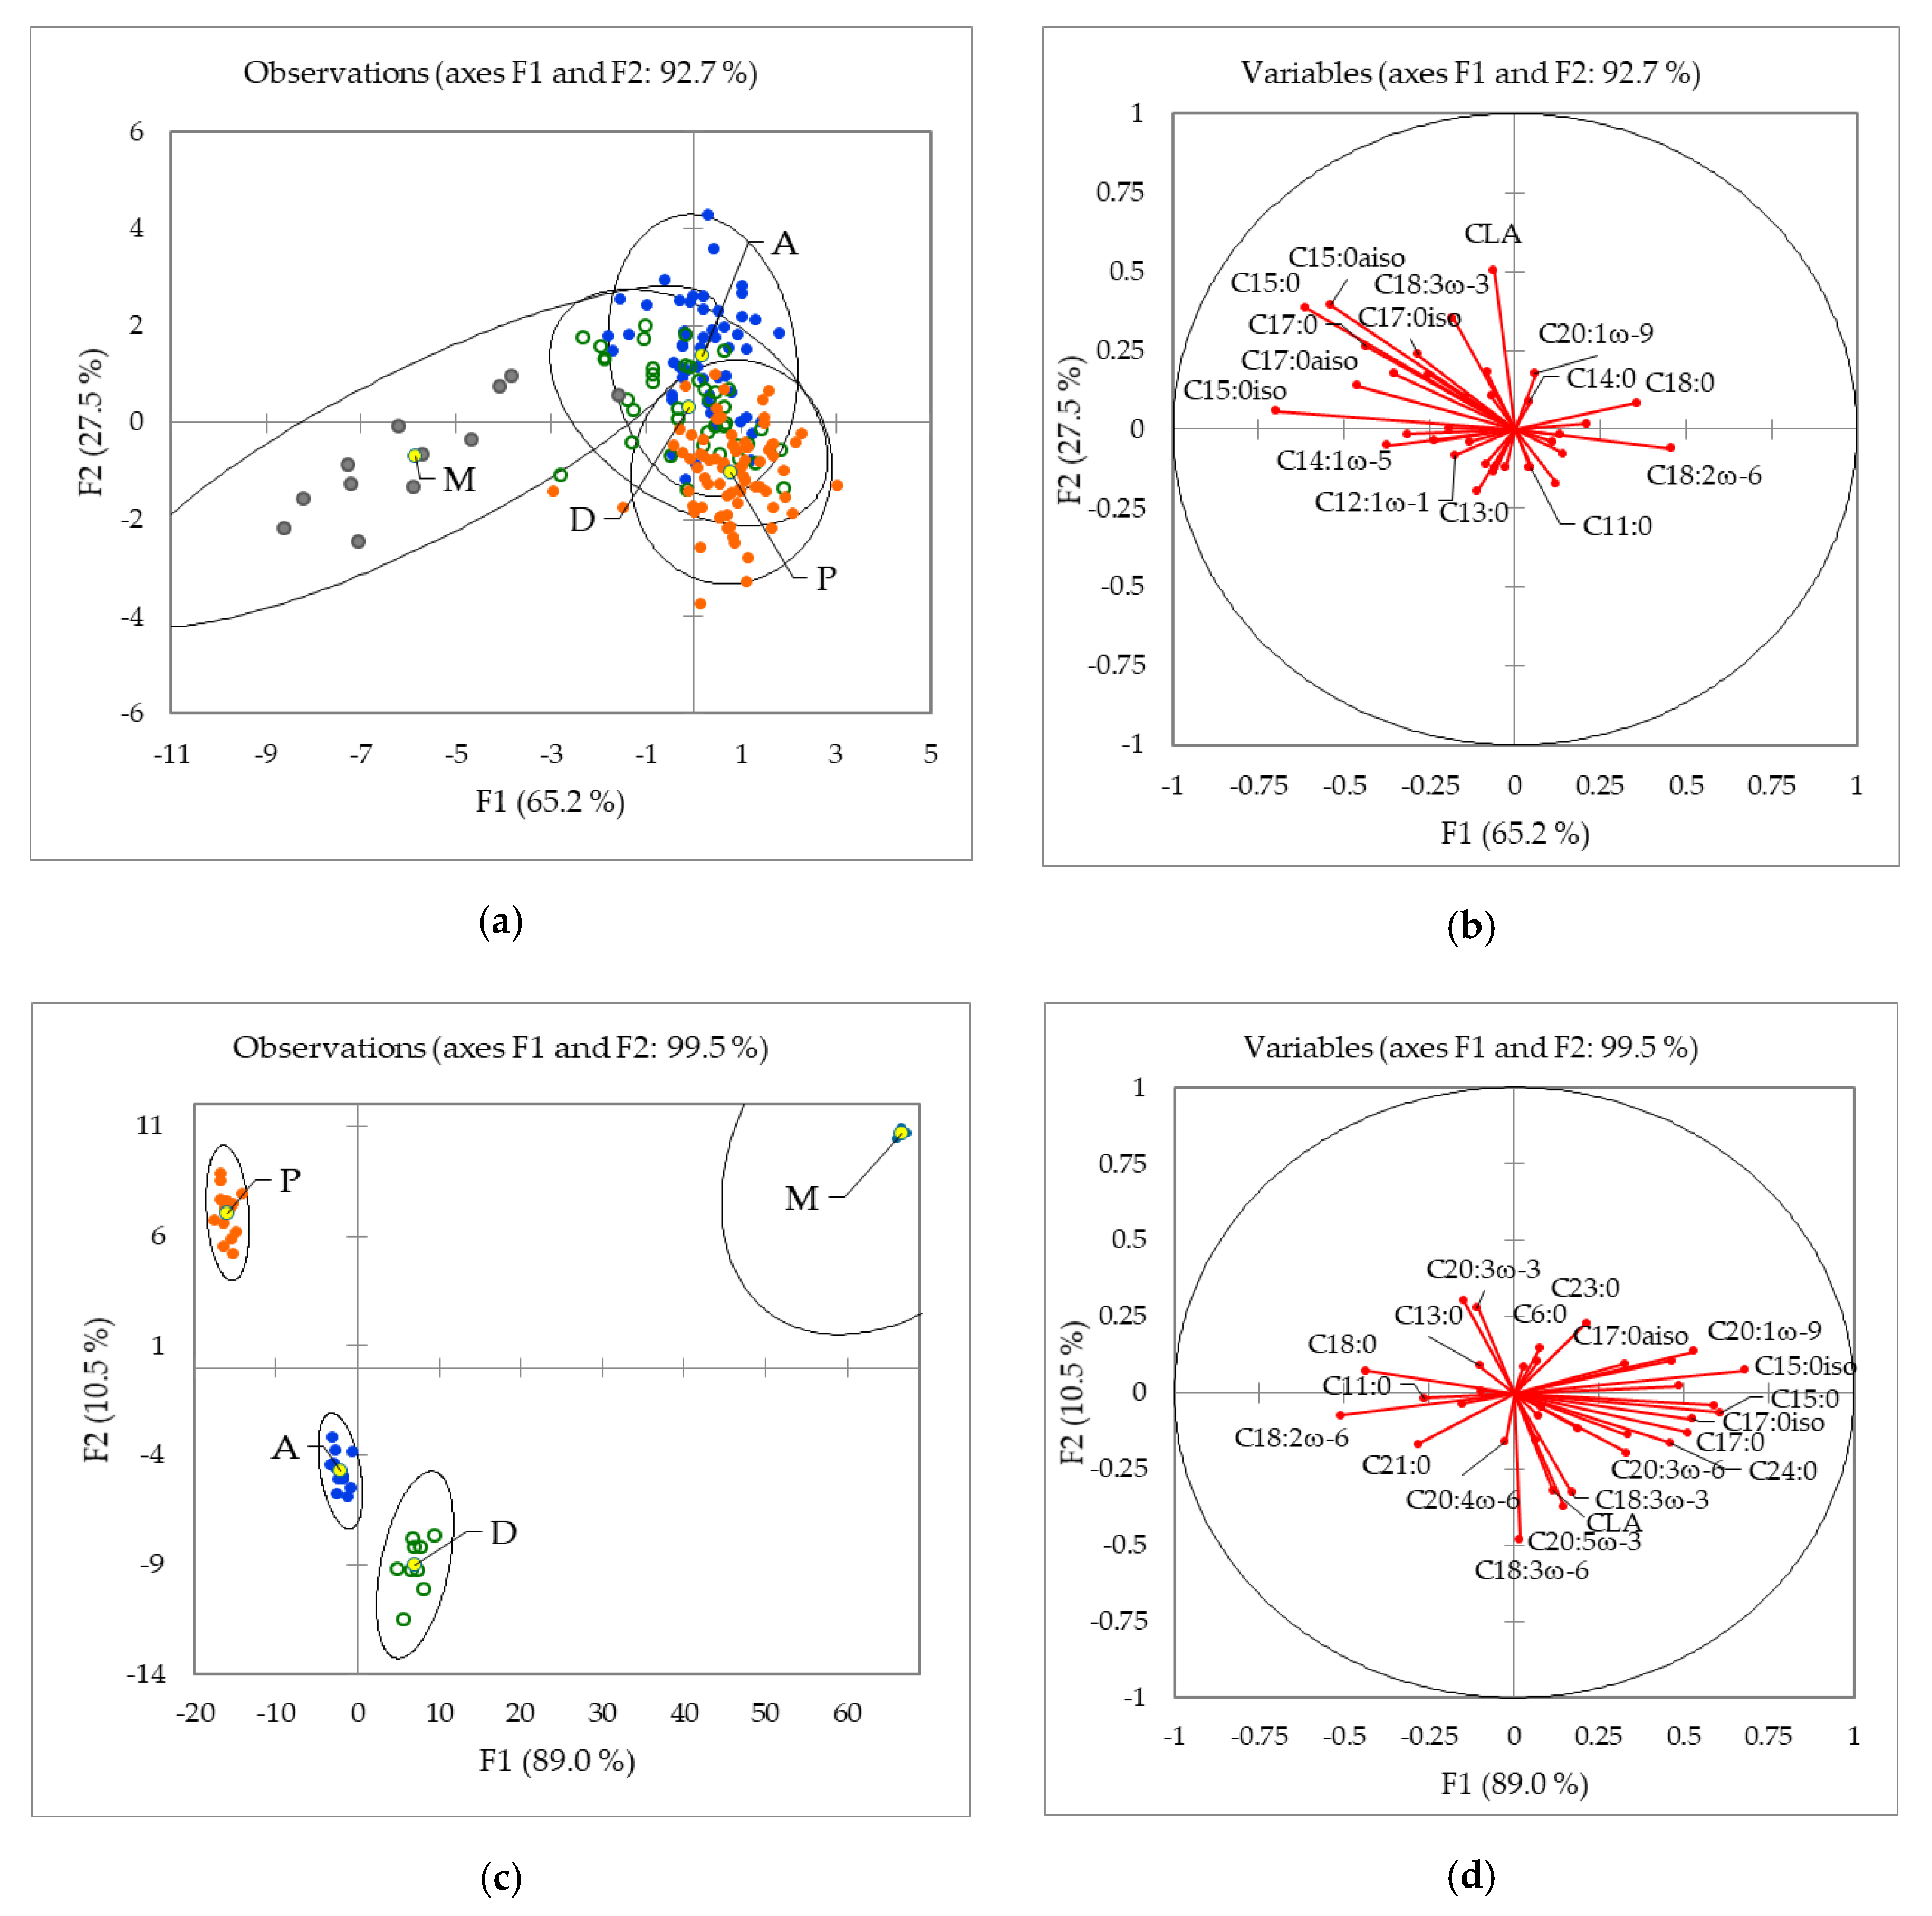
2.1.2. Influence of the Geographical Origin on FA Composition

Fatty acid composition combined with various chemometric tools has been successfully applied in different food commodities to discriminate the geographical origin, including fruits [30], oils [31,32], and also milk and dairy products [26,33,34]. In this study, discriminant analysis (DA) was used to discriminate between milk from Alpine, Mediterranean, Pannonia, and Dinaric regions of Slovenia using the whole dataset, including summer and winter samples from 2012, 2013, and 2014. The results are presented in Figure 3a,b. A comparison of the scatter of data points and vector plots indicated that the Mediterranean group (Figure 2a) was a result of high amounts of C15:0, C17:0, C17:0iso, and C17:0aiso FA. For the Alpine region and Dinaric region groupings (Figure 3c: lower left) C18:3ω-3, CLA, C18:3ω-6, and C20:5ω-3 had the most separating power, while the C12:0, C11:0, C21:0, C18:0, and C18:2ω-6 differentiated the Pannonian group. A cross-validation test showed 64.1% correct classification. The classification rate was the highest (80.8%) for Pannonian milk samples and the lowest for Dinaric samples (20.5%). The more precise and efficient separation between the four regions was obtained when taking into account the season (summer-winter). In this case, the classification rate was >90%. Figure 3c shows the DA plot for 39 milk samples obtained in winter 2013. The analysis generated four well-separated groups. Separation of the regions was also achieved based on FA composition when the data were treated altogether. For F1 (89.0%), C15:0 and its isomers were the main discriminatory parameters, while for F2, the most discriminatory parameters (10.5%) were C18:3ω-6 and CLA. However, cross-validation was low, and only 35.9% of the samples were classified correctly. The highest rate of classification was for the Mediterranean samples (66.7%) and the lowest for the Alpine samples (8.3%). The low classification rate was related to the low number of samples.

2.2. Stable Carbon Isotope Composition of FA in Milk

This study used the stable carbon isotope composition of individual FAs to check the variability in production year and season in 2013 and 2014. The differences measured in the isotopic composition between individual milk FA reflected diet regime, the isotopic fractionation during biosynthesis, metabolic rates, and isotope turnover time. Table 2 presents the stable carbon isotope values of individual FAs in cow milk samples and stable carbon isotope values in bulk freeze-dry milk. The given values were the mean and standard deviation (SD). Results were shown as box plots of δ13C values of milk fatty acids and bulk milk samples (Figure 4). Data points, exceeding two units of SD, were regarded as outliers, and in the cases where measurements were below the 5% confidence level, the data were discarded. Interestingly, FAs formed during biosynthesis had the lowest δ13C values due to isotope fractionation.
In all the samples, C15:0 had significantly lower average δ13C values (−30.3 ± 3.7‰) compared to other FAs. The highest average δ13C value (−22.6 ± 2.9‰) was observed in C14:0. Higher δ13C values were found in winter, which reflected the higher amounts of corn in the diet. Although the reported δ13C values from specific regions, e.g., the Mediterranean region, were influenced by the year of production, significant differences in reported δ13C values between the summer and the winter season were observed. The fatty acid C18:1ω-9 was an exception with consistently lower values during the summer. It was assumed that this variability was a result of different production practices and the amount of grass and corn forage in a cow’s diet. The C18:1ω-9 in milk from cows fed a C3 diet is enriched in 13C relative to C18:0, whereas no enrichment occurs when cows’ are fed on a C4 diet [17]. In this study, an average enrichment of 1.6‰ was observed in milk sampled during the summer and supported the assumption that a C3-based diet could result in the transfer of higher amounts of 18:1 ω-9 directly from the feed. As part of a dietary source, C18:0 can be produced by microbial biohydrogenation of C18:0 as the final product of ruminal biohydrogenation [35]. Microbial biohydrogenation can significantly affect the isotopic values of C18:0, leading to a lower δ13C values compared to C16:0, which originates in part from dietary lipids and to a significant extent from de novo synthesis from acetate, derived mainly from dietary carbohydrates [36]. The Δ13C value (δ13C-18:0−δ13C-16:0) in the samples were <−3.3‰, which is typical for ruminant fat.
Stable carbon isotope composition of individual FA indicated less variability between season and year than fatty acid composition, which suggested a more distant relationship. There was also no data supporting the correlation between a time-significant percentage of FA and δ13C values within the same FA. The results of a multivariate analysis of the stable isotope content of FA are presented in Figure 4. The temporal separation between selected groups described 93.8% of the variability. The most important stable isotope parameters that contributed to this separation were: δ13C-16:0, δ13C-18:1ω-9c, δ13C-bulk, δ13C-14:1, and δ13C-18:0, and a leave-one-out cross-validation (LOOCV) classified 90.9% of the samples correctly.
Figure 4 shows the summer and winter δ13C values of different FAs in milk for the four studied regions. The δ13C values of individual fatty acids (season, year, and production region) are given in Table S1. The δ13C in FA in milk collected from the Mediterranean region differed significantly (p < 0.05) from the other three regions. The differences were more apparent in summer than winter. The Mediterranean region also had more negative δ13C values, which indicated that cows had a higher amount of grass-based (C3 plant) forage in their diet, although the higher temperatures in the Mediterranean region could be a factor. The highest δ13C values were in FA in milk from the Pannonian region. Besides, the δ13C-18:1ω-9c determined in the Pannonia region differed significantly from Alpine and Dinaric regions.

2.3. Quality of Milk

Some comparisons can be drawn about the ratios of SFA, MUFA, and PUFA in milk. A healthy diet should contain more PUFA and less of SFA since SFAs are a risk factor for cardiovascular diseases [37]. Alternatively, MUFA and PUFA, except for trans unsaturated fatty acids, reduce the level of low-density lipoprotein (LDL) cholesterol and increase the level of high-density lipoprotein (HDL) cholesterol [38].
The lowest percentage of SFA (avg. 66.97 ± 2.54 % of total FA) was observed in milk produced in summer in the Alpine region, for all three sampling years, while in winter, there were no significant differences between the regions in the SFA percentage of milk sampled in the summer (Table 3). The feeding regime in the Alpine region is based on the managed grazing of pastures during the summer, while in the winter, the cows’ diet consists of a higher amount of cereal concentrates and conserved forages. The feeding of grass conservation products (hay or silage) increases the SFA content of milk fat.
The consensus is that PUFAs, especially ω-3, ω-6, and CLA, have a beneficial effect on human health. Besides, the ω-6:ω-3 ratio, expressed as the concentration of linoleic acid (C18:2ω-6) to α-linolenic (C18:3ω-3) acid, i.e., the most abundant ω-6 and ω-3 FA, as well as atherogenic (AI) and thrombogenic (TI) indices are used to evaluate the nutritional value of milk fat since the milk fat with low AI and TI values could provide protection against coronary heart disease. Further, ω-3 PUFA reduces the risk of cardiovascular disease, hypertension, cancer and has been linked to improved neurological function [5,6,10,13]. The most abundant PUFA in fresh forages is ω-3 (especially α-linolenic acid). In this study, the highest percentage of α-linolenic acid was in the Alpine region in the summer (avg. 0.87 ± 0.38% of total FA) and in the Mediterranean region in winter (avg. 0.71 ± 0.2% of total FA). While the milk from the Pannonian region had the lowest percentage of α-linolenic acid in both summer and winter (avg. 0.62 ± 0.22% of total FA in summer and 0.46 ± 0.07% of total FA in winter). The lower levels of α-linolenic in winter are the result of oxidative losses of PUFA during the wilting of grasses [13]. A correlation also existed between α-linolenic acid and ∑ω-3 FA. The highest percentage of ω-3 FA was present in milk from the Alpine region in summer (avg. 0.97 ± 0.38% of total FA), while in winter, the highest levels of ω-3 FA were observed in the Mediterranean region (avg. 0.83 ± 2.1% of total FA). The lowest percentage of ω-3 FAs was found in milk collected from the Pannonian region in all three production years (avg. 0.76 ± 0.29% of total FA in summer and avg. 0.57 ± 0.09% of total FA in winter). Changes in the ω-3 FA percentage were smaller in the Pannonian region, during both summer and winter compared to the other studied regions. The reason was that the cows’ were fed a diet of corn silage (intensive milk production) and conserve forage throughout the year. Low values of ω-3 FA in low altitude regions of Slovenia (Pannonian and Dinaric regions) were consistent with the literature data for lowlands [39,40]. Since a high ω-6:ω-3 ratio can be detrimental to human health and a factor in cardiovascular disease, cancer, inflammatory and autoimmune disease, an optimum ratio in the human diet of 1:1 ratio is considered, while a ratio <5:1 is recommended [39]. However, a higher ω-6:ω-3 ratio is indicative of higher amounts of cereals (corn, soybean, barley, and oats) in the cows’ diet. The ω-6:ω-3 ratio in Slovenian milk is between 4.2:1 and 2.5:1 and is lower in summer compared to winter. The lowest ω-6:ω-3 ratio was in milk produced in the Mediterranean region through the whole season and did not exceed 2.6:1, which was indicative of a fresh forage-based diet. In the Dinaric and Pannonian regions, the effect of feeding cows corn silage and cereals throughout the year increased the ω-6:ω-3 FA ratio from 3.2:1 to 4.2:1. The data of AI and HI indices were comparable to the study performed by Ferlay et al. [41] determined in the milk of Tarentaise and Montbéliarde cows (3.14 and 3.43, respectively), but they were lower than the data reported by Nantapo et al. [42] in the milk of Friesian, Jersey, and Friesian x Jersey cows with values ranged from 4.08 to 5.13. The highest AI indices in our study were determined in the Mediterranean region (2.89–4.13) and the lowest in the Alpine region (2.31–3.79).
Environmental factors related to year and season together with diet are the most important factors influencing the composition of CLA in milk. In this study, the percentage of CLA ranged from 0.52 ± 0.18% of total FA to 0.73 ± 0.31% of total FA in milk from all four studied regions and increased with dietary intake of 18-carbon PUFAs. Increasing the amount of PUFAs in milk could be achieved by feeding cows’ a diet based on fresh silage. Milk collected in summer in the Alpine region (avg. 0.99 ± 0.28% of total FA) had the highest percentage of CLA, most likely from grazing on pasture. In the winter, there was no significant difference between the Alpine and other regions since the animal’s diet is composed of both corn and grass silage. Because Alpine and Mediterranean milk in summer contained a higher percentage of ω-3 PUFA and CLA, compounds known to have positive effects on human health [40,43], this milk is likely “healthier” than milk produced in other regions in Slovenia. However, despite the benefits of feeding cows fresh grass silage, the overall effects on the FA composition of milk would not improve human health over the long-term [44].

3. Materials and Methods

3.1. Milk Collection and Storage

During a 3-years study (from 2012 to 2014), in total, 231 raw cow milk samples were collected. Samples were collected twice per year in winter and summer from four geographical regions in Slovenia: Mediterranean (n = 18), Pannonian (n = 90), Dinaric (n = 51), and Alpine (n = 72). Samples were collected from five Slovenian dairies, each supplied by milk from different farms and transported to the laboratory. The geographical characterization of the sampling location: latitude, longitude, altitude, and the number of samples in each location can be found in the supplementary material (Table S2). Each sample was divided into four subsamples and stored in plastic containers at −20 °C. Sampling data is shown in Table 4.

3.2. Chemicals and Standards

Dichloromethane (CH2Cl2, for organic residue analysis), methanol (MeOH, for organic residue analysis), and hexane (C6H14, for organic residue analysis) were purchased from J. T. Baker B. V. (Deventer, Netherlands). Sodium hydroxide (NaOH, puriss. p.a., ACS reagent, reag. Ph. Eur., ≥98%, pellets) and boron trifluoride-methanol solution (14% in methanol) were obtained from Sigma-Aldrich (St.Louis, MI, USA). Deionized water (18.2 MΩ) was made using a Mili-Q System (Merck Millipore, Watertown, MA, USA). A standard mixture from Supelco (Bellefonte, PA, USA), named Supelco 37 Component FAME Mix in dichloromethane, containing the methyl esters of 37 fatty acids, was used.
The accuracy of the δ13C determination was checked with the following international reference materials: polyethlene foil IAEA-CH-7 (δ13C = −32.15 ± 0.04‰) and sucrose IAEA-CH-6 (δ13C = −10.45 ± 0.03‰) obtained from International Atomic Energy Agency (IAEA, Vienna, Austria), L-glutamic acids USGS40 (δ13C = −26.39 ± 0.04‰) obtained from U.S. Geology Survey (USGS, Virginia, USA) and laboratory reference materials: casein IAEA-CRP 2013 (δ13C = −20.3 ± 0.09‰) (IAEA, Vienna, Austria), UreaC (δ13C = −28.3 ± 0.2‰), and fatty acid methyl nanodecanoate (δ13C = −30.0 ± 0.1‰) (Restek, Bellefonte, PA, USA).

3.3. Analytical Procedures

3.3.1. Extraction and Esterification of Milk FAs

Frozen milk samples were thawed (37 °C) and homogenized. Milk fat consists predominantly of triacylglycerides, which were extracted using the in-situ-trans-esterification method without prior extraction of the fat from samples according to the method of Park and Goins (1994). The total lipids fraction was extracted from the milk samples (450 µL) with dichloromethane (300 µL) and 0.5 M sodium hydroxide in methanol (3 mL), purged with nitrogen and heated at 90 °C for 10 min, after which the samples were cooled rapidly. Fatty acid methyl esters (FAMEs) were formed by adding 14% BF3-methanol solution (3 mL) and heating the sample at 90 °C for a further 10 min. After cooling, the fatty acids methyl esters (FAMEs) were extracted with hexane (1.5 mL) and transferred to a GC vial and stored at −20 °C.

3.3.2. Gas Chromatography of Fatty Acids

The characterization of FAMEs was performed using Agilent 6890N (Network GC System, Agilent Technology, Santa Clara, CA, USA) gas chromatography with FID detector (GC-FID). The separation was achieved on an Omegawax 320, 30 m × 0.32 mm, × 0.25 µm, on a capillary column (Supelco, Bellefonte, PA, USA). The temperature program was as follows: 50 °C (held 2 min) to 220 °C at 4 °C/min (held 20 min). The carrier gas was helium in constant flow mode (1 mL/min). The injector was set to 260 °C and the detector to 280 °C. The individual fatty acids were identified and quantified by comparing their retention times with those of a standard Supelco 37 component FAME Mix (Supelco) and expressed in weight percent of total fatty acids. Procedural blanks were analyzed with each set of samples. Standard Supelco 37 component FAME mix was analyzed after every ten samples to verify the stability of the analytical system. Method precision based on measurements of replicate (n = 2) real samples was 5%. Results were expressed as the percentage of each fatty acid with respect to the total fatty acids [45]. This percentage was calculated using the peak area of the samples corrected with the respective correction factors, according to Christie and Han [46].

3.3.3. Elemental Analysis-Isotope Ratio Mass Spectrometry (EA-IRMS)

The stable carbon isotope ratio measurements were reported in δnotation expressed in per mile (‰) relative to the Vienna-Pee Dee Belemnite (V-PDB) standard following Equation (1) [47]:
δ ( i / j E ) = δ i / j E = R P i / j i / j R R e f i / j R R e f
where superscripts i and j denote the highest and the lowest atomic mass number of element E, and RP and RRef is the ratio between the heavier and the lighter isotopes (in case of carbon, 13C/12C) in the sample (P) and reference material (Ref).
To determine the bulk carbon isotope composition, approximately 1 mg of freeze-dried milk was weighed into a tin capsule, closed with tweezers, and placed into the automatic sampler of the elemental analyzer. All analyses were performed separately on a Europa Scientific 20–20 continuous flow mass spectrometer with an ANCA-SL solid–liquid preparation module (Sercon, Crewe, UK). Analyses were normalized against international standards: IAEA-CH-7 and IAEA-CH-6 with δ13C values of −32.15 ± 0.04‰ and −10.45 ± 0.04‰, respectively. For independent control, laboratory reference material IAEA-CRP 2013 with δ13C value −20.3 ± 0.09‰ and UreaC with δ13C value −28.3 ± 0.2‰ were used. The analytical precision, expressed as the standard deviation of control material, was ± 0.2‰.
The 13C/12C ratio of synthetic fatty acid standard C19:0 (methyl nanodecanoate, RESTEK) was determined using a Europa Scientific 20–20 continuous flow mass spectrometer with an ANCA-SL solid–liquid preparation module (Sercon, Crewe, UK). Results were further normalized against two international reference standards: IAEA-CH-7 and IAEA-CH-6. For independent control, the international reference material USGS40 with δ13C values of −26.39 ± 0.04‰ was used. Analytical precision, expressed as the standard deviation of the control materials, was ± 0.2‰.

3.3.4. Compound Specific Isotope Analysis of δ13C in Fatty Acids

The Isotopic compositions of individual FA were determined using an Agilent 6890N GC-C system coupled to an IsoPrime GV IRMS (GV Instruments, Manchester, UK)). The separation was achieved using a DB-1MS (60 m × 0.32 mm × 0.25 µm) capillary column (Agilent J&W, USA). The temperature program was as follows: 120 °C (held 1 min) to 300 °C (held 20 min) at 3 °C/min. The carrier gas was helium in the constant flow mode (1 mL/min). The injector temperature was 260 °C, and the oxidation reactor (Cu/O) in the 6890N GC/C system was 900 °C. Peak identification of individual fatty acids was performed by comparing their retention times with those in the standard Supelco 37 component FAME Mix, which was analyzed in the measurement sequence. Instrument stability was ≤0.08‰. C19:0 FAME (methyl nanodecanoate) with δ13C values of −30 ± 0.1‰ (prior determined on EA-IRMS) was used as a laboratory reference material. For data normalization, a single-point normalization method was used [48]. The precision of measurements expressed as the standard deviation of the laboratory reference material was 0.3 to 0.5‰.

3.4. Statistical Evaluation

For statistical evaluation, FAs were considered individually and grouped in classes as follows: saturated fatty acids (SFA), unsaturated fatty acids (UFA), MUFA, ω-3 PUFA, ω-6 PUFA, and CLA. Statistical calculations and multivariate analysis were carried out using the XLSTAT software package (2020.1.3, Addinsoft, New York, NY, USA). The statistical evaluation was performed using R, where non-parametric tests were used, i.e., Kruskal–Wallis followed by a post hoc test. In the case of pairwise comparison, a Mann–Whitney test was used. Basic statistics included mean values (median and arithmetic mean), standard deviation (SD), minimum and maximum, while for multivariate analysis, discriminant analysis (DA) was used.

4. Conclusions

Slovenian milk samples had been classified according to the year, season, and region of production based on the determination of the percentage and stable isotope composition of individual fatty acids. It was found that the FA composition differed significantly, depending more on year and season of production than geographical region. A leave-one-out cross-validation (LOOCV) classified 86.9% of the samples correctly. For geographical origin determination, it was found that the Mediterranean group was separated from other regions based on a high percentage of C15:0 and C17:0 and their isomers. The cross-validation test showed 64.1% correct classification with the highest rate of classification for the Pannonian (80.8%) samples. Although the classification rate according to the year/season of production improved when stable isotope composition of individual FA was included, describing 93.8% of variability, it was found that δ13C in FA could be more useful for studying metabolic transformation processes in ruminants. It appeared that the natural δ13C differences in FA depended on both—the diet type and the precursor FA. The “healthiest” milk for human consumption, based on FA composition, was produced in the Alpine and Mediterranean regions. The quality of milk was also affected by summer/winter season production. The results gave proof of the concept that FA composition could help to discriminate the geographical origin of milk and thus identify products of better quality. Finally, to confirm the validity of the markers, future studies should focus on how factors, such as breed and age, lactation period, production level, the farming system, influence the FA and stable isotope composition of milk.

Supplementary Materials

The following are available online, Table S1: δ13C of fatty acids in milk from a different geographical location in Slovenia during summer/winter in 2013 and 2014; Table S2: Geographical information of the sampling location.

Author Contributions

Conceptualization, D.P. and N.O.; methodology, D.P. and A.L.; software, T.E.; validation, D.P. and A.L.; formal analysis, D.P.; investigation, D.P. and N.O.; resources, N.O.; data curation, L.S. and T.E.; writing—original draft preparation, D.P.; writing—review and editing, N.O.; visualization, D.P. and N.O.; supervision, N.O.; funding acquisition, N.O. All authors have read and agreed to the published version of the manuscript.

Funding

The work was performed within the project V4-1108 entitled “The use of specific methods for determination and prevention of adulteration of milk and dairy products”, financially supported by Slovenian Research Agency and Ministry of Agriculture and the Environment, and IAEA project “The use of stable isotopes and elemental composition for determination of authenticity and geographical origin of milk and dairy products” (Contract No. 17897). This research represents a part of the ERA Chair ISO-FOOD—for isotope techniques in food quality, safety, and traceability (FP7, GA no. 621329) and MASSTWIN—Spreading excellence and widening participation in support of mass spectrometry and related techniques in health, the environment and food analysis (H2020, GA no. 692241).

Acknowledgments

We thank Ljubljanske mlekarne, d.d., Pomurske mlekarne, d.d., Mlekarna Vipava d.d., Mlekarna Planika predelava mleka d.o.o., and Mlekarna Celeia for providing authentic cow milk samples.

Conflicts of Interest

The authors declare no conflict of interest.

References

  1. Ehtesham, E.; Baisden, W.T.; Keller, E.D.; Hayman, A.R.; Van Hale, R.; Frew, R.D. Correlation between precipitation and geographical location of the δ2H values of the fatty acids in milk and bulk milk powder. Geochim. Cosmochim Acta 2013, 111, 105–116. [Google Scholar] [CrossRef]
  2. Haug, A.; Høstmark, A.T.; Harstad, O.M. Bovine milk in human nutrition—A review. Lipids Health Dis. 2007, 6, 25. [Google Scholar] [CrossRef] [PubMed] [Green Version]
  3. Mills, S.; Ross, R.P.; Hill, C.; Fitzgerald, G.F.; Stanton, C. Milk intelligence: Mining milk for bioactive substances associated with human health. Int. Dairy J. 2011, 21, 377–401. [Google Scholar] [CrossRef]
  4. Dairy Production and Products: Products. Available online: http://www.fao.org/dairy-production-products/products/en/ (accessed on 18 April 2020).
  5. EU Agricultural Outlook for Markets and Income, 2019–2030; European Commission, DG Agriculture and Rural Development: Brussels, Belgium, 2019.
  6. Milk and Milk Products, Detailed Data, Slovenia. 2018. Available online: https://www.stat.si/StatWeb/en/News/Index/8208 (accessed on 18 April 2020).
  7. Yayota, M.; Tsukamoto, M.; Yamada, Y.; Ohtani, S. Milk composition and flavor under different feeding systems: A survey of dairy farms. J. Dairy Sci. 2013, 96, 5174–5183. [Google Scholar] [CrossRef]
  8. Ellis, K.A.; Innocent, G.; Grove-White, D.; Cripps, P.; McLean, W.G.; Howard, C.V.; Mihm, M. Comparing the fatty acid composition of organic and conventional milk. J. Dairy Sci. 2006, 89, 1938–1950. [Google Scholar] [CrossRef]
  9. Hanus, O.; Samkova, E.; Křížova, L.; Hasoňova, L.; Kala, R. Role of fatty acids in milk fat and the influence of selected factors on their variability—A review. Molecules 2018, 23, 1636. [Google Scholar] [CrossRef] [Green Version]
  10. Benjamin, S.; Spener, F. Conjugated linoleic acids as functional food: An insight into their health benefits. Nutr. Metab. (Lond.) 2009, 6, 36. [Google Scholar] [CrossRef] [Green Version]
  11. Mooney, D.; McCarthy, C.; Belton, O. Effects of conjugated linoleic acid isomers on monocyte, macrophage and foam cell phenotype in atherosclerosis. Prostaglandins Other Lipid Mediat. 2012, 98, 56–62. [Google Scholar] [CrossRef] [PubMed]
  12. Chilliard, Y.; Glasser, F.; Ferlay, A.; Bernard, L.; Rouel, J.; Doreau, M. Diet, rumen biohydrogenation and nutritional quality of cow and goat milk fat. Eur. J. Lipid Sci. Technol. 2007, 109, 828–855. [Google Scholar] [CrossRef]
  13. Kliem, K.E.; Shingfield, K.J.; Livingstone, K.M.; Givens, D.I. Seasonal variation in the fatty acid composition of milk available at retail in the United Kingdom and implications for dietary intake. Food Chem. 2013, 141, 274–281. [Google Scholar] [CrossRef]
  14. Collomb, M.; Bisig, W.; Bütikofer, U.; Sieber, R.; Bregy, M.; Etter, L. Seasonal variation in the fatty acid composition of milk supplied to dairies in the mountain regions of Switzerland. Dairy Sci. Technol. 2008, 88, 631–647. [Google Scholar] [CrossRef] [Green Version]
  15. Cossignani, L.; Blasi, F.; Bosi, A.; D’Arco, G.; Maurelli, S.; Simonetti, M.S.; Damiani, P. Detection of cow milk in donkey milk by chemometric procedures on triacylglycerol stereospecific analysis results. J. Dairy Res. 2011, 78, 335–342. [Google Scholar] [CrossRef] [PubMed]
  16. Camin, F.; Perini, M.; Colombari, G.; Bontempo, L.; Versini, G. Influence of dietary composition on the carbon, nitrogen, oxygen and hydrogen stable isotope ratios of milk. Rapid Commun. Mass Spectrom. 2008, 22, 1690–1696. [Google Scholar] [CrossRef] [PubMed]
  17. Molkentin, J.; Giesemann, A. Differentiation of organically and conventionally produced milk by stable isotope and fatty acid analysis. Anal. Bioanal. Chem. 2007, 388, 297–305. [Google Scholar] [CrossRef] [PubMed]
  18. Richter, E.K.; Spangenberg, J.E.; Klevenhusen, F.; Soliva, C.R.; Kreuzer, M.; Leiber, F. Stable carbon isotope composition of c9,t11-conjugated linoleic acid in cow’s milk as related to dietary fatty acids. Lipids 2012, 47, 161–169. [Google Scholar] [CrossRef]
  19. Luo, D.; Dong, H.; Luo, H.; Xian, Y.; Guo, X.; Wu, Y. Multi-element (C, N, H, O) stable isotope ratio analysis for determining the geographical origin of pure milk from different regions. Food Anal. Methods 2016, 9, 437–442. [Google Scholar] [CrossRef]
  20. Bontempo, L.; Lombardi, G.; Paoletti, R.; Ziller, L.; Camin, F. H, C, N and O stable isotope characteristics of alpine forage, milk and cheese. Int. Dairy J. 2012, 23, 99–104. [Google Scholar] [CrossRef] [Green Version]
  21. Crittenden, R.G.; Andrew, A.S.; LeFournour, M.; Young, M.D.; Middleton, H.; Stockmann, R. Determining the geographic origin of milk in Australasia using multi-element stable isotope ratio analysis. Int. Dairy J. 2007, 17, 421–428. [Google Scholar] [CrossRef]
  22. Potočnik, D.; Nečemer, M.; Perišić, I.; Jagodic, M.; Mazej, D.; Camin, F.; Eftimov, T.; Strojnik, L.; Ogrinc, N. Geographical verification of Slovenian milk using stable isotope ratio, multi-element and multivariate modelling approaches. Food Chem. 2020, 326, 126958. [Google Scholar] [CrossRef] [PubMed]
  23. Molkentin, J. Authentication of organic milk using δ13C and the α-linolenic acid content of milk fat. J. Agric. Food Chem. 2009, 57, 785–790. [Google Scholar] [CrossRef]
  24. Ehtesham, E.; Hayman, A.R.; McComb, K.A.; Van Hale, R.; Frew, R.D. Correlation of Geographical Location with Stable Isotope Values of Hydrogen and Carbon of Fatty Acids from New Zealand Milk and Bulk Milk Powder. J. Agric. Food Chem. 2013, 61, 8914–8923. [Google Scholar] [CrossRef]
  25. Ehtesham, E.; Hayman, A.; Van Hale, R.; Frew, R. Influence of feed and water on the stable isotopic composition of dairy milk. Int. Dairy J. 2015, 47, 37–45. [Google Scholar] [CrossRef]
  26. Gaspardo, B.; Lavrenčič, A.; Levart, A.; Del Zotto, S.; Stefanon, B. Use of milk fatty acids composition to discriminate area of origin of bulk milk. J. Dairy Sci. 2010, 93, 3417–3426. [Google Scholar] [CrossRef] [PubMed]
  27. Malacarne, M.; Martuzzi, F.; Summer, A.; Mariani, P. Protein and fat composition of mare’s milk: Some nutritional remarks with reference to human and cow’s milk. Int. Dairy J. 2002, 12, 869–877. [Google Scholar] [CrossRef]
  28. Coppa, M.; Ferlay, A.; Chassaing, C.; Agabriel, C.; Glasser, F.; Chilliard, Y.; Borreani, G.; Barcarolo, R.; Baars, T.; Kusche, D.; et al. Prediction of bulk milk fatty acid composition based on farming practices collected through on-farm surveys. J. Dairy Sci. 2013, 96, 4197–4211. [Google Scholar] [CrossRef]
  29. Kaufman, L.; Rousseeuw, P.J. Partitioning around Medoids (Program PAM). In Finding Groups in Data an Introduction to Cluster Analysis; Kaufman, L., Rousseeuw, P.J., Eds.; John Wiley & Sons, Inc.: Hoboken, NJ, USA, 1990; pp. 68–125. [Google Scholar]
  30. Cossignani, L.; Blasi, F.; Simonetti, M.S.; Montesano, D. Fatty Acids and Phytosterols to Discriminate Geographic Origin of Lycium barbarum Berry. Food Anal. Methods 2018, 11, 1180–1188. [Google Scholar] [CrossRef]
  31. Potočnik, T.; Ogrinc, N.; Potočnik, D.; Košir, I.J. Fatty acid composition and δ13C isotopic ratio characterisation of pumpkin seed oil. J. Food Comp. Anal. 2016, 53, 85–90. [Google Scholar] [CrossRef]
  32. Hrastar, R.; Gams Petrišič, M.; Ogrinc, N.; Košir, I.J. Fatty acid and stable carbon isotope charcaterization of Camelina sativa oil: Implications for authentification. J. Agric. Food Chem. 2009, 57, 579–585. [Google Scholar] [CrossRef]
  33. Logan, A.; Müller, W.; Versteeg, C. Australian milk fat-seasonal and regional composition of fatty acids. J. Dairy Res. Technol. 2019, 2, 011. [Google Scholar] [CrossRef]
  34. Rutkowska, J.; Bialek, M.; Adamska, A.; Zbikowska, A. Differentiation of geographical origin of cream products in poland according to their fatty acid profile. Food Chem. 2015, 178, 26–31. [Google Scholar] [CrossRef]
  35. Bauman, D.E.; Griinari, J.M. Nutritional regulation of milk fat synthesis. Annu. Rev. Nutr. 2003, 23, 203–227. [Google Scholar] [CrossRef] [PubMed] [Green Version]
  36. Dudd, S.N.; Evershed, R.P. Direct demonstration of milk as an element of archaeological economies. Science 1998, 282, 1478–1481. [Google Scholar] [CrossRef]
  37. Stergiadis, S.; Leifert, C.; Seal, C.J.; Eyre, M.D.; Steinshamn, H.; Butler, G. Improving the fatty acid profile of winter milk from housed cows with contrasting feeding regimes by oilseed supplementation. Food Chem. 2014, 164, 293–300. [Google Scholar] [CrossRef] [PubMed] [Green Version]
  38. MacGibbon, A.K.H.; Taylor, M.W. Composition and structure of bovine milk lipids. In Advanced Dairy Chemistry, 3rd ed.; Fox, P.F., McSweeney, P.L.H., Eds.; Springer: New York, NY, USA, 2009; Volume 2, pp. 1–42. [Google Scholar]
  39. Schwendel, B.H.; Wester, T.J.; Morel, P.C.H.; Tavendale, M.H.; Deadman, C.; Shadbolt, N.M.; Otter, D.E. Invited review: Organic and conventionally produced milk-An evaluation of factors influencing milk composition. J. Dairy Sci. 2015, 98, 721–746. [Google Scholar] [CrossRef] [PubMed] [Green Version]
  40. Engel, E.; Ferlay, A.; Cornu, A.; Chilliard, Y.; Agabriel, C.; Bielicki, G.; Martin, B. Relevance of Isotopic and Molecular Biomarkers for the Authentication of Milk According to Production Zone and Type of Feeding of the Cow. J. Agric. Food Chem. 2007, 55, 9099–9108. [Google Scholar] [CrossRef] [PubMed]
  41. Ferlay, A.; Martin, B.; Pradel, P.; Coulon, J.B.; Chilliard, Y. Influence of grass-based diets on milk fatty acid composition and milk lipolytic system in Tarentaise and Montbéliarde cow breeds. J. Dairy Sci. 2006, 89, 4026–4041. [Google Scholar] [CrossRef] [Green Version]
  42. Nantapo, C.T.W.; Muchenje, V.; Hugo, A. Atherogenicity index and health-related fatty acids in different stages of lactation from Friesian, Jersey and Friesian x Jersey cross cow milk under a pasture-based dairy system. Food Chem. 2014, 146, 127–133. [Google Scholar] [CrossRef]
  43. Bauman, D.E.; Lock, A.L. Conjugated Linoleic Acid: Biosynthesis and Nutritional Significance. In Advanced Dairy Chemistry, 3rd ed.; Fox, P.F., McSweeney, P.L.H., Eds.; Springer: New York, NY, USA, 2009; Volume 2, pp. 93–136. [Google Scholar]
  44. Khan, N.A.; Yu, P.; Ali, M.; Cone, J.W.; Hendriks, W.H. Nutritive value of maize silage in relation to dairy cow performance and milk quality. J. Sci. Food Agric. 2015, 95, 238–252. [Google Scholar] [CrossRef]
  45. Larqué, E.; Garaulet, M.; Pérez-Llamas, F.; Zamora, S.; Tebar, F.J. Fatty Acid Composition and Nutritional Relevance of Most Widely Consumed Margarines in Spain. Grasas Aceites 2003, 54, 65–70. [Google Scholar]
  46. Christie, W.W.; Han, X. Lipid Analysis: Isolation, Separation, Identification and Lipidomic Analysis, 4th ed.; The Oily Press: Bridgwater, UK, 2010. [Google Scholar]
  47. Brand, W.A.; Coplen, T.B.; Vogl, J.; Rosner, M.; Prohaska, T. Assessment of international reference materials for isotope-ratio analysis (IUPAC technical report). Pure Appl. Chem. 2014, 86, 425–467. [Google Scholar] [CrossRef]
  48. Paul, D.; Skrzypek, G.; Fórizs, I. Normalization of measured stable isotopic compositions to isotope reference scales—A review. Rapid Commun. Mass Spectrom. 2007, 21, 3006–3014. [Google Scholar] [CrossRef] [PubMed]
Sample Availability: Not available.
Figure 1. Cluster analysis of the percentage of fatty acid (FA) in Slovenian milk.
Molecules 25 02892 g001
Figure 2. Linear discriminant analysis of FA in milk according to year and season of production: (a) discriminant function score plot of 231 authentic Slovenian milk samples from summer/winter in 2012, 2013, and 2014 (12 s/12 w; 13 s/13 w; 14 s/14 w); (b) discriminant loading plot of the correlations between the initial variables and the discriminant functions.
Molecules 25 02892 g002
Figure 3. Linear discriminant analysis of FA composition according to the production region: M-Mediterranean, A-Alpine, D-Dinaric, and P-Pannonian; (a) discriminant function score plot of 231 authentic Slovenian milk samples from summer/winter: 2012, 2013, and 2014; (c) discriminant function score plot of 39 Slovenian milk samples from four regions in winter 2013; (b,d) discriminant loading plot, showing correlations between initial variables and discriminant functions.
Molecules 25 02892 g003
Figure 4. Box plots of δ13C values of milk fatty acids and bulk milk samples according to the year (2013, 2014), season (summer, winter in 2014), and region of production in summer and winter 2014: Med-Mediterranean, Alp-Alpine, Din-Dinaric, Pan-Pannonian.
Molecules 25 02892 g004
Table 1. The percentage of fatty acid (FA) in Slovenian milk according to the year (2012, 2013, and 2014), season (winter (12 w, 13 w, 14 w), summer (12 s, 13 s, 14 s), and type of feed. Influence of the feed type on milk FA composition [9,12,13,28].
201220132014WinterSummerCornNon-Cornp-Value 1
FA (% of Total FA)Feed TypeMean ± SDYearSeason
SFA
C6:0Corn1.25 ± 0.261.20 ± 0.461.30 ± 0.441.44 ± 0.321.05 ± 0.371.30 ± 0.391.12 ± 0.40****
C8:0Corn, concentrates1.22 ± 0.081.36 ± 0.411.22 ± 0.341.28 ± 0.261.25 ± 0.371.29 ± 0.331.20 ± 0.28****
C10:0Corn, concentrates3.03 ± 0.253.57 ± 1.023.18 ± 0.823.28 ± 0.623.23 ± 0.953.33 ± 0.813.07 ± 0.74***
C11:0Corn, concentrates0.04 ± 0.030.06 ± 0.030.08 ± 0.020.06 ± 0.020.05 ± 0.040.06 ± 0.030.05 ± 0.03******
C12:0Corn, concentrates3.57 ± 0.334.10 ± 0.803.90 ± 0.823.97 ± 0.613.74 ± 0.803.94 ± 0.673.65 ± 0.79NS***
C13:0 0.11 ± 0.010.11 ± 0.030.11 ± 0.030.12 ± 0.020.10 ± 0.030.11 ± 0.030.10 ± 0.02NS***
C14:0Corn12.0 ± 0.6512.8 ± 1.8612.9 ± 1.2612.9 ± 0.9412.3 ± 1.7012.6 ± 1.4112.5 ± 1.39NS***
C15:0isoHay, grass silage0.32 ± 0.050.34 ± 0.130.34 ± 0.050.32 ± 0.050.35 ± 0.120.32 ± 0.090.37 ± 0.07******
C15:0aisoHay, grass silage0.51 ± 0.080.53 ± 0.090.56 ± 0.090.50 ± 0.070.56 ± 0.100.50 ± 0.070.61 ± 0.11NS***
C15:0Hay, grass silage1.17 ± 0.111.24 ± 0.131.33 ± 0.151.24 ± 0.141.25 ± 0.161.21 ± 0.121.34 ± 0.16NSNS
C16:0Calcium salts of palm oil, canola and soy, corn32.60 ± 2.1332.7 ± 2.4833.2 ± 2.1134.1 ± 1.7331.6 ± 2.0132.9 ± 1.8632.4 ± 3.04******
C17:0isoHay, grass silage0.37 ± 0.070.50 ± 0.060.53 ± 0.060.44 ± 0.100.49 ± 0.090.45 ± 0.090.51 ± 0.10******
C17:0aisoHay, grass silage0.47 ± 0.050.44 ± 0.060.48 ± 0.070.44 ± 0.050.48 ± 0.070.45 ± 0.050.51 ± 0.08******
C17:0Hay, grass silage0.61 ± 0.080.65 ± 0.110.69 ± 0.150.63 ± 0.100.67 ± 0.140.61 ± 0.090.73 ± 0.15NS***
C18:0Fresh herbage, grass silage, concentrates10.2 ± 1.019.87 ± 1.179.99 ± 1.669.41 ± 0.9010.6 ± 1.369.97 ± 1.0610.2 ± 1.81******
C20:0 0.18 ± 0.020.19 ± 0.150.14 ± 0.080.16 ± 0.050.18 ± 0.130.17 ± 0.110.17 ± 0.07NS***
C21:0 0.03 ± 0.010.05 ± 0.070.02 ± 0.020.04 ± 0.030.03 ± 0.050.03 ± 0.050.03 ± 0.03***NS
C22:0 0.07 ± 0.020.04 ± 0.040.03 ± 0.030.05 ± 0.030.05 ± 0.040.05 ± 0.030.05 ± 0.03***NS
C23:0 0.03 ± 0.010.04 ± 0.050.03 ± 0.030.04 ± 0.040.03 ± 0.020.03 ± 0.040.04 ± 0.03******
C24:0 0.05 ± 0.010.04 ± 0.040.04 ± 0.030.05 ± 0.020.04 ± 0.030.04 ± 0.030.05 ± 0.03***NS
∑SFAConserved forage and concentrate rich diet67.76 ± 2.4969.90 ± 2.9970.10 ± 2.7470.40 ± 2.0668.04 ± 3.2069.43 ± 2.6168.71 ± 3.60******
MUFARapeseed, seeds oils, fresh grass, non-conserved forage
C12:1 0.12 ± 0.030.10 ± 0.030.09 ± 0.030.12 ± 0.030.09 ± 0.030.10 ± 0.030.10 ± 0.04******
C14:1 1.04 ± 0.111.29 ± 1.411.17 ± 0.251.18 ± 0.181.15 ± 1.171.19 ± 0.951.12 ± 0.29NS***
C16:1 2.03 ± 0.111.85 ± 0.201.94 ± 0.171.92 ± 0.141.96 ± 0.211.95 ± 0.181.92 ± 0.18***NS
C17:1 0.28 ± 0.030.34 ± 0.050.37 ± 0.060.31 ± 0.060.34 ± 0.070.32 ± 0.050.36 ± 0.07******
C18:1ω-9c/9tGrass, rapeseeds23.7 ± 2.1720.12 ± 2.820.7 ± 2.5620.5 ± 2.0122.6 ± 3.3821.4 ± 2.7621.9 ± 3.42******
C20:1ω-9 0.04 ± 0.010.25 ± 0.170.14 ± 0.080.12 ± 0.090.17 ± 0.170.14 ± 0.130.16 ± 0.16***NS
C22:1ω-9 0.01 ± 0.010.02 ± 0.020.04 ± 0.030.02 ± 0.020.02 ± 0.020.02 ± 0.020.02 ± 0.02NS***
∑MUFA 27.26 ± 2.1023.97 ± 2.8324.42 ± 2.3824.20 ± 1.8726.30 ± 3.2325.10 ± 2.7125.54 ± 3.17******
PUFA
CLA (c-9, t-11 C18:2)Grass silage, fish oil, rapeseed, linseed0.68 ± 0.280.61 ± 0.260.55 ± 0.200.51 ± 0.120.72 ± 0.310.55 ± 0.190.78 ± 0.31******
ω-6 PUFACorn, hay, straw,
C18:2ω-6cGrassing, red clover silage, corn2.00 ± 0.222.09 ± 0.321.98 ± 0.281.94 ± 0.232.11 ± 0.302.05 ± 0.241.95 ± 0.35NS***
C18:3ω-6 0.11 ± 0.020.43 ± 0.290.23 ± 0.120.20 ± 0.120.32 ± 0.300.24 ± 0.210.31 ± 0.28******
C20:3ω-6Fish oil0.08 ± 0.010.06 ± 0.040.06 ± 0.040.06 ± 0.040.06 ± 0.040.07 ± 0.040.06 ± 0.03***NS
C20:4ω-6Fish oil0.12 ± 0.020.03 ± 0.020.03 ± 0.030.06 ± 0.050.06 ± 0.050.06 ± 0.050.06 ± 0.05***NS
∑ω-6 PUFA 2.31 ± 0.242.61 ± 0.582.30 ± 0.332.27 ± 0.262.55 ± 0.532.41 ± 0.392.38 ± 0.54******
ω-3 PUFAGrassing,
C18:3ω-3Grassing, red clover silage, legume silage, cereals, oil seeds0.62 ± 0.200.69 ± 0.330.58 ± 0.200.54 ± 0.140.72 ± 0.300.57 ± 0.230.78 ± 0.25NS***
C20:3ω-3Fish oil0.02 ± 0.010.10 ± 0.090.09 ± 0.030.06 ± 0.050.07 ± 0.080.07 ± 0.070.05 ± 0.03***NS
C20:5ω-3Fish oil, linseed0.06 ± 0.020.05 ± 0.050.04 ± 0.030.05 ± 0.020.05 ± 0.060.05 ± 0.040.07 ± 0.06***NS
∑ω-3 PUFA 0.70 ± 0.220.84 ± 0.340.71 ± 0.210.65 ± 0.150.85 ± 0.320.69 ± 0.250.90 ± 0.25******
∑PUFA 3.69 ± 0.504.05 ± 0.983.55 ± 0.563.43 ± 0.334.11 ± 0.873.65 ± 0.654.06 ± 0.86******
ω-6:ω-3 3.64 ± 1.143.36 ± 0.793.80 ± 3.183.71 ± 1.193.48 ± 2.583.87 ± 2.142.87 ± 1.35NS***
SFA = saturated fatty acids; MUFA = monosaturated fatty acids; PUFA = polystaurated fatty acids; 1 NS = not significant; * p < 0.05; ** p < 0.01; *** p < 0.001.
Table 2. δ13C values (in ‰) in FAs in Slovenian milk according to the year, season, and feeding regime in 2013 and 2014. The source of FAs in milk, which influences its isotopic composition, is summarized by Ehtesham et al. [25], Richter et al. [18], Hanus et al. [9].
δ13C (‰) Mean ± SD
FASource of FA20132014WinterSummerCornNon-CornAverage
C10:0metabolism−23.9 ± 2.7−22.1 ± 2.5−21.3 ± 2.0−24.7 ± 2.3−22.2 ± 2.4−26.2 ± 1.8−22.9 ± 2.8
C12:0metabolism−24.6 ± 3.2−22.8 ± 2.6−21.8 ± 2.2−25.7 ± 2.5−22.8 ± 2.6−27.3 ± 2.0−23.6 ± 3.0
C14:1biosynthesis−27.4 ± 3.2−24.9 ± 3.0−24.3 ± 2.5−28.0 ± 3.0−25.2 ± 2.9−29.9 ± 2.2−26.0 ± 3.3
C14:0metabolism−23.5 ± 3.0−21.9 ± 2.6−21.2 ± 2.0−24.3 ± 2.8−21.9 ± 2.4−26.2 ± 2.2−22.6 ± 2.9
C15:0microbial biosynthesis−32.1 ± 3.7−28.8 ± 2.9−28.2 ± 2.6−32.6 ± 3.4−29.5 ± 3.4−33.9 ± 2.7−30.3 ± 3.7
C16:1biosynthesis−28.5 ± 3.5−26.0 ± 3.0−25.2 ± 2.3−29.4 ± 3.3−26.3 ± 3.0−31.3 ± 2.6−27.2 ± 3.5
C16:0diet and metabolism−23.6 ± 2.9−22.6 ± 2.5−21.8 ± 2.0−24.5 ± 2.7−22.2 ± 2.2−26.7 ± 1.7−23.0 ± 2.7
C18:1ω-9cbiosynthesis−27.2 ± 2.5−25.9 ± 2.2−25.6 ± 2.1−27.5 ± 2.5−25.8 ± 1.9−29.8 ± 2.1−26.5 ± 2.5
C18:0biosynthesis and diet−27.8 ± 3.2−26.6 ± 2.8−25.6 ± 2.3−29.0 ± 2.7−26.4 ± 2.5−31.0 ± 2.6−27.2 ± 3.0
Bulkdiet−21.4 ± 1.9−21.5 ± 2.2−20.6 ± 1.7−22.5 ± 1.9−20.7 ± 1.4−24.8 ± 0.9−21.4 ± 2.0
Table 3. Percentage of FA groups in Slovenian milk: 2012 and 2014, based on geographical origin and season.
Fatty AcidsYearSeasonAlpineMediterraneanPannonianDinaric
(% of Total FA) Mean ± SD
Saturated FA (SFA)2012summer64.15 ± 1.6269.57 ± 3.3066.33 ± 0.7466.74 ± 2.14
winter69.57 ± 0.8271.64 ± 3.1068.89 ± 0.6669.52 ± 0.53
average66.81 ± 3.0970.60 ± 3.0867.69 ± 1.4768.12 ± 2.05
2013summer68.78 ± 1.6068.19 ± 7.5870.20 ± 5.0470.63 ± 0.71
winter70.50 ± 0.7570.39 ± 3.6869.63 ± 1.9970.08 ± 2.46
average69.64 ± 1.5169.29 ± 5.4669.91 ± 3.7770.34 ± 1.82
2014summer68.08 ± 1.3369.55 ± 4.6568.42 ± 1.2268.62 ± 3.48
winter72.45 ± 1.0273.23 ± 4.2570.56 ± 2.7672.16 ± 0.79
average70.26 ± 2.5171.39 ± 4.4769.42 ± 2.3170.49 ± 2.99
Monounsaturated FA (MUFA)2012summer29.93 ± 1.2824.95 ± 3.3528.73 ± 0.6227.96 ± 2.00
winter25.79 ± 0.8623.59 ± 3.2626.56 ± 0.5225.94 ± 0.51
average27.86 ± 2.3724.27 ± 3.0527.57 ± 1.2326.89 ± 1.72
2013summer24.98 ± 1.3826.40 ± 7.0324.36 ± 2.0023.93 ± 0.86
winter23.73 ± 0.8424.16 ± 3.0924.16 ± 0.5323.26 ± 1.13
average24.36 ± 1.2925.28 ± 5.0124.25 ± 1.4223.57 ± 1.04
2014summer26.31 ± 0.9225.53 ± 3.6626.74 ± 1.1425.13 ± 2.27
winter22.20 ± 1.1321.59 ± 3.5623.15 ± 1.3722.64 ± 0.57
average24.25 ± 2.3323.56 ± 3.8925.07 ± 2.2023.81 ± 2.01
Conjugated linoleic acid (C18:2c9,t11) 2012summer1.20 ± 0.300.67 ± 0.120.62 ± 0.120.72 ± 0.20
winter0.61 ± 0.090.59 ± 0.100.48 ± 0.060.55 ± 0.10
average0.90 ± 0.370.63 ± 0.110.54 ± 0.110.63 ± 0.17
2013summer0.89 ± 0.240.67 ± 0.610.63 ± 0.340.54 ± 0.12
winter0.62 ± 0.150.52 ± 0.230.44 ± 0.070.54 ± 0.15
average0.75 ± 0.240.60 ± 0.420.54 ± 0.260.54 ± 0.13
2014summer0.86 ± 0.180.51 ± 0.310.50 ± 0.140.58 ± 0.21
winter0.47 ± 0.090.53 ± 0.200.44 ± 0.080.43 ± 0.06
average0.67 ± 0.240.52 ± 0.230.47 ± 0.120.51 ± 0.16
α-linolenic acid (C18:3ω-3)2012summer0.84 ± 0.140.98 ± 0.340.52 ± 0.070.70 ± 0.16
winter0.58 ± 0.090.76 ± 0.330.45 ± 0.060.57 ± 0.16
average0.71 ± 0.180.87 ± 0.320.48 ± 0.070.63 ± 0.17
2013summer1.08 ± 0.540.46 ± 0.070.78 ± 0.300.71 ± 0.21
winter0.61 ± 0.120.56 ± 0.140.50 ± 0.050.56 ± 0.11
average0.84 ± 0.450.51 ± 0.110.64 ± 0.260.63 ± 0.18
2014summer0.69 ± 0.260.89 ± 0.240.54 ± 0.130.66 ± 0.21
winter0.60 ± 0.130.81 ± 0.080.45 ± 0.090.45 ± 0.17
average0.64 ± 0.210.85 ± 0.170.50 ± 0.120.55 ± 0.22
Eicosapentaenoic acid (C20:5ω-3)2012summer0.08 ± 0.010.11 ± 0.020.06 ± 0.010.07 ± 0.02
winter0.06 ± 0.010.08 ± 0.020.05 ± 0.020.06 ± 0.02
average0.07 ± 0.010.09 ± 0.030.05 ± 0.010.07 ± 0.02
2013summer0.02 ± 0.030.16 ± 0.260.06 ± 0.100.02 ± 0.02
winter0.05 ± 0.040.04 ± 0.010.03 ± 0.020.05 ± 0.02
average0.04 ± 0.040.10 ± 0.170.05 ± 0.070.04 ± 0.02
2014summer0.04 ± 0.020.03 ± 0.030.03 ± 0.040.03 ± 0.02
winter0.04 ± 0.020.07 ± 0.010.04 ± 0.010.07 ± 0.02
average0.04 ± 0.020.05 ± 0.030.03 ± 0.030.05 ± 0.03
Polyunsaturated FA (PUFA)2012summer4.59 ± 0.463.71 ± 0.183.68 ± 0.193.90 ± 0.27
winter3.40 ± 0.173.43 ± 0.253.39 ± 0.213.32 ± 0.26
average4.00 ± 0.703.57 ± 0.253.52 ± 0.253.59 ± 0.39
2013summer4.98 ± 1.043.76 ± 1.384.58 ± 1.364.06 ± 0.61
winter3.81 ± 0.383.24 ± 0.443.44 ± 0.193.66 ± 0.29
average4.39 ± 0.973.50 ± 0.964.01 ± 1.123.85 ± 0.50
2014summer4.23 ± 0.663.64 ± 0.733.53 ± 0.393.69 ± 0.67
winter3.41 ± 0.313.21 ± 0.723.32 ± 0.313.20 ± 0.37
average3.82 ± 0.663.42 ± 0.693.43 ± 0.373.43 ± 0.57
ω-3 PUFA2012summer0.94 ± 0.161.12 ± 0.370.59 ± 0.080.79 ± 0.19
winter0.66 ± 0.100.86 ± 0.350.51 ± 0.060.64 ± 0.18
average0.80 ± 0.190.99 ± 0.350.55 ± 0.080.71 ± 0.20
2013summer1.17 ± 0.540.65 ± 0.281.00 ± 0.370.83 ± 0.16
winter0.75 ± 0.140.70 ± 0.140.63 ± 0.060.68 ± 0.12
average0.96 ± 0.440.67 ± 0.200.82 ± 0.320.75 ± 0.16
2014summer0.81 ± 0.281.01 ± 0.280.67 ± 0.160.75 ± 0.22
winter0.73 ± 0.160.95 ± 0.070.58 ± 0.100.61 ± 0.17
average0.77 ± 0.220.98 ± 0.180.63 ± 0.140.68 ± 0.20
ω-6 PUFA2012summer2.45 ± 0.131.92 ± 0.162.48 ± 0.152.38 ± 0.17
winter2.14 ± 0.151.98 ± 0.082.39 ± 0.232.14 ± 0.25
average2.29 ± 0.211.95 ± 0.122.43 ± 0.202.25 ± 0.24
2013summer2.92 ± 0.702.43 ± 1.232.94 ± 0.852.70 ± 0.51
winter2.44 ± 0.182.03 ± 0.222.36 ± 0.142.43 ± 0.21
average2.68 ± 0.552.23 ± 0.822.65 ± 0.672.56 ± 0.39
2014summer2.56 ± 0.342.12 ± 0.182.36 ± 0.302.35 ± 0.33
winter2.20 ± 0.161.72 ± 0.552.29 ± 0.222.16 ± 0.34
average2.38 ± 0.321.92 ± 0.432.33 ± 0.262.25 ± 0.34
ω-6:ω-3 PUFA2012summer2.69 ± 0.551.90 ± 0.854.26 ± 0.723.19 ± 0.94
winter3.32 ± 0.612.58 ± 1.034.79 ± 0.943.60 ± 1.08
average3.01 ± 0.662.24 ± 0.924.54 ± 0.873.41 ± 1.01
2013summer2.86 ± 1.053.64 ± 0.423.15 ± 0.863.34 ± 0.73
winter3.35 ± 0.523.01 ± 0.783.79 ± 0.393.69 ± 0.91
average3.11 ± 0.843.32 ± 0.663.47 ± 0.733.52 ± 0.82
2014summer3.01 ± 0.582.19 ± 0.483.69 ± 0.893.30 ± 0.74
winter3.13 ± 0.611.83 ± 0.674.06 ± 0.723.32 ± 0.86
average3.07 ± 0.592.01 ± 0.563.86 ± 0.823.31 ± 0.69
AI2012summer2.31 ± 0.203.25 ± 0.532.58 ± 0.102.63 ± 0.33
winter3.06 ± 0.153.51 ± 0.602.92 ± 0.103.06 ± 0.11
average2.69 ± 0.423.38 ± 0.522.76 ± 0.202.86 ± 0.32
2013summer3.03 ± 0.282.89 ± 1.823.15 ± 0.463.33 ± 0.20
winter3.30 ± 0.193.34 ± 0.623.79 ± 0.393.71 ± 0.21
average3.16 ± 0.273.13 ± 1.243.47 ± 0.733.35 ± 0.18
2014summer2.81 ± 0.272.92 ± 0.752.84 ± 0.203.07 ± 0.43
winter3.79 ± 0.254.13 ± 1.053.50 ± 0.313.75 ± 0.19
average3.30 ± 0.593.53 ± 1.053.15 ± 0.423.43 ± 0.47
TI2012summer2.69 ± 0.233.19 ± 0.233.05 ± 0.113.03 ± 0.28
winter3.47 ± 0.113.62 ± 0.283.43 ± 0.113.46 ± 0.11
average3.08 ± 0.433.41 ± 0.333.25 ± 0.223.26 ± 0.30
2013summer3.09 ± 0.343.18 ± 1.133.19 ± 0.423.41 ± 0.20
winter3.67 ± 0.143.68 ± 0.583.64 ± 0.123.71 ± 0.21
average3.38 ± 0.403.43 ± 0.853.42 ± 0.383.57 ± 0.25
2014summer3.25 ± 0.343.35 ± 0.713.33 ± 0.203.46 ± 0.44
winter3.82 ± 0.143.88 ± 0.793.80 ± 0.163.95 ± 0.25
average3.54 ± 0.393.61 ± 0.733.55 ± 0.423.72 ± 0.42
AI = atherogenic index [(C12:0 + 4 × C14:0 + C16:0)/(∑MUFA + ∑(ω-6) + ∑(ω-3))]; TI = thrombogenic index [(C14:0 + C16:0 + C18:0)/((0.5 × ∑MUFA + 0.5 × ∑(ω-6) + 3 × ∑(ω-3)) + (∑(ω-3)/∑(ω-6)))].
Table 4. Samples collected from different geographical regions in Slovenia.
AlpineDinaricMediterraneanPannonianGrand Total
2012241763077
summer12831437
winter12931640
2013241763077
summer12831538
winter12931539
2014241763077
summer12831639
winter12931438
Grand Total72511890231

