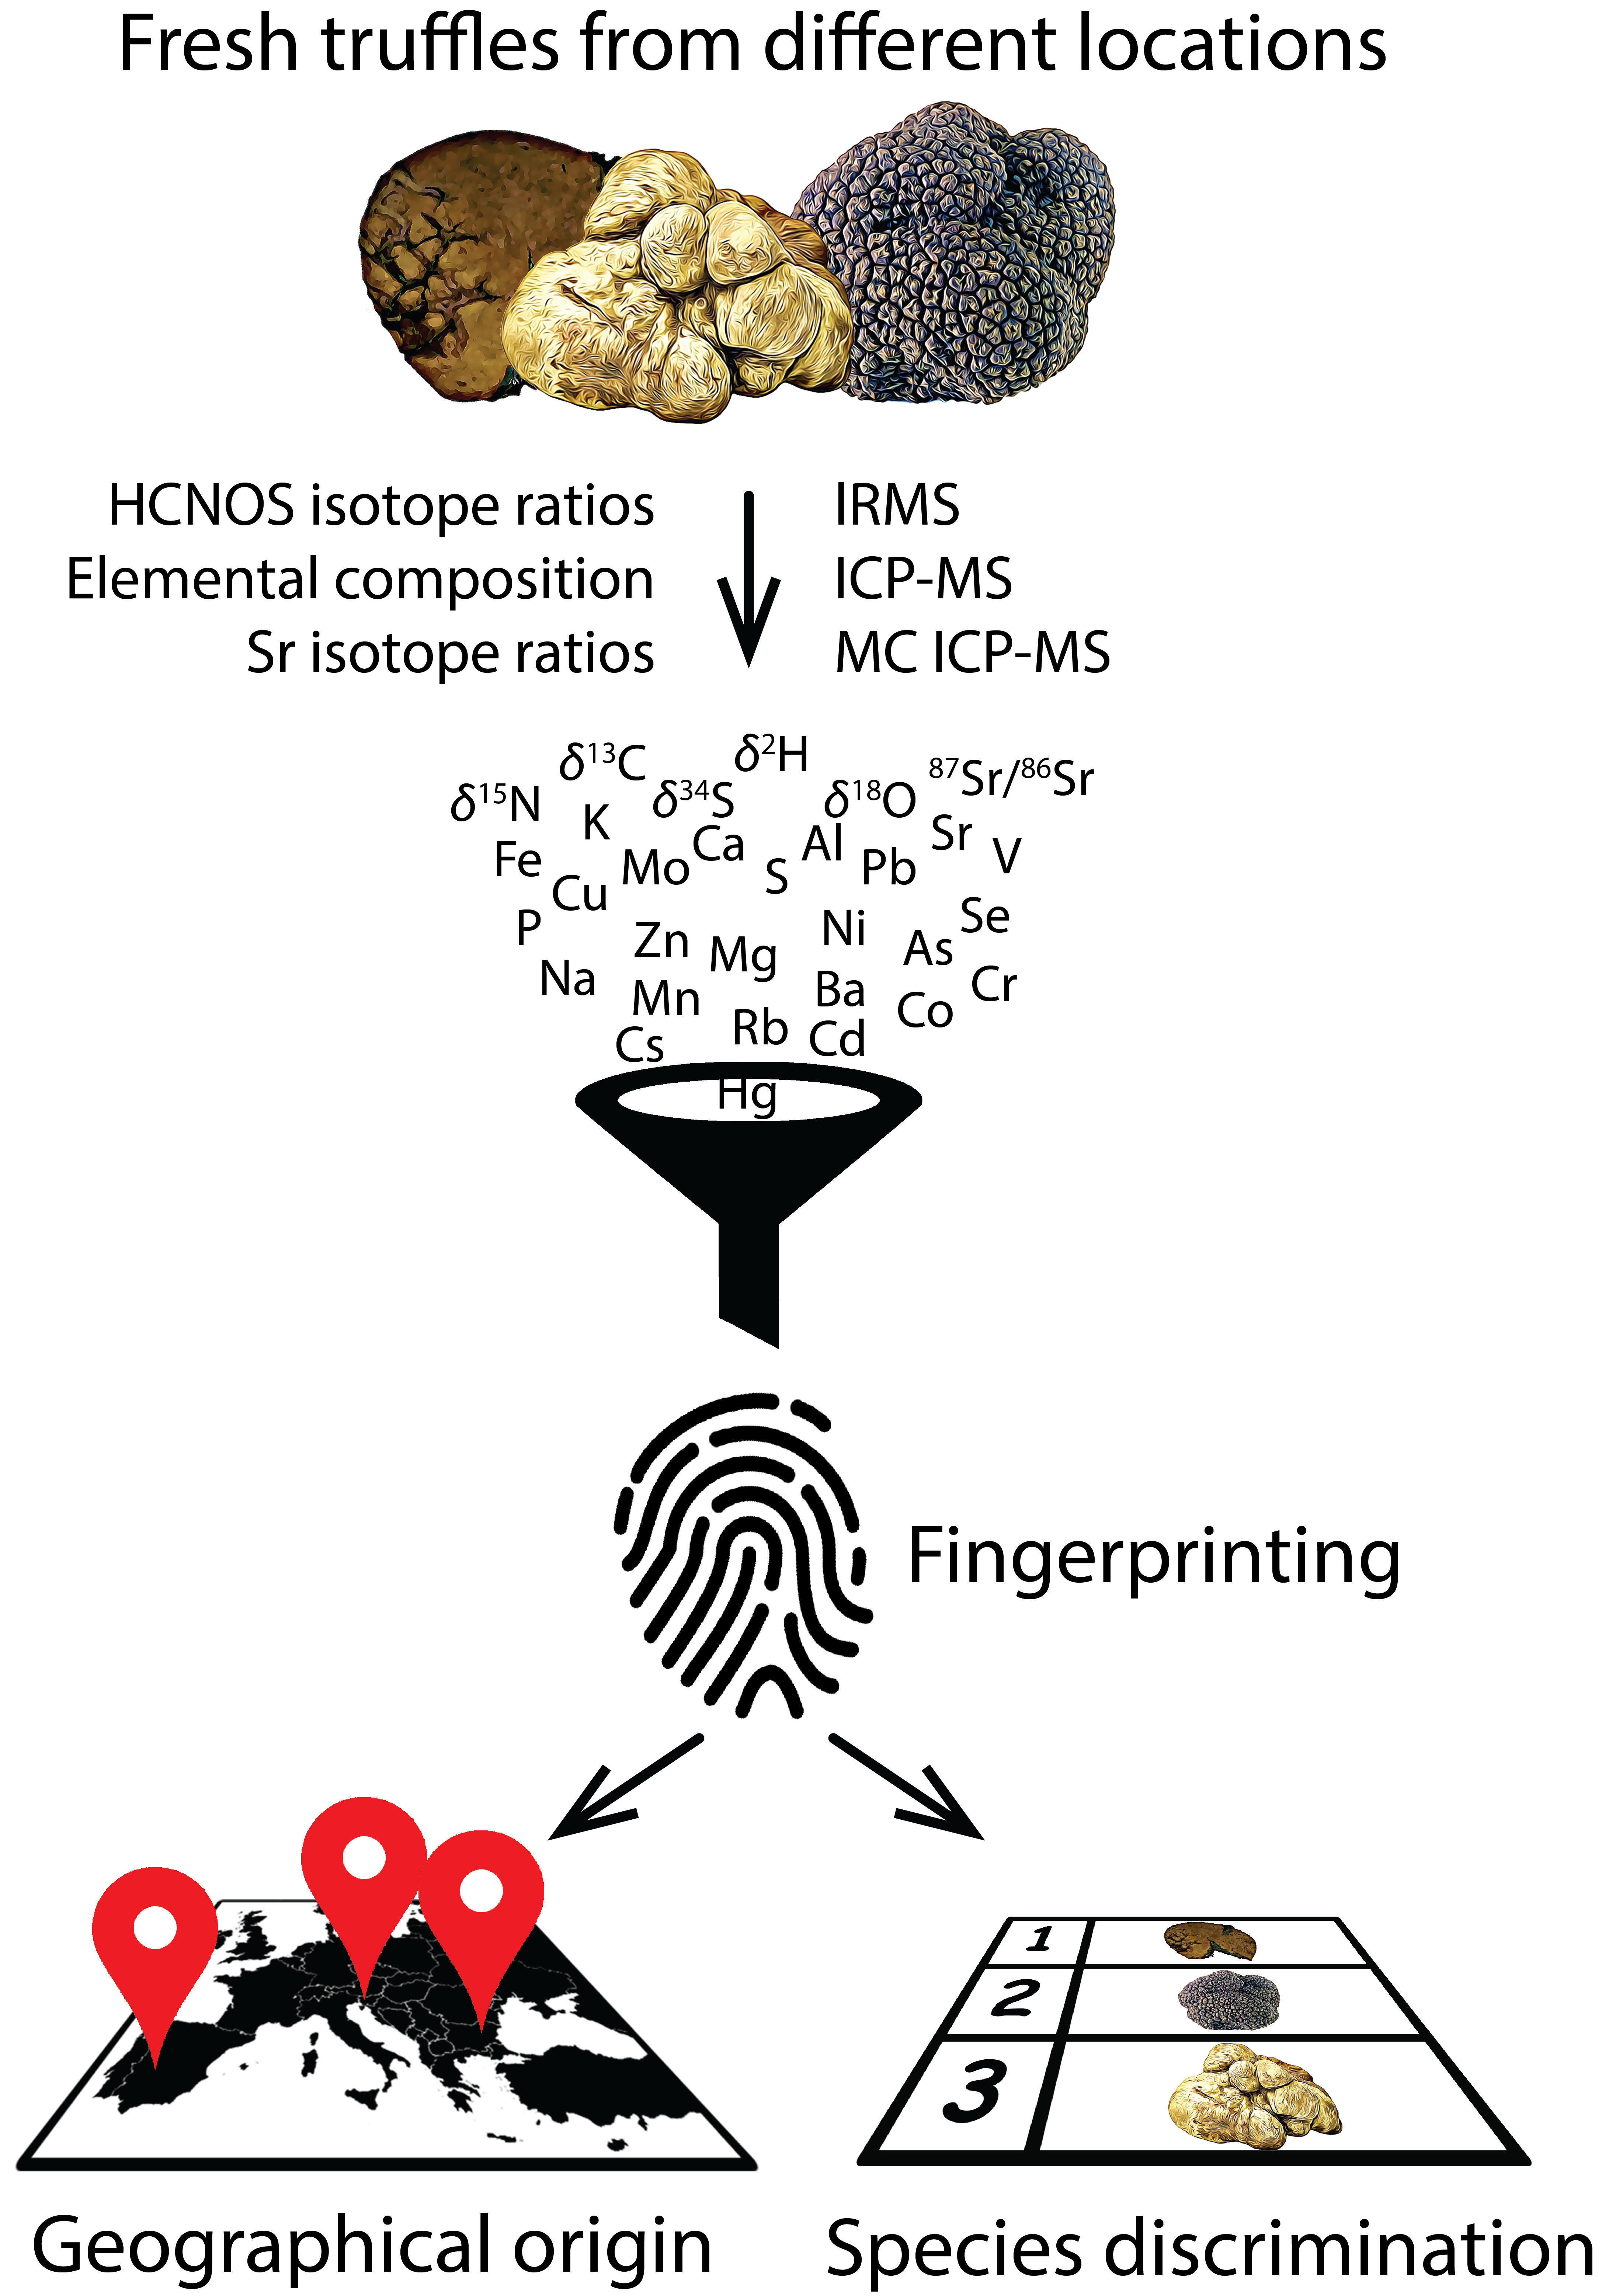
Can We Discover Truffle’s True Identity?


 , and
, and
Abstract
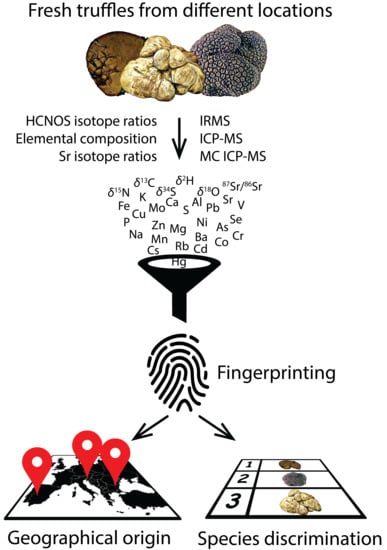
1. Introduction
2. Results and Discussion
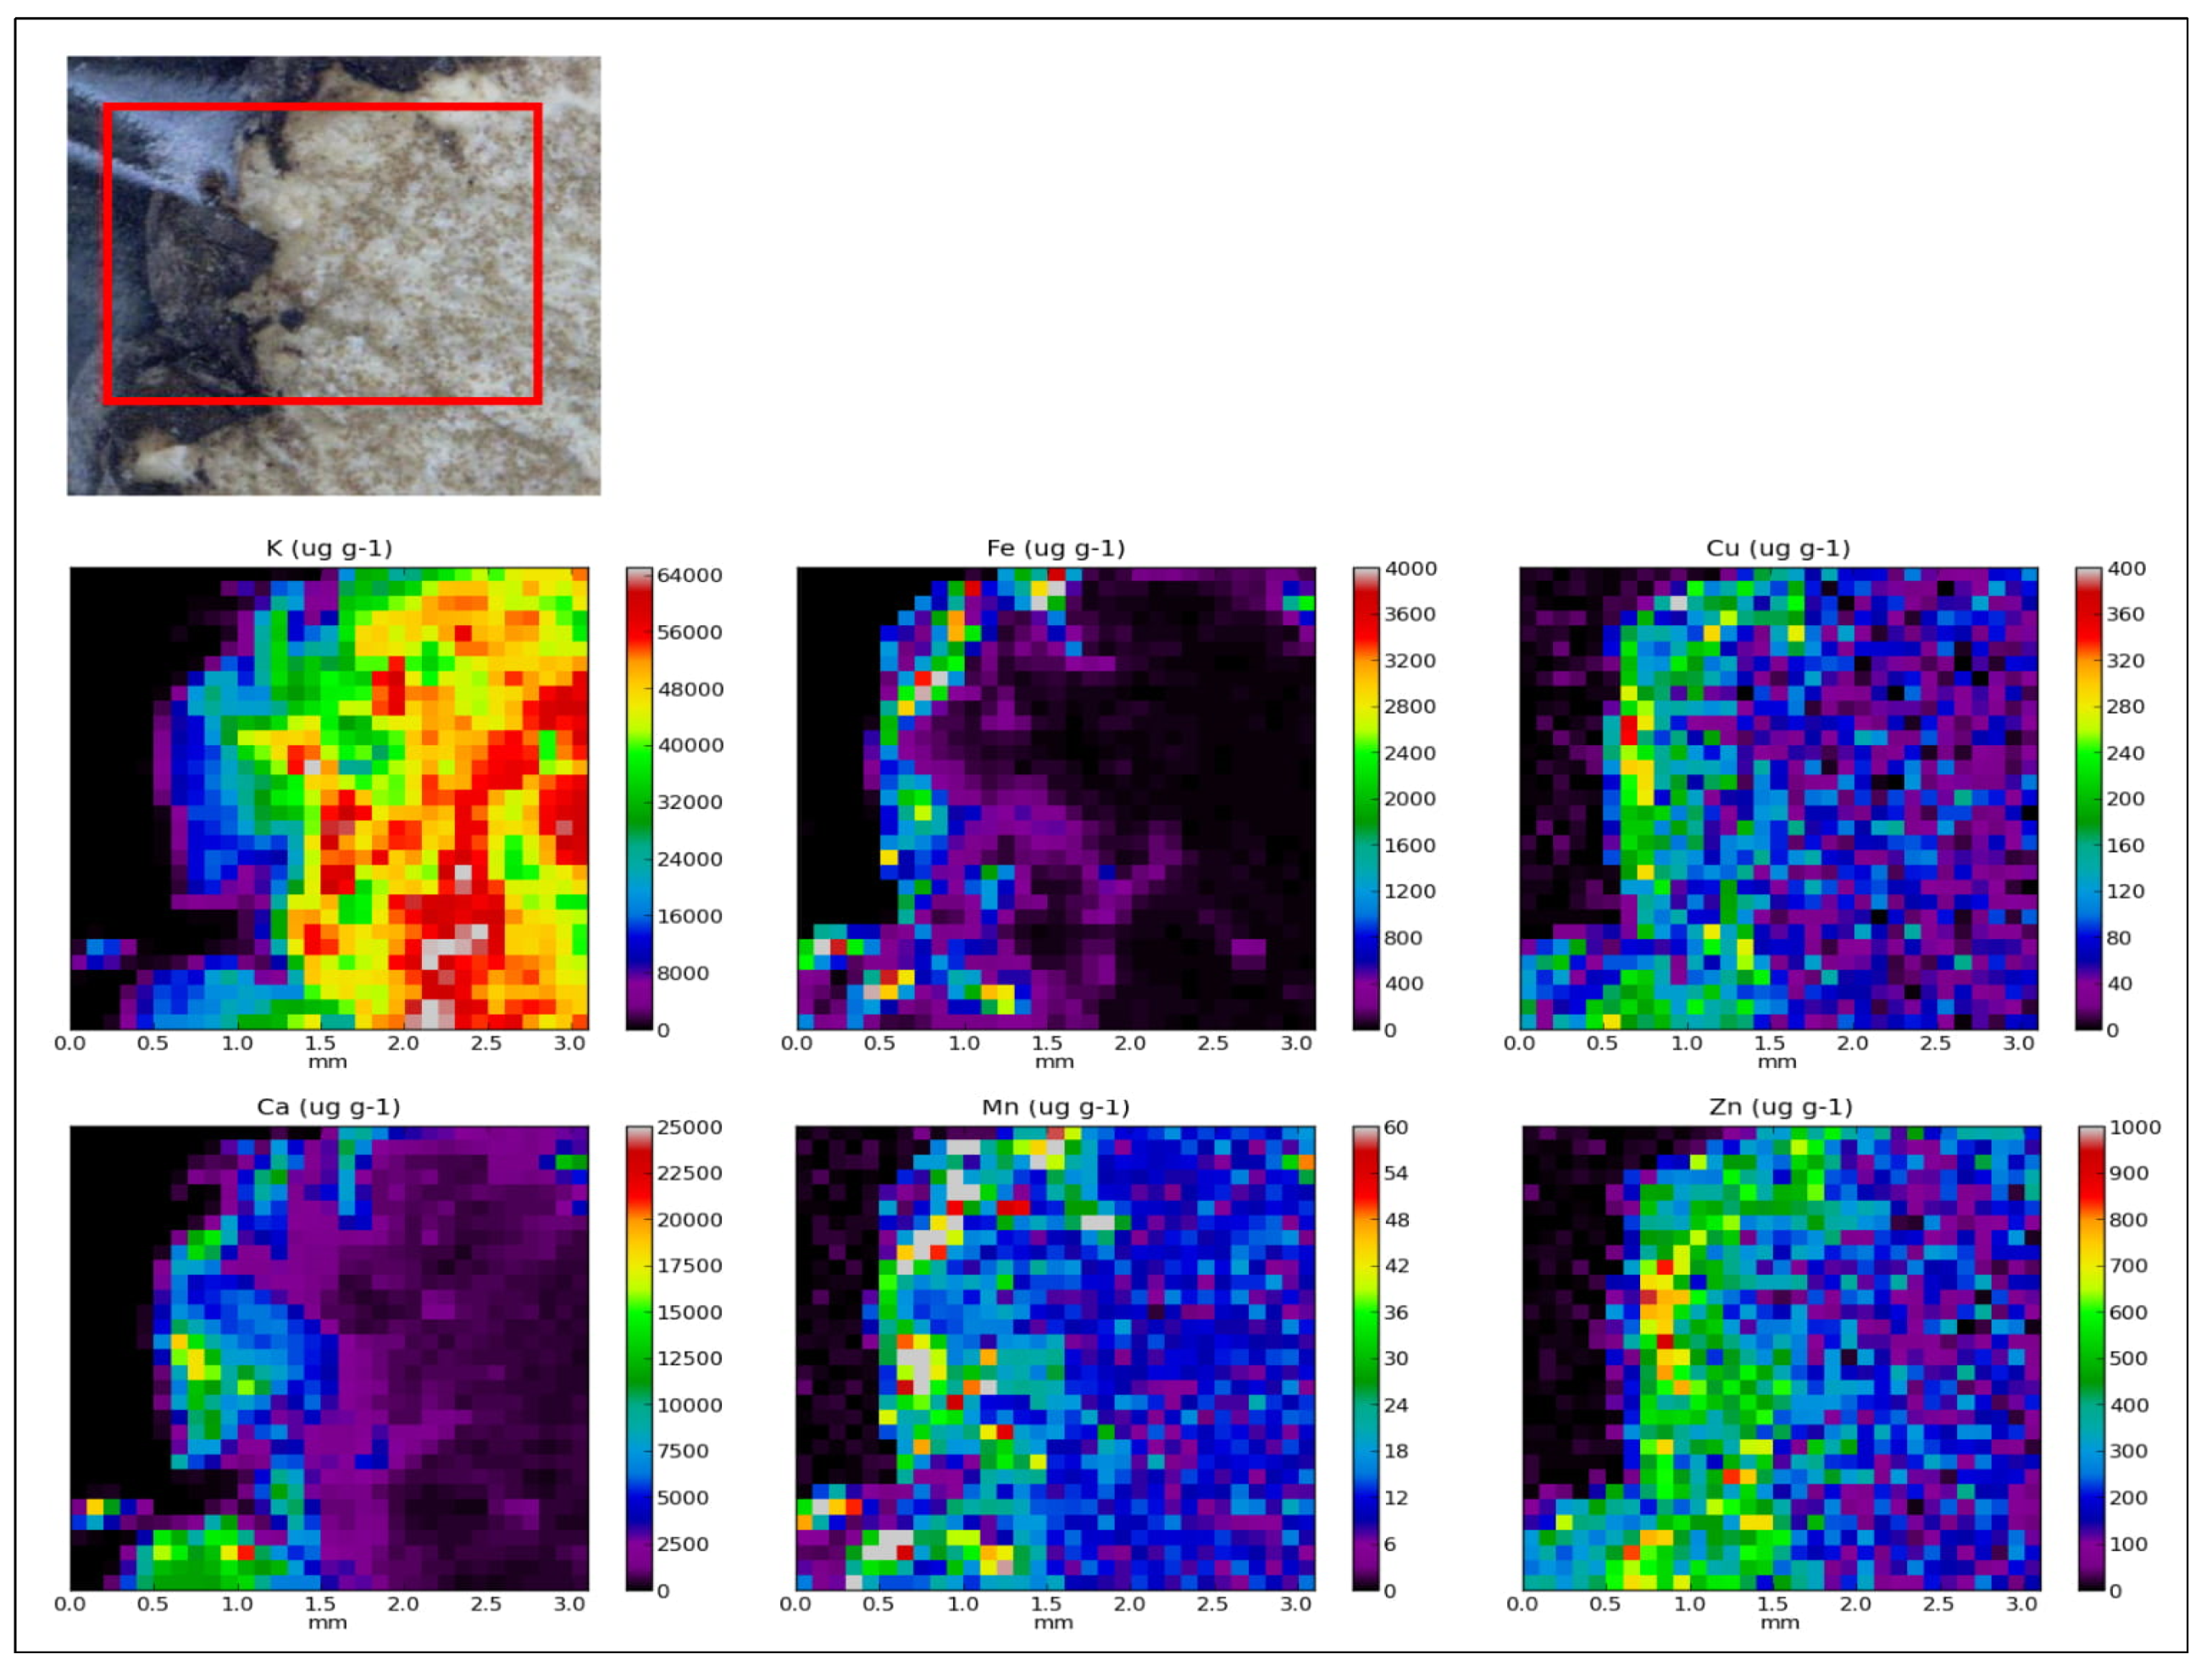
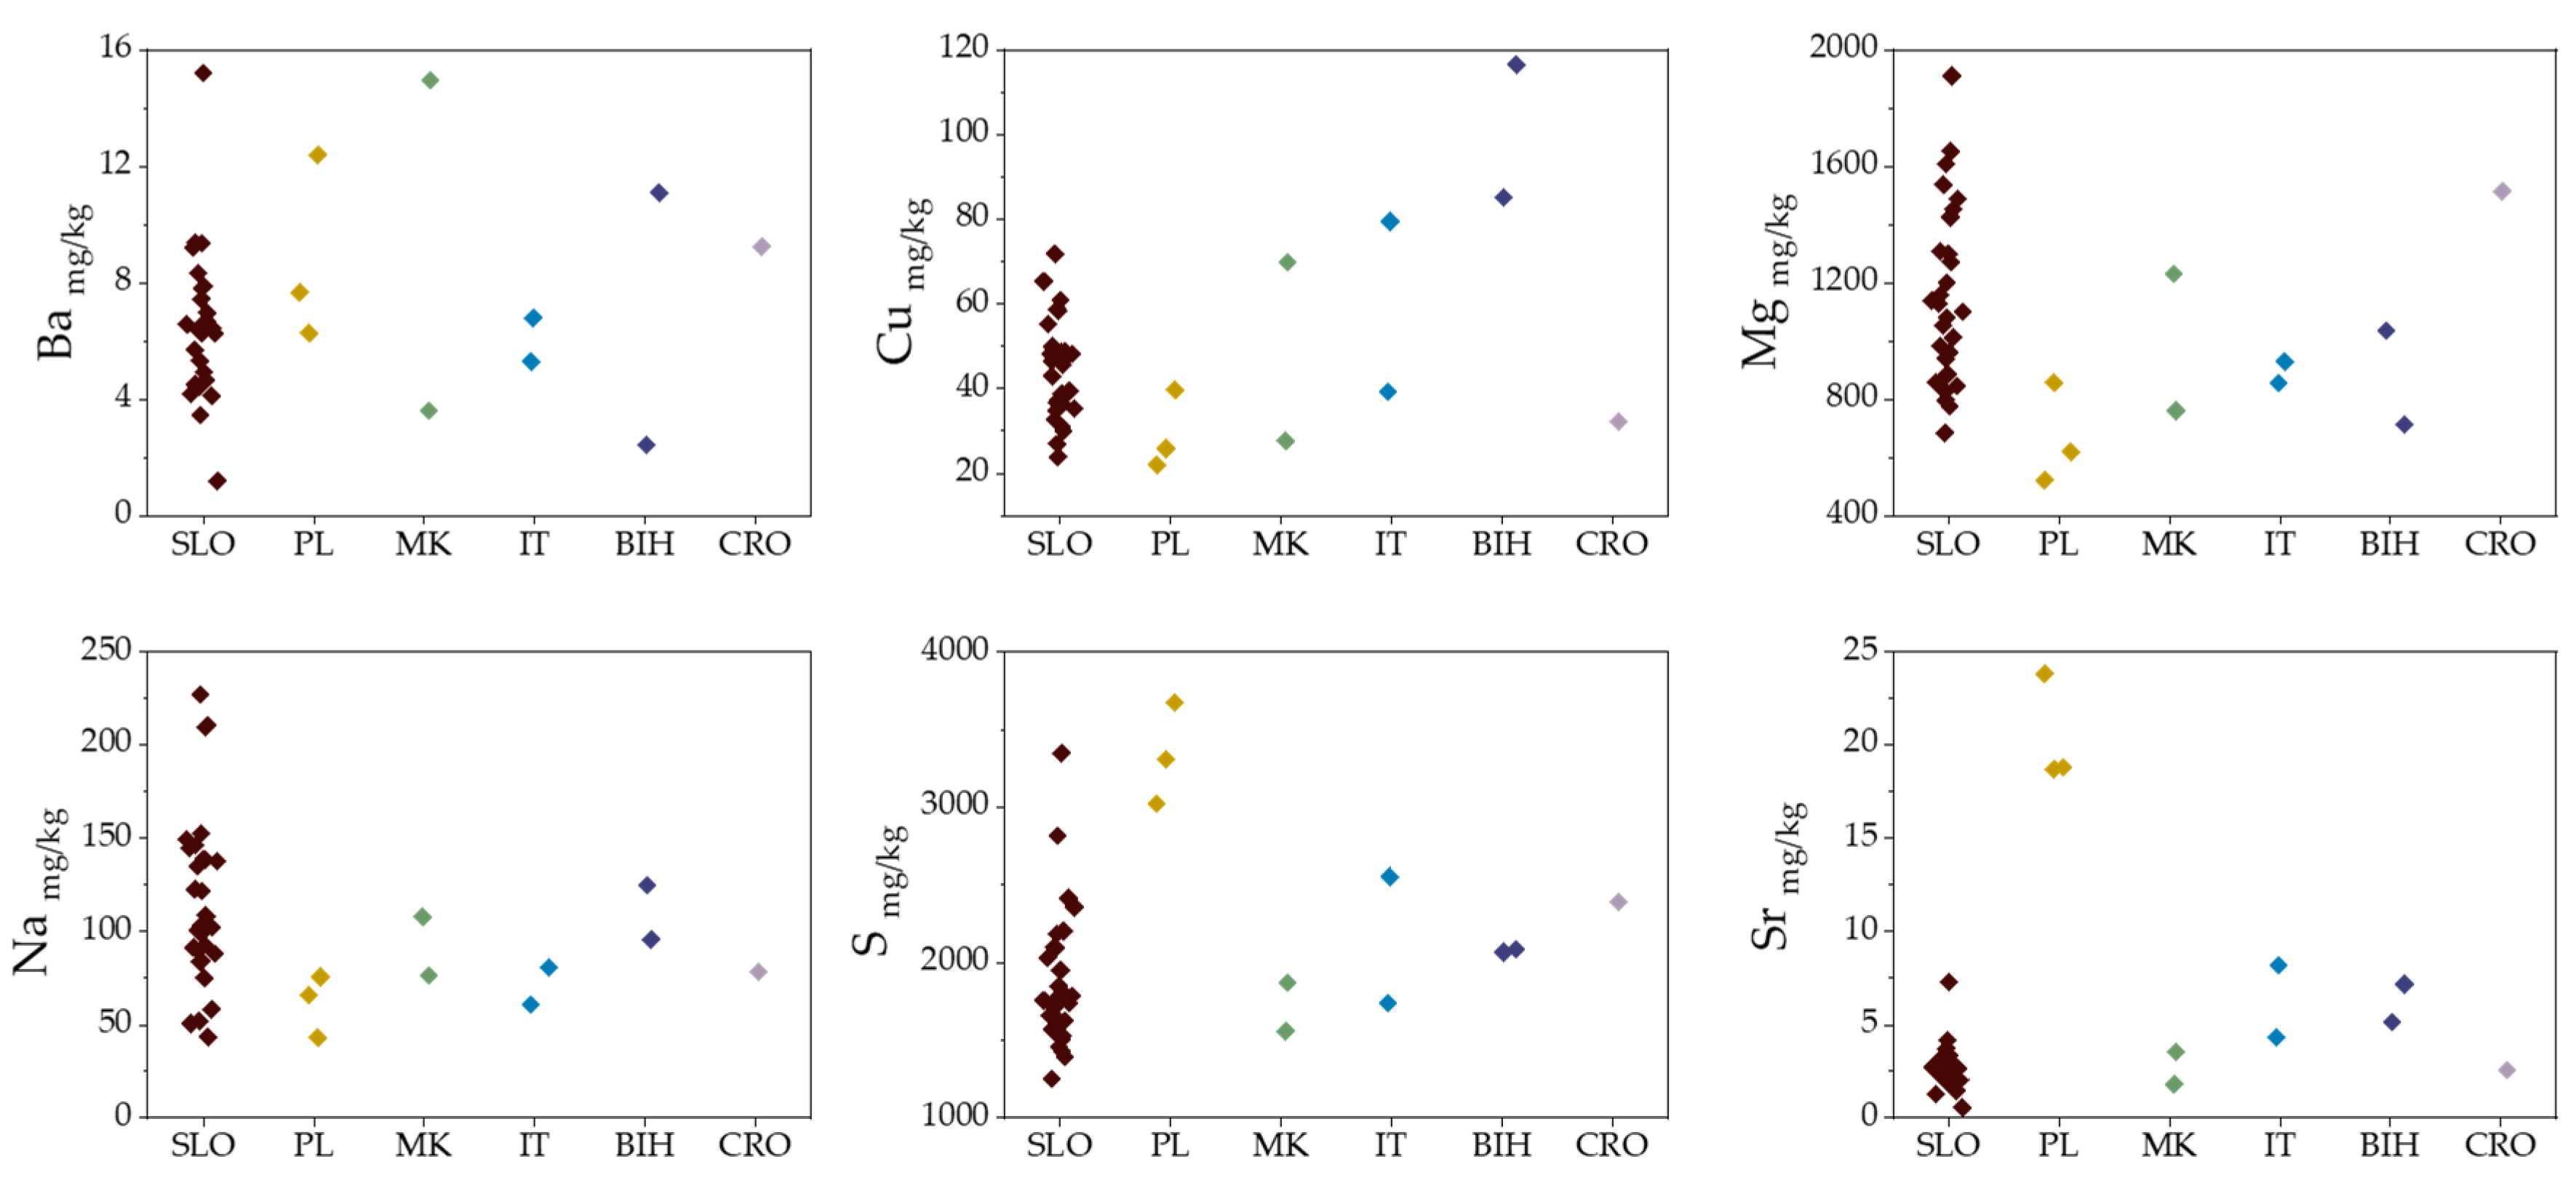
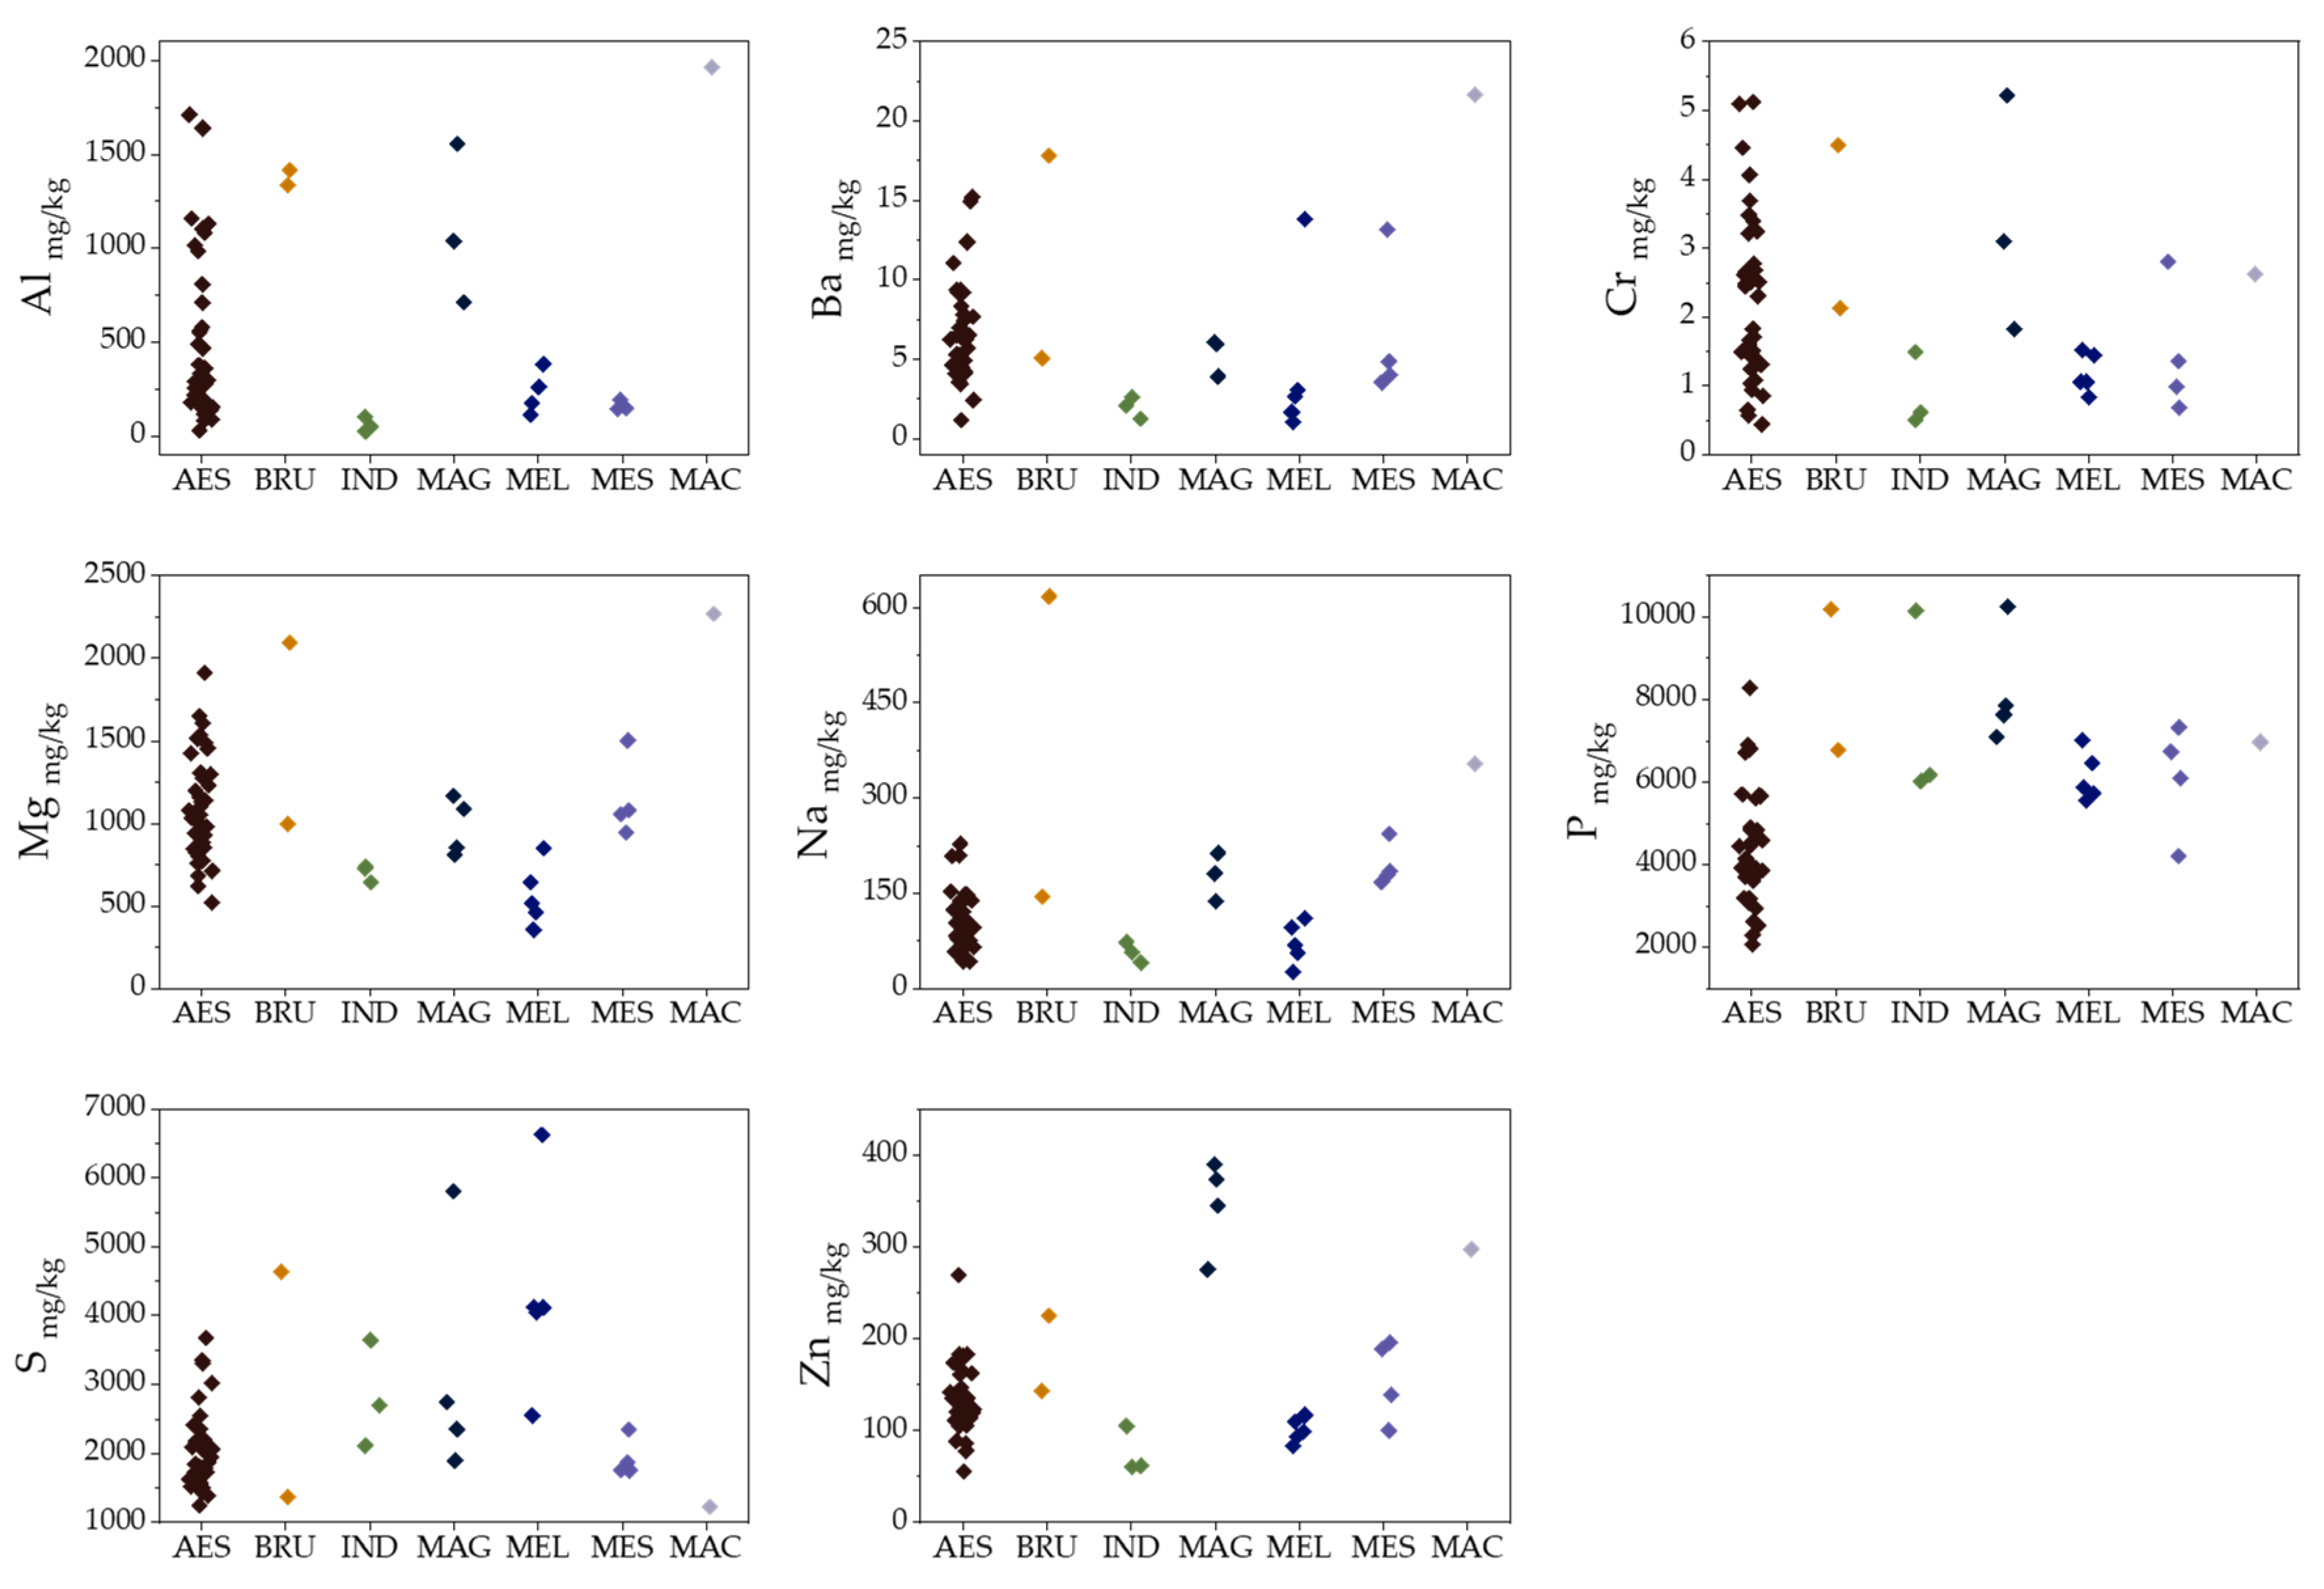
2.1. Elemental Composition
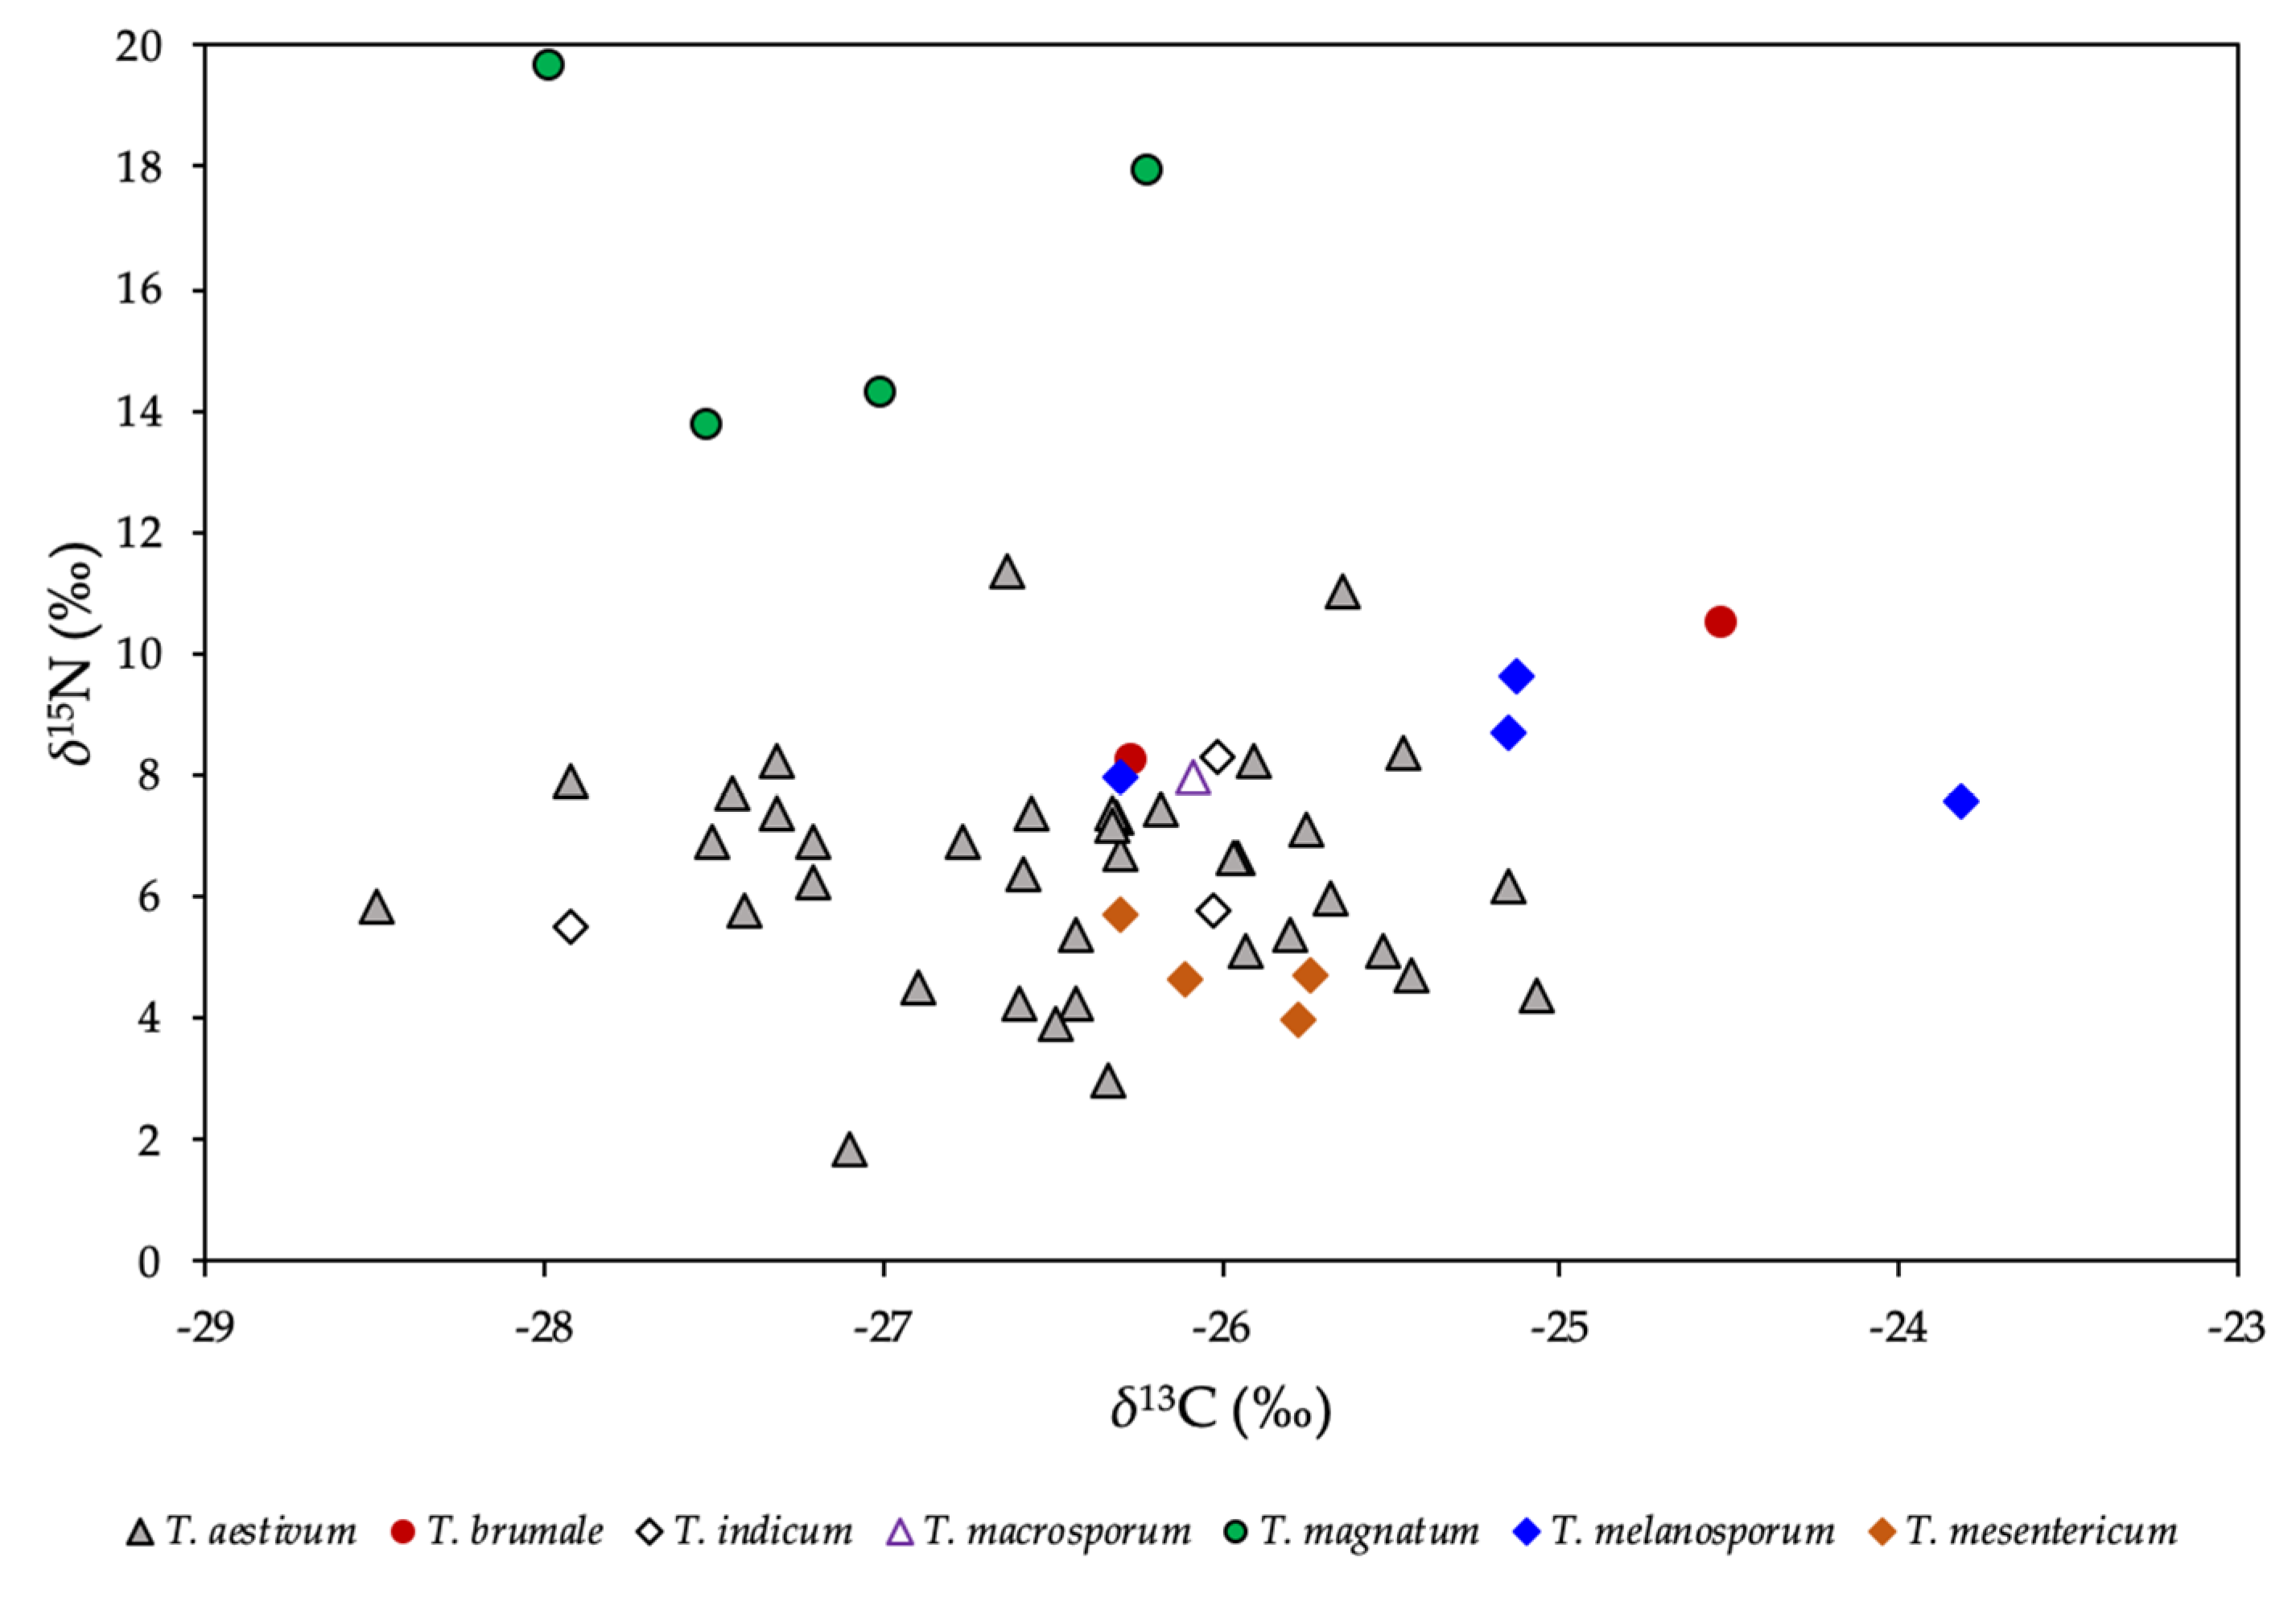
2.2. Stable Isotope Ratios of Light Elements
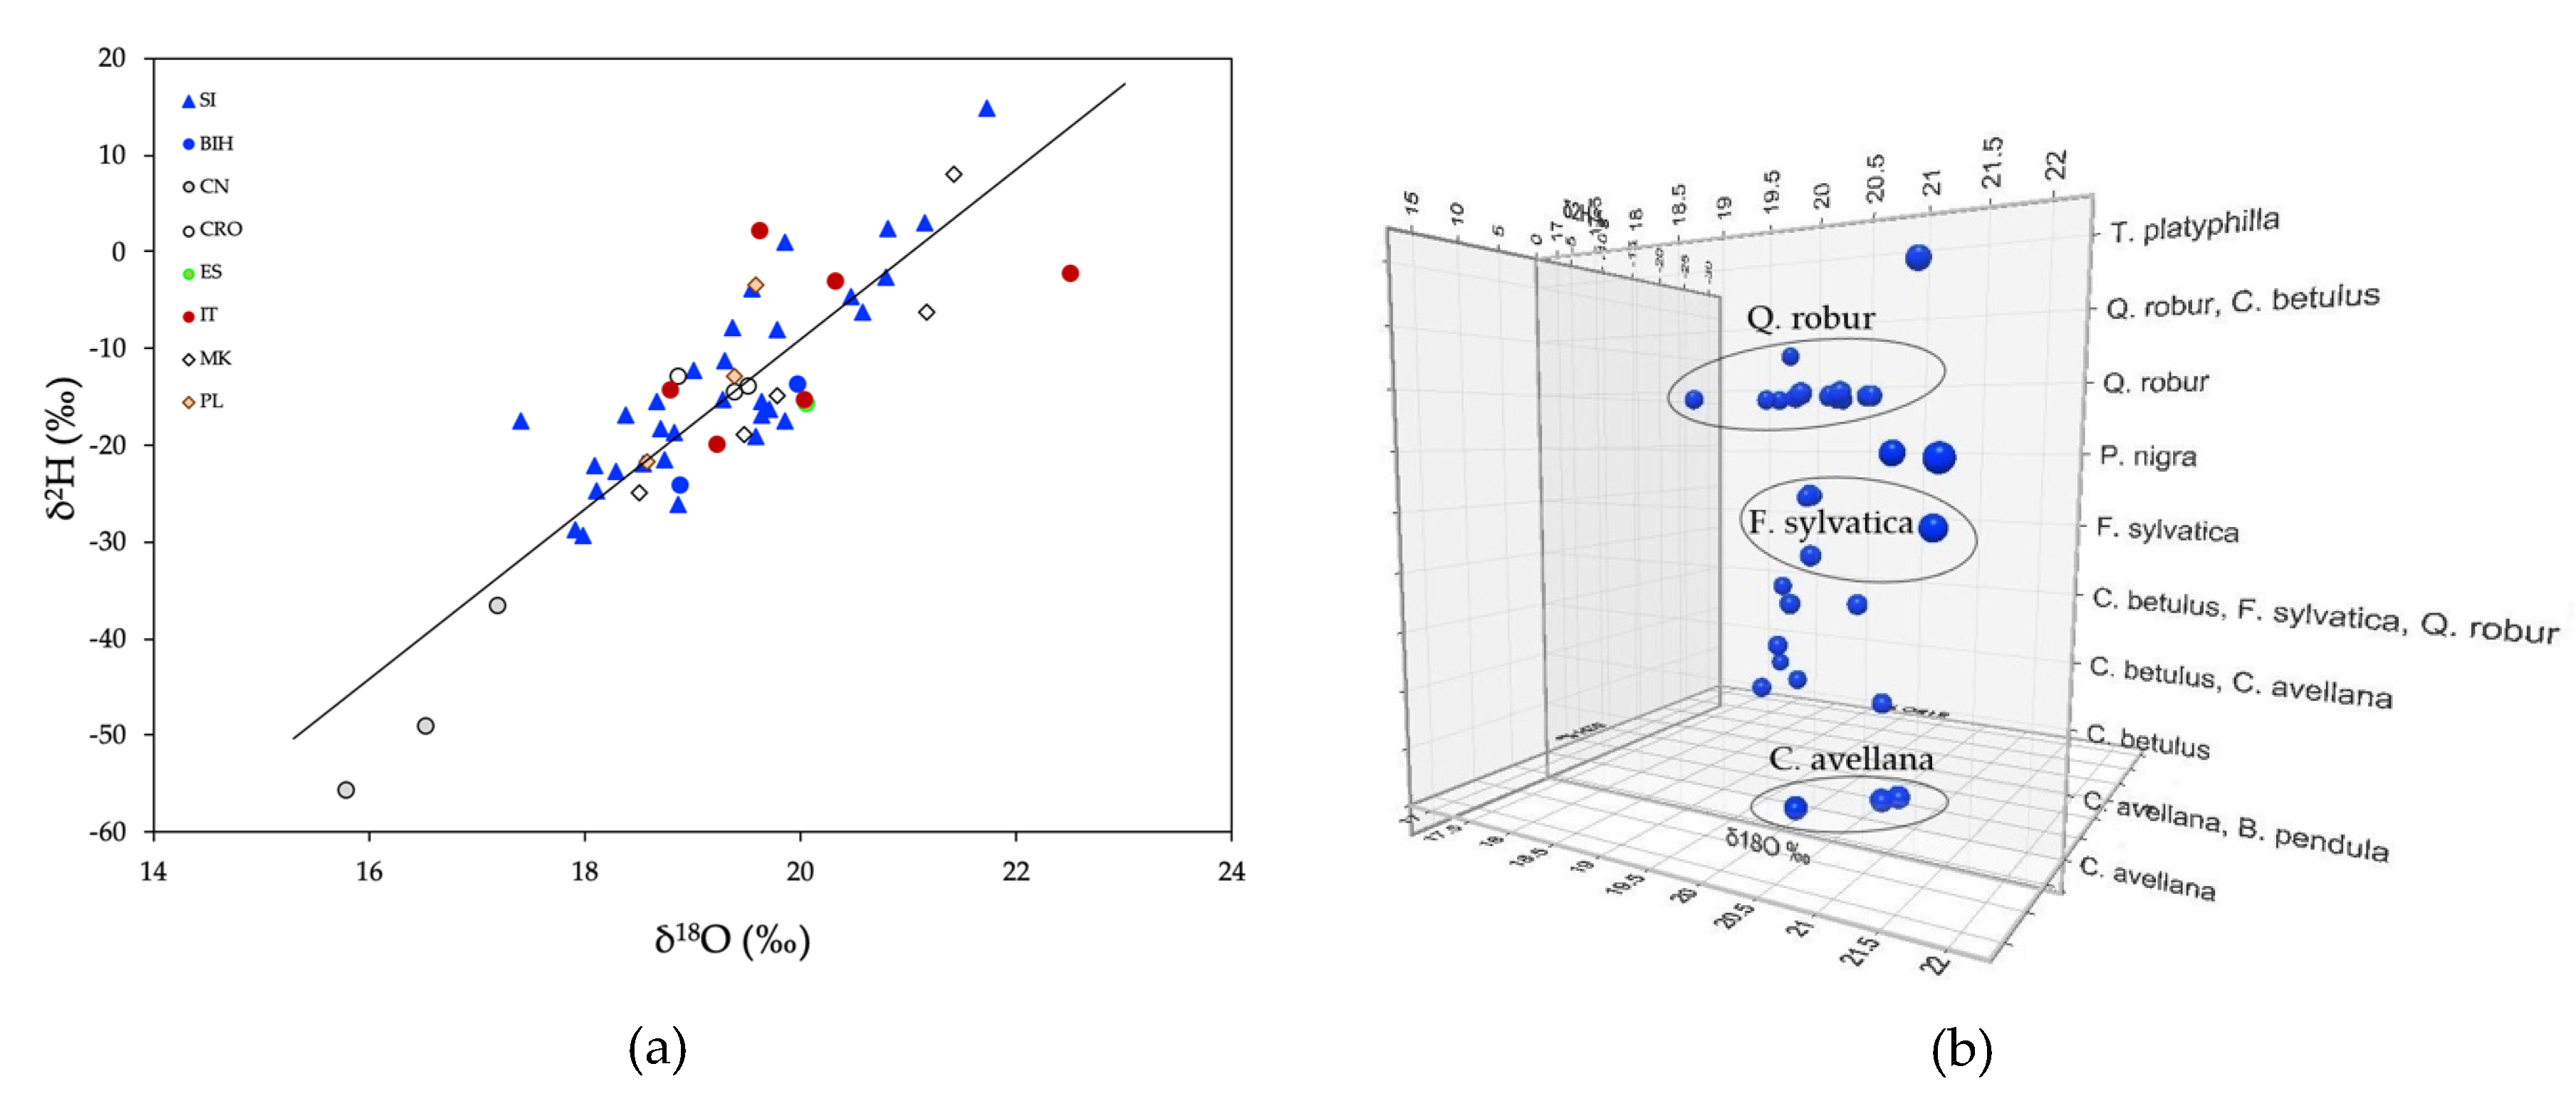
2.3. Strontium Stable Isotope Ratios
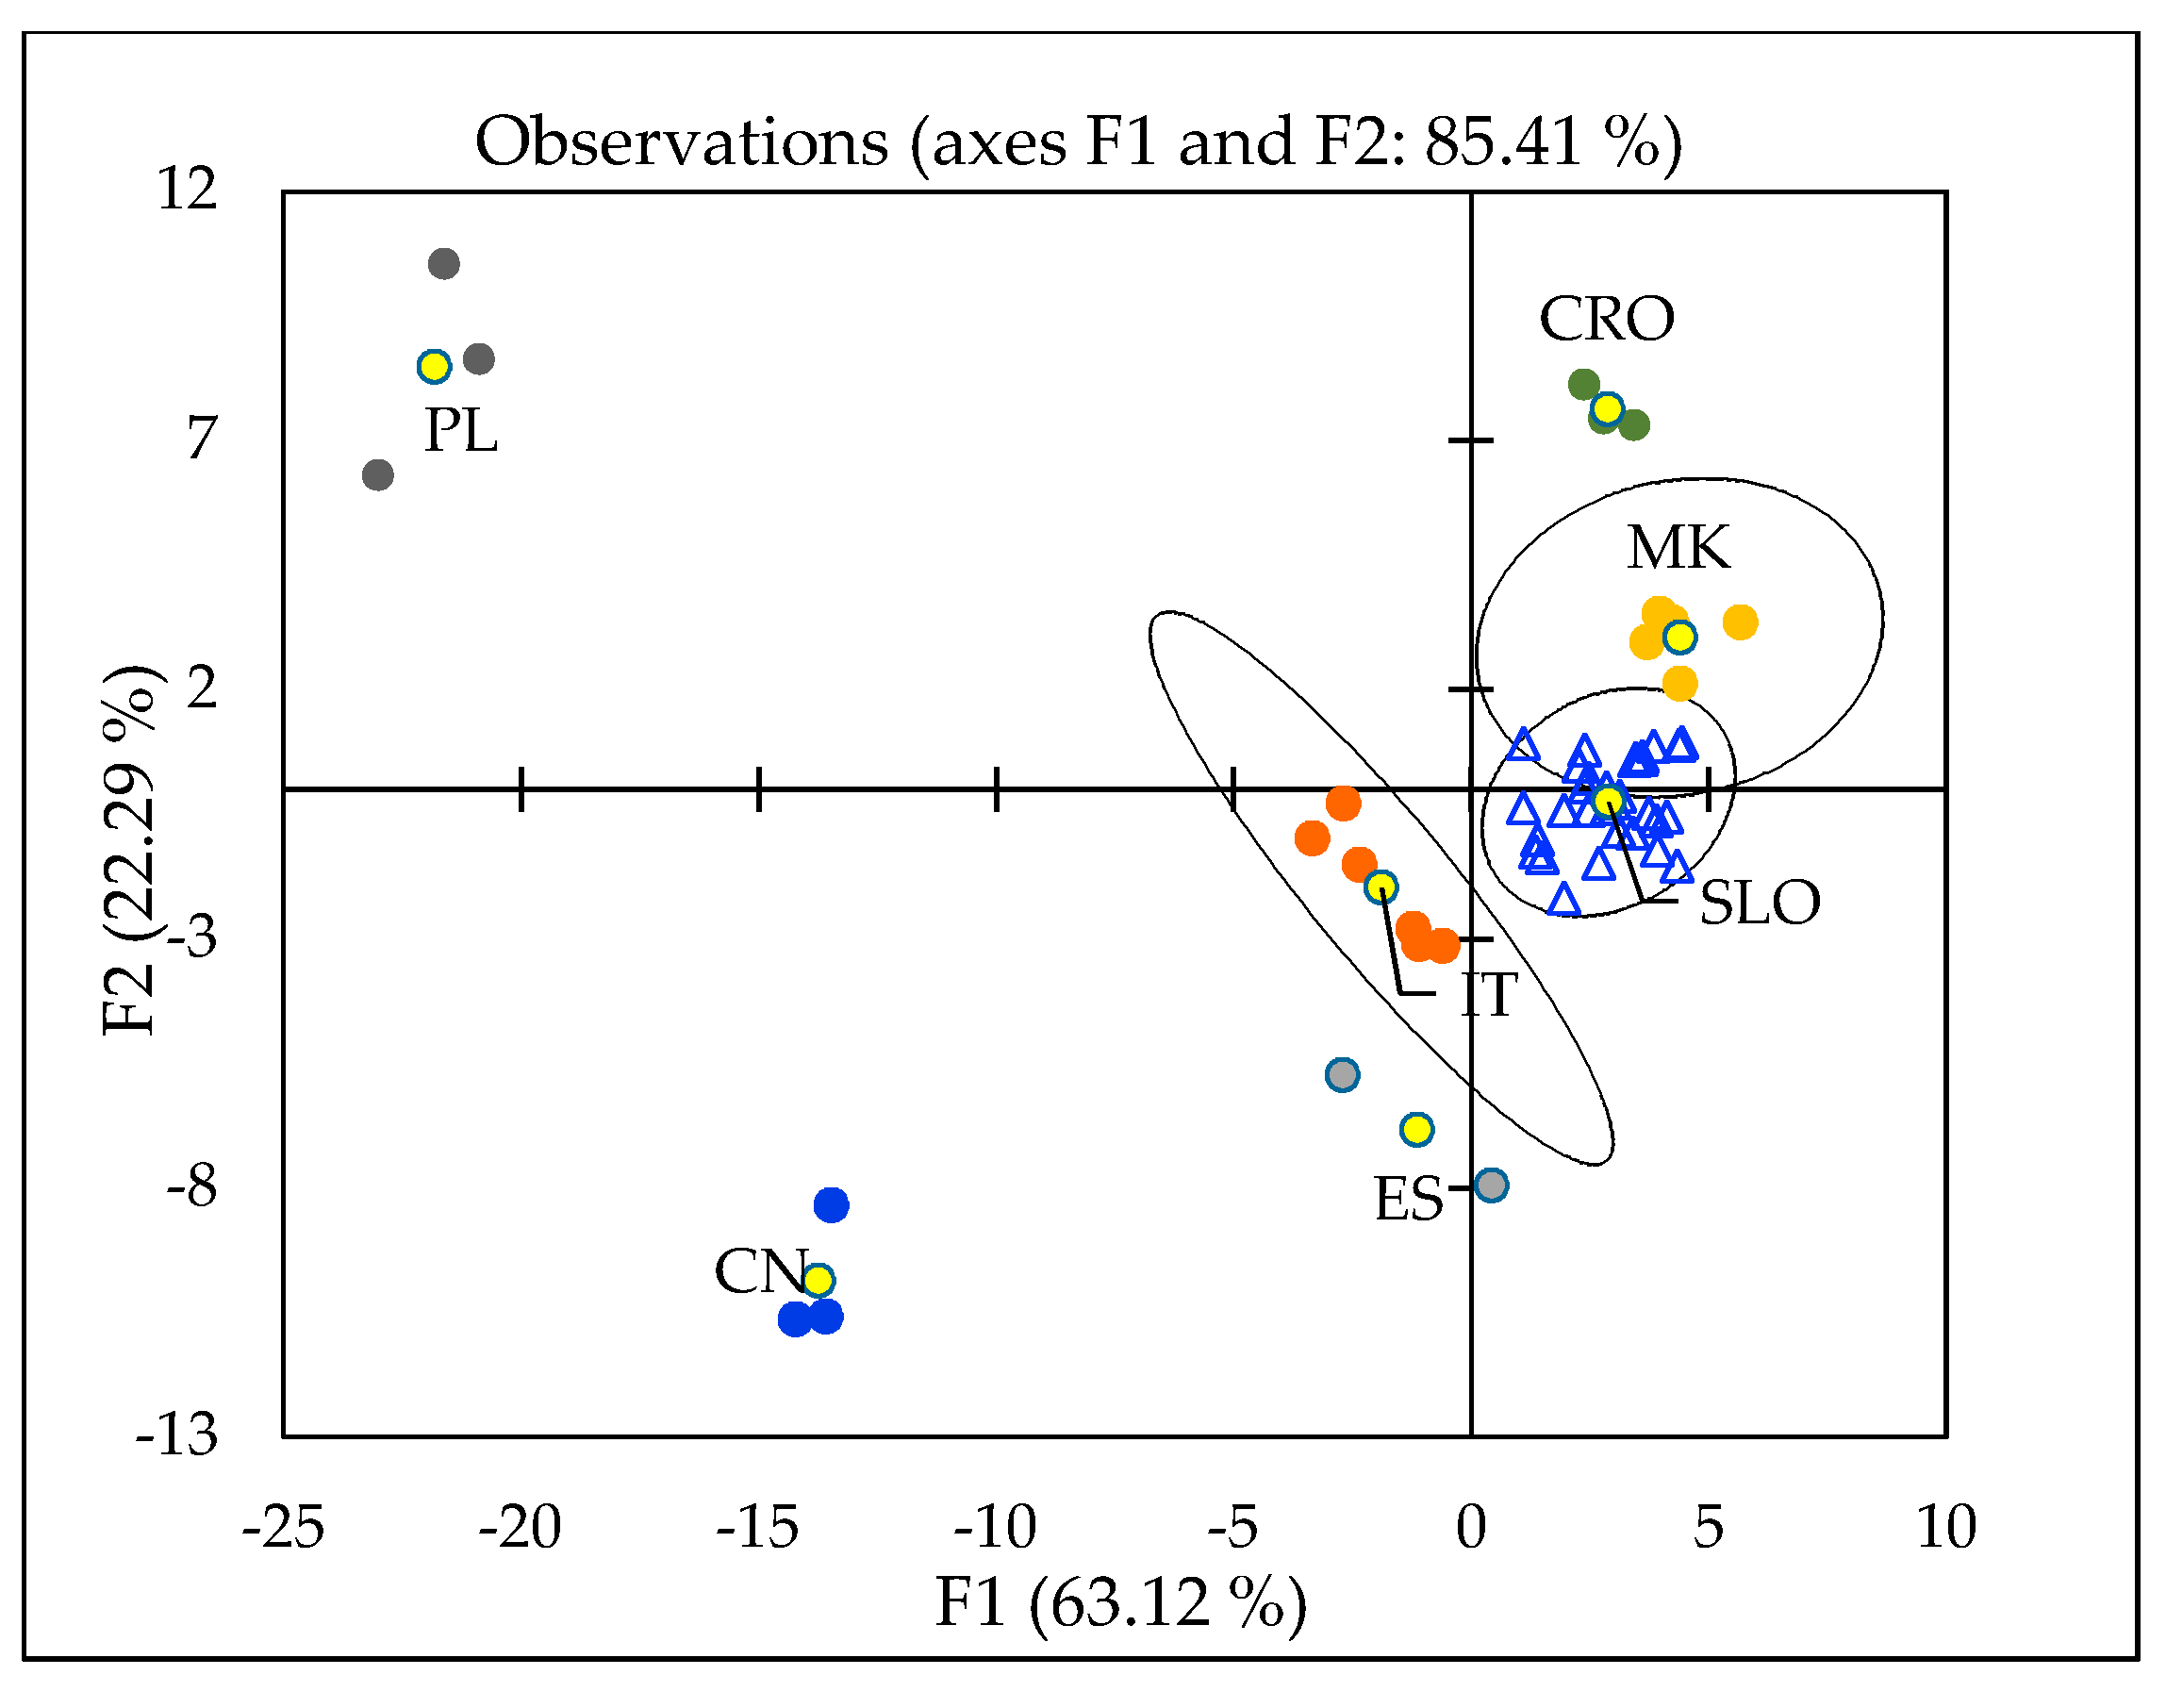
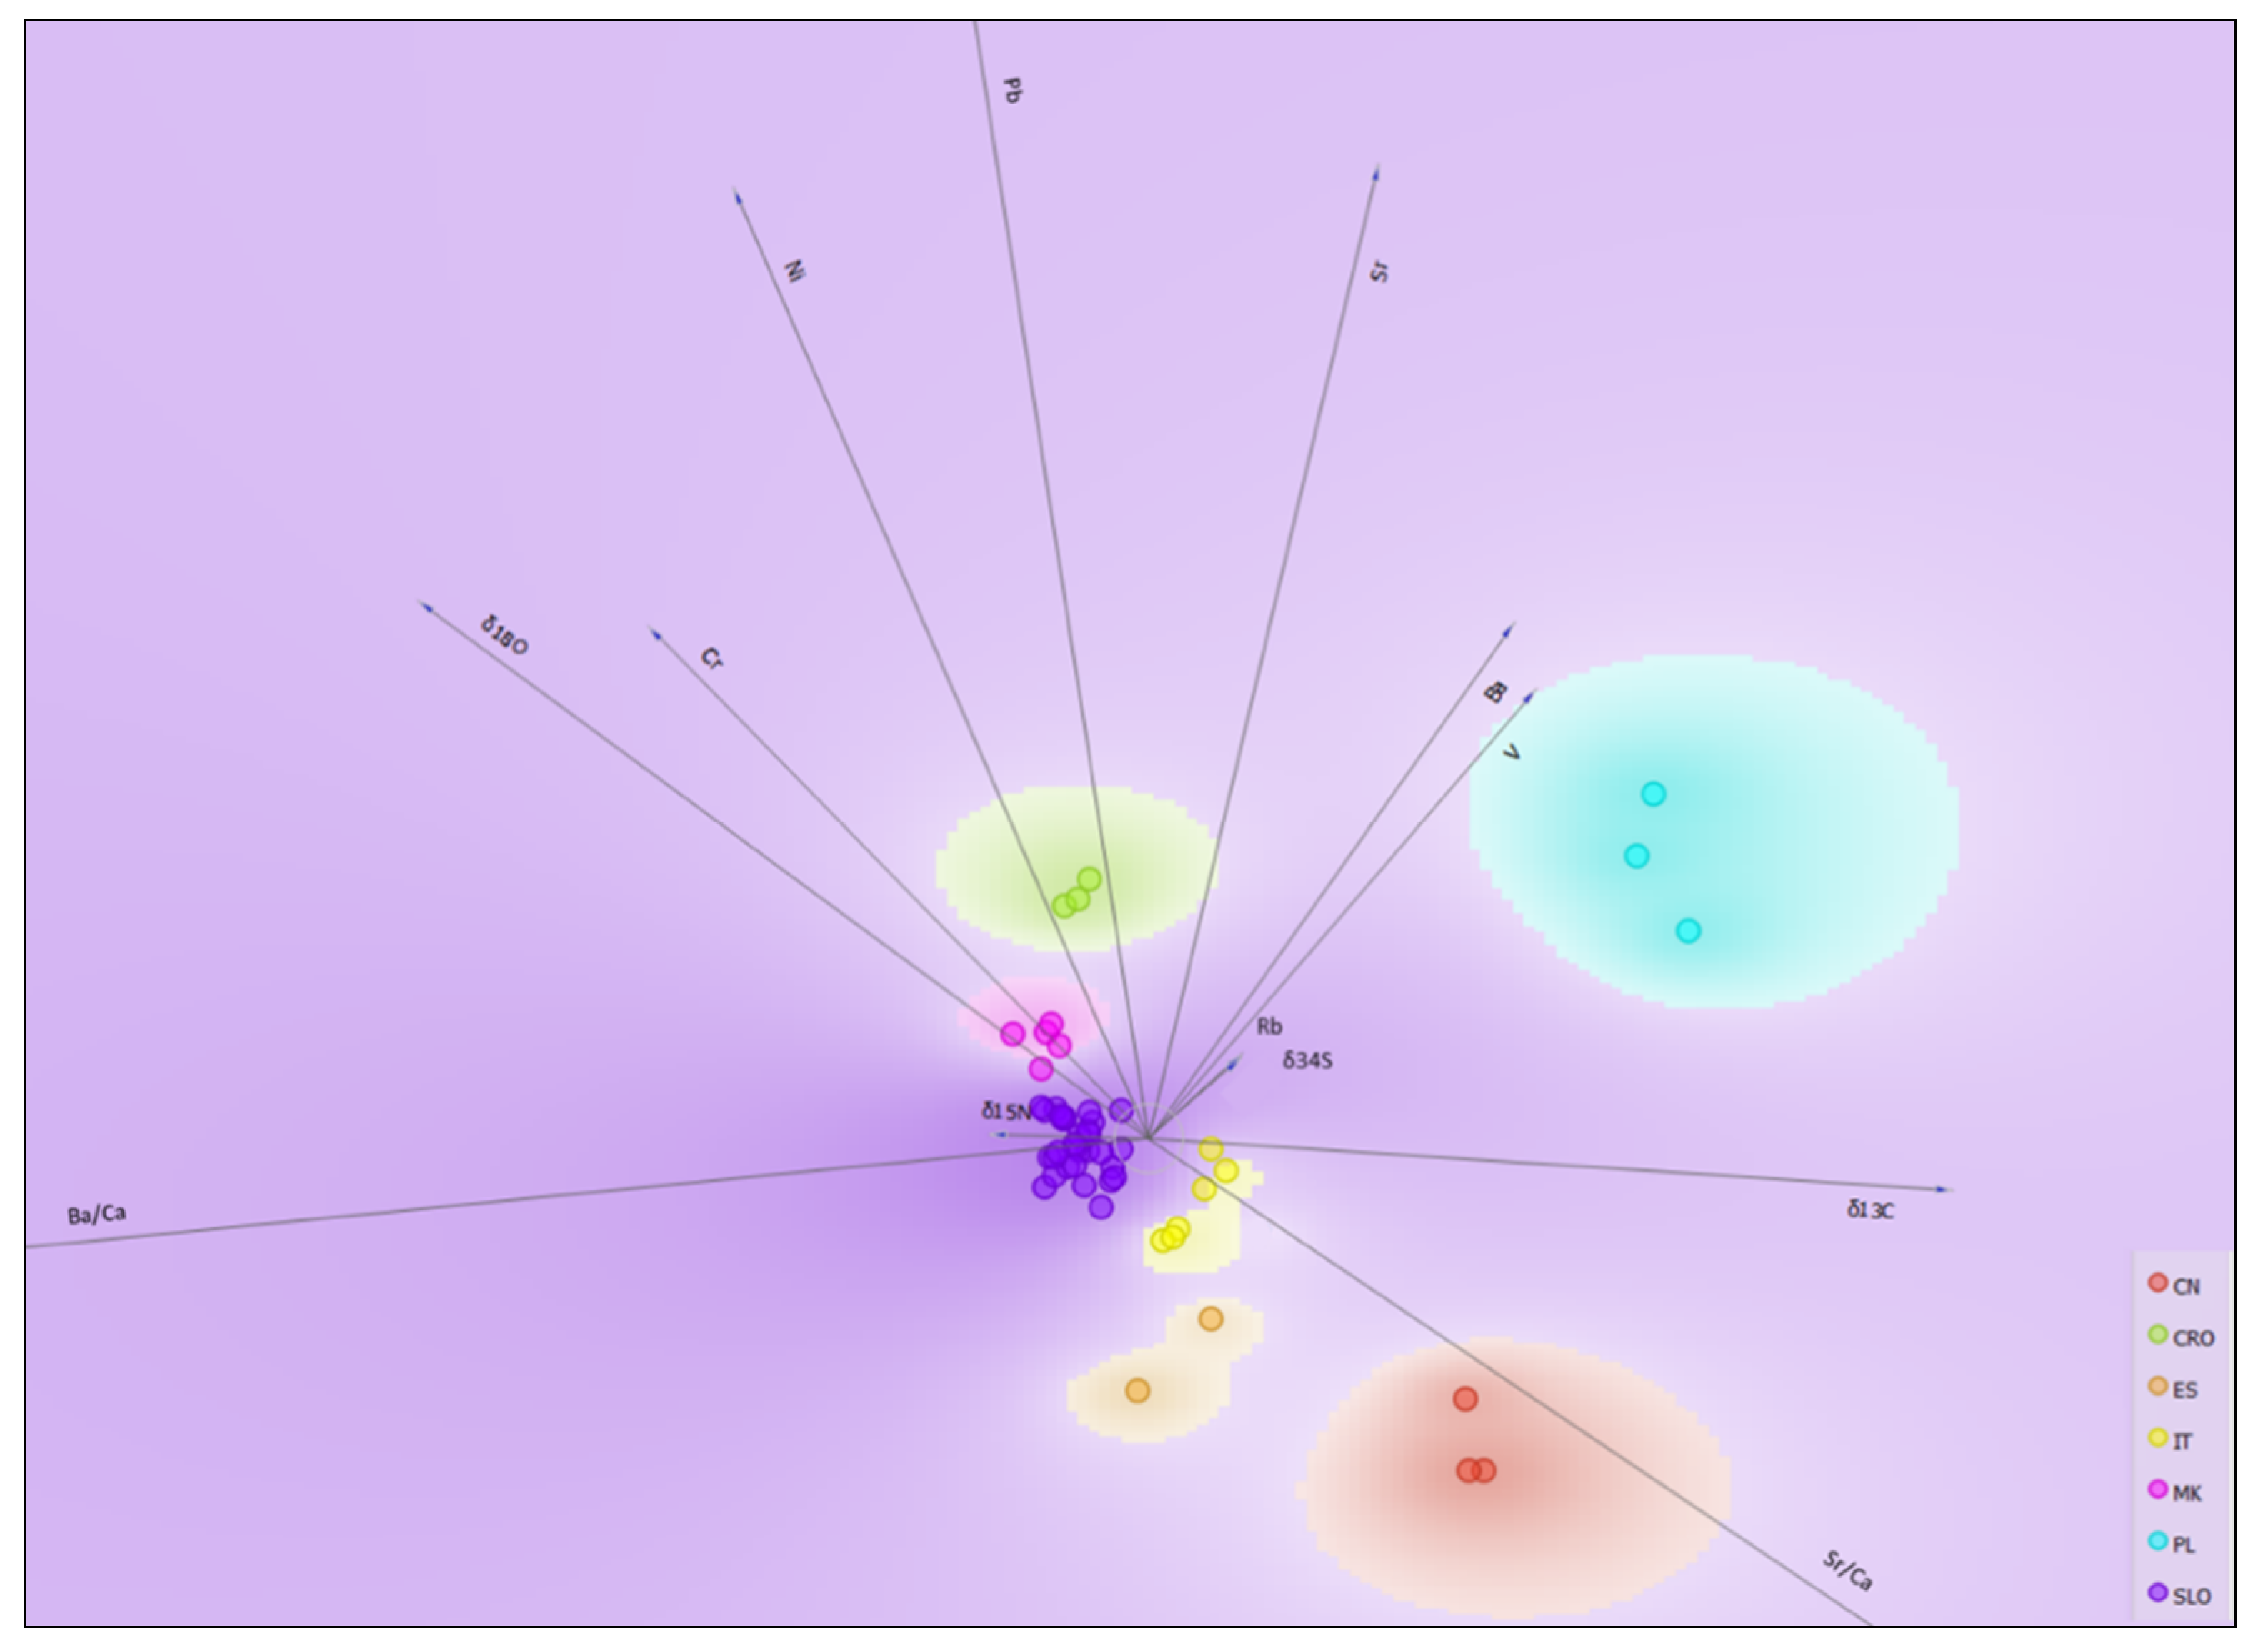
2.4. Geographical Discrimination of Truffle Samples
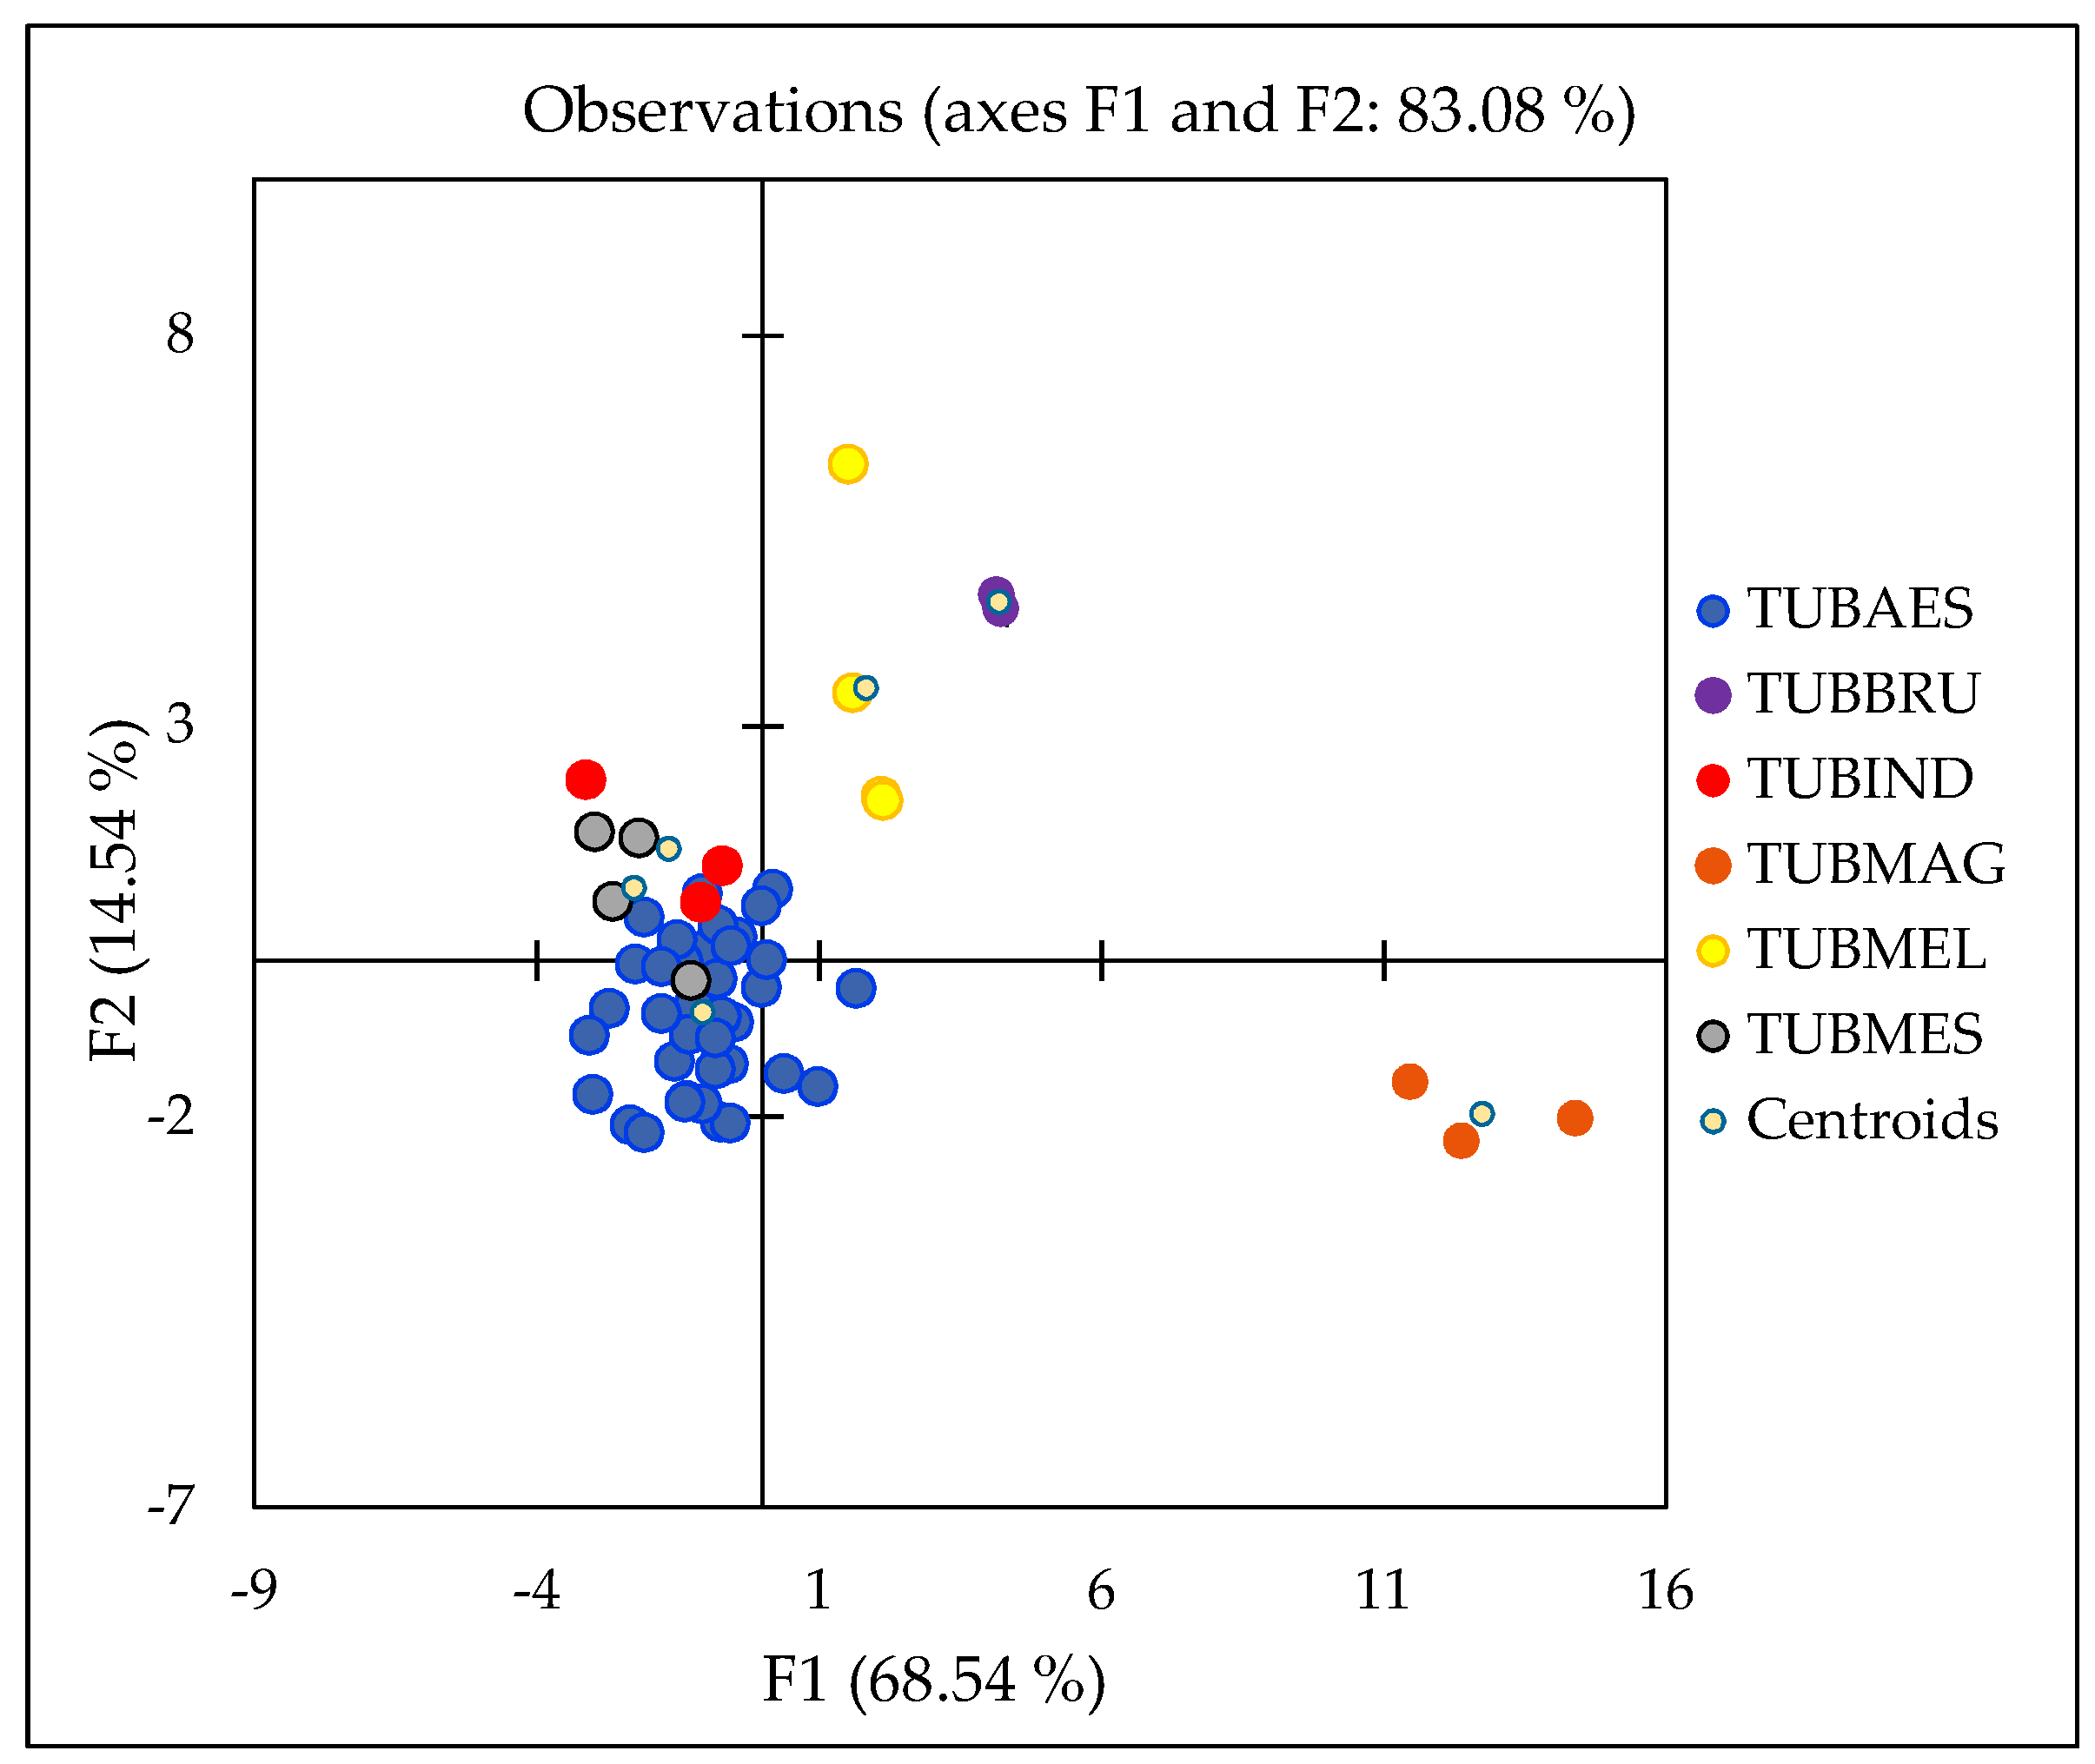
2.5. Species Discrimination of Truffle Samples
3. Materials and Methods
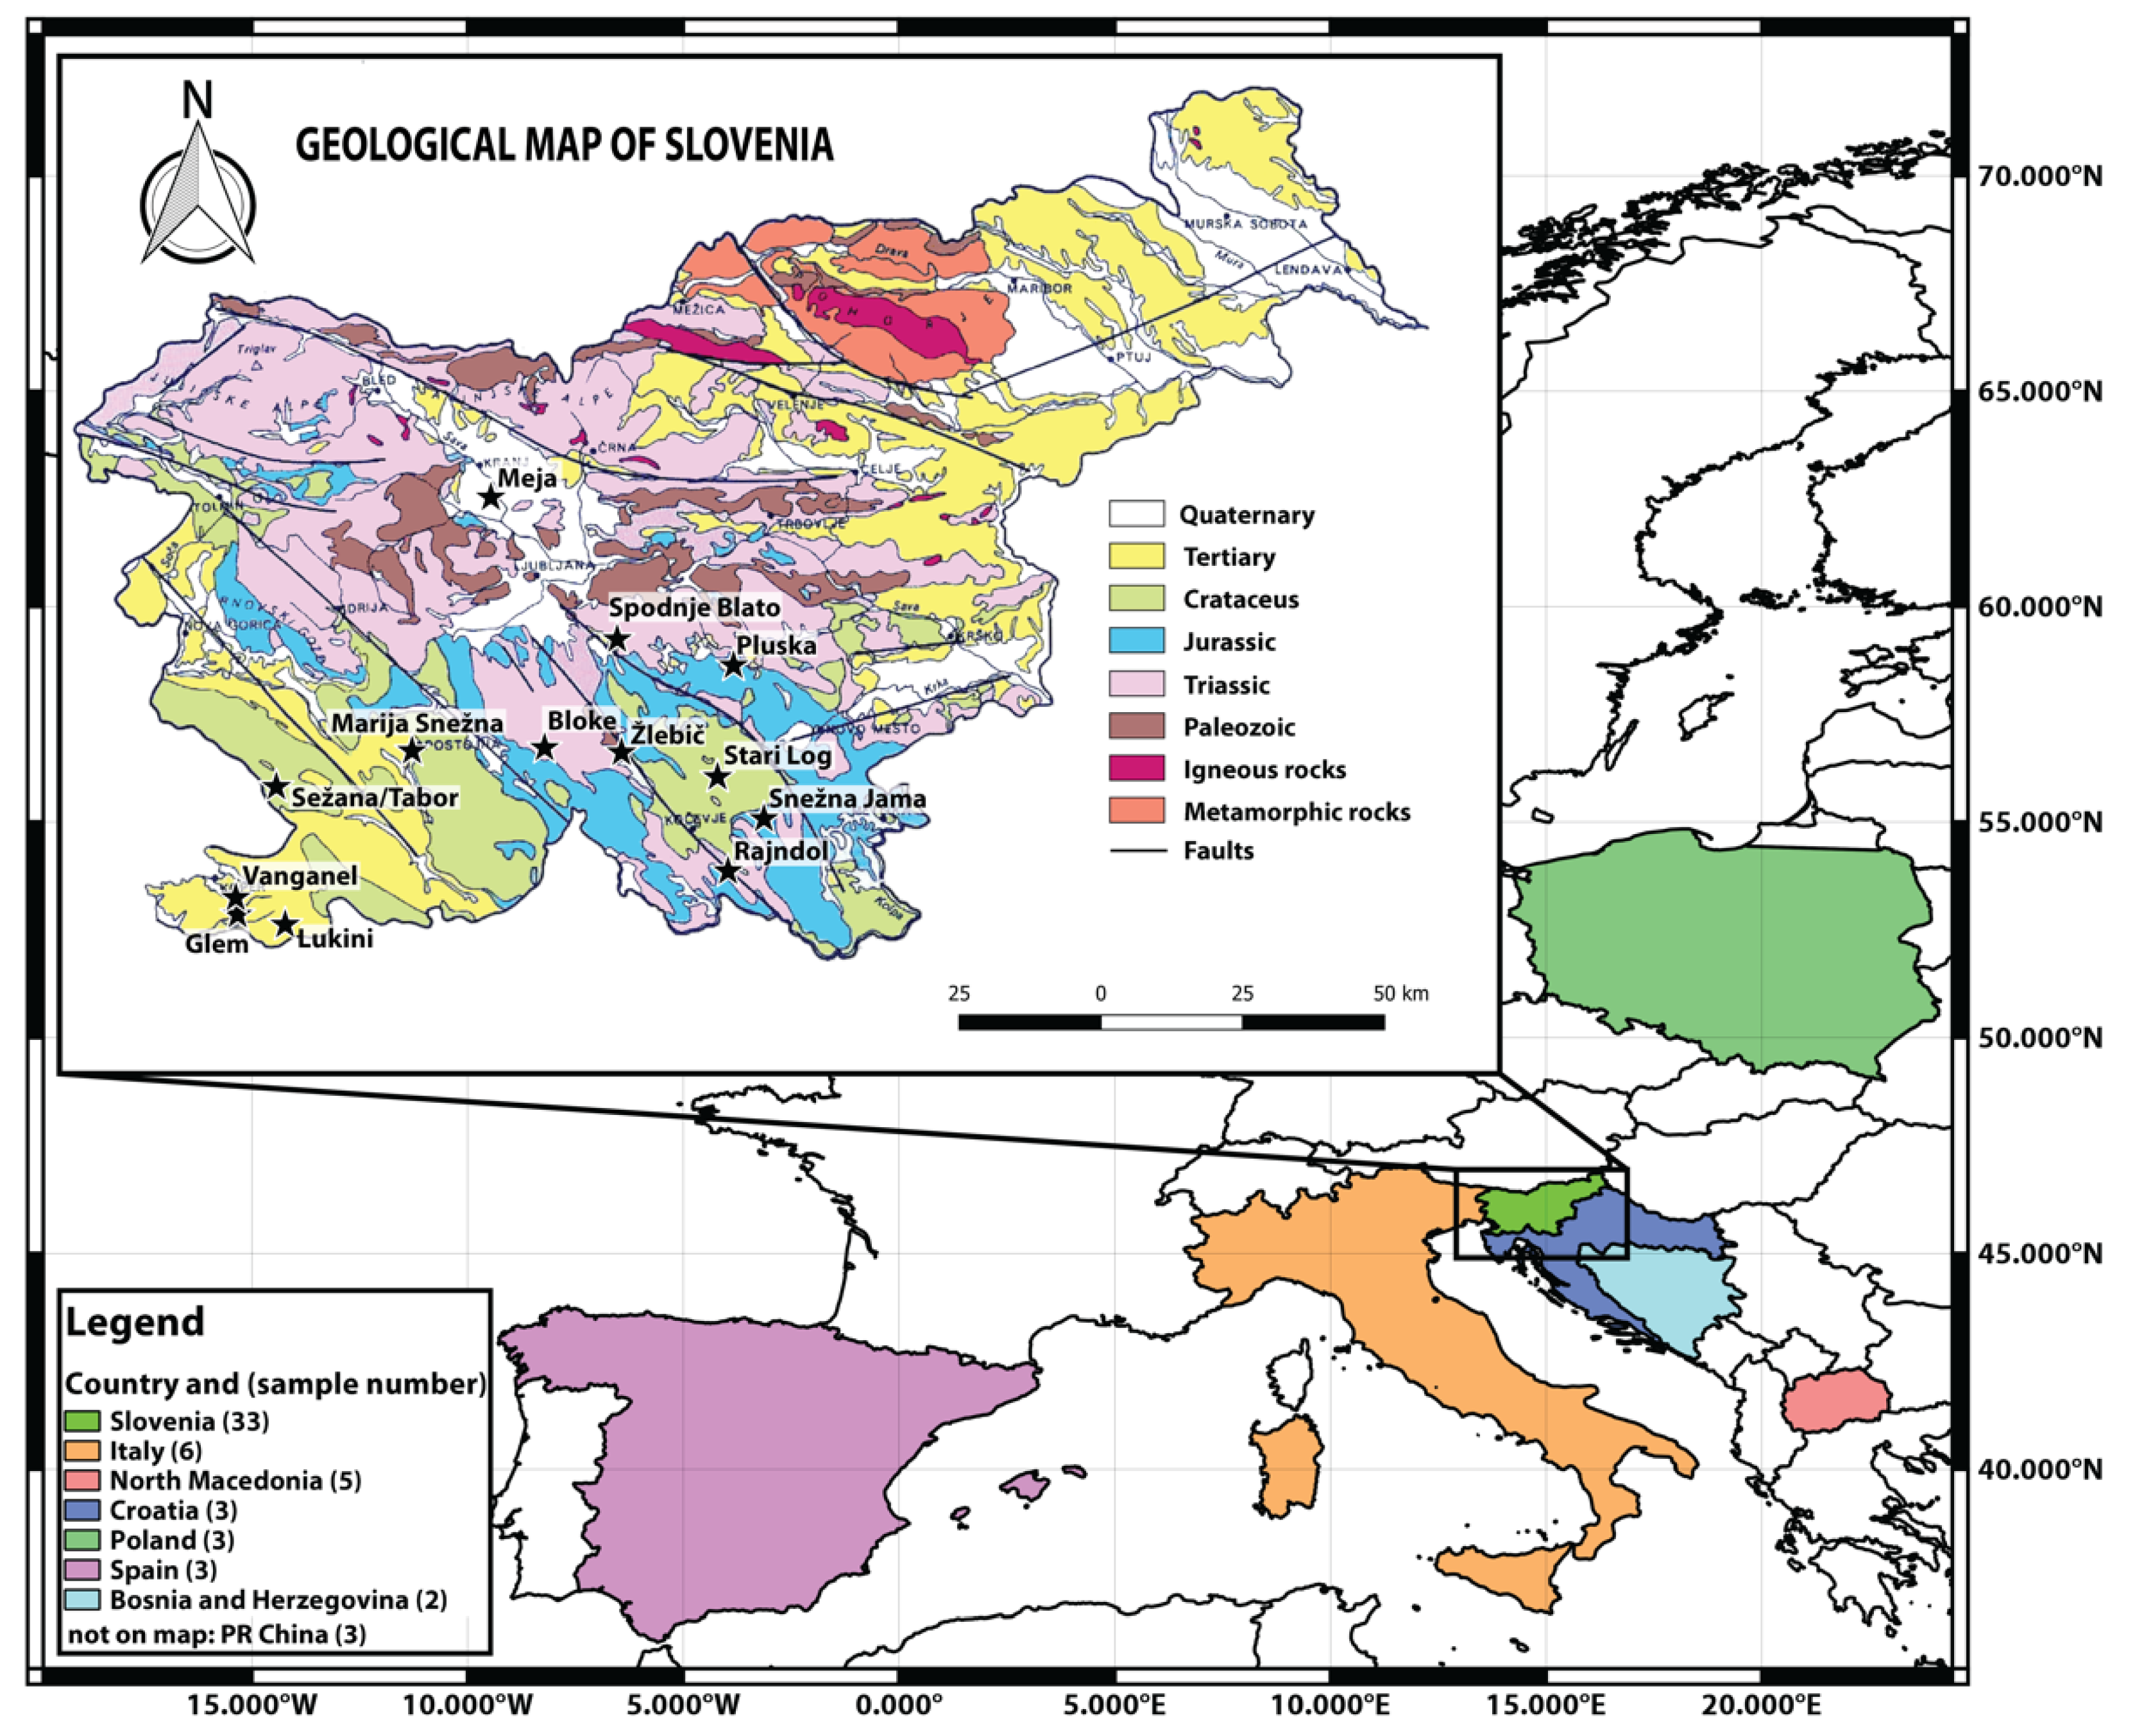
3.1. Sample Collection
3.2. Reagents, Standards, Calibration Solutions and Samples
3.3. Sample Pretreatment Method
3.4. Analytical Procedure and Instrumentation
3.4.1. Inductively Coupled Plasma-Mass Spectrometry (ICP-MS)
3.4.2. Quantitative-XRF Analysis
3.5. Stable Isotope Ratio Analysis of Light Elements
3.6. Stable Isotope Ratio Analysis of Heavy Elements
3.7. Statistical Analysis
4. Conclusions
Supplementary Materials
Author Contributions
Funding
Acknowledgments
Conflicts of Interest
References
- Fischer, C.; Oliach, D.; Held, A.; Bonet, J.A.; Colinas, C. Best Practices for Cultivation of Truffles; Forest Sciences Centre of Catalonia: Solsona, Spain; Yaşama Dair Vakıf: Antalaya, Turkey, 2017; p. 68. ISBN 978-84-697-8163-0. [Google Scholar]
- Chevalier, G. Europe, a continent with high potential for the cultivation of the Burgundy truffle (Tuber aestivum/uncinatum). Acta Mycol. 2013, 47, 127–132. [Google Scholar] [CrossRef][Green Version]
- Vrščaj, B.; Repe, B.; Simončič, P. The Soils of Slovenia; Springer: Dordrecht, The Netherlands, 2017. [Google Scholar]
- Piltaver, A.; Ratoša, I. Prispevek k poznavanju podzemnih gliv v Sloveniji. Gozdarski Vestnik 2006, 64, 301–329. [Google Scholar]
- Amicucci, A.; Guidi, C.; Zambonelli, A.; Potenza, L.; Stocchi, V. Molecular approaches for the detection of truffle species in processed food products. J. Sci. Food Agric. 2002, 82, 1391–1397. [Google Scholar] [CrossRef]
- Montero, L.G.G.; Casermeiro, M.A.; Hernando, J.; Hernando, I. Soil factors that influence the fruiting of Tuber melanosporum (black truffle). Soil Res. 2006, 44, 731–738. [Google Scholar] [CrossRef]
- Jaillard, B.; Barry-Etienne, D.; Colinas, C.; De Miguel, A.M.; Genola, L.; Libre, A.; Neveu, P.; Oliach, D.; Saenz, W.; Saez, M.; et al. Alkalinity and structure of soils determine the truffle production in the Pyrenean Regions. For. Syst. 2014, 23, 364. [Google Scholar] [CrossRef]
- Gryndler, M.; Šmilauer, P.; Šťovíček, V.; Nováková, K.; Hršelová, H.; Jansa, J. Truffle biogeography-A case study revealing ecological niche separation of differentTuberspecies. Ecol. Evol. 2017, 7, 4275–4288. [Google Scholar] [CrossRef]
- Séjalon-Delmas, N.; Roux, C.; Martins, M.; Kulifaj, M.; Bécard, G.; Dargent, R. Molecular Tools for the Identification ofTubermelanosporumin Agroindustry. J. Agric. Food Chem. 2000, 48, 2608–2613. [Google Scholar] [CrossRef]
- Bonito, G.M.; Gryganskyi, A.P.; Trappe, J.M.; Vilgalys, R. A global meta-analysis of Tuber ITS rDNA sequences: Species diversity, host associations and long-distance dispersal. Mol. Ecol. 2010, 19, 4994–5008. [Google Scholar] [CrossRef]
- Vita, F.; Giuntoli, B.; Bertolini, E.; Taiti, C.; Marone, E.; D’Ambrosio, C.; Trovato, E.; Sciarrone, D.; Zoccali, M.; Balestrini, R.; et al. Tuberomics: A molecular profiling for the adaption of edible fungi (Tuber magnatum Pico) to different natural environments. BMC Genom. 2020, 21, 90. [Google Scholar] [CrossRef]
- Culleré, L.; Ferreira, V.; Venturini, M.E.; Marco, P.; Blanco, D.; Crespo, M.E.V. Potential aromatic compounds as markers to differentiate between Tuber melanosporum and Tuber indicum truffles. Food Chem. 2013, 141, 105–110. [Google Scholar] [CrossRef]
- Splivallo, R.; Deveau, A.; Valdez, N.; Kirchhoff, N.; Frey-Klett, P.; Karlovsky, P. Bacteria associated with truffle-fruiting bodies contribute to truffle aroma: Bacteria produce truffle volatiles. Environ. Microbiol. 2015, 17, 2647–2660. [Google Scholar] [CrossRef] [PubMed]
- Vita, F.; Taiti, C.; Pompeiano, A.; Bazihizina, N.; Lucarotti, V.; Mancuso, S.; Alpi, A.; Federico, V.; Cosimo, T.; Antonio, P.; et al. Volatile organic compounds in truffle (Tuber magnatum Pico): Comparison of samples from different regions of Italy and from different seasons. Sci. Rep. 2015, 5, 12629. [Google Scholar] [CrossRef] [PubMed]
- Sciarrone, D.; Schepis, A.; Zoccali, M.; Donato, P.; Vita, F.; Creti, D.; Alpi, A.; Mondello, L. Multidimensional Gas Chromatography Coupled to Combustion-Isotope Ratio Mass Spectrometry/Quadrupole MS with a Low-Bleed Ionic Liquid Secondary Column for the Authentication of Truffles and Products Containing Truffle. Anal. Chem. 2018, 90, 6610–6617. [Google Scholar] [CrossRef] [PubMed]
- Drivelos, S.A.; Georgiou, C. Multi-element and multi-isotope-ratio analysis to determine the geographical origin of foods in the European Union. TrAC Trends Anal. Chem. 2012, 40, 38–51. [Google Scholar] [CrossRef]
- Krajnc, B.; Bontempo, L.; Araus, J.L.; Giovanetti, M.; Alegria, C.; Lauteri, M.; Augusti, A.; Atti, N.; Smeti, S.; Taous, F.; et al. Selective Methods to Investigate Authenticity and Geographical Origin of Mediterranean Food Products. Food Rev. Int. 2020. [Google Scholar] [CrossRef]
- Henn, M.R.; Chapela, I.H. Differential C Isotope Discrimination by Fungi during Decomposition of C3- and C4-Derived Sucrose. Appl. Environ. Microbiol. 2000, 66, 4180–4186. [Google Scholar] [CrossRef]
- Tedersoo, L.; Bahram, M. Mycorrhizal types differ in ecophysiology and alter plant nutrition and soil processes. Biol. Rev. 2019, 94, 1857–1880. [Google Scholar] [CrossRef]
- Hobbie, E.A.; Weber, N.S.; Trappe, J.M. Mycorrhizal vs saprotrophic status of fungi: The isotopic evidence. New Phytol. 2001, 150, 601–610. [Google Scholar] [CrossRef]
- Courty, P.-E.; Doubková, P.; Calabrese, S.; Niemann, H.; Lehmann, M.F.; Vosátka, M.; Selosse, M.-A. Species-dependent partitioning of C and N stable isotopes between arbuscular mycorrhizal fungi and their C3 and C4 hosts. Soil Biol. Biochem. 2015, 82, 52–61. [Google Scholar] [CrossRef]
- Hobbie, E.A.; Högberg, P. Nitrogen isotopes link mycorrhizal fungi and plants to nitrogen dynamics. New Phytol. 2012, 196, 367–382. [Google Scholar] [CrossRef]
- Moore, J.A.M.; DeAngelis, D.; Post, W.M.; Classen, A.T. Decomposition by ectomycorrhizal fungi alters soil carbon storage in a simulation model. Ecosphere 2015, 6, 29. [Google Scholar] [CrossRef]
- Zeller, B.; Bréchet, C.; Maurice, J.-P.; Le Tacon, F. δ13C and δ15N isotopic fractionation in trees, soils and fungi in a natural forest stand and a Norway spruce plantation. Ann. For. Sci. 2007, 64, 419–429. [Google Scholar] [CrossRef]
- Chung, I.-M.; Han, J.-G.; Kong, W.-S.; Kim, J.K.; An, M.-J.; Lee, J.-H.; An, Y.-J.; Kim, J.K.; Kim, S.-H. Regional discrimination of Agaricus bisporus mushroom using the natural stable isotope ratios. Food Chem. 2018, 264, 92–100. [Google Scholar] [CrossRef] [PubMed]
- Puscas, R.H.; Cristea, G.; Radu, S. Stable Isotope Determination in Edible Mushrooms from the Spontaneous Flora of Transylvania. Anal. Lett. 2019, 52, 102–110. [Google Scholar] [CrossRef]
- Ariyama, K.; Shinozaki, M.; Kawasaki, A. Determination of the Geographic Origin of Rice by Chemometrics with Strontium and Lead Isotope Ratios and Multielement Concentrations. J. Agric. Food Chem. 2012, 60, 1628–1634. [Google Scholar] [CrossRef]
- Swoboda, S.; Brunner, M.; Boulyga, S.F.; Galler, P.; Horacek, M.; Prohaska, T. Identification of Marchfeld asparagus using Sr isotope ratio measurements by MC-ICP-MS. Anal. Bioanal. Chem. 2008, 390, 487–494. [Google Scholar] [CrossRef]
- Trincherini, P.; Baffi, C.; Barbero, P.; Pizzoglio, E.; Spalla, S. Precise determination of strontium isotope ratios by TIMS to authenticate tomato geographical origin. Food Chem. 2014, 145, 349–355. [Google Scholar] [CrossRef]
- Hiraoka, H.; Morita, S.; Izawa, A.; Aoyama, K.; Shin, K.-C.; Nakano, T. Tracing the Geographical Origin of Onions by Strontium Isotope Ratio and Strontium Content. Anal. Sci. 2016, 32, 781–788. [Google Scholar] [CrossRef]
- Aoyama, K.; Nakano, T.; Shin, K.-C.; Izawa, A.; Morita, S. Variation of strontium stable isotope ratios and origins of strontium in Japanese vegetables and comparison with Chinese vegetables. Food Chem. 2017, 237, 1186–1195. [Google Scholar] [CrossRef]
- Rodushkin, I.; Pallavicini, N.; Engström, E.; Sörlin, D.; Öhlander, B.; Ingri, J.; Baxter, D.C. Assessment of the natural variability of B, Cd, Cu, Fe, Pb, Sr, Tl and Zn concentrations and isotopic compositions in leaves, needles and mushrooms using single sample digestion and two-column matrix separation. J. Anal. At. Spectrom. 2016, 31, 220–233. [Google Scholar] [CrossRef]
- Liu, H.; Wei, Y.; Lu, H.; Wei, S.; Jiang, T.; Zhang, Y.; Ban, J.; Guo, B. The determination and application of 87 Sr/ 86 Sr ratio in verifying geographical origin of wheat: Sr isotopic ratio ( 87 Sr/ 86 Sr) analysis of wheat. J. Mass Spectrom. 2017, 52, 248–253. [Google Scholar] [CrossRef] [PubMed]
- Popović-Djordjević, J.; Marjanović Žaklina, S.; Gršić, N.; Adžić, T.; Popović, B.; Bogosavljević, J.; Brčeski, I. Essential Elements as a Distinguishing Factor between Mycorrhizal Potentials of Two Cohabiting Truffle Species in Riparian Forest Habitat in Serbia. Chem. Biodivers. 2019, 16, e1800693. [Google Scholar] [CrossRef] [PubMed]
- Segneanu, A.-E.; Sfirloaga, P.; David, I.; Balcu, I.; Grozescu, I. Characterisation of truffles using electrochemical and analytical methods. Digest J. Nanomater. Biostruct. 2012, 7, 199–205. [Google Scholar]
- Zambonelli, A.; Iotti, M.; Murat, C. True Truffle (Tuber SPP.) in the World: Soil Ecology, Systematics and Biochemistry; Ajit Varma: New York, NY, USA; Springer: Berlin/Heidelberg, Germany, 2016. [Google Scholar]
- Wallander, H.; Johansson, L.; Pallon, J. PIXE analysis to estimate the elemental composition of ectomycorrhizal rhizomorphs grown in contact with different minerals in forest soil. FEMS Microbiol. Ecol. 2002, 39, 147–156. [Google Scholar] [CrossRef] [PubMed][Green Version]
- Rudawska, M.; Leski, T. Trace elements in fruiting bodies of ectomycorrhizal fungi growing in Scots pine (Pinus sylvestris L.) stands in Poland. Sci. Total Environ. 2005, 339, 103–115. [Google Scholar] [CrossRef]
- Vetter, J. Mineral composition of basidiomes of Amanita species. Mycol. Res. 2005, 109, 746–750. [Google Scholar] [CrossRef]
- Falandysz, J.; Mędyk, M.; Treu, R. Bio-concentration potential and associations of heavy metals in Amanita muscaria (L.) Lam. from northern regions of Poland. Environ. Sci. Pollut. Res. 2018, 25, 25190–25206. [Google Scholar] [CrossRef]
- Ambrosio, E.; Marescotti, P.; Benucci, G.M.N.; Cecchi, G.; Brancucci, M.; Zotti, M.; Mariotti, M.G. Can the soil geology and chemistry analysis of a site predict the geographic origin of wild edible mushrooms (Porcini group)? Acta Mycol. 2019, 54. [Google Scholar] [CrossRef]
- Colpaert, J.V.; Van Assche, J.A. Zinc toxicity in ectomycorrhizal Pinus sylvestris. Plant Soil 1992, 143, 201–211. [Google Scholar] [CrossRef]
- Howe, R.; Evans, R.L.; Ketteridge, S.W. Copper-binding proteins in ectomycorrhizal fungi. New Phytol. 1997, 135, 123–131. [Google Scholar] [CrossRef]
- Blaudez, D.; Jacob, C.; Turnau, K.; Colpaert, J.V.; Ahonen-Jonnarth, U.; Finlay, R.D.; Botton, B.; Chalot, M. Differential responses of ectomycorrhizal fungi to heavy metals in vitro. Mycol. Res. 2000, 104, 1366–1371. [Google Scholar] [CrossRef]
- Colpaert, J.V.; Vandenkoornhuyse, P.; Adriaensen, K.; Vangronsveld, J. Genetic variation and heavy metal tolerance in the ectomycorrhizal basidiomycete Suillus luteus: RESEARCH Heavy metal tolerance in Suillus luteus. New Phytol. 2000, 147, 367–379. [Google Scholar] [CrossRef]
- Krupa, P.; Kozdrój, J. Accumulation of Heavy Metals by Ectomycorrhizal Fungi Colonizing Birch Trees Growing in an Industrial Desert Soil. World J. Microbiol. Biotechnol. 2004, 20, 427–430. [Google Scholar] [CrossRef]
- Širić, I.; Humar, M.; Kasap, A.; Kos, I.; Mioč, B.; Pohleven, F. Heavy metal bioaccumulation by wild edible saprophytic and ectomycorrhizal mushrooms. Environ. Sci. Pollut. Res. 2016, 23, 18239–18252. [Google Scholar] [CrossRef] [PubMed]
- Petkovšek, S.A.S.; Pokorny, B. Trace metal levels in edible mushrooms from the Šalek and the Upper Meža Valleys with emphasis on assessment of potential human health risk due to mushroom consumption. Zbornik Gozdarstva Lesarstva 2011, 94, 21–37. [Google Scholar]
- Kohzu, A.; Yoshioka, T.; Ando, T.; Takahashi, M.; Koba, K.; Wada, E. Natural 13C and 15N abundance of field-collected fungi and their ecological implications. New Phytol. 1999, 144, 323–330. [Google Scholar] [CrossRef]
- Hou, W.; Lian, B.; Dong, H.; Jiang, H.-C.; Wu, X. Distinguishing ectomycorrhizal and saprophytic fungi using carbon and nitrogen isotopic compositions. Geosci. Front. 2012, 3, 351–356. [Google Scholar] [CrossRef]
- Zeller, B.; Bréchet, C.; Maurice, J.-P.; Tacon, F. Saprotrophic versus symbiotic strategy during truffle ascocarp development under holm oak. A response based on 13C and 15N natural abundance. Ann. For. Sci. 2008, 65, 607. [Google Scholar] [CrossRef]
- Olivier, J.-M.; Savignac, J.C.; Sourzat, P. Truffe et Trufficulture; Périgueux: Fanlac, France, 1996. [Google Scholar]
- Le Tacon, F.; Zeller, B.; Plain, C.; Hossann, C.; Bréchet, C.; Martin, F.; Kohler, A.; Villerd, J.; Robin, C. Study of nitrogen and carbon transfer from soil organic matter to Tuber melanosporum mycorrhizas and ascocarps using 15N and 13C soil labelling and whole-genome oligoarrays. Plant Soil 2015, 395, 351–373. [Google Scholar] [CrossRef]
- Read, D.J.; Perez-Moreno, J. Mycorrhizas and nutrient cycling in ecosystems—A journey towards relevance? New Phytol. 2003, 157, 475–492. [Google Scholar] [CrossRef]
- Klein, T.; Siegwolf, R.T.W.; Korner, C. Belowground carbon trade among tall trees in a temperate forest. Science 2016, 352, 342–344. [Google Scholar] [CrossRef] [PubMed]
- Brienen, R.; Gloor, E.; Clerici, S.; Newton, R.; Arppe, L.; Boom, A.; Bottrell, S.; Callaghan, M.; Heaton, T.; Helama, S.; et al. Tree height strongly affects estimates of water-use efficiency responses to climate and CO2 using isotopes. Nat. Commun. 2017, 8, 288. [Google Scholar] [CrossRef] [PubMed]
- Boström, B.; Comstedt, D.; Ekblad, A. Isotope fractionation and 13C enrichment in soil profiles during the decomposition of soil organic matter. Oecologia 2007, 153, 89–98. [Google Scholar] [CrossRef] [PubMed]
- Bago, B. Carbon Metabolism and Transport in Arbuscular Mycorrhizas. Plant Physiol. 2000, 124, 949–958. [Google Scholar] [CrossRef] [PubMed]
- Soudzilovskaia, N.A.; Douma, J.C.; Akhmetzhanova, A.A.; Van Bodegom, P.; Cornwell, W.K.; Moens, E.J.; Treseder, K.K.; Tibbett, M.; Wang, Y.-P.; Cornelissen, J.H.C. Global patterns of plant root colonization intensity by mycorrhizal fungi explained by climate and soil chemistry: Global patterns of plant root mycorrhizal colonization intensity. Glob. Ecol. Biogeogr. 2015, 24, 371–382. [Google Scholar] [CrossRef]
- Brugnoli, E.; Farquhar, G.D. Photosynthetic Fractionation of Carbon Isotopes. In Photosynthesis; Leegood, R.C., Sharkey, T.D., von Caemmerer, S., Eds.; Springer: Dordrecht, The Netherlands, 2000; Volume 9, pp. 399–434. [Google Scholar]
- Ogrinc, N.; Kanduč, T.; Krajnc, B.; Vilhar, U.; Simončič, P.; Jin, L. Inorganic and organic carbon dynamics in forested soils developed on contrasting geology in Slovenia—A stable isotope approach. J. Soils Sediments 2016, 16, 382–395. [Google Scholar] [CrossRef]
- Venturella, G.; Altobelli, E.; Bernicchia, A.; Di Piazza, S.; Donnini, D.; Gargano, M.L.; Gorjón, S.P.; Granito, V.M.; Lantieri, A.; Lunghini, D.; et al. Fungal biodiversity and in situ conservation in Italy. Plant Biosyst. Int. J. Deal. All Asp. Plant Biol. 2011, 145, 950–957. [Google Scholar] [CrossRef]
- Autry, A.R.; Fitzgerald, J.W.; Caldwell, P.R. Sulfur fractions and retention mechanisms in forest soils. Can. J. For. Res. 1990, 20, 337–342. [Google Scholar] [CrossRef]
- Kertesz, M. The role of soil microbes in plant sulphur nutrition. J. Exp. Bot. 2004, 55, 1939–1945. [Google Scholar] [CrossRef]
- Davidian, J.-C.; Kopriva, S. Regulation of Sulfate Uptake and Assimilation—The Same or Not the Same? Mol. Plant 2010, 3, 314–325. [Google Scholar] [CrossRef]
- Allen, J.W.; Shachar-Hill, Y. Sulfur Transfer through an Arbuscular Mycorrhiza. Plant Physiol. 2009, 149, 549–560. [Google Scholar] [CrossRef] [PubMed]
- Pelusio, F.; Nilsson, T.; Montanarella, L.; Tilio, R.; Larsen, B.; Facchetti, S.; Madsen, J. Headspace Solid-Phase Microextraction Analysis of Volatile Organic Sulfur Compounds in Black and White Truffle Aroma. J. Agric. Food Chem. 1995, 43, 2138–2143. [Google Scholar] [CrossRef]
- Craig, H. Isotopic Variations in Meteoric Waters. Science 1961, 133, 1702–1703. [Google Scholar] [CrossRef] [PubMed]
- Gessler, A.; Ferrio, J.P.; Hommel, R.; Treydte, K.; Werner, R.A.; Monson, R.K. Stable isotopes in tree rings: Towards a mechanistic understanding of isotope fractionation and mixing processes from the leaves to the wood. Tree Physiol. 2014, 34, 796–818. [Google Scholar] [CrossRef]
- Padilla, F.M.; Miranda, J.D.D.; Armas, C.; Pugnaire, F.I. Effects of changes in rainfall amount and pattern on root dynamics in an arid shrubland. J. Arid. Environ. 2015, 114, 49–53. [Google Scholar] [CrossRef]
- Barbeta, A.; Jones, S.P.; Clavé, L.; Wingate, L.; Gimeno, T.E.; Frejaville, B.; Wohl, S.; Ogée, J. Hydrogen isotope fractionation affects the identification and quantification of tree water sources in a riparian forest. Hydrol. Earth Syst. Sci. Discuss. 2018, 1–29. [Google Scholar] [CrossRef]
- Willmes, M.; Bataille, C.; James, H.F.; Moffat, I.; McMorrow, L.; Kinsley, L.; Armstrong, R.A.; Eggins, S.; Grun, R. Mapping of bioavailable strontium isotope ratios in France for archaeological provenance studies. Appl. Geochem. 2018, 90, 75–86. [Google Scholar] [CrossRef]
- Meze, D. Poplavna področja na Blokah (Flood areas on Bloke). Acta Geogr. 1984, 23, 273–301. [Google Scholar]
- Hoogewerff, J.A.; Reimann, C.; Ueckermann, H.; Frei, R.; Frei, K.M.; Van Aswegen, T.; Stirling, C.; Reid, M.; Clayton, A.; Ladenberger, A.; et al. Bioavailable 87Sr/86Sr in European soils: A baseline for provenancing studies. Sci. Total Environ. 2019, 672, 1033–1044. [Google Scholar] [CrossRef]
- Thomsen, E.; Andreasen, R. Agricultural lime disturbs natural strontium isotope variations: Implications for provenance and migration studies. Sci. Adv. 2019, 5, eaav8083. [Google Scholar] [CrossRef]
- Veizer, J. Strontium Isotopes in Seawater through Time. Annu. Rev. Earth Planet. Sci. 1989, 17, 141–167. [Google Scholar] [CrossRef]
- Costantini, E.A.C.; Dazzi, C. (Eds.) The Soils of Italy; Springer: Dordrecht, The Netherlands, 2013. [Google Scholar]
- Hilszczanska, D.; Szmidla, H.; Sikora, K.; Rosa-Gruszecka, A. Soil Properties Conducive to the Formationof Tuber aestivum Vitt. Fruiting Bodies. Pol. J. Environ. Stud. 2019, 28, 1713–1718. [Google Scholar] [CrossRef]
- Faure, G. 1986. Principles of Isotope Geology, 2nd ed. xv + 589 pp. New York, Chichester, Brisbane, Toronto, Singapore: John Wiley & Sons. ISBN 0 471 86412 9 (hard covers). Geol. Mag. 1987, 124, 594–595. [Google Scholar] [CrossRef]
- Capo, R.C.; Stewart, B.W.; Chadwick, O.A. Strontium isotopes as tracers of ecosystem processes: Theory and methods. Geoderma 1998, 82, 197–225. [Google Scholar] [CrossRef]
- Pinter, N.; North Atlantic Treaty Organization (Eds.) The Adria Microplate: GPS Geodesy, Tectonics and Hazards; Springer in Cooperation with NATO Public Diplomacy Division: Dordrecht, The Netherlands, 2006. [Google Scholar]
- Le Tacon, F.; Wang, Y.; Goutal-Pousse, N. Soils and Vegetation in Natural Habitats of Tuber indicum in China. In True Truffle (Tuber spp.) in the World; Zambonelli, A., Iotti, M., Murat, C., Eds.; Springer International Publishing: Cham, Switzerland, 2016; Volume 47, pp. 233–245. [Google Scholar]
- Martin, F.; Kohler, A.; Murat, C.; Balestrini, R.; Coutinho, P.M.; Jaillon, O.; Montanini, B.; Morin, E.; Noel, B.; Percudani, R.; et al. Périgord black truffle genome uncovers evolutionary origins and mechanisms of symbiosis. Nature 2010, 464, 1033–1038. [Google Scholar] [CrossRef]
- Tancharakorn, S.; Tanthanuch, W.; Kamonsutthipaijit, N.; Wongprachanukul, N.; Sophon, M.; Chaichuay, S.; Uthaisar, C.; Yimnirun, R. The first microbeam synchrotron X-ray fluorescence beamline at the Siam Photon Laboratory. J. Synchrotron Radiat. 2012, 19, 536–540. [Google Scholar] [CrossRef]
- Solé, V.; Papillon, E.; Cotte, M.; Walter, P.; Susini, J.; Walter, P. A multiplatform code for the analysis of energy-dispersive X-ray fluorescence spectra. Spectrochim. Acta Part B At. Spectrosc. 2007, 62, 63–68. [Google Scholar] [CrossRef]
- Zidar, P.; Kos, M.; Vogel-Mikuš, K.; Van Elteren, J.T.; Debeljak, M.; Žižek, S. Impact of ionophore monensin on performance and Cu uptake in earthworm Eisenia andrei exposed to copper-contaminated soil. Chemosphere 2016, 161, 119–126. [Google Scholar] [CrossRef]
- Nečemer, M.; Kump, P.; Vogel-Mikuš, K. Use of X-ray Fluorescence-Based Analytical Techniques in Phytoremediation. In Handbook of Phytoremediation; Golubev, I.A., Ed.; Nova Science Publishers, Inc.: New York, NY, USA, 2011; pp. 331–358. [Google Scholar]
- Kump, P.; Nečemer, M.; Rupnik, Z.; Pelicon, P.; Ponikvar, D.; Vogel-Mikuš, K.; Regvar, M.; Pongrac, P. Improvement of the XRF quantification and enhancement of the combined applications by EDXRF and Micro PIXE. In Integration of Nuclear Spectrometry Methods as a New Approach to Material Research; IAEA: Vienna, Austria, 2007; pp. 101–110. [Google Scholar]
- Brand, W.A.; Coplen, T.B.; Vogl, J.; Rosner, M.; Prohaska, T. Assessment of international reference materials for isotope-ratio analysis (IUPAC Technical Report). Pure Appl. Chem. 2014, 86, 425–467. [Google Scholar] [CrossRef]
Sample Availability: Samples of the compounds are not available from the authors. |


| Element | Tuber magnatum (n = 4) | Tuber melanosporum (n = 5) | Tuber mesentericum (n = 4) | Tuber aestivum (n = 39) | Tuber brumale (n = 2) | Tuber indicum (n = 3) | Tuber macrosporum (n = 1) | ||||||||||||
|---|---|---|---|---|---|---|---|---|---|---|---|---|---|---|---|---|---|---|---|
| Mean ± SD | Min | Max | Mean ± SD | Min | Max | Mean ± SD | Min | Max | Mean ± SD | Min | Max | Mean ± SD | Min | Max | Mean ± SD | Min | Max | ||
| Al | 1103 ± 424 | 715 | 1557 | 233 ± 116 | 113 | 382 | 511 ± 699 | 143 | 1559 | 498 ± 435 | 29.0 | 1711 | 1376 ± 59 | 1335 | 1418 | 59.6 ± 41.1 | 22.4 | 104 | 1961 |
| As | 0.20 ± 0.05 | 0.16 | 0.26 | 0.07 ± 0.05 | 0.03 | 0.14 | 0.19 ± 0.20 | 0.04 | 0.49 | 0.20 ± 0.17 | 0.03 | 0.72 | 0.28 ± 0.06 | 0.23 | 0.32 | 0.05 ± 0.01 | 0.04 | 0.06 | 0.28 |
| Ba | 8.21 ± 5.87 | 3.91 | 16.90 | 2.13 ± 0.91 | 1.08 | 3.08 | 6.41 ± 4.55 | 3.56 | 13.2 | 6.84 ± 2.96 | 1.20 | 15.2 | 11.5 ± 9.0 | 5.09 | 17.8 | 1.99 ± 0.69 | 1.26 | 2.63 | 21.7 |
| Ca | 1594 ± 642 | 1220 | 2551 | 3489 ± 1120 | 2527 | 5418 | 2217 ± 1068 | 1380 | 3681 | 2831 ± 820 | 668 | 5135 | 2653 ± 2365 | 980 | 4325 | 987 ± 274 | 747 | 1285 | 3868 |
| Cd | 2.17 ± 1.00 | 0.77 | 2.97 | 2.35 ± 1.75 | 0.49 | 4.03 | 5.49 ± 3.01 | 1.36 | 8.50 | 6.25 ± 3.35 | 1.78 | 15.4 | 9.36 ± 4.46 | 6.20 | 12.5 | 1.30 ± 1.08 | 0.42 | 2.51 | 7.90 |
| Co | 0.40 ± 0.13 | 0.32 | 0.54 | 0.17 ± 0.14 | 0.04 | 0.37 | 0.17 ± 0.17 | 0.07 | 0.41 | 0.17 ± 0.12 | 0.03 | 0.48 | 0.32 ± 0.05 | 0.29 | 0.36 | 0.10 ± 0.04 | 0.07 | 0.15 | 0.36 |
| Cr | 3.38 ± 1.72 | 1.82 | 5.22 | 1.18 ± 0.29 | 0.84 | 1.52 | 1.46 ± 0.93 | 0.69 | 2.80 | 2.24 ± 1.21 | 0.44 | 5.13 | 3.31 ± 1.68 | 2.13 | 4.50 | 0.87 ± 0.54 | 0.51 | 1.50 | 2.62 |
| Cs | 0.12 ± 0.04 | 0.08 | 0.16 | 0.04 ± 0.01 | 0.02 | 0.05 | 0.06 ± 0.07 | 0.02 | 0.17 | 0.07 ± 0.06 | 0.01 | 0.23 | 0.14 ± 0.00 | 0.13 | 0.14 | 0.01 ± 0.00 | 0.01 | 0.02 | 0.19 |
| Cu | 61.9 ± 29.1 | 25.5 | 94.2 | 122 ± 119 | 32.6 | 270 | 51.9 ± 8.7 | 43.3 | 63.5 | 46.6 ± 19.0 | 22.0 | 116 | 88.5 ± 80.1 | 31.9 | 145 | 27.5 ± 16.3 | 17.1 | 46.4 | 29.8 |
| Fe | 322 ± 84 | 228 | 387 | 156 ± 67 | 84.2 | 222 | 367 ± 492 | 107 | 1104 | 325 ± 284 | 27.0 | 1215 | 646 ± 261 | 462 | 831 | 50.7 ± 30.7 | 24.5 | 84.4 | 589 |
| Hg | 0.04 ± 0.00 | 0.04 | 0.05 | 0.05 ± 0.02 | 0.03 | 0.08 | 0.09 ± 0.04 | 0.06 | 0.14 | 0.07 ± 0.04 | 0.01 | 0.20 | 0.03 ± 0.02 | 0.02 | 0.05 | 0.06 ± 0.01 | 0.05 | 0.07 | 0.03 |
| K | 31,612 ± 3926 | 28,203 | 35,844 | 20,289 ± 2086 | 18,194 | 23,097 | 21,689 ± 3772 | 17,194 | 25,824 | 21,364 ± 3510 | 15,464 | 32,571 | 26,207 ± 7426 | 20,956 | 31,458 | 23,676 ± 6690 | 17,051 | 30,429 | 23,702 |
| Mg | 980 ± 173 | 813 | 1167 | 567 ± 188 | 360 | 849 | 1147 ± 244 | 947 | 1503 | 1090 ± 319 | 521 | 1911 | 1544 ± 777 | 994 | 2093 | 706 ± 52 | 646 | 740 | 2268 |
| Mn | 20.0 ± 4.9 | 15.1 | 24.6 | 10.1 ± 4.2 | 5.36 | 15.5 | 20.2 ± 15.3 | 9.94 | 43.0 | 18.2 ± 13.9 | 5.42 | 87.3 | 24.5 ± 12.0 | 16.0 | 33.0 | 8.81 ± 2.80 | 6.80 | 12.0 | 20.8 |
| Na | 178 ± 38 | 138 | 213 | 72.0 ± 33.2 | 27.0 | 111.0 | 194 ± 34 | 168 | 245 | 106 ± 44 | 43.1 | 227 | 381 ± 334 | 145 | 617 | 57.7 ± 16.2 | 41.1 | 73.5 | 354 |
| Ni | 2.68 ± 1.29 | 1.36 | 3.93 | 0.39 ± 0.18 | 0.15 | 0.58 | 0.79 ± 0.47 | 0.39 | 1.46 | 0.93 ± 0.81 | 0.23 | 3.91 | 1.55 ± 0.28 | 1.35 | 1.76 | 0.36 ± 0.13 | 0.27 | 0.51 | 2.18 |
| P | 8209 ± 1400 | 7091 | 10252 | 6124 ± 596 | 5561 | 7003 | 6095 ± 1353 | 4210 | 7330 | 4319 ± 1342 | 2067 | 8285 | 8485 ± 2398 | 6790 | #### | 7453 ± 2336 | 6027 | 10149 | 6965 |
| Pb | 0.59 ± 0.36 | 0.25 | 1.08 | 0.18 ± 0.09 | 0.08 | 0.27 | 0.72 ± 0.67 | 0.22 | 1.69 | 0.48 ± 0.43 | 0.07 | 2.33 | 0.67 ± 0.04 | 0.65 | 0.70 | 0.15 ± 0.16 | 0.04 | 0.33 | 1.01 |
| Rb | 10.0 ± 4.4 | 5.48 | 14.5 | 4.95 ± 3.59 | 1.81 | 9.18 | 11.0 ± 5.4 | 4.88 | 15.6 | 9.00 ± 6.38 | 1.24 | 28.2 | 17.8 ± 11.1 | 10.0 | 25.7 | 1.51 ± 0.30 | 1.16 | 1.70 | 16.7 |
| S | 3202 ± 1772 | 1897 | 5808 | 4297 ± 1467 | 2552 | 6630 | 1933 ± 285 | 1752 | 2353 | 2014 ± 572 | 1251 | 3677 | 3007 ± 2307 | 1376 | 4638 | 2821 ± 775 | 2114 | 3649 | 1230 |
| Sr | 6.12 ± 3.17 | 3.45 | 10.7 | 3.52 ± 2.55 | 0.81 | 7.34 | 2.91 ± 1.43 | 1.59 | 4.66 | 4.43 ± 4.98 | 0.58 | 23.8 | 9.41 ± 9.11 | 2.98 | 15.9 | 3.70 ± 1.25 | 2.42 | 4.92 | 12.0 |
| V | 2.28 ± 0.87 | 1.48 | 3.21 | 0.50 ± 0.24 | 0.25 | 0.80 | 0.92 ± 1.18 | 0.23 | 2.69 | 1.20 ± 1.15 | 0.07 | 4.95 | 2.59 ± 0.61 | 2.16 | 3.02 | 0.17 ± 0.09 | 0.11 | 0.27 | 3.37 |
| Zn | 346 ± 51 | 275 | 390 | 100 ± 13 | 83.1 | 117 | 156 ± 45 | 100 | 196 | 136 ± 37 | 55.0 | 269 | 184 ± 58 | 143 | 225 | 75.8 ± 25.4 | 60.7 | 105 | 298 |
| Species | Country | Location | Sr mg/kg | Rb/Sr | Sr/Ca | Ba/Ca | Mg/Ca | 87Sr/86Sr |
|---|---|---|---|---|---|---|---|---|
| TUBAES | SLO | Meja | 3.13 | 0.0019 | 0.0006 | 0.0009 | 0.50 | 0.71212 |
| SLO | Pluska | 2.28 | 0.0020 | 0.0005 | 0.0006 | 0.94 | 0.71088 | |
| SLO | Spodnje Blato | 2.66 | 0.0049 | 0.0004 | 0.0006 | 0.78 | 0.71094 | |
| SLO | Žlebič | 1.45 | 0.0039 | 0.0005 | 0.0008 | 0.95 | 0.70985 | |
| SLO | Bloke | 2.67 | 0.0052 | 0.0005 | 0.0009 | 1.05 | 0.71375 | |
| SLO | Sežana | 7.32 | 0.0019 | 0.0007 | 0.0009 | 0.87 | 0.70862 | |
| SLO | Rajndol | 1.75 | 0.0076 | 0.0004 | 0.0010 | 1.19 | 0.71151 | |
| PL | n.d. | 18.8 | 0.0003 | 0.0025 | 0.0011 | 0.41 | 0.70896 | |
| IT | Perugia | 4.35 | 0.0020 | 0.0006 | 0.0005 | 0.41 | 0.70894 | |
| CRO | n.d. | 2.54 | 0.0067 | 0.0005 | 0.0012 | 1.13 | 0.71102 | |
| BIH | Šipovo | 7.19 | 0.0010 | 0.0011 | 0.0011 | 0.56 | 0.70975 | |
| TUBBRU | SLO | Marija Snežna | 2.98 | 0.0088 | 0.0014 | 0.0015 | 1.67 | 0.70868 |
| TUBIND | CN | n.d. | 4.92 | 0.0002 | 0.0018 | 0.0006 | 0.94 | 0.70953 |
| TUBMAG | SLO | Lukini | 10.7 | 0.0014 | 0.0040 | 0.0040 | 1.55 | 0.71105 |
| TUBMEL | ES | Cantavieja | 7.34 | 0.0013 | 0.0006 | 0.0007 | 0.26 | 0.71219 |
© 2020 by the authors. Licensee MDPI, Basel, Switzerland. This article is an open access article distributed under the terms and conditions of the Creative Commons Attribution (CC BY) license (http://creativecommons.org/licenses/by/4.0/).
Share and Cite
Hamzić Gregorčič, S.; Strojnik, L.; Potočnik, D.; Vogel-Mikuš, K.; Jagodic, M.; Camin, F.; Zuliani, T.; Ogrinc, N. Can We Discover Truffle’s True Identity? Molecules 2020, 25, 2217. https://doi.org/10.3390/molecules25092217
Hamzić Gregorčič S, Strojnik L, Potočnik D, Vogel-Mikuš K, Jagodic M, Camin F, Zuliani T, Ogrinc N. Can We Discover Truffle’s True Identity? Molecules. 2020; 25(9):2217. https://doi.org/10.3390/molecules25092217
Chicago/Turabian StyleHamzić Gregorčič, Staša, Lidija Strojnik, Doris Potočnik, Katarina Vogel-Mikuš, Marta Jagodic, Federica Camin, Tea Zuliani, and Nives Ogrinc. 2020. "Can We Discover Truffle’s True Identity?" Molecules 25, no. 9: 2217. https://doi.org/10.3390/molecules25092217
APA StyleHamzić Gregorčič, S., Strojnik, L., Potočnik, D., Vogel-Mikuš, K., Jagodic, M., Camin, F., Zuliani, T., & Ogrinc, N. (2020). Can We Discover Truffle’s True Identity? Molecules, 25(9), 2217. https://doi.org/10.3390/molecules25092217