Article

(Poly)phenolic Content and Profile and Antioxidant Capacity of Whole-Grain Cookies are Better Estimated by Simulated Digestion than Chemical Extraction

1
Department of Agricultural and Food Sciences (DISTAL), University of Bologna, Piazza Goidanich 60, 47521 Cesena, Italy
2
Interdepartmental Center for Agri-food Industrial Research (CIRI Agrifood), University of Bologna, Via Quinto Bucci 336, 47521 Cesena, Italy
3
Department of Food and Drug, University of Parma, Parco Area delle Scienze 27/A, 43124 Parma, Italy
4
Department of Veterinary Science, University of Parma, Medical School, Building C, Via Volturno 39, 43125 Parma, Italy
*
Author to whom correspondence should be addressed.
Current address: Sociedad Española de Colorantes Naturales y Afines (SECNA), Polígono 33, Parcela 254, El Muladar, 46370 Chiva, Valencia, Spain.
Molecules 2020, 25(12), 2792; https://doi.org/10.3390/molecules25122792
Submission received: 28 May 2020 / Revised: 12 June 2020 / Accepted: 14 June 2020 / Published: 17 June 2020
(This article belongs to the Special Issue Bioactive Phenolic and Polyphenolic Compounds)

Abstract

:
It is widely recognized that the biological effects of phytochemicals cannot be attributed to the native compounds present in foods but rather to their metabolites endogenously released after intake. Bioavailability depends on bioaccessibility, which is the amount of the food constituent that is released from the matrix in the gastrointestinal tract. The use of chemical extraction to evaluate the content and profile of phytochemicals does not mirror the physiological situation in vivo, and their bioaccessibility should be considered while assessing their nutritional significance in human health. The current study was designed to compare the (poly)phenolic profile and content and antioxidant capacity of whole-grain (WG) cookies using chemical extraction and a more physiological approach based on simulated digestion. Three types of organic WG cookies (made with durum, Italian khorasan, or KAMUT® khorasan wheat) were considered, either fermented by Saccharomyces Cerevisiae or sourdough. Although the flour type and the fermentation process influenced the release of phytochemicals from the cookie matrix, in almost all samples, the simulated digestion appeared the most efficient procedure. Our results indicate that the use of chemical extraction for evaluation of the phytochemicals content and antioxidant capacity of food could lead to underestimation and underline the need for more physiological extraction methods.

Graphical Abstract

1. Introduction

Phytochemicals are bioactive non-nutrient components of fruits, vegetables, grains, and other plant foods that may have biological significance and provide desirable health benefits beyond basic nutrition, reducing the risk of major chronic diseases [1]. (Poly)phenolic compounds (PCs) represent one of the major groups of phytochemicals.
It is widely recognized that most of the biological effects of PCs cannot be attributed to the native compounds present in foods but rather to their metabolites of various origins gaining contact with the internal compartments after food intake [2]. Therefore, the health benefits of dietary PCs depend not only on their concentration in the food but mainly on their absorption, metabolism, and availability in the target tissue [3]. Bioavailability, i.e., the proportion of a food constituent that is absorbed and utilized in the normal metabolism [4], depends on bioaccessibility, which is the amount of the food constituent that is released from the solid food matrix in the gastrointestinal tract [5]. The bioaccessibility of PCs is greatly influenced by their interactions with the food matrix. In turn, these interactions depend on the physicochemical properties of the food matrix (e.g., pH, temperature, texture), on the presence of other components that can improve or antagonize accessibility [6], and on the technologies used for food processing [7,8].
The majority of studies examining the PC content or the antioxidant activity of foods do not consider bioaccessibility and rely on non-physiological extraction conditions [9] that often ignore PCs remaining in the residues of the chemically extracted material. Recent studies evidenced that these non-extractable bioactive molecules represent a major part of total dietary PCs, and exhibit a substantial biological activity [10]. Therefore, the concentration and profile of PCs in food after chemical extraction do not mirror the physiological situation in vivo [11], and could give misleading results while assessing their nutritional significance in human health.
In the current study, we compared two different approaches to evaluate the PC profile and antioxidant capacity of organic whole-grain (WG) cookies: a standard approach based on chemical extraction and a more physiological approach based on in vitro-simulated digestion. Simulated digestion was followed by ultrafiltration, allowing the selection of compounds that were small enough to be potentially absorbable through the intestinal mucosa (<3 kDa digested fraction, as bioaccessible fraction) [12]. WGs are concentrated sources of phytochemicals, mainly PCs [13], and cookies were chosen as the model food since they are a popular foodstuff, consumed by a wide range of populations [14].
Three different types of organic WG cookies were considered: i) WG durum wheat cookies (DUR); ii) WG Italian khorasan wheat cookies (KHO); and iii) WG KAMUT® khorasan wheat cookies (KAM). To be sold under the trademark KAMUT®, khorasan wheat must meet specific standards that so far are consistently satisfied only in the growing region of North America [15,16]. In this study, we used Italian khorasan wheat and KAMUT® khorasan wheat to evaluate the impact of environmental factors on the content and bioaccessibility of PCs.
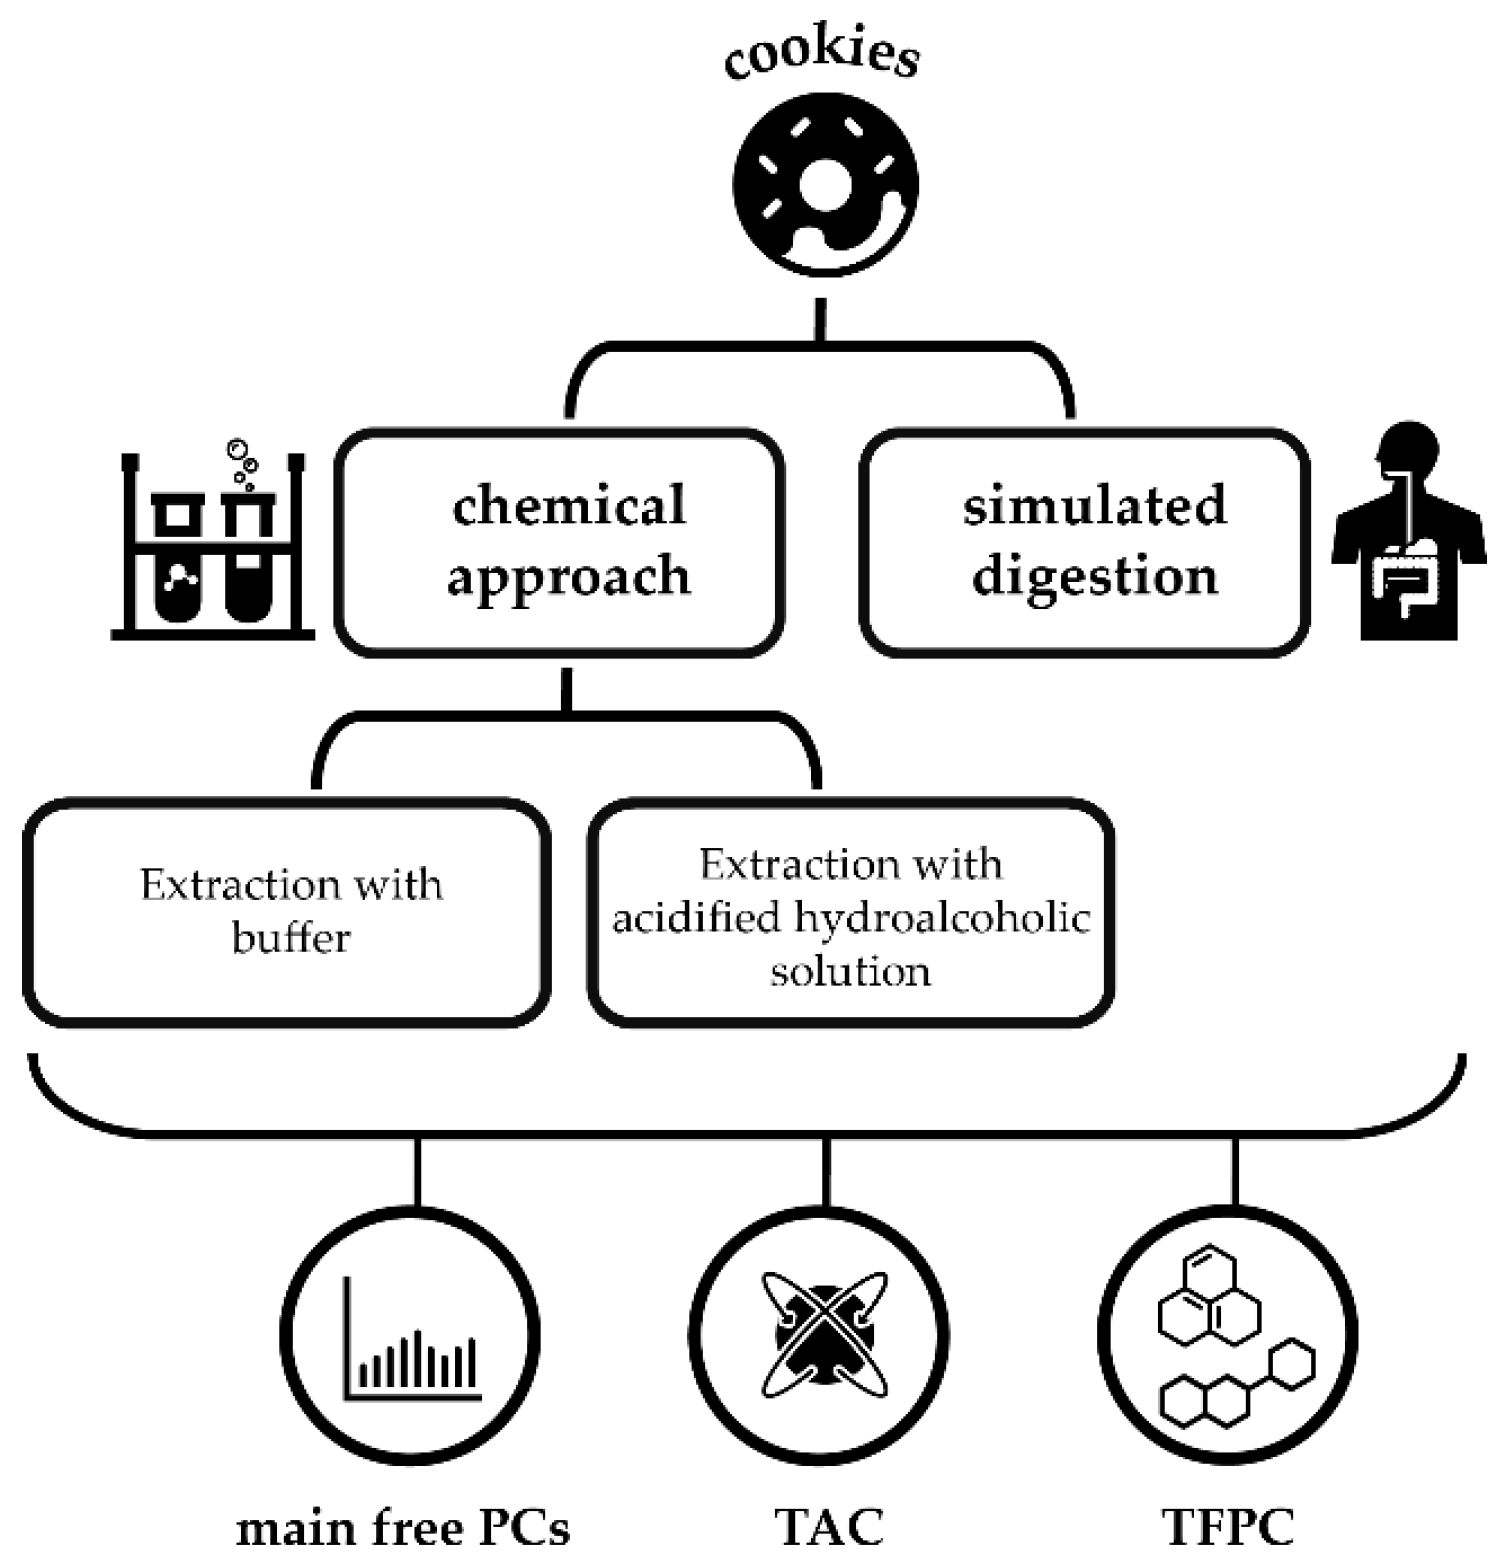
To verify the possible influence of production processes [17], the WG cookies were prepared by standard fermentation using Saccharomyces cerevisiae (DURS, KHOS, KAMS) or sourdough fermentation using S. cerevisiae and lactic acid bacteria (LAB) (DURL, KHOL, KAML). The study design is schematically reported in Figure 1.

2. Results and Discussion

The ultra-high-performance liquid chromatography-mass spectrometry (uHPLC-MSn) allowed the identification of seventeen PCs among free (poly)phenol fraction of the investigated cookies (Table 1). In detail, six compounds were phenolic acids, mainly hydroxycinnamates, while the remaining compounds were flavones, mainly apigenin-C-diglycosides. Among flavones, five compounds were quantified as the most abundant flavonoids in the investigated samples.
Since hydrolysable phenolic acids are very abundant in WG flours and are generally predominant in the bound form [18], we also evaluated the composition and abundance of bound forms of PCs through a preliminary chromatographic analysis of the experimental cookies treated with alkaline hydrolysis (Supplementary Materials, Table S1). Regardless of the type of WG cookie, ferulic and diferulic acid were the major bound PCs, as previously observed in Triticum species [19,20]. The identification of diferulates was performed based on mass spectral characteristics previously reported [21]. Bound ferulic and diferulic acid present in KAM cookies were approximately 2/3 of those present in DUR and KHO cookies, while no apigenin-C-diglycosides were recovered in the bound (poly)phenol fraction. Differently, apigenin-C-hexoside-C-pentoside isomers were the dominant PCs in the free forms, mainly in DUR cookies, showing that the WG cookies prepared with Italian durum wheat had the highest content of PC free forms, which can be enhanced after LAB fermentation. The identification of several apigenin-C-diglycosides among the free (poly)phenol fraction confirmed the previous findings on wheat-derived food products [22,23,24,25,26]. Two isomers of apigenin-C-hexoside-C-pentoside were the most abundant apigenin-C-diglycosides, which could be schaftoside and isoschaftoside, the most relevant wheat-derived flavonoids [22,23,24,25,26]. Sinapic acid was detected in the fraction of bound PCs and was absent in the free form. p-Coumaric acid barely existed in the free form as previously reported by other authors [27] and it was detected only in KHOL cookies. Ferulic acid was released from their bound form by sourdough fermentation only in WG cookies made with DUR and KHO, where the highest content of this phenolic acid was observed. A higher release of phenolic acids after sourdough than standard fermentation of WG cereals was previously reported in barley [28], wheat and rye malt [29], and in bread made with wheat, spelt, or rye flours [30], and it was ascribed to LAB feruloyl esterase activity [30,31]. Our results evidenced that the effect of sourdough fermentation was modulated by the cereal type.
The influence of the chemical extractions or the simulated digestion on the PC profile of the WG cookies prepared using standard or sourdough fermentation are reported in Table 2 and Table 3, respectively. These data clearly show that the simulated digestion was not only the most physiological but also the most exhaustive approach to release single PCs, mainly p-coumaric and ferulic acid, from the food matrix. The higher concentration of free PCs quantified in digested cookies than hydroalcoholic extracts is consistent with a previous study on different types of bread [31]. Similarly, the treatment of cereal-derived products with digestive enzymes, including pepsin, pancreatin, amylase, and amyloglucosidase, led to a significant increase of the total phenolic content compared to the aqueous-organic extracts [32].
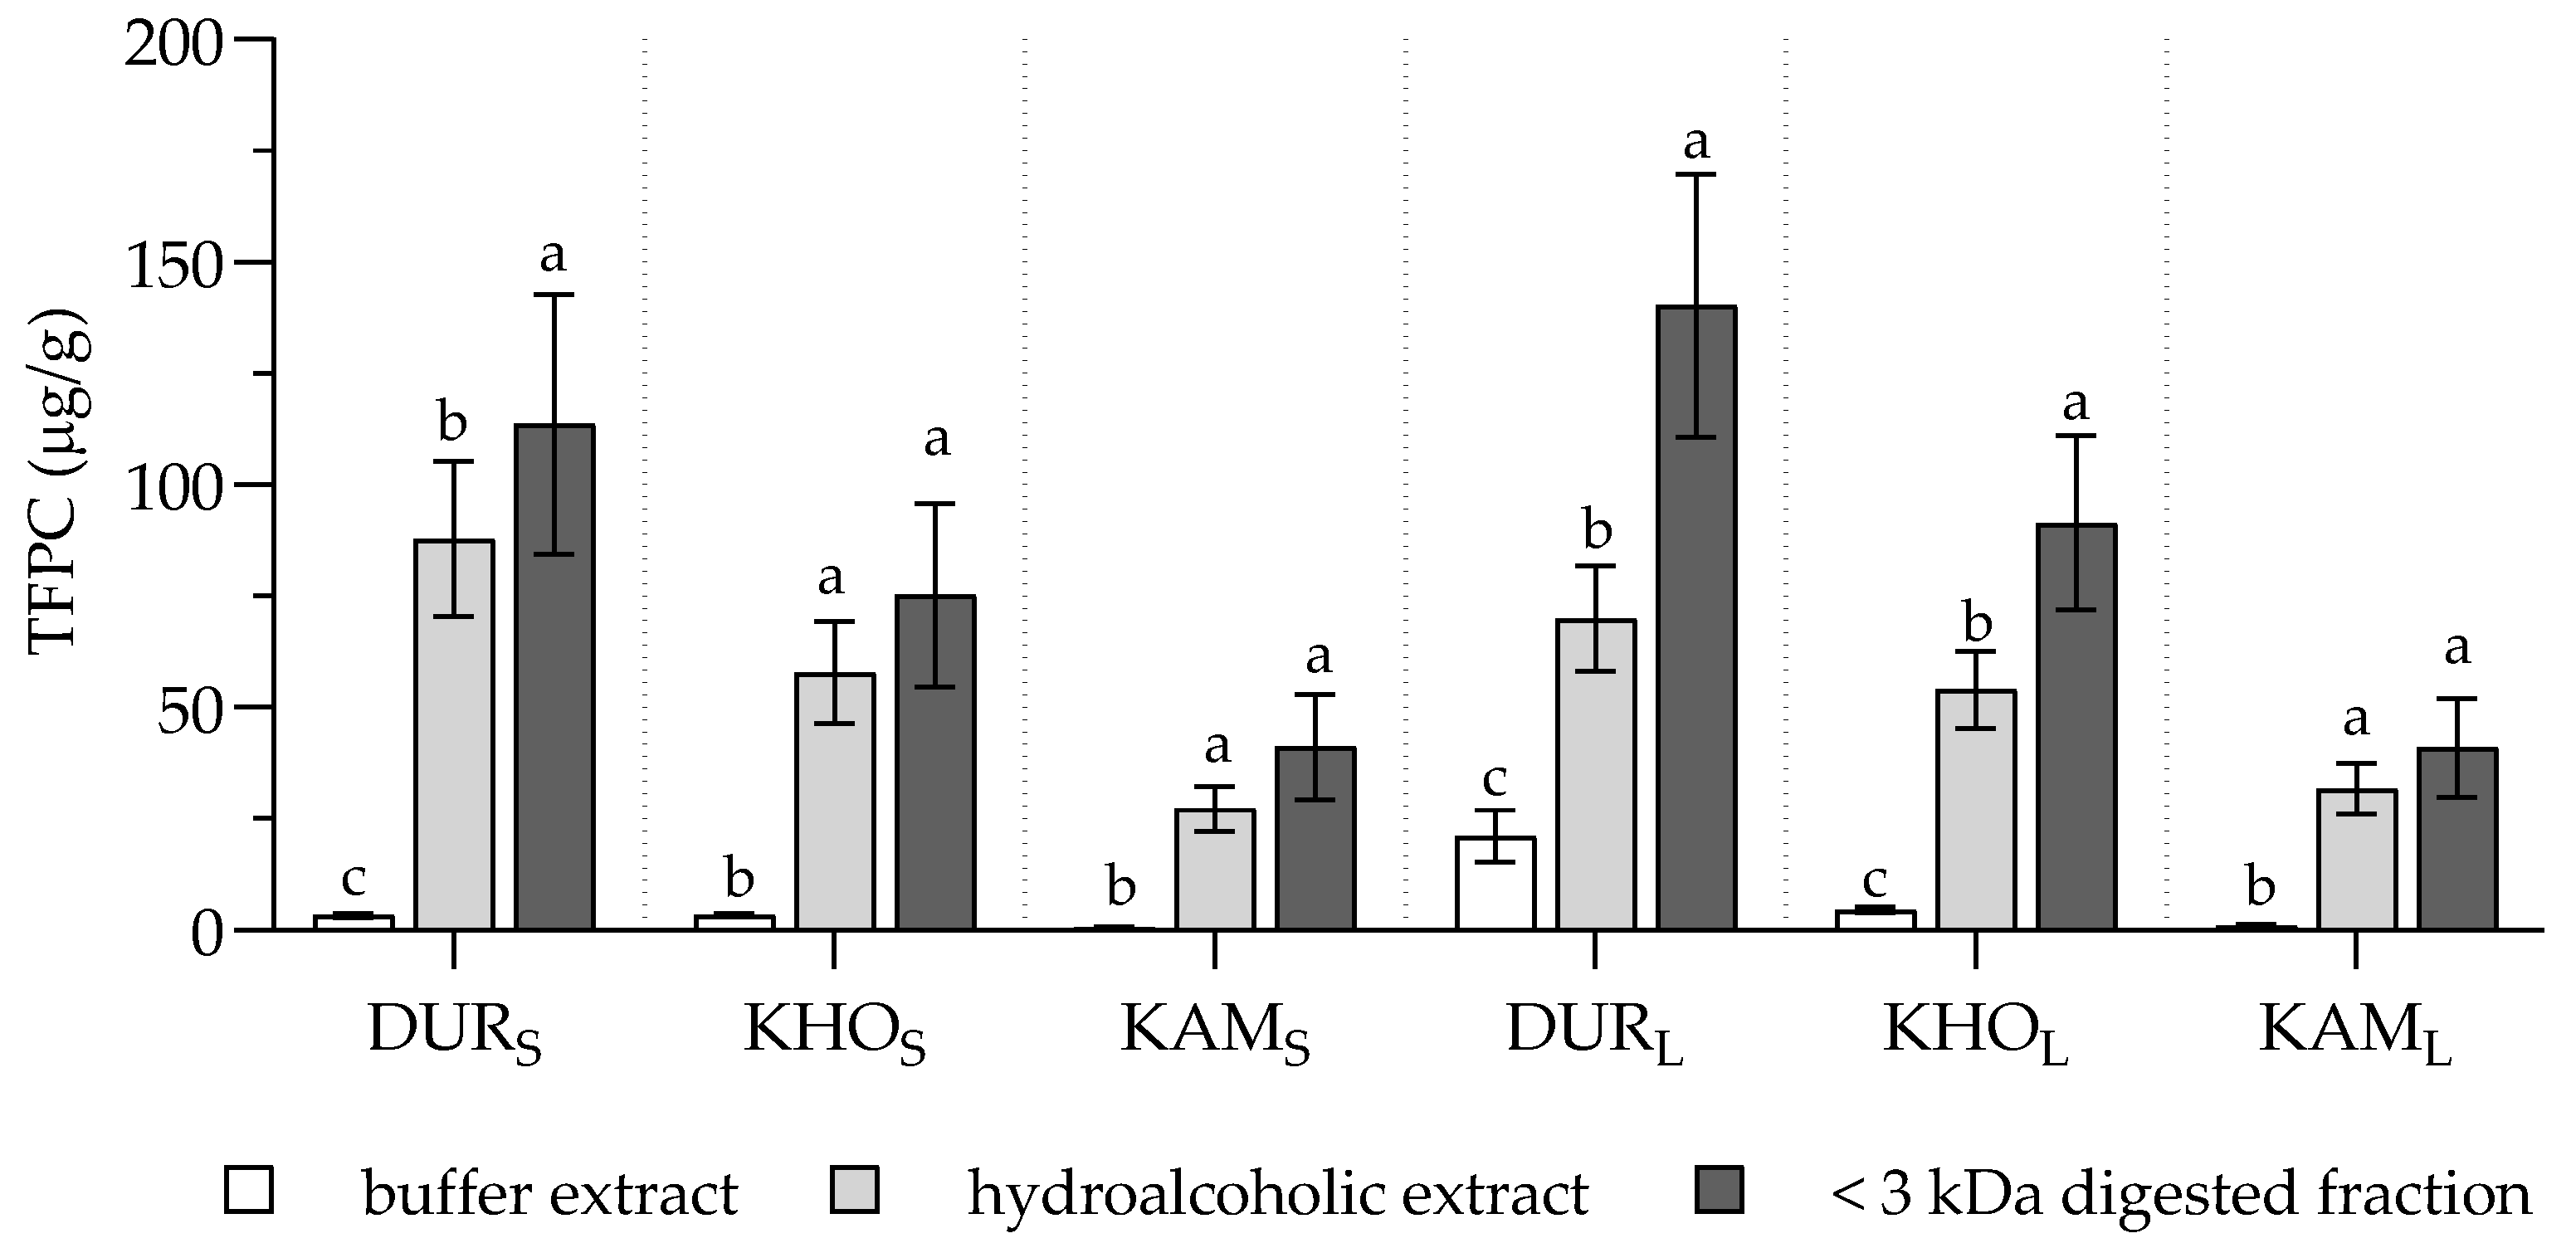
Even considering the total free PC content (TFPC) of samples (i.e., the sum of total free PCs determined by uHPLC-MSn), in all cookies’ extraction, buffer was not efficient, confirming that the best solvent for chemical extraction of complex food should include a hydrophilic and a lipophilic phase (Figure 2). Hydroalcoholic extraction and simulated digestion were equally efficient in samples with the lowest TFPC (KHOS, KAMS, and KAML), while with the increase of TFPC the simulated digestion was the most exhaustive process even in this case. An effect of both variables was detected (F (5, 48) = 32.41 and F (2, 48) = 206.8 for types of WG cookie and type of extraction, respectively), with interaction between the two variables (F (10, 48) = 7.661).
Of note, in the herein reported study, we showed that simulated gastrointestinal digestion facilitated the release of all PCs from the food matrix more than the chemical extraction methods employed in most studies. Accordingly, further PC data analysis was mainly focused on the <3 kDa digested fractions of the experimental cookies (Supplementary Materials, Table S2). The concentration of the most represented free PCs, apigenin-C-hexoside-C-pentosides and apigenin-C-dihexoside (1st), was in the order DUR > KHO > KAM. The content of ferulic and p-coumaric acid in DUR and KHO was higher after LAB fermentation than after standard fermentation, while no differences due to fermentation were observed in KAM. Although in the <3 kDa digested fractions differences in the PC profile appeared strongly dependent on the type of flours, they were modulated by the fermentation (see Supplementary Materials, Table S3 for a complete description of the two-way analysis of variance). A significant effect of both variables (WG cereal and fermentation type) with interaction between the two variables was detected for apigenin-C-hexoside-C-pentoside (2nd), and ferulic and p-coumaric acid.
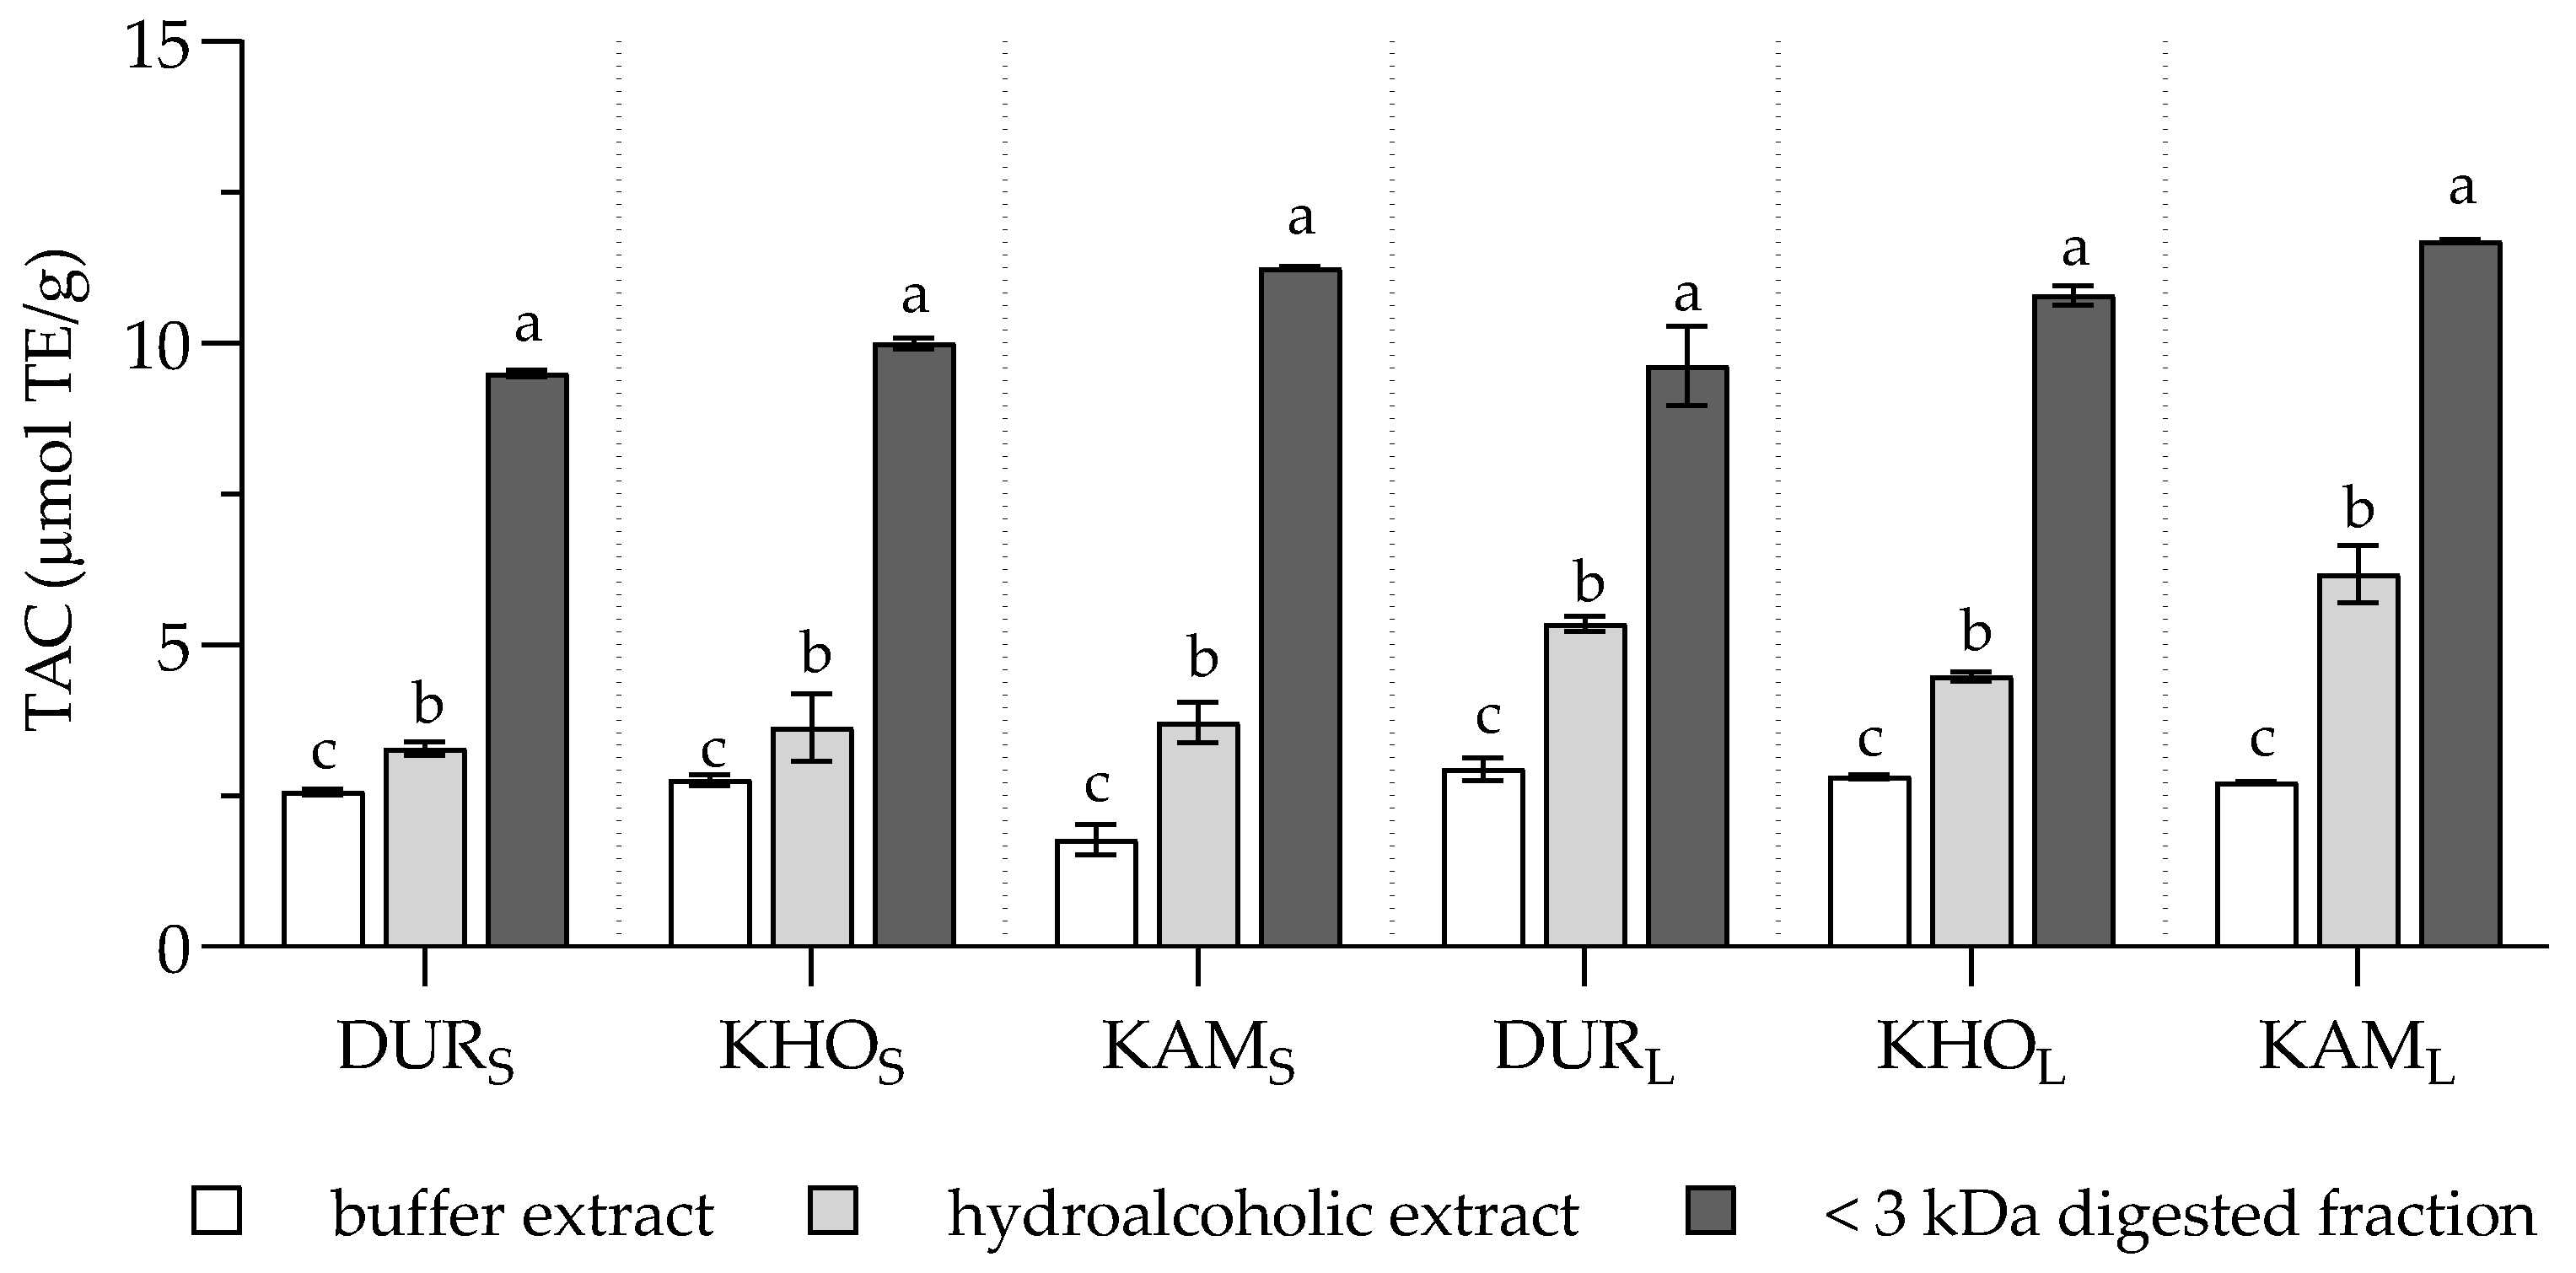
Since the antioxidant properties of foods may depend on their release from the food matrix during the digestion process and may greatly differ from those obtained by the chemical extractions, the total antioxidant capacity (TAC) of the chemical extracts and digested fraction was assessed. Regardless of the type of cookie, TAC was about two-fold higher in digested samples than in the corresponding chemical extracts (Figure 3), confirming the greater release of antioxidant compounds during simulated digestion than after chemical extraction previously shown in other food matrices [33,34,35]. Of note, the increased TAC in the digested samples could also be accounted for by the addition of bile during the digestion procedure since bile pigments are potent peroxyl radical scavengers [36].
As for TFPC, a significant effect of both independent variables, i.e., types of WG cookie and type of extraction, was evidenced by the two-way ANOVA (F (5, 18) = 31.61 and F (2, 18) = 2923, respectively), with interaction between the two variables (F (10, 18) = 16.74).

3. Materials and Methods

3.1. Materials

All chemicals, reagents, and solvents were purchased from Sigma-Aldrich Co. (St. Louis, MO, U.S.A.) unless otherwise stated. All aqueous solutions were prepared using ultrapure water (Milli-Q; Millipore, Bedford, CT, U.S.A.). All phenolic standards were purchased from Sigma-Aldrich Co. except vitexin, which was purchased from Extrasynthese (Genay Cedex, France).

3.2. Cookie Preparation

Six different types of WG cookies were tested: i. Italian durum wheat, standard fermentation (S. cerevisiae) (DURS); ii. Italian khorasan wheat, standard fermentation (KHOS); iii. KAMUT® khorasan wheat, standard fermentation (KAMS); iv. Italian durum wheat, sourdough fermentation (S. cerevisiae and LAB) (DURL); v. Italian khorasan wheat, sourdough fermentation (KHOL); and vi. KAMUT® khorasan wheat, sourdough fermentation (KAML). Flours, S. cerevisiae and LAB strains, other cookie ingredients, and the cooking procedure are reported in Valli et al. [12].

3.3. Cookie Chemical Extraction

Since a single chemical procedure could not accurately reflect all the antioxidants in a complex system [37], we firstly used two different methods of chemical extraction as described in Danesi et al. [38] with some modifications. Briefly, 5 g of each sample were extracted with 20 mL ethanol/water (70:30 v/v) acidified with 0.1% HCl or with the buffer solution used for the simulated digestion procedure. After a 20 min incubation at 40 °C, samples were centrifuged at 3000× g for 5 min and the supernatant collected. The extraction phase was repeated with 10 mL of acidified ethanol/water or buffer, and supernatants were combined. Prior to uHPLC-MSn analysis, hydro-alcoholic extracts were dried in a speed vacuum and dissolved in a mixture of methanol/acidified water (1% formic acid) (50:50, v/v). Buffer extracts were further extracted with ethyl acetate by vigorous vortex for 1 min, dried in a speed vacuum, and resuspended in methanol/acidified water (1% formic acid) (50:50, v/v). Moreover, since cereal-based products are characterized by an important fraction of bound PCs [20], an alkaline hydrolysis was also applied [21]. Each cookie sample was extracted at least in triplicate using the different procedures.

3.4. Cookie Simulated Digestion

WG cookies were in vitro digested, according to Bordoni et al. [39]. The digested mixture was centrifuged at 4000× g for 5 min, the upper lipid layer was removed, and the lower aqueous phase centrifuged again at 21,000× g for 20 min. The supernatant was filtered with 0.2 µm membranes, and an aliquot was sequentially ultrafiltered over a 3 kDa molecular weight cut-off semi-permeable membrane (Amicon Ultra, EMD Millipore, Billerica, MA, U.S.A.) to obtain the bioaccessible fraction (<3 kDa digested fraction).
The <3 kDa digested samples were diluted 1:1 with methanol/acidified water (1% formic acid) and mixed by vortex before uHPLC-MSn sample preparation and analysis. Each cookie sample was digested in triplicate.

3.5. Total Antioxidant Capacity (TAC)

TAC was measured in the chemical extracts and in the <3 kDa digested fraction, as reported in Valli et al. [40]. Values obtained were expressed as µmol of Trolox equivalents (TE)/g of cookie.

3.6. (Poly)phenolic Profile and Content

The chemical extracts and the <3 kDa digested fractions were analyzed using an Accela uHPLC 1250 equipped with a linear ion-trap-mass spectrometer (LTQ XL, Thermo Fisher Scientific Inc., San José, CA, USA) fitted with a heated-electrospray ionization probe (H-ESI-II; Thermo Fisher Scientific Inc., San José, CA, USA). The separation was carried out by means of a C18 BlueOrchid column (50 × 2 mm; 1.8 μm particle size; Knauer, Berlin, Germany).
For uHPLC separation, mobile phase A was acidified water (0.1% formic acid) and mobile phase B was methanol/water (98/2, v/v). The gradient started with 93% A and 7% B. After 1 min at isocratic conditions, the mobile phase reached 50% of eluent A in a 12 min linear gradient. Then, phase A turned up to 80% and was maintained for 3 min, followed by 5 min of re-equilibration time at the starting conditions. The flow rate was 0.2 mL/min, the injection volume was 5 μL, and the column temperature was set at 40 °C. Initially, a preliminary investigation of the main PCs was carried out using full-scan data-dependent MS3 mode, scanning in a mass to charge (m/z) range of 100–1000, using collision-induced dissociation (CID) equal to 35 (arbitrary units) to obtain fragmentation. After this first step, further specific MS2 analyses were carried out to unambiguously identify and quantify the compounds revealed in the first step, by monitoring specific m/z transitions. Molecules were fragmented using pure helium (99.99%), with a CID setting of 15 for the production of the molecular ion, and 35 for subsequent fragmentations. Identification was performed by comparison with the literature [21]. The analyses were carried out in negative ionization mode, with a capillary temperature of 275 °C, while the source was set at 45 °C. The sheath gas flow was 40 units, while auxiliary and sweep gases were set to 5 units. The source voltage was 4 kV. The capillary voltage and tube lens were −21 and −58 V, respectively. The quantification of each PC was performed through a calibration curve built with the respective commercial standard, when available, while apigenin-C-glycosides were quantified as apigenin-8-C-glucoside (vitexin) equivalents, the most structurally related compound commercially available. The calibration curve of ferulic acid was used for diferulic acid quantification as previously reported [21].

3.7. Statistical Analysis

Differences among samples were tested by one-way analysis of variance (ANOVA) followed by Tukey′s HSD test or by two-way ANOVA. Statistical significance was set at p < 0.05.

4. Conclusions

Antioxidant activity, PC content, and the profile of food are usually measured after their chemical extraction from the food matrix. Our results indicate that in vitro digestion, besides better simulating the physiological condition, can be a more exhaustive procedure at least in WG cookies. This should be carefully considered while evaluating food as a source of PCs and antioxidant compounds [41].
Our findings confirmed that the flour type and the fermentation process used to bake cookies affect not only the concentration and profile [42] but also the bioaccessibility of bioactive compounds.
Research on food based on WG cereals requires a more complete understanding of the bioavailability of bioactive compounds. The comparison between commonly used chemical extraction and a physiologically appropriate in vitro model answers the need for increased knowledge in the interaction among matrix and bioactive compound bioaccessibility of WG foods.

Supplementary Materials

The following are available online, Table S1: Concentration of main free and bound PCs in the experimental cookies prepared using standard (S. cerevisiae) or lactic (S. cerevisiae and LAB) fermentation; Table S2: Statistical analysis of the concentration of main PCs in the <3 kDa digested fractions of the experimental cookies; Table S3: Summary of ANOVA results on the main PCs in the < 3 kDa digested fractions of the experimental cookies.

Author Contributions

Conceptualization, D.D.R. and A.B.; Investigation, F.D., L.C., L.B. and V.V.; Methodology, F.D., L.C., L.B. and V.V.; Resources, A.B.; Supervision, D.D.R. and A.B.; Writing—original draft, F.D. and V.V.; Writing—review & editing, D.D.R. and A.B. All authors have read and agreed to the published version of the manuscript.

Funding

This research was funded by Kamut Enterprises of Europe (Oudenaarde, Belgium). KAMUT® is a registered trademark of Kamut International, Ltd. and Kamut Enterprises of Europe, bvba.

Acknowledgments

The authors wish to thank Dr. Andrea Gianotti (University of Bologna, Italy) for providing strains. Special thanks are also due to Danielle Laure Taneyo Saa and Mattia Baldissarri for cookie preparation.

Conflicts of Interest

The authors declare no conflict of interest. The founding sponsor has no role in the design of the study, in the collection, analyses, or interpretation of data, in the writing of the manuscript, and in the decision to publish the results.

References

  1. Liu, R.H. Health-promoting components of fruits and vegetables in the diet. Adv. Nutr. 2013, 4, 384S–392S. [Google Scholar] [CrossRef]
  2. Bohn, T.; McDougall, G.J.; Alegria, A.; Alminger, M.; Arrigoni, E.; Aura, A.M.; Brito, C.; Cilla, A.; El, S.N.; Karakaya, S.; et al. Mind the gap-deficits in our knowledge of aspects impacting the bioavailability of phytochemicals and their metabolites—A position paper focusing on carotenoids and polyphenols. Mol. Nutr. Food Res. 2015, 59, 1307–1323. [Google Scholar] [CrossRef] [Green Version]
  3. Lampe, J.W.; Chang, J.L. Interindividual differences in phytochemical metabolism and disposition. Semin. Cancer Biol. 2007, 17, 347–353. [Google Scholar] [CrossRef] [PubMed] [Green Version]
  4. Ross, K. Concepts important in understanding the health benefits of phenolics in fruits and vegetables: Extractable & non-extractable phenolics and the influence of cell wall polysaccharides on bioaccessibility & bioavailability. Res. Health Nutr. 2014, 2, 29–43. [Google Scholar]
  5. Rubió, L.; Macià, A.; Castell-Auví, A.; Pinent, M.; Blay, M.T.; Ardévol, A.; Romero, M.P.; Motilva, M.J. Effect of the co-occurring olive oil and thyme extracts on the phenolic bioaccesibility and bioavailability assessed by in vitro digestion and cell models. Food Chem. 2014, 149, 277–284. [Google Scholar] [CrossRef] [PubMed]
  6. Danesi, F.; Govoni, M.; D’Antuono, L.F.; Bordoni, A. The molecular mechanism of the cholesterol-lowering effect of dill and kale: The influence of the food matrix components. Electrophoresis 2016, 37, 1805–1813. [Google Scholar] [CrossRef] [PubMed] [Green Version]
  7. Rein, M.J.; Renouf, M.; Cruz-Hernandez, C.; Actis-Goretta, L.; Thakkar, S.K.; Da Silva Pinto, M. Bioavailability of bioactive food compounds: A challenging journey to bioefficacy. Br. J. Clin. Pharmacol. 2013, 75, 588–602. [Google Scholar] [CrossRef] [Green Version]
  8. Pineda-Vadillo, C.; Nau, F.; Guerin-Dubiard, C.; Jardin, J.; Lechevalier, V.; Sanz-Buenhombre, M.; Guadarrama, A.; Tóth, T.; Csavajda, E.; Hingyi, H.; et al. The food matrix affects the anthocyanin profile of fortified egg and dairy matrices during processing and in vitro digestion. Food Chem. 2017, 214, 486–496. [Google Scholar] [CrossRef]
  9. Nagah, A.M.; Seal, C.J. In vitro procedure to predict apparent antioxidant release from wholegrain foods measured using three different analytical methods. J. Sci. Food Agric. 2005, 85, 1177–1185. [Google Scholar] [CrossRef]
  10. Saura-Calixto, F. Concept and health-related properties of nonextractable polyphenols: The missing dietary polyphenols. J. Agric. Food Chem. 2012, 60, 11195–11200. [Google Scholar] [CrossRef]
  11. Serrano, J.; Goñi, I.; Saura-Calixto, F. Food antioxidant capacity determined by chemical methods may underestimate the physiological antioxidant capacity. Food Res. Int. 2007, 40, 15–21. [Google Scholar] [CrossRef] [Green Version]
  12. Valli, V.; Danesi, F.; Gianotti, A.; Di Nunzio, M.; Taneyo Saa, D.L.; Bordoni, A. Antioxidative and anti-inflammatory effect of in vitro digested cookies baked using different types of flours and fermentation methods. Food Res. Int. 2016, 88, 256–262. [Google Scholar] [CrossRef] [Green Version]
  13. Fardet, A.; Rock, E.; Rémésy, C. Is the in vitro antioxidant potential of whole-grain cereals and cereal products well reflected in vivo? J. Cereal Sci. 2008, 48, 258–276. [Google Scholar] [CrossRef]
  14. Vitali, D.; Dragojević, I.V.; Šebečić, B. Effects of incorporation of integral raw materials and dietary fibre on the selected nutritional and functional properties of biscuits. Food Chem. 2009, 114, 1462–1469. [Google Scholar] [CrossRef]
  15. Quinn, R.M. Kamut®: Ancient grain, new cereal. In Perspectives on New Crops and New Uses; Janick, J., Ed.; ASHS Press: Alexandria, Egypt, 1999; pp. 182–183. [Google Scholar]
  16. Bordoni, A.; Danesi, F.; Di Nunzio, M.; Taccari, A.; Valli, V. Ancient wheat and health: A legend or the reality? A review on KAMUT khorasan wheat. Int. J. Food Sci. Nutr. 2017, 68, 278–286. [Google Scholar] [CrossRef] [Green Version]
  17. Poutanen, K.; Flander, L.; Katina, K. Sourdough and cereal fermentation in a nutritional perspective. Food Microbiol. 2009, 26, 693–699. [Google Scholar] [CrossRef]
  18. Khosravi, A.; Razavi, S.H.; Fadda, A.M. Advanced assessments on innovative methods to improve the bioaccessibility of polyphenols in wheat. Process Biochem. 2020, 88, 1–14. [Google Scholar] [CrossRef]
  19. Brandolini, A.; Castoldi, P.; Plizzari, L.; Hidalgo, A. Phenolic acids composition, total polyphenols content and antioxidant activity of Triticum monococcum, Triticum turgidum and Triticum aestivum: A two-years evaluation. J. Cereal Sci. 2013, 58, 123–131. [Google Scholar] [CrossRef]
  20. Vitaglione, P.; Napolitano, A.; Fogliano, V. Cereal dietary fibre: A natural functional ingredient to deliver phenolic compounds into the gut. Trends Food Sci. Technol. 2008, 19, 451–463. [Google Scholar] [CrossRef]
  21. Dall’Asta, M.; Bresciani, L.; Calani, L.; Cossu, M.; Martini, D.; Melegari, C.; Del Rio, D.; Pellegrini, N.; Brighenti, F.; Scazzina, F. In vitro bioaccessibility of phenolic acids from a commercial aleurone-enriched bread compared to a whole grain bread. Nutrients 2016, 8, 42. [Google Scholar] [CrossRef]
  22. Brazier-Hicks, M.; Evans, K.M.; Gershater, M.C.; Puschmann, H.; Steel, P.G.; Edwards, R. The C-glycosylation of flavonoids in cereals. J. Biol. Chem. 2009, 284, 17926–17934. [Google Scholar] [CrossRef] [PubMed] [Green Version]
  23. Courts, F.L.; Williamson, G. The occurrence, fate and biological activities of C-glycosyl flavonoids in the human diet. Crit. Rev. Food Sci. Nutr. 2015, 55, 1352–1367. [Google Scholar] [CrossRef] [PubMed] [Green Version]
  24. Wijaya, G.Y.; Mares, D.J. Apigenin di-C-glycosides (ACG) content and composition in grains of bread wheat (Triticum aestivum) and related species. J. Cereal Sci. 2012, 56, 260–267. [Google Scholar] [CrossRef]
  25. Heimler, D.; Vignolini, P.; Isolani, L.; Arfaioli, P.; Ghiselli, L.; Romani, A. Polyphenol content of modern and old varieties of Triticum aestivum L. and T. durum Desf. grains in two years of production. J. Agric. Food Chem. 2010, 58, 7329–7334. [Google Scholar] [CrossRef]
  26. Geng, P.; Sun, J.; Zhang, M.; Li, X.; Harnly, J.M.; Chen, P. Comprehensive characterization of C-glycosyl flavones in wheat (Triticum aestivum L.) germ using UPLC-PDA-ESI/HRMSn and mass defect filtering. J. Mass Spectrom. 2016, 51, 914–930. [Google Scholar] [CrossRef] [Green Version]
  27. Yu, L.; Beta, T. Identification and antioxidant properties of phenolic compounds during production of bread from purple wheat grains. Molecules 2015, 20, 15525–15549. [Google Scholar] [CrossRef] [Green Version]
  28. Hole, A.S.; Rud, I.; Grimmer, S.; Sigl, S.; Narvhus, J.; Sahlstrøm, S. Improved bioavailability of dietary phenolic acids in whole grain barley and oat groat following fermentation with probiotic Lactobacillus acidophilus, Lactobacillus johnsonii, and Lactobacillus reuteri. J. Agric. Food Chem. 2012, 60, 6369–6375. [Google Scholar] [CrossRef]
  29. Ripari, V.; Bai, Y.; Ganzle, M.G. Metabolism of phenolic acids in whole wheat and rye malt sourdoughs. Food Microbiol. 2019, 77, 43–51. [Google Scholar] [CrossRef]
  30. Dynkowska, W.M.; Cyran, M.R.; Ceglińska, A. Soluble and cell wall-bound phenolic acids and ferulic acid dehydrodimers in rye flour and five bread model systems: Insight into mechanisms of improved availability. J. Sci. Food Agric. 2015, 95, 1103–1115. [Google Scholar] [CrossRef]
  31. Skrajda-Brdak, M.; Konopka, I.; Tańska, M.; Czaplicki, S. Changes in the content of free phenolic acids and antioxidative capacity of wholemeal bread in relation to cereal species and fermentation type. Eur. Food Res. Technol. 2019, 245, 2247–2256. [Google Scholar] [CrossRef] [Green Version]
  32. Pérez-Jiménez, J.; Saura-Calixto, F. Literature data may underestimate the actual antioxidant capacity of cereals. J. Agric. Food Chem. 2005, 53, 5036–5040. [Google Scholar] [CrossRef] [PubMed] [Green Version]
  33. Campos-Vega, R.; Vázquez-Sánchez, K.; López-Barrera, D.; Loarca-Piña, G.; Mendoza-Díaz, S.; Oomah, B.D. Simulated gastrointestinal digestion and in vitro colonic fermentation of spent coffee (Coffea arabica L.): Bioaccessibility and intestinal permeability. Food Res. Int. 2015, 77, 156–161. [Google Scholar] [CrossRef]
  34. Tagliazucchi, D.; Verzelloni, E.; Bertolini, D.; Conte, A. In vitro bio-accessibility and antioxidant activity of grape polyphenols. Food Chem. 2010, 120, 599–606. [Google Scholar] [CrossRef]
  35. Vázquez-Sánchez, K.; Martinez-Saez, N.; Rebollo-Hernanz, M.; Del Castillo, M.D.; Gaytán-Martínez, M.; Campos-Vega, R. In vitro health promoting properties of antioxidant dietary fiber extracted from spent coffee (Coffee arabica L.) grounds. Food Chem. 2018, 261, 253–259. [Google Scholar] [CrossRef]
  36. Bulmer, A.C.; Ried, K.; Blanchfield, J.T.; Wagner, K.H. The anti-mutagenic properties of bile pigments. Mutat. Res. 2008, 658, 28–41. [Google Scholar] [CrossRef]
  37. Prior, R.L.; Wu, X.; Schaich, K. Standardized methods for the determination of antioxidant capacity and phenolics in foods and dietary supplements. J. Agric. Food Chem. 2005, 53, 4290–4302. [Google Scholar] [CrossRef]
  38. Danesi, F.; Pasini, F.; Caboni, M.F.; D’Antuono, L.F.; Bordoni, A.; on behalf of the BaSeFood Consortium. Traditional foods for health: Screening of the antioxidant capacity and phenolic content of selected Black Sea area local foods. J. Sci. Food Agric. 2013, 93, 3595–3603. [Google Scholar] [CrossRef]
  39. Bordoni, A.; Picone, G.; Babini, E.; Vignali, M.; Danesi, F.; Valli, V.; Di Nunzio, M.; Laghi, L.; Capozzi, F. NMR comparison of in vitro digestion of Parmigiano Reggiano cheese aged 15 and 30 months. Magn. Reson. Chem. 2011, 49, S61–S70. [Google Scholar] [CrossRef]
  40. Valli, V.; Taccari, A.; Di Nunzio, M.; Danesi, F.; Bordoni, A. Health benefits of ancient grains. Comparison among bread made with ancient, heritage and modern grain flours in human cultured cells. Food Res. Int. 2018, 107, 206–215. [Google Scholar] [CrossRef]
  41. Bohn, T.; Carriere, F.; Day, L.; Deglaire, A.; Egger, L.; Freitas, D.; Golding, M.; Le Feunteun, S.; Macierzanka, A.; Menard, O.; et al. Correlation between in vitro and in vivo data on food digestion. What can we predict with static in vitro digestion models? Crit. Rev. Food Sci. Nutr. 2018, 58, 2239–2261. [Google Scholar] [CrossRef] [Green Version]
  42. Adebo, O.A.; Gabriela Medina-Meza, I. Impact of fermentation on the phenolic compounds and antioxidant activity of whole cereal grains: A mini review. Molecules 2020, 25, 927. [Google Scholar] [CrossRef] [PubMed] [Green Version]
Sample Availability: Samples of the compounds are not available from the authors.
Figure 1. Schematic representation of the approaches used to estimate the (poly)phenolic profile (as main free PCs), the antioxidant capacity (TAC), and the total free PC content (TFPC) of the WG cookies.
Molecules 25 02792 g001
Figure 2. Total free PC content (TFPC) of buffer and hydroalcoholic extracts and <3 kDa digested fractions of the experimental cookies. TFPC represents the sum of total free PCs determined by uHPLC-MSn and is expressed as µg/g of cookie. Values are expressed as mean ± SD (n = 4 for extracts, n = 3 for digested samples). Statistical analysis was by two-way ANOVA followed by Tukey’s HSD test. Within each cookie type, different letters indicate statistical significance among samples (p < 0.05).
Molecules 25 02792 g002
Figure 3. Total antioxidant capacity (TAC) of buffer and hydroalcoholic extracts and <3 kDa digested fractions of the experimental cookies. Values are expressed as mean ± SD (n = 3). Statistical analysis was by two-way ANOVA followed by Tukey’s HSD test. Within each cookie type, different letters indicate statistical significance among samples (p < 0.05).
Molecules 25 02792 g003
Table 1. Chromatographic and mass spectral characteristics of the free PCs identified in the experimental cookies.
CompoundRT[M − H]
(m/z)
MS2 ions
(m/z)
Phenolic Acids
p-Hydroxybenzoic acid5.813793
p-Coumaric acid9.5163119
Caffeic acid7.7179135
Ferulic acid10.3193149, 178, 134
Sinapic acid10.6223208, 179, 164
Sinapic acid isomer10.8223208, 164, 179
Flavones
Apigenin-C-hexoside-C-pentoside9.9563473, 443, 503, 545, 383, 353
Apigenin-C-hexoside-C-pentoside10.4563473, 443, 503, 545, 383, 353
Apigenin-C-hexoside-C-pentoside (1st)10.6563473, 443, 503, 545, 383, 353
Apigenin-C-hexoside-C-pentoside (2nd)11.1563473, 443, 503, 545, 383, 353
Apigenin-C-hexoside-C-pentoside12.1563473, 443, 503, 545, 383, 353
Apigenin-C-hexoside-C-pentoside12.4563473, 443, 503, 545, 383, 353
Apigenin-C-hexoside-C-hexoside (1st)9.7593473, 503, 353, 575, 383
Apigenin-C-hexoside-C-hexoside (2nd)10.1593473, 503, 353, 575, 383, 533
Apigenin-C-hexoside-O-hexoside10.8593431, 473, 311, 503, 341, 413, 383
Apigenin-C-hexoside-C-hexoside (3rd)11.6593473, 503, 383, 575, 413, 533
Luteolin-O-rutinoside12.6593285; MS3(285): 241, 175, 199, 217, 243, 197
RT: retention time. m/z: mass-to-charge ratio. The quantified PCs are reported in bold.
Table 2. Concentration of the main free PCs in the experimental cookies prepared using standard fermentation. Values are expressed as mean values ± SD (n = 4 for extracts, n = 3 for digested samples). The statistical analysis was performed using one-way ANOVA followed by Tukey’s honest significant difference (HSD) test. For each cookie type, different letters in the same row indicate statistical significance (p < 0.05).
CompoundDURS (µg/g of Cookie)KHOS (µg/g of Cookie)KAMS (µg/g of Cookie)
Buffer ExtractHydroalcoholic Extract<3 kDa Digested FractionBuffer ExtractHydroalcoholic Extract<3 kDa Digested FractionBuffer ExtractHydroalcoholic Extract<3 kDa Digested Fraction
Apigenin-C-hex-C-pen (1st)0.28 ± 0.07c23.14 ± 1.67b30.43 ± 2.29a0.17 ± 0.02c13.68 ± 0.22b17.73 ± 0.66a0.05 ± 0.06c6.71 ± 0.19b10.70 ± 0.36a
Apigenin-C-hex-C-pen (2nd)0.80 ± 0.09c54.19 ± 3.02b73.87 ± 0.50a0.61 ± 0.09c36.09 ± 0.68b49.84 ± 0.84a0.19 ± 0.06c15.78 ± 0.24b26.65 ± 0.15a
Apigenin-C-dihex (1st)nd0.55 ± 0.05b2.02 ± 0.15and0.56 ± 0.02b1.25 ± 0.02and0.20 ± 0.01nd
Apigenin-C-dihex (2nd)nd1.84 ± 0.10b2.38 ± 0.02and0.79 ± 0.04ndnd0.32 ± 0.00nd
Apigenin-C-dihex (3rd)nd1.91 ± 0.02ndnd0.37 ± 0.02ndnd0.16 ± 0.01nd
p-Hydroxybenzoic acid0.40 ± 0.08a0.25 ± 0.02bnd0.59 ± 0.09a0.32 ± 0.03bnd0.27 ± 0.05a0.18 ± 0.03bnd
p-Coumaric acid0.52 ± 0.03b0.45 ± 0.02b0.64 ± 0.06a0.96 ± 0.10a,b0.78 ± 0.03b1.07 ± 0.15a0.17 ± 0.03c0.22 ± 0.00b0.41 ± 0.02a
Caffeic acidnd0.13 ± 0.01ndnd0.11 ± 0.00nd0.05 ± 0.02a0.05 ± 0.00and
Ferulic acid1.38 ± 0.11b4.72 ± 0.17a,b4.24 ± 0.79a1.14 ± 0.19b4.80 ± 0.08a,b5.30 ± 1.21and3.11 ± 0.05a3.40 ± 0.35a
Sinapic acid isomersnd0.65 ± 0.04ndnd0.38 ± 0.04ndnd0.52 ± 0.07nd
nd: not detected; hex: hexoside; pen: pentoside; dihex: dihexoside.
Table 3. Concentration of the main free PCs in the experimental cookies prepared using sourdough fermentation. Values are expressed as mean values ± SD (n = 4 for the chemical extracts, n = 3 for the digested samples). The statistical analysis was performed using one-way ANOVA followed by Tukey’s HSD test. For each cookie type, different letters in the same row indicate statistical significance (p < 0.05).
CompoundDURL (µg/g of Cookie)KHOL (µg/g of Cookie)KAML (µg/g of Cookie)
Buffer ExtractHydroalcoholic Extract<3 kDa Digested FractionBuffer ExtractHydroalcoholic Extract<3 kDa Digested FractionBuffer ExtractHydroalcoholic Extract<3 Kda Digested Fraction
Apigenin-C-hex-C-pen (1st)1.31 ± 1.18c15.71 ± 0.32b31.47 ± 1.32a0.17 ± 0.04c9.54 ± 0.45b17.21 ± 0.23and7.73 ± 0.46b10.77 ± 0.29a
Apigenin-C-hex-C-pen (2nd)3.73 ± 3.49c36.26 ± 1.02b81.38 ± 0.20a0.56 ± 0.09c26.57 ± 0.33b49.37 ± 1.15a0.20 ± 0.02c18.22 ± 1.00b25.86 ± 0.14a
Apigenin-C-dihex (1st)nd0.34 ± 0.02b2.06 ± 0.17and0.38 ± 0.03b1.05 ± 0.07and0.23 ± 0.01nd
Apigenin-C-dihex (2nd)nd1.09 ± 0.03ndnd0.55 ± 0.01ndnd0.38 ± 0.03nd
Apigenin-C-dihex (3rd)nd1.23 ± 0.02b2.35 ± 0.24and0.27 ± 0.03ndnd0.18 ± 0.02nd
p-Hydroxybenzoic acid0.76 ± 0.12a0.41 ± 0.01bnd1.36 ± 0.14a0.66 ± 0.01bnd0.79 ± 0.07a0.64 ± 0.04bnd
p-Coumaric acid0.76 ± 0.6a0.60 ± 0.03a1.07 ± 0.02a1.91 ± 0.19b1.44 ± 0.03c2.49 ± 0.08a0.06 ± 0.00b0.08 ± 0.01and
Caffeic acidnd0.24 ± 0.01ndnd0.34 ± 0.01ndnd0.08 ± 0.00nd
Ferulic acid14.55 ± 1.85b12.34 ± 0.26b20.21 ± 1.44a0.59 ± 0.16c13.03 ± 0.45b21.31 ± 0.26and3.34 ± 0.16b4.31 ± 0.17a
Sinapic acid isomersnd1.76 ± 0.05a1.69 ± 0.12and1.17 ± 0.07ndnd0.88 ± 0.06nd
nd: not detected; hex: hexoside; pen: pentoside; dihex: dihexoside.