Article

The Combination of MoS2/WO3 and Its Adsorption Properties of Methylene Blue at Low Temperatures

1
College of Chemical Engineering, Zhejiang University of Technology, Hangzhou 310014, China
2
Research Center of Analysis and Measurement, Zhejiang University of Technology, Hangzhou 310014, China
*
Author to whom correspondence should be addressed.
Molecules 2020, 25(1), 2; https://doi.org/10.3390/molecules25010002
Submission received: 15 November 2019 / Revised: 10 December 2019 / Accepted: 16 December 2019 / Published: 18 December 2019
(This article belongs to the Section Materials Chemistry)

Abstract

:
It was found previously that neither monomer MoS2 nor WO3 is an ideal material for the adsorption of organic dyes, while MoS2/WO3 composites synthesized by a two-step hydrothermal method have outstanding adsorption effects. In this work, the chemical state of each element was found to be changed after combination by X-ray photoelectron spectroscopy analysis, which lead to their differences in adsorption performance. Moreover, the adsorption test of methylene blue on MoS2/WO3 composites was carried out under a series of temperatures, showing that the prepared composites also had appreciable adsorption rates at lower temperatures. The adsorption process could be well described by the Freundlich isothermal model and the pseudo-second order model. In addition, the particle-internal diffusion model simulation revealed that the internal diffusion of the particles played an important role in the whole adsorption process.

Graphical Abstract

1. Introduction

With the development of some chemical industries, such as textile, leather, paper, plastics, more and more organic dyes are used in the manufacturing process in order to color the products and also consume a substantial volume of water. As a result, a lot of organic dye wastewater has been produced [1]. According to relevant statistics, more than 100,000 dyes have been produced each year, and the total production exceeds 7 × 10⁵ tons. Even if the content of organic dyes in the water is less than 1/1,000,000, it can cause uneasiness [2]. Methylene blue (MB) is an azo dye often used in printing and dyeing textiles. It is also frequently used as a pH control for chemical reactions in the laboratory, industry, and agriculture. MB is a micro-toxic type, so a large amount of oral administration can cause abdominal discomfort, skin eczema, and have irritating effects on the eyes. Therefore, it is meaningful to treat wastewater containing MB [3]. At present, there are many physical, chemical, and biological methods used in the treatment of organic dye wastewater, such as flocculation precipitation [4], hydrogen peroxide treatment [5], and photo electrocatalytic degradation [6,7]. Chemical adsorption is a method of adsorbing nonionic organic refractory compounds in dye wastewater [8]. Because of its simple operation and low cost, more and more attention has been paid to the chemical adsorption in dye wastewater. The development of efficient adsorbents is the key to improving adsorption efficiency. Nowadays, the commonly used adsorbents in the adsorption field are carbon, minerals, chitosan, and other organic compounds.
MoS2 is a new graphene-like material. Its layered structure is sandwiched together by Mo–S–Mo units with a weak van der Waals force [9], and the direct band gap is 1.82 eV [10]. This unique structure gives MoS2 stable chemical properties, an adjustable band gap, a large specific surface area, and an abundant layered edge to provide a large number of unsaturated active sites [11]. Therefore, MoS2 is expected to become a high-performance adsorbent. In addition, by controlling the preparation parameters and methods, the morphology and number of layers of the MoS2 can be adjusted, and heterojunctions can be constructed to expose more active edge sites for adsorption. Sabarinathan et al. used the hydrothermal method to synthesize layered MoS2 with citric acid as an auxiliary additive [12]. It was found that an appropriate amount of citric acid induced the growth of the original MoS2 microspheres into a well dispersed layered structure. With the appearance of such a dispersed layered structure, the photocatalytic performance of MoS2 for methylene blue was more excellent. Hou et al. prepared MoS2/WO3 composite semiconductor photocatalysts successfully by the hydrothermal method and studied the photocatalytic performance on MB [13]. After compounding with tungsten oxide, the photocatalytic effect of MoS2 on MB was better than that of pure tungsten oxide and molybdenum disulfide. Unfortunately, the reaction still took a long time to complete and there were certain restrictions, such as the use of visible light. Moreover, the studies only focused on transferring photo-induced electrons but ignored capturing the holes. Therefore, it is essential to introduce a reasonable bandgap-matchable semiconductor material as a template to construct an MoS2-coated system, which can provide holes for trapping electrons [14,15,16,17,18,19], facilitating charge transfer and thus enhancing adsorption ability.
In our previous work, the MoS2/WO3 heterojunction was successfully synthesized by a two-step hydrothermal method using rod-like tungsten oxide as a template, and the adsorption performance under dark conditions at room temperature was proven to be excellent. For further investigation, in this work, X-ray photoelectron spectroscopy (XPS) was used to study the combination of MoS2 and WO3. Considering the practical situation of application, the adsorption performance of the composites under a series of temperatures was also investigated. Furthermore, the adsorption mechanism was also discussed by the adsorption thermodynamics and kinetic simulation.

2. Results and Discussion

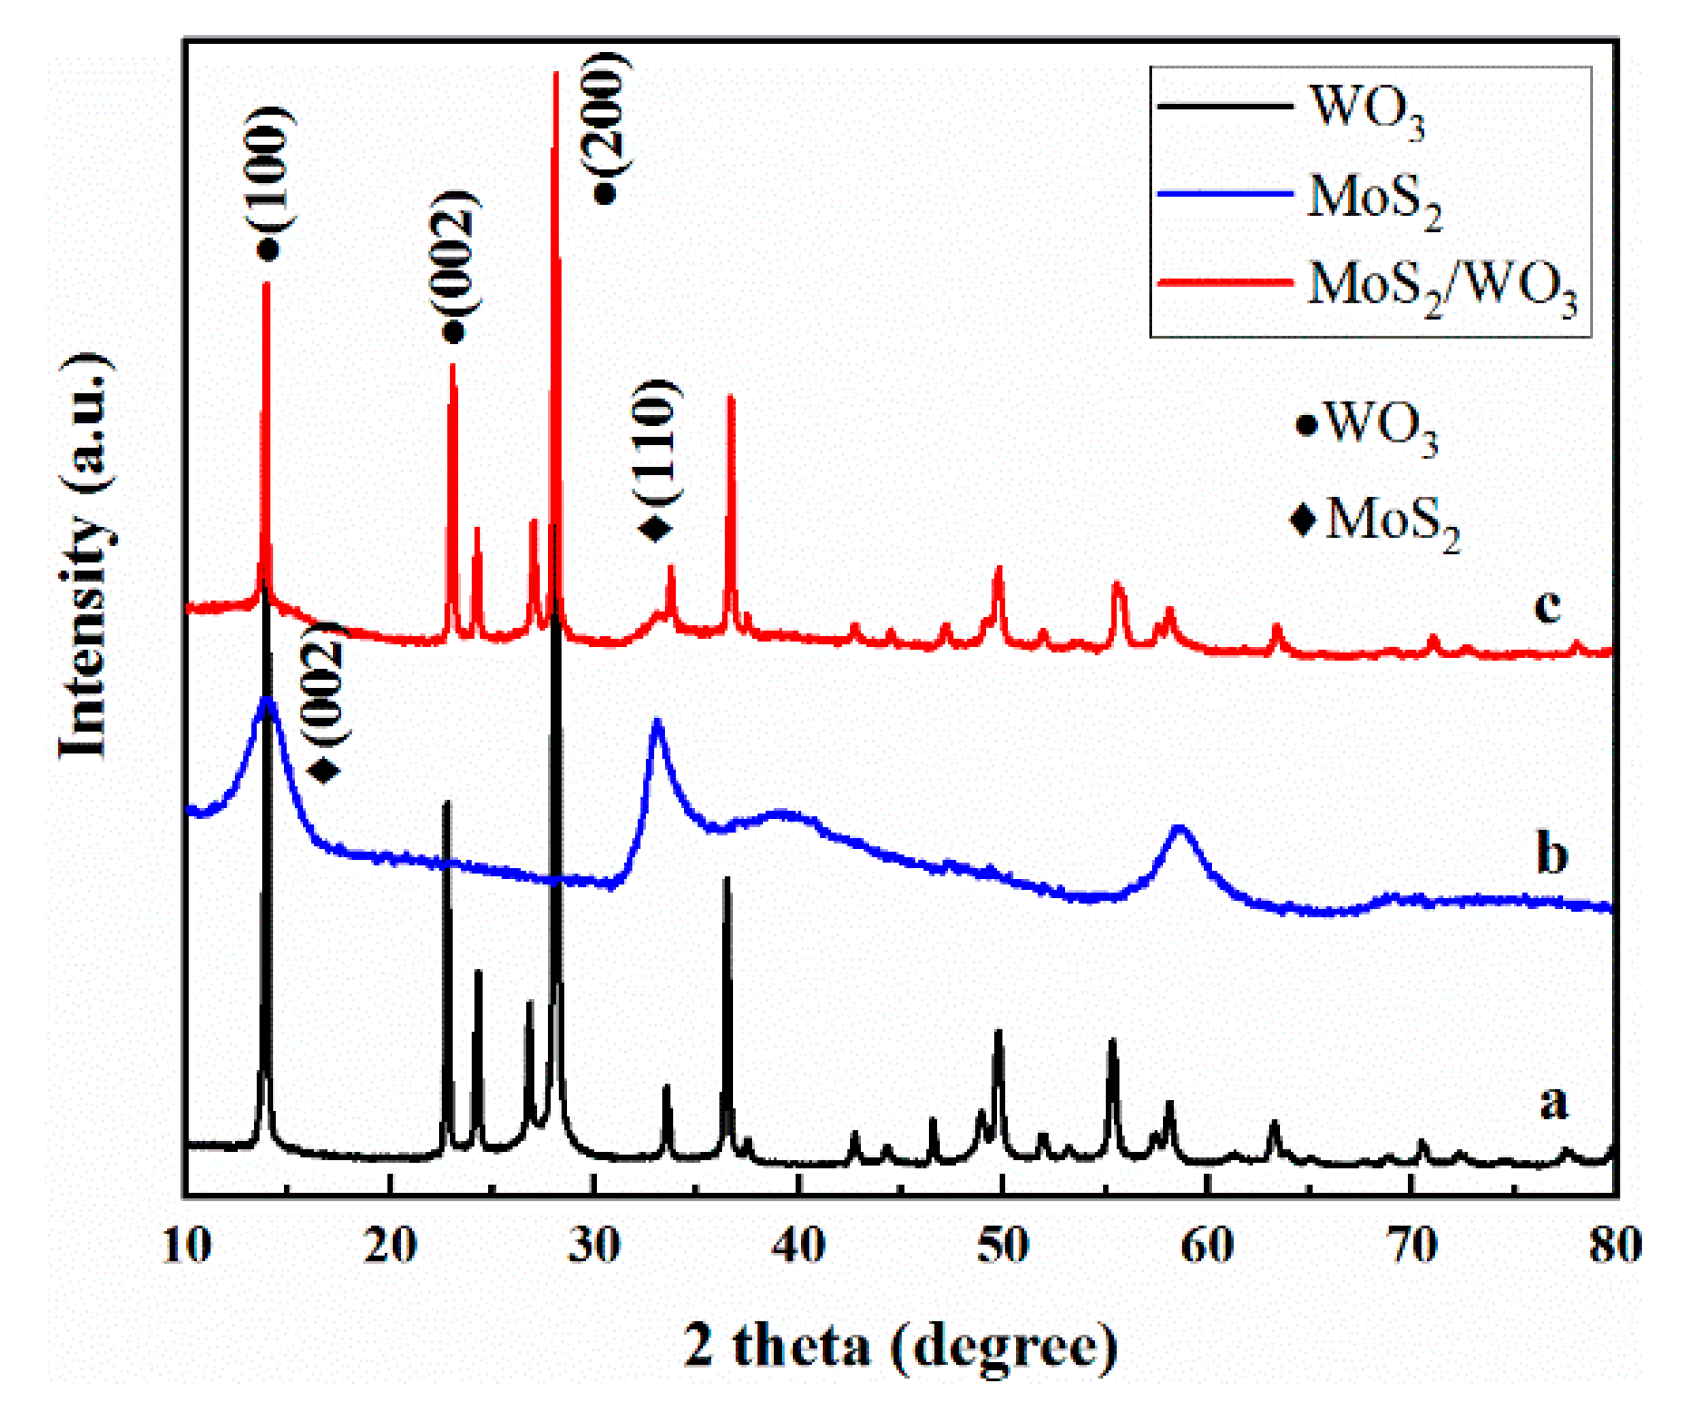
2.1. The Phase of Samples

The crystal phases of the obtained samples were investigated by X-ray diffraction (XRD) analysis. The corresponding XRD patterns of WO3, MoS2, and MoS2/WO3 are presented in Figure 1. It can be seen that all diffraction peaks of pattern c were well indexed to WO3 (Joint Committee on Powder Diffraction Standards, JCPDS No. 75-2187) and MoS2 (JCPDS No. 17-0744), which preliminarily indicates that the MoS2/WO3 composites were successfully produced.

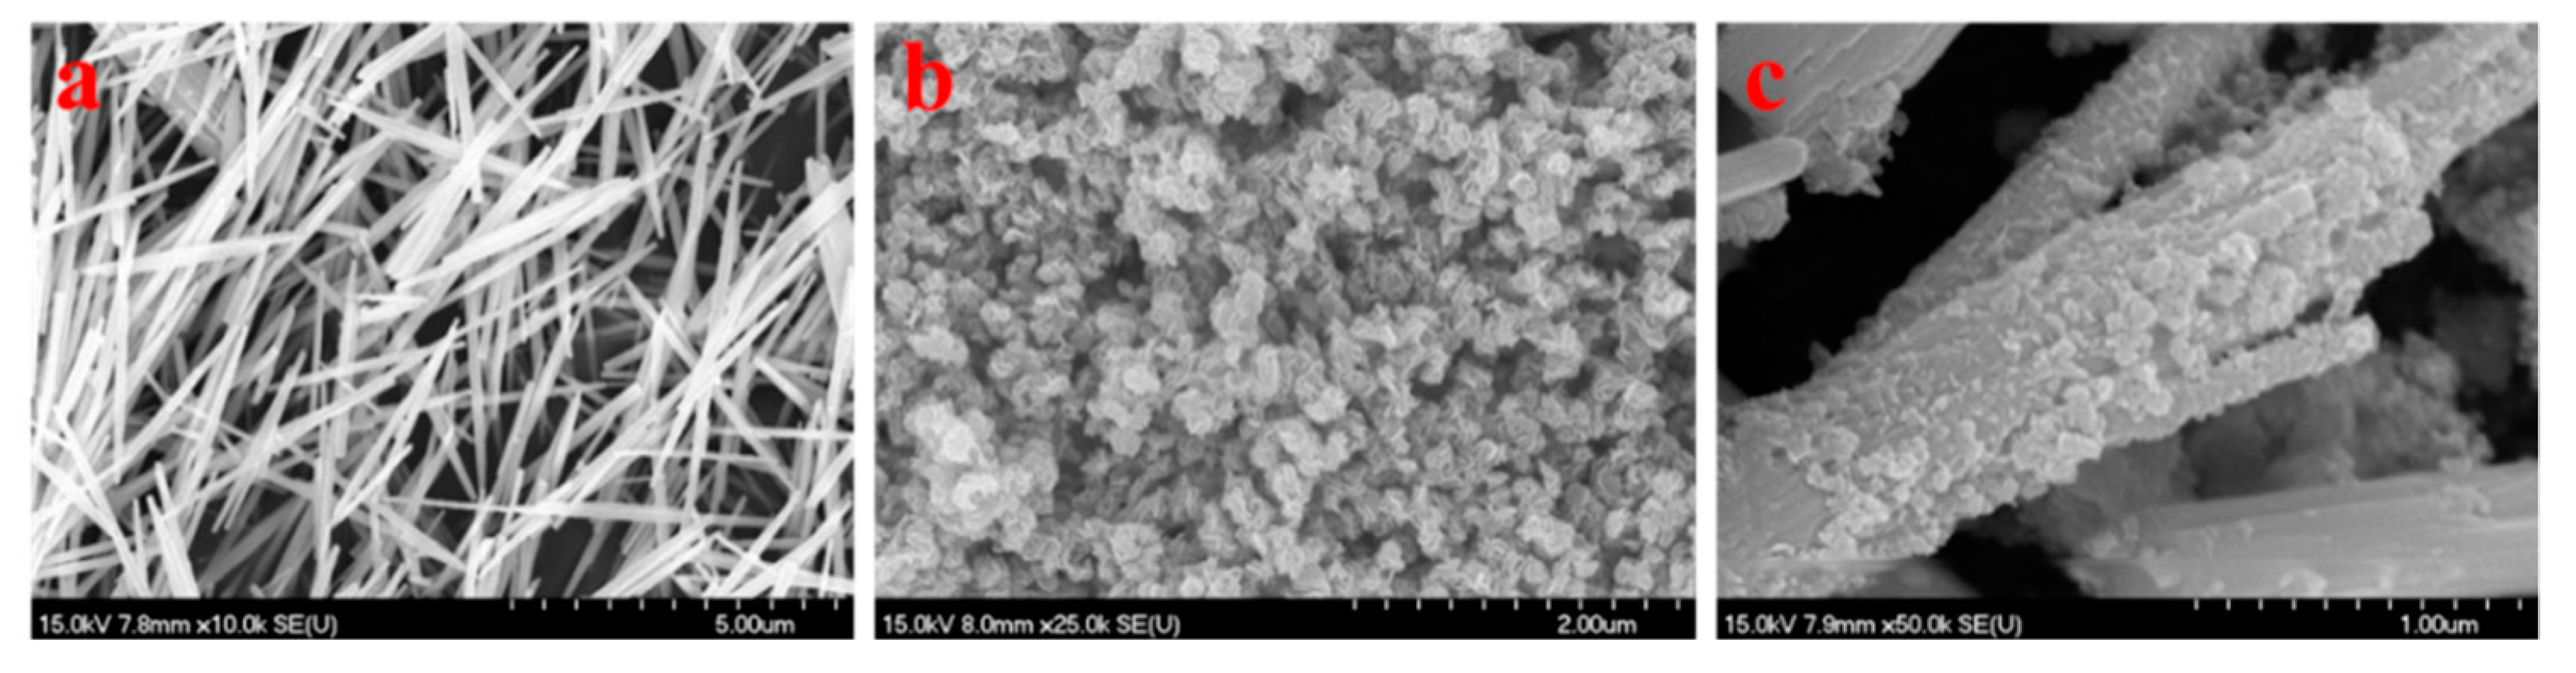
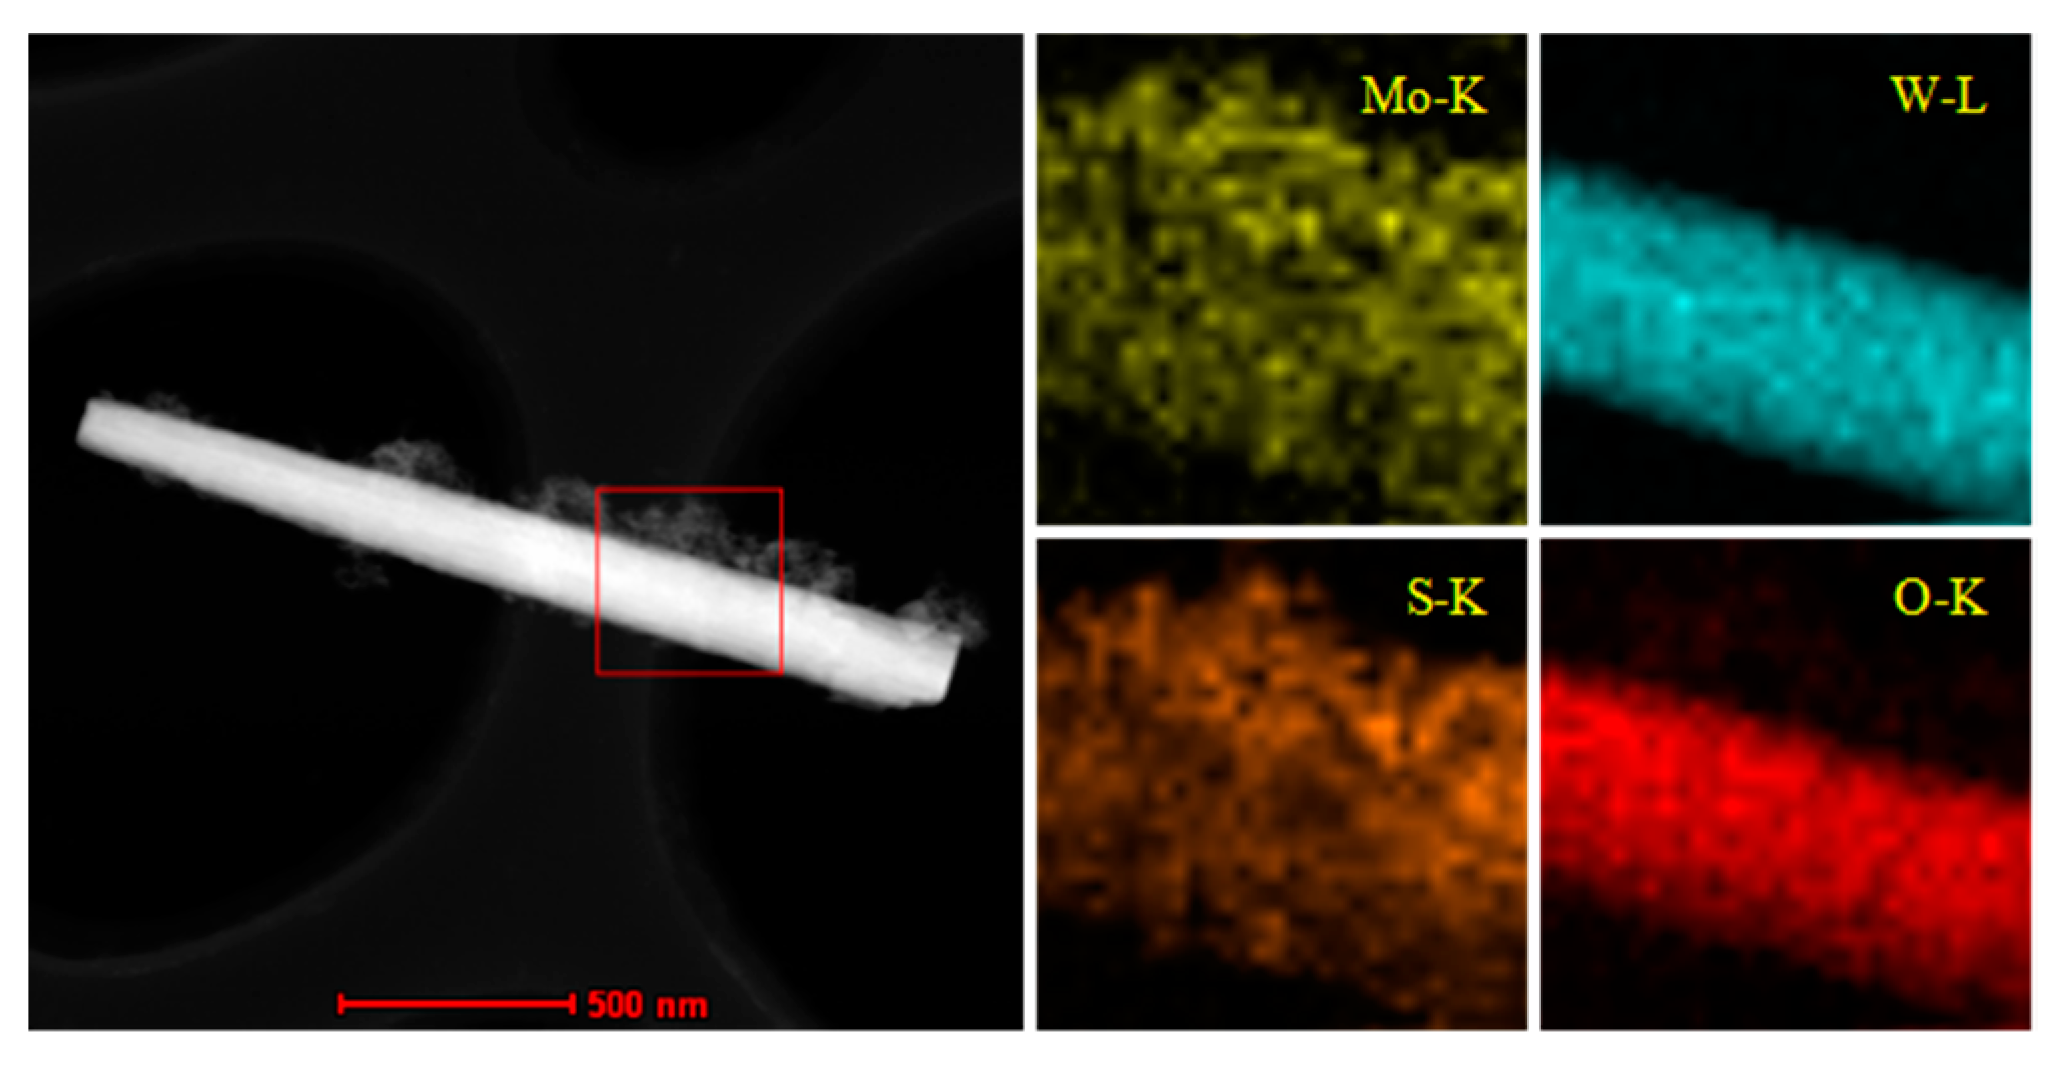
2.2. The Morphology of Samples

Figure 2a shows the SEM images of WO3, which exhibited a uniform rod-like structure randomly oriented with a length of a few microns or more. As shown in Figure 2c, after reacting for 24 h, there were interlaced MoS2 sheets dispersed on the WO3 nanorods, expanding the diameter of the nanorods. Moreover, a porous, discontinuous, and loose surface could be found in MoS2/WO3 (Figure 2c). It is this unique structure that leads to the excellent adsorption capacity of MoS2/WO3 composites, which has already been discussed by Ying et al. [20]. Besides this, the SEM image of MoS2 prepared without adding WO3 as a template under the same conditions is shown in Figure 2b, which indicates that the product exhibited microspheres formed by sheet-like subunits. Simultaneously, the element mapping of as-prepared MoS2/WO3 sample in Figure 3 showed a uniform distribution of Mo and S on the surface of W and O, which further proves that the coating composites were formed.

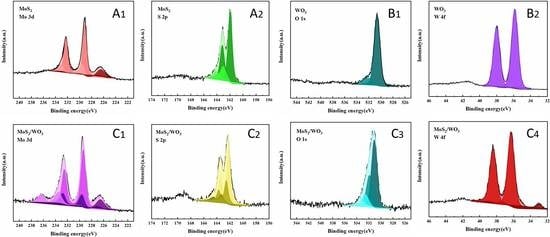
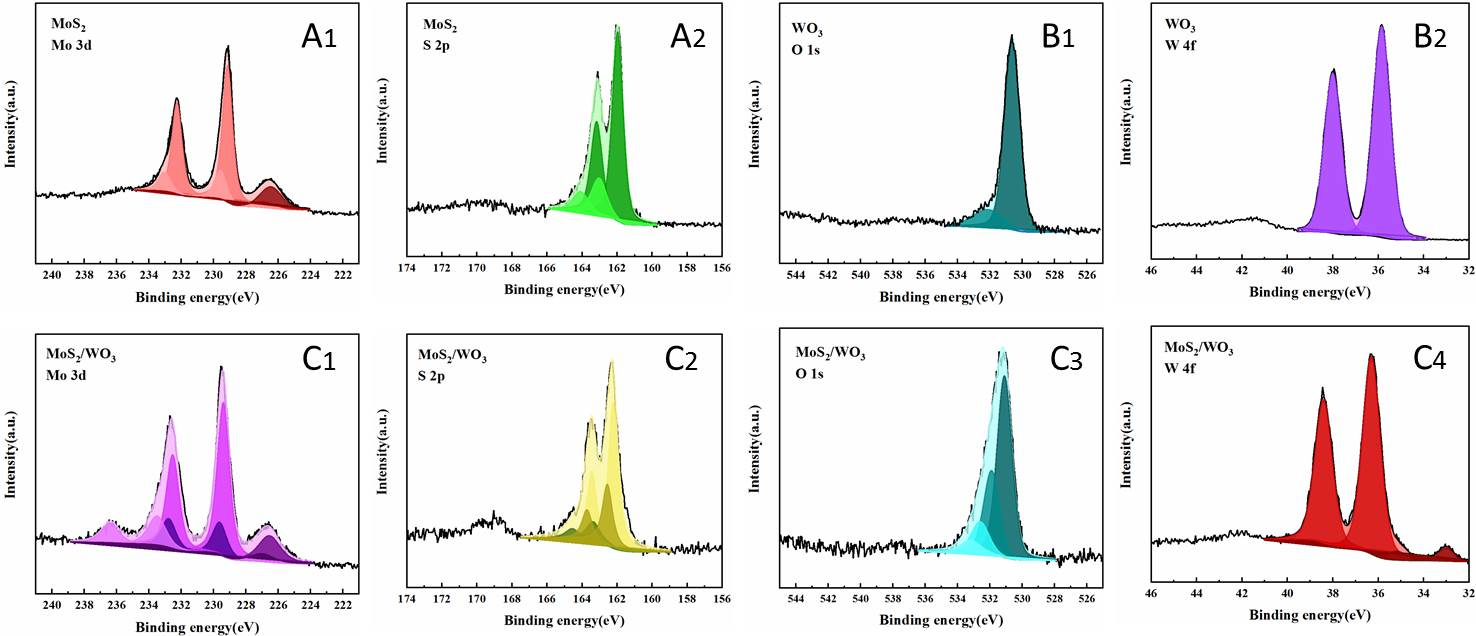
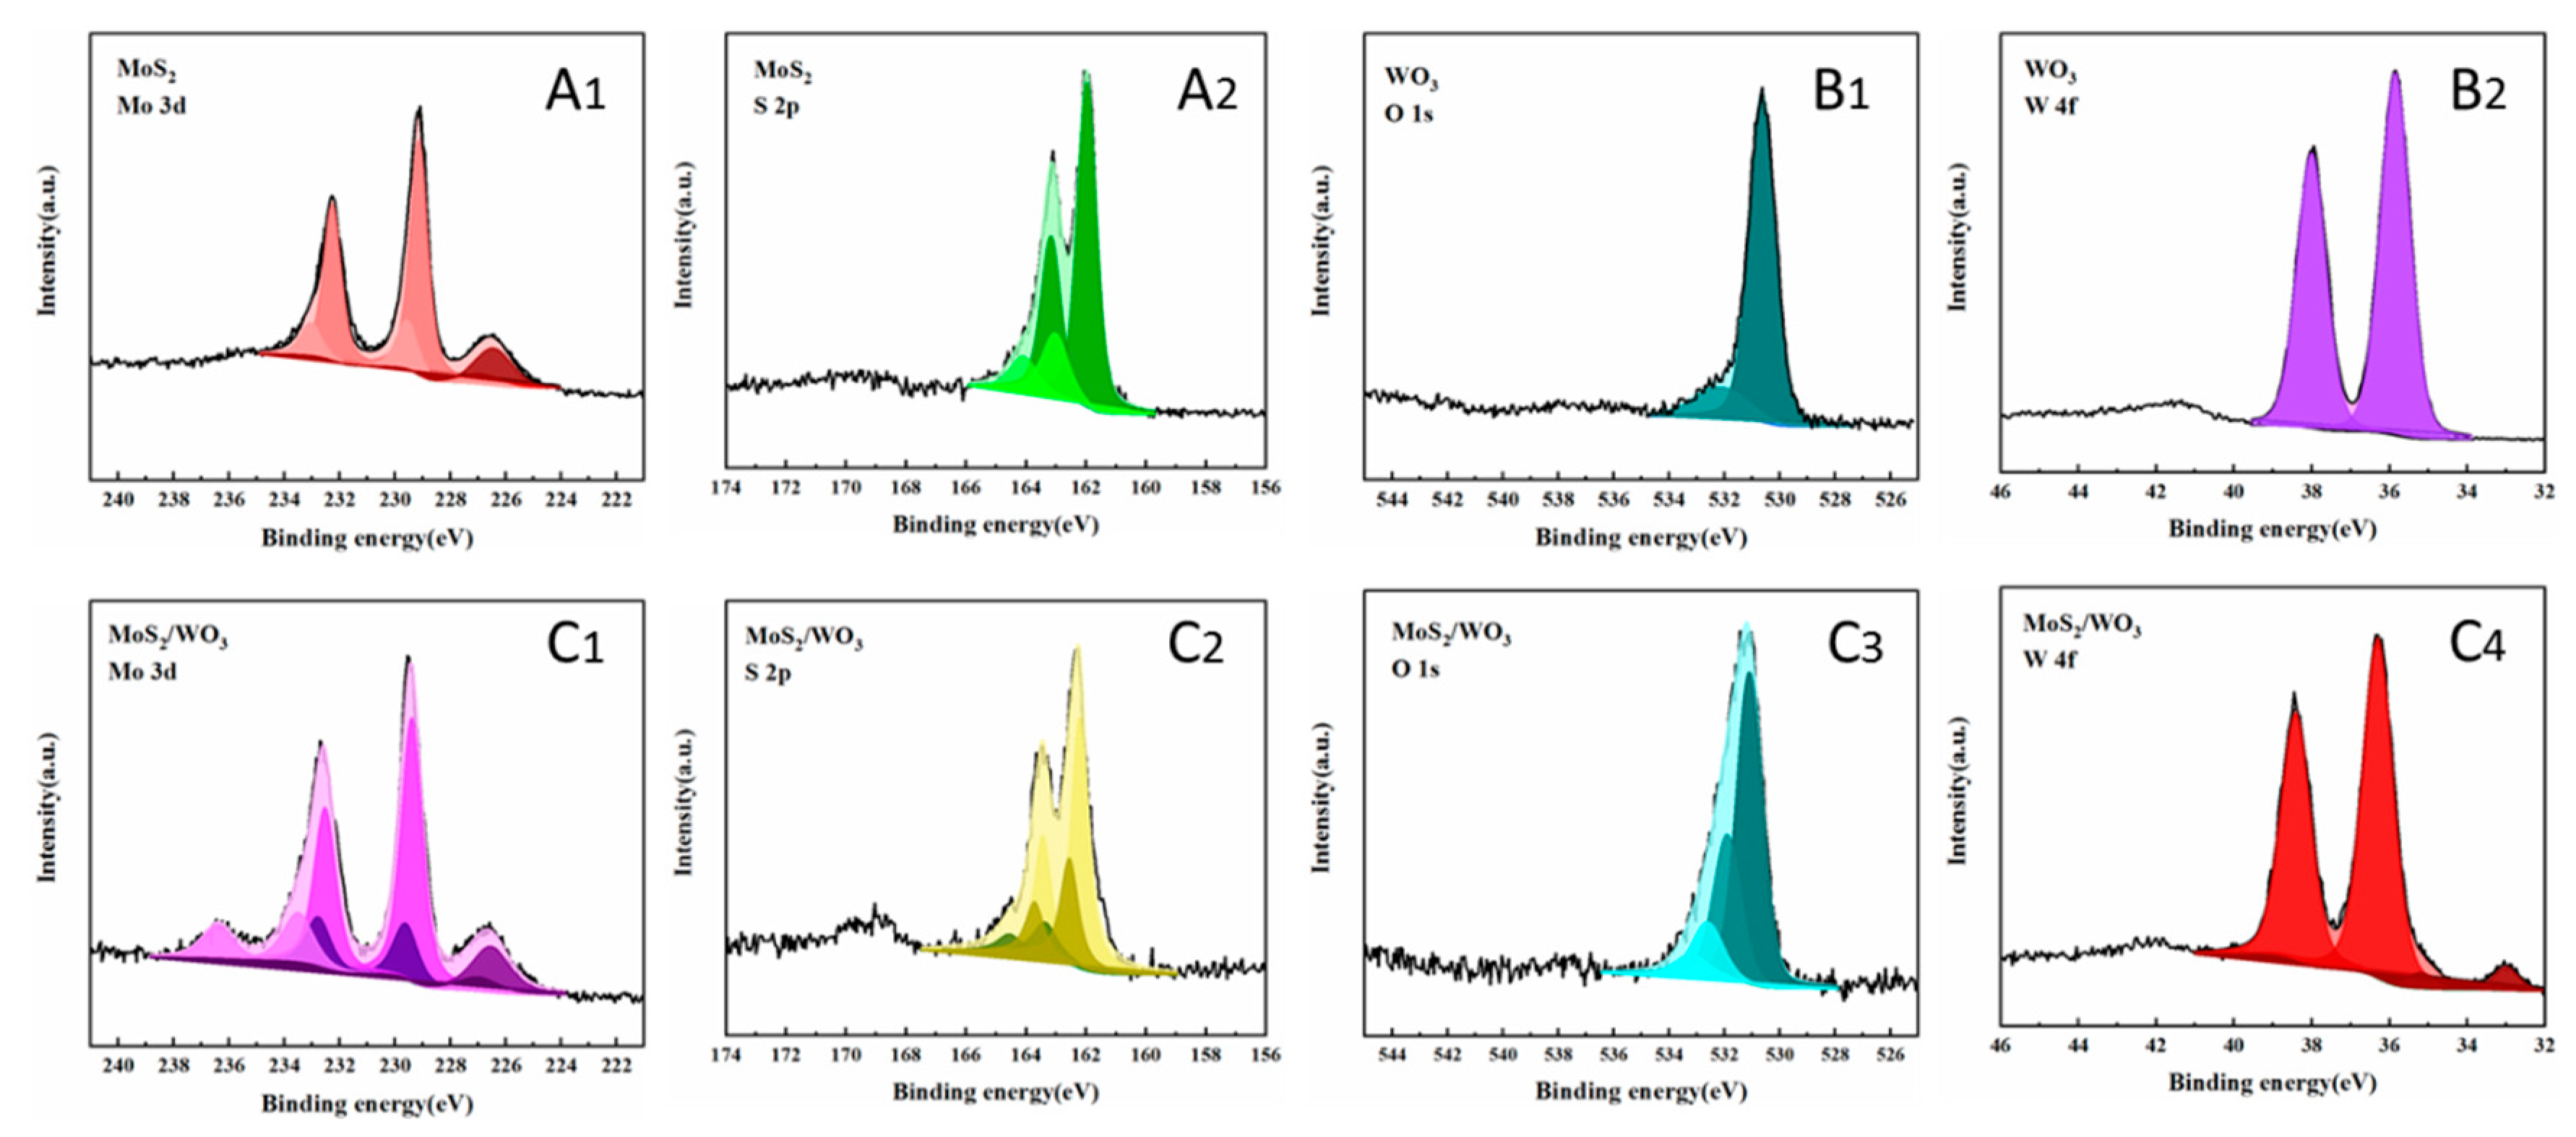
2.3. The Elemental Chemical States Analysis of Samples

As is known, the adsorption reaction is closely related to the surface state of the sample and the interface of the catalysts. Thus, it is significant to investigate the surface states of obtained samples by XPS measurements. The XPS results are presented in Figure 4. As for Mo3d in MoS2, shown in Figure 4A1, two obvious peaks appeared at 229.2 eV and 232.3 eV, which were attributed to Mo 3d5/2 and Mo 3d3/2, and the pair of peaks at higher binding energies (229.6 eV and 233.2 eV) demonstrates that there is no-metric ratio MoSx in mono MoS2. Comparably, two peaks of Mo 3d5/2 and Mo 3d3/2 in MoS2/WO3 (Figure 4C1) were slightly shifted to higher binding energies (about 0.3 eV). This suggests that there are strong electronic interactions between MoS2 and WO3 domains through established heterogeneous interfaces [21,22]. In addition, the pair of peaks in Figure 4C1 at about 233.5 eV and 236.4 eV, corresponding to Mo 3d5/2 and Mo 3d3/2, suggests the presence of Mo6+. Comparing O 1s in WO3 before and after combination, the peaks at 527.4 eV (Figure 4B1) and 531.1 eV (Figure 4C3) indicate the formation of W–O binding. After combination, a new peak was found in 531.9 eV, which means there was a new chemical bond generated. This peak can be attributed to O2− in the Mo–O bond, which is in agreement with the results of Mo 3d in MoS2/WO3. Cui et al. proved that with the increase in MoO3 composition in the transformation of MoS2 to MoO3, the product showed better adsorption capacity [23]. Besides, the peaks at the binding energy of 529.0 eV in Figure 4B1 and 532.6 eV in Figure 4C3 were both due to the adsorbed O on the surface of the samples. In Figure 4C4, the peaks at about 36.3 eV and 35.2 eV of W 4f7/2 suggest the formation of W–O and W–S bindings. S 2p spectra in the obtained samples (Figure 4A2 and Figure 4C2) could be deconvoluted into three pairs of peaks (S 2p3/2, S 2p1/2), corresponding to MoS2, MoSx, and W–S–Mo respectively. The S 2p3/2 peak was attributed to the typical metal-S bond, while the S 2p1/2 peak was corresponding to the sulfur with low coordination, which is generally related to sulfur defects [24,25]. W–S and Mo–S have a similar structure, so it is usually assumed that tungsten catalysts are similar to molybdenum catalysts. At the edge of this layered structure, the sulfur vacancies, which are active sites for catalytic reactions, are easily created because of the weaker sulfur bonding [26]. The semi-quantitative data of Mo–O and W–S were obtained by XPS data fitting results. Within the range of measurement on the surface of the sample, the Mo–O accounted for 10% of the total and the W–S accounted for 5%. Consequently, we conjectured that the formation of the W–S–Mo and Mo–O–W structures promotes the MoS2 layers being more tightly coated on WO3 nanorods, which is beneficial for increasing the specific surface area in favor of adsorption.
In short, the peaks of Mo3d, S2p, O1s, and W4f all shifted to higher binding energies after combination, indicating that there are strong electronic interactions between MoS2 and WO3. There were new bonds of Mo–O and W–S generated, suggesting the chemical combination of MoS2 and WO3. Therefore, this results in the high stability of MoS2/WO3 composites. Moreover, as discussed above, the S 2p1/2 peak revealed the presence of terminal unsaturated S atoms on the Mo–S and W–S sites. Consequently, associated with SEM, TEM, and XPS analysis, the as-synthesized MoS2/WO3 composites were proved to possess a porous nanostructure and defected interface of rich active sites and are expected to achieve excellent adsorption performances.
The details of this unique structure affecting its adsorption property has been discussed in our previous work [20]. In addition, the Zeta potentials of MoS2/WO3 were measured and are shown in Figure S1 of the supplemental information, which demonstrates that the adsorbents dispersed in water must have large negative Zeta potentials (−29.3 mV) to have an electrostatic interaction with MB, which has positive charges located on the heteroatom ring. This is another reason why the MoS2/WO3 composites have an impressive adsorption property on MB.

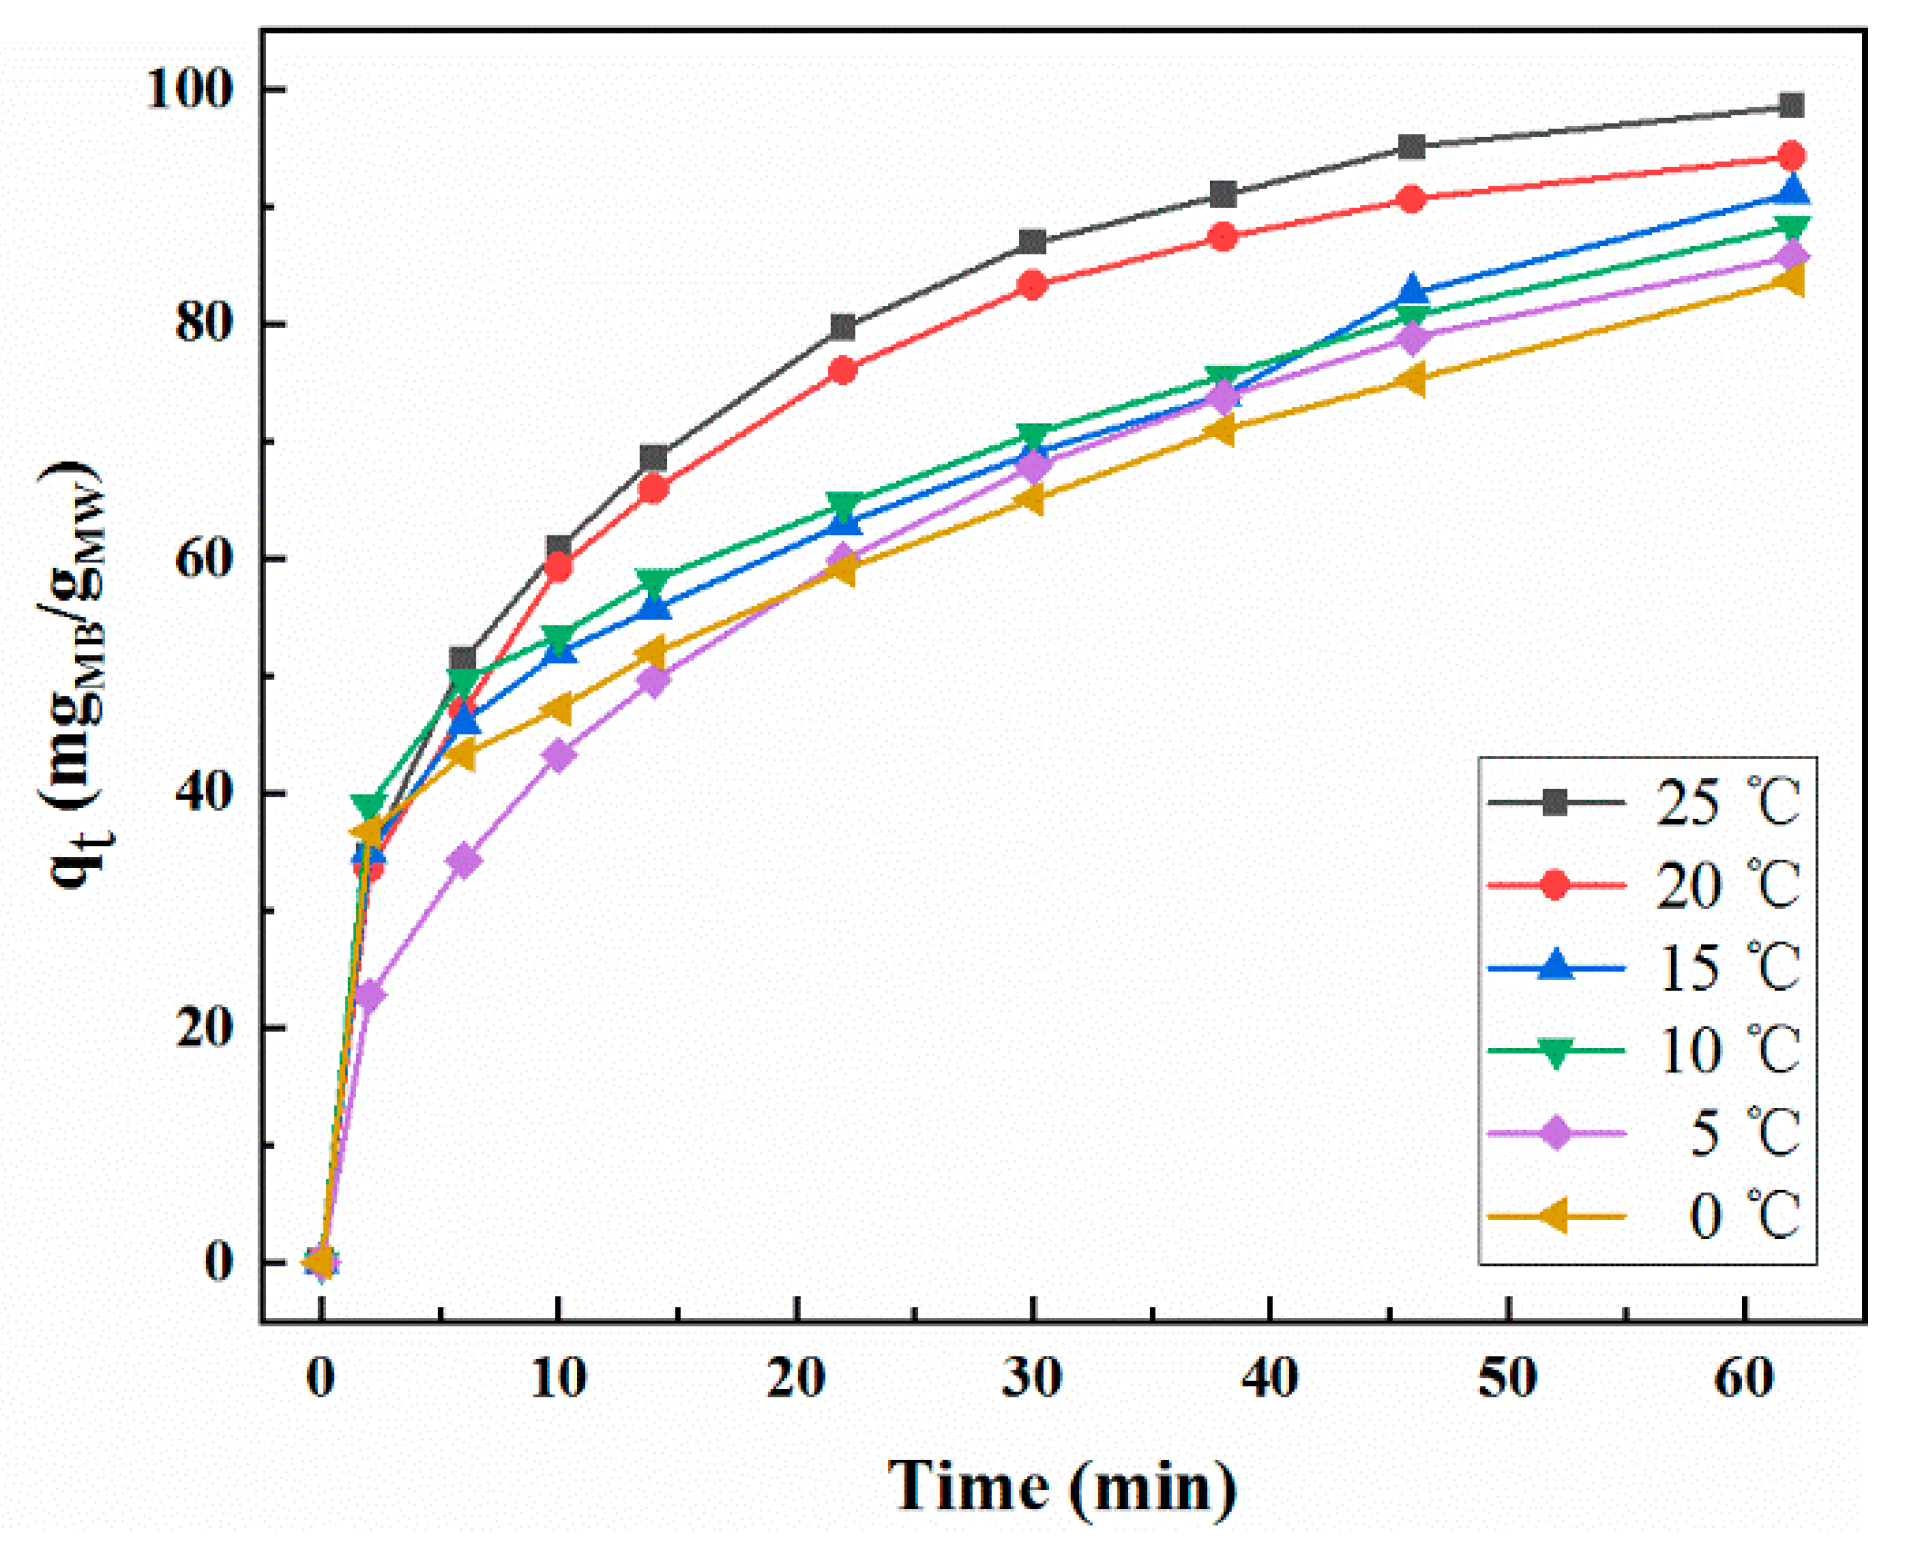
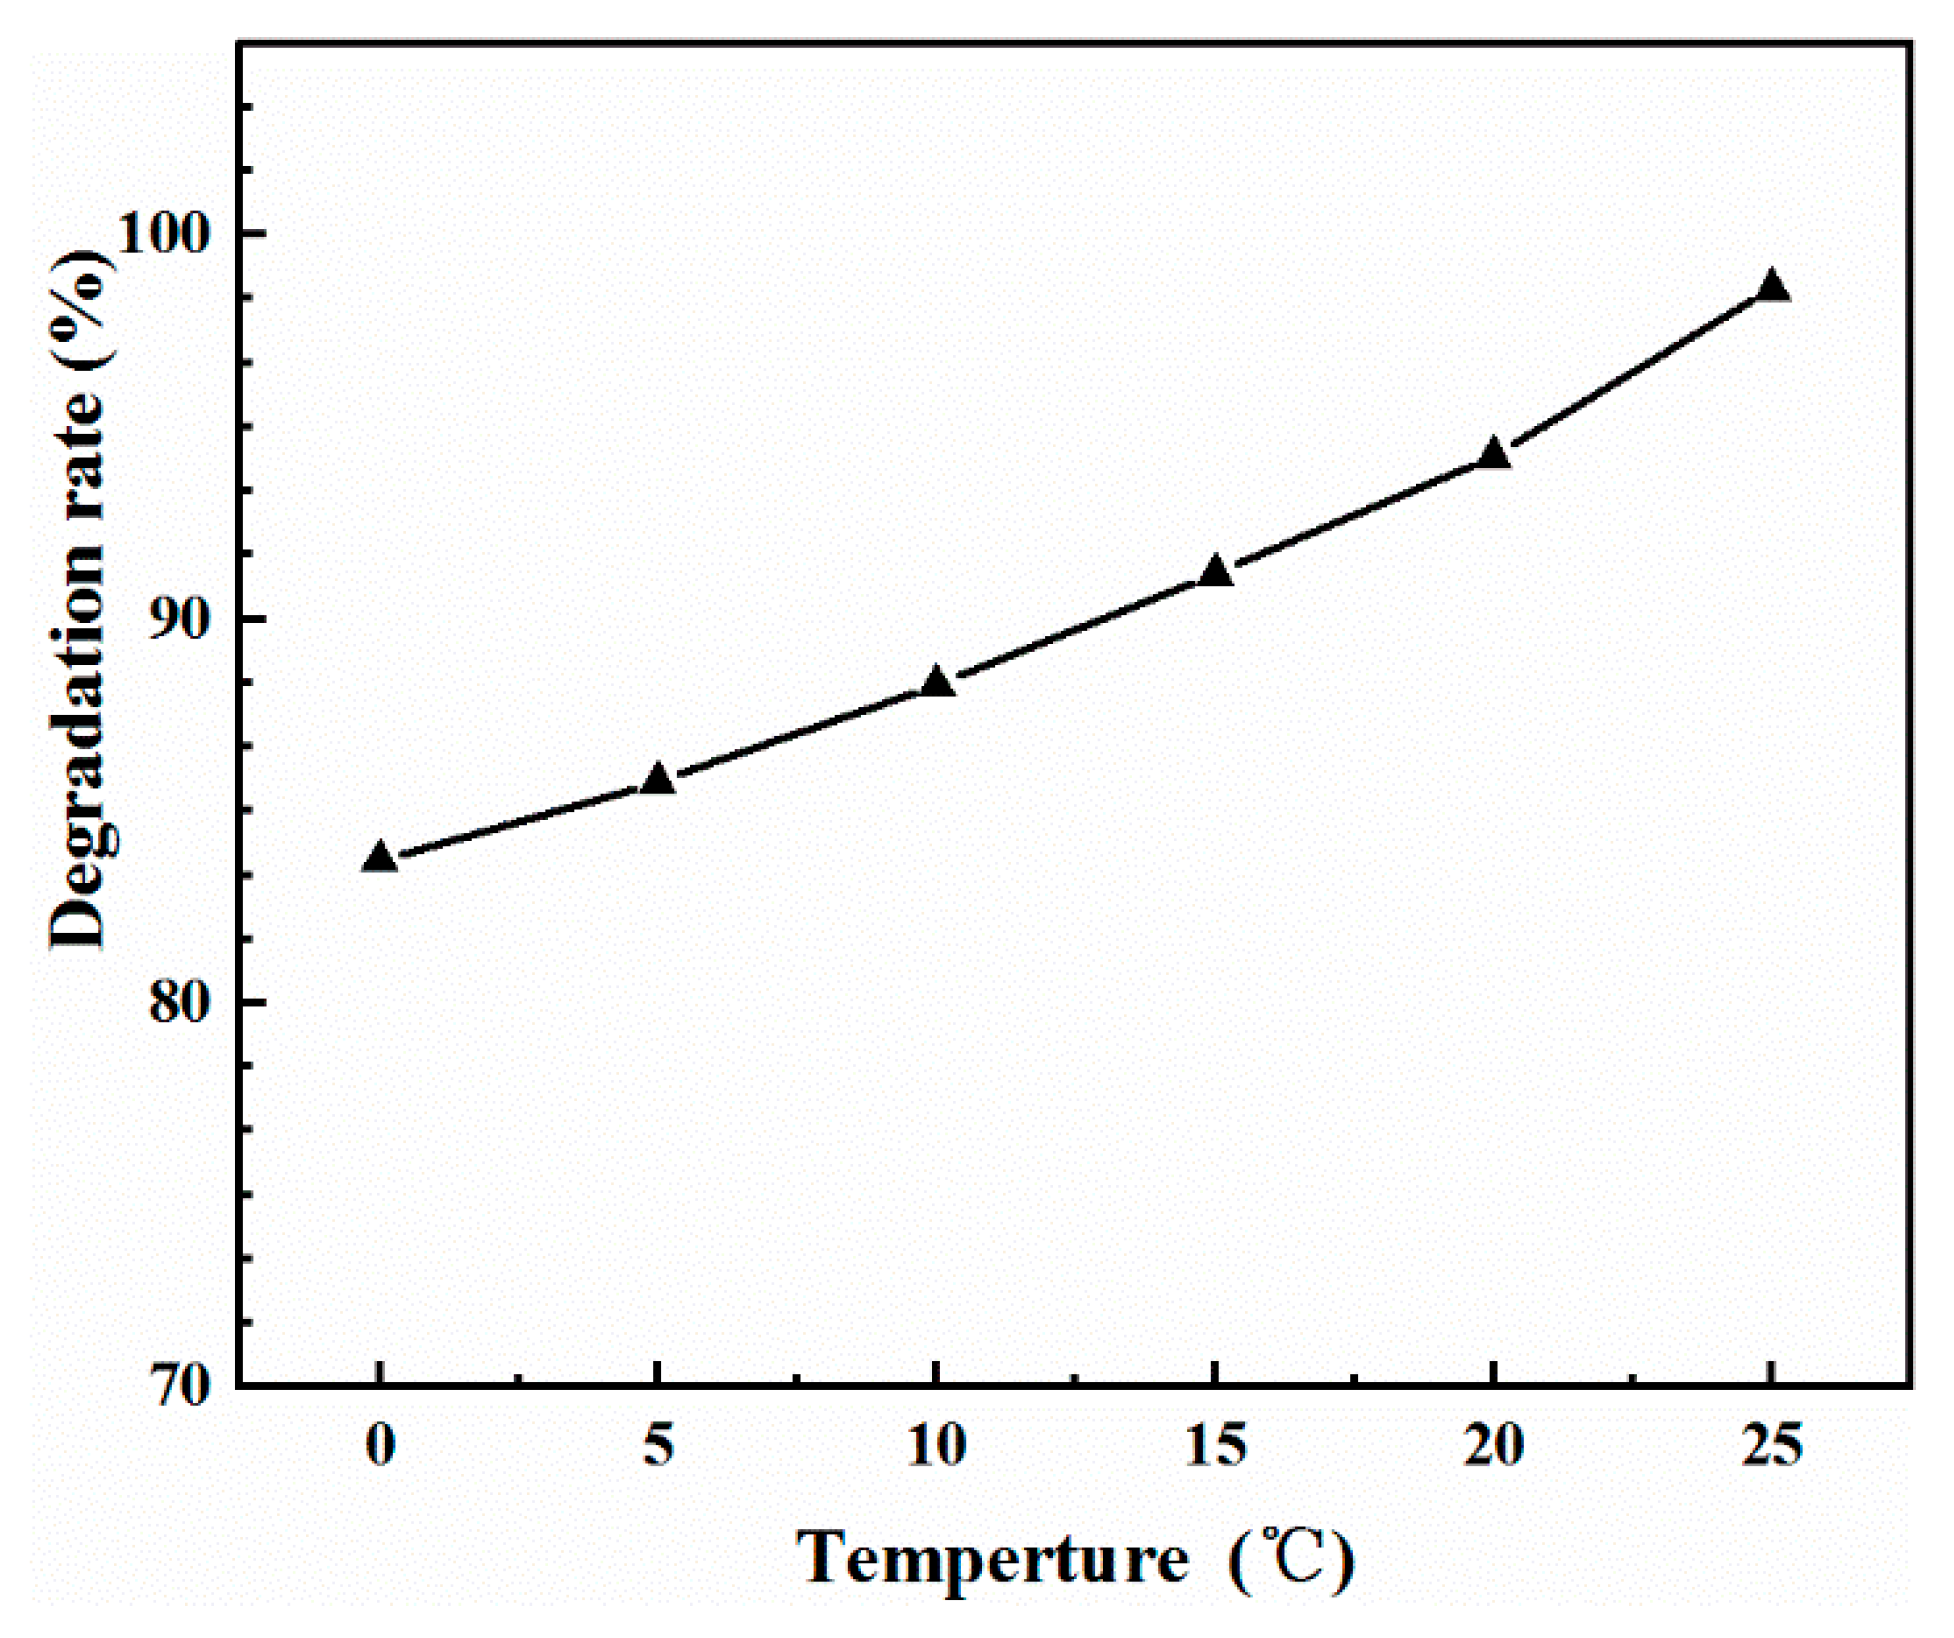
2.4. Effect of Temperature on Adsorption Properties

The effect of temperature on the adsorption rate is revealed in Figure 5. At all experimental temperatures, the MB adsorption rate was higher at the beginning and gradually decreased as contact time increased. This may be attributed to the change in concentration, which is the driving force of adsorption reaction, and the change in available adsorption sites [27]. At the beginning of the reaction, a higher concentration of MB caused large mass transfer and the large difference between the concentration of the volume solution and the adsorbent could produce a large adsorption force, which would promote the transport and adsorption of MB molecules onto the active sites of MoS2/WO3 [28]. When the temperature of the adsorption reaction decreased from 25 °C to 0 °C, the adsorption capacity within 62 min was studied. Significantly, it only takes about 60 min for MB to be adsorbed on MoS2/WO3 with the degradation rate up to 98%, which is more efficient than polypropylene–clinoptilolite composites [29], graphene [30], and some other carbon materials [31]. The equilibrium adsorption capacity slightly decreased from 98.6 mg/g to 83.7 mg/g as reaction temperature decreased. These results indicate that the main factor affecting the adsorption rate was not the ambient temperature, but the active center of the material itself. There are a large number of adsorption activity sufficient points on MoS2/WO3, which determines that it still has favorable adsorption efficiency at lower temperatures. Figure 6 indicates the effect of reaction temperature on the MB degradation rate. The degradation rate remained steady when the reaction temperature varied from 25 °C to 0 °C. However, as observed in Figure 6, the degradation efficiency became lower with the decrease in temperature. According to the theory of adsorption kinetics, the molecular diffusion rate increases with the increase in temperature, and the elevated temperature can accelerate the reaction rate. Therefore, as the temperature decreased, the adsorption efficiency was slightly deteriorated. It is worth noting that the adsorption capacity of the composite could reach 83.7 mg/g in 62 min, even at 0 °C, indicating that MoS2/WO3 may be an ideal adsorbent for MB and other dyeing materials because of its faster adsorption rate at low temperatures.

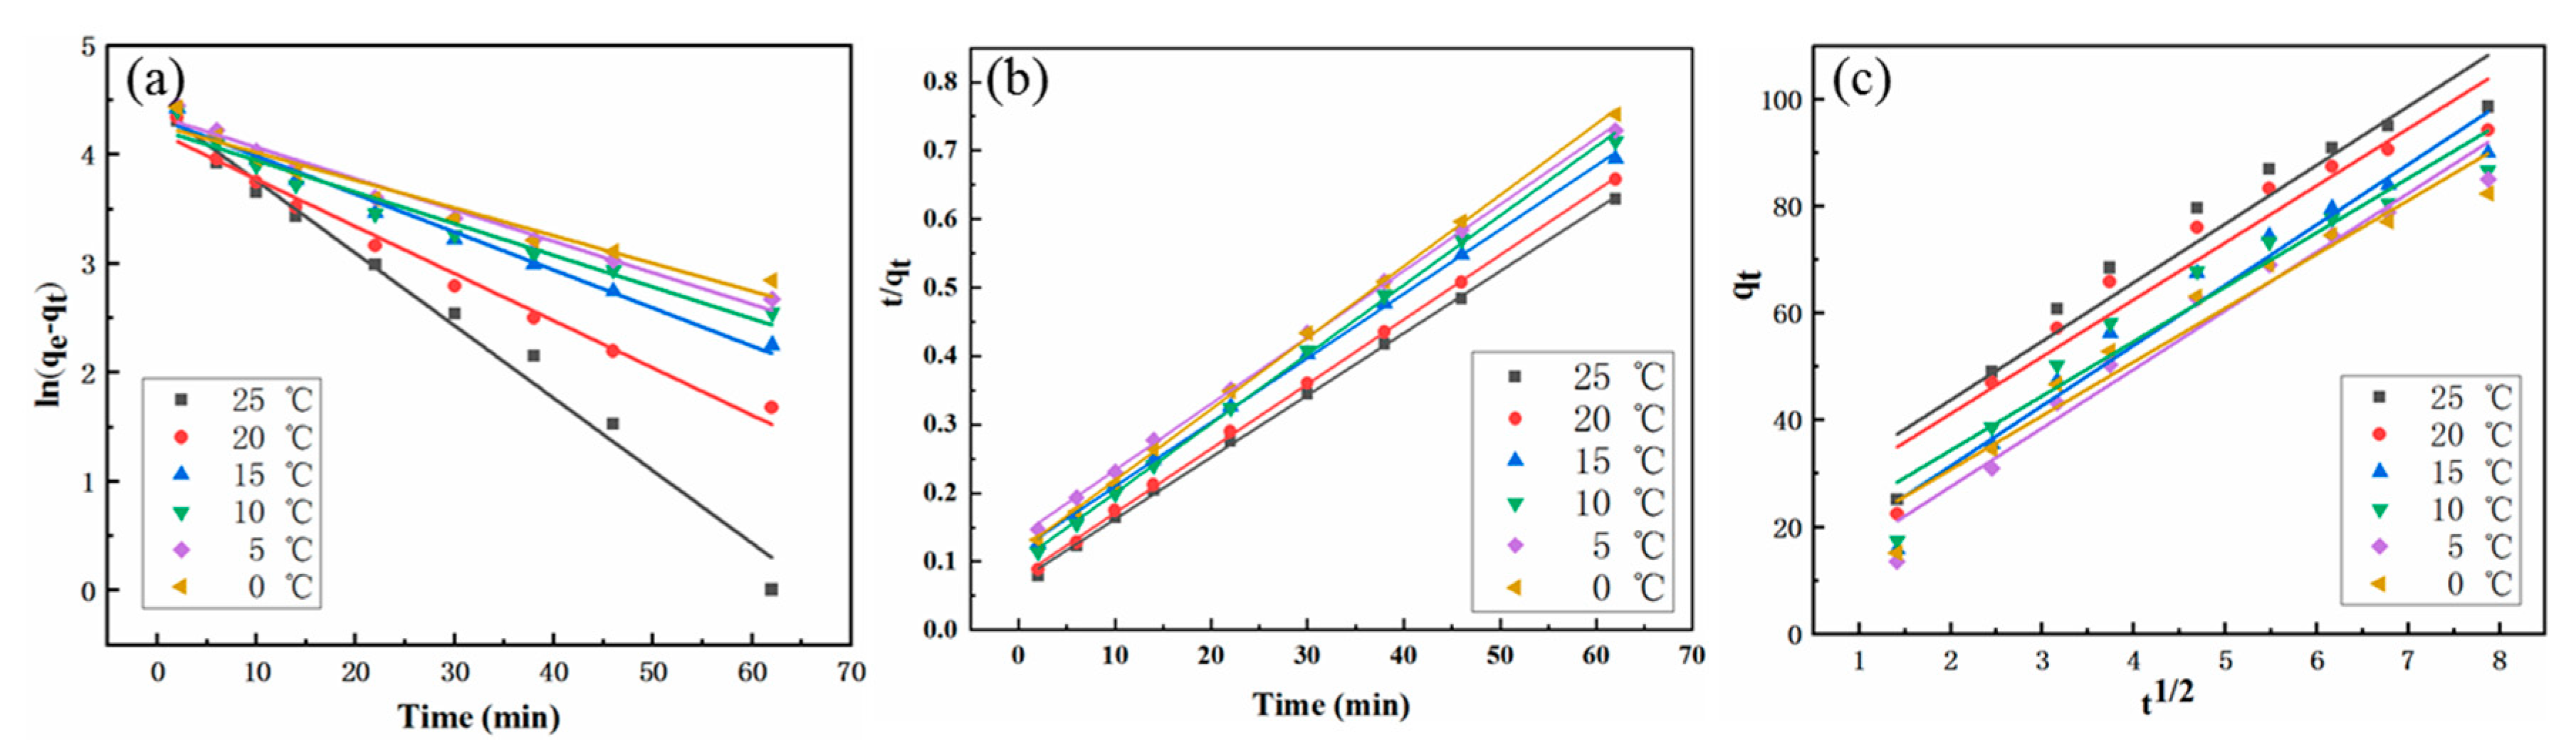
2.5. Adsorption Kinetics

In order to study the steps that may limit the adsorption rate, the experimental data at different temperature conditions were fitted using the pseudo-first order kinetic equations, the pseudo-second order kinetic equations, and the intra-particle diffusion model. The correlation coefficient (R2) was used to express the degree of fitting. Besides this, the corresponding rate constant and theoretical equilibrium adsorption amount were calculated.
The pseudo-first order kinetic model, the pseudo-second order kinetic model, and the intra-particle diffusion model are represented by the following equations (Equation (1), Equation (2), Equation (3)):
ln ( q e q t ) = l n q e k 1 t ,
where k1 indicates the rate constant of the pseudo-first order kinetic (min−1);
t q t = 1 k 1 q e 2   +   t q e ,
where k2 indicates the rate constant of the pseudo-second order kinetic (g·mg−1·min−1);
q t = k p t 1 / 2   +   C i ,
where kp indicates the rate constant of the intra-particle diffusion model (g·g−1·min−1), while Ci is a constant reflecting the thickness of the boundary layer and a larger Ci indicates a greater boundary layer effect [32].
The linear fits of the different kinetic models are shown in Figure 7 and the specific parameters are listed in Table 1. For all temperatures, the linear regression correlation coefficient (R2) for the pseudo-second order was much higher than that of the pseudo-first order and the intra-particle diffusion model, indicating better fitness while using the pseudo second-order model. This means that extreme membrane diffusion may not be the rate limiting step for MB adsorption on MoS2/WO3 [33,34]. In addition, the calculated values of qe by the pseudo-second order model were analogous to the corresponding experimental values. Therefore, the pseudo-second order model is more appropriate to describe the MB adsorption onto MoS2/WO3 and it contains all processes in which MB adsorbs on MoS2/WO3, such as external liquid membrane diffusion, internal particle diffusion, and the adsorption of adsorbate on the interior surface site of adsorbents [35]. As shown in Equation (3), the intra-particle diffusion model is usually used to further study the possible adsorption mechanism on adsorbents [36]. The total rate of adsorption may be controlled by one of the steps or a combination of more steps [37]. If the linear fitting image of qe versus t1/2 is a straight line passing the origin, it means that the adsorption process is a single diffusion. However, multi-linear plots are observed in Figure 7a and none of them passed through the origin. This indicates that the intra-particle diffusion is not the sole rate-limiting step and multiple rate-control steps may be involved in the adsorption process of MB onto MoS2/WO3. Consequently, we speculate that the adsorption process of MB onto MoS2/WO3 under different temperature conditions can be divided into three stages. The initial stage is generally related to the external mass delivery, called external mass transfer, which diffuses or moves to the outer surface of the adsorbents through the boundary layer around the adsorbed particles [38,39]. In the next two stages, the first is the diffusion of the adsorbate in the pores and adheres to the surface of the adsorbents, followed by adsorption/desorption equilibrium. In the last stage, the adsorbed organic molecules may exchange or share electrons with the adsorbed particles, depending on the chemical nature of the solid. The relevant parameters are listed in Table 1. According to the values of the intra-particle diffusion rate constants (kp) and Ci values, intra-particle diffusion plays an important role in the overall adsorption of all groups.

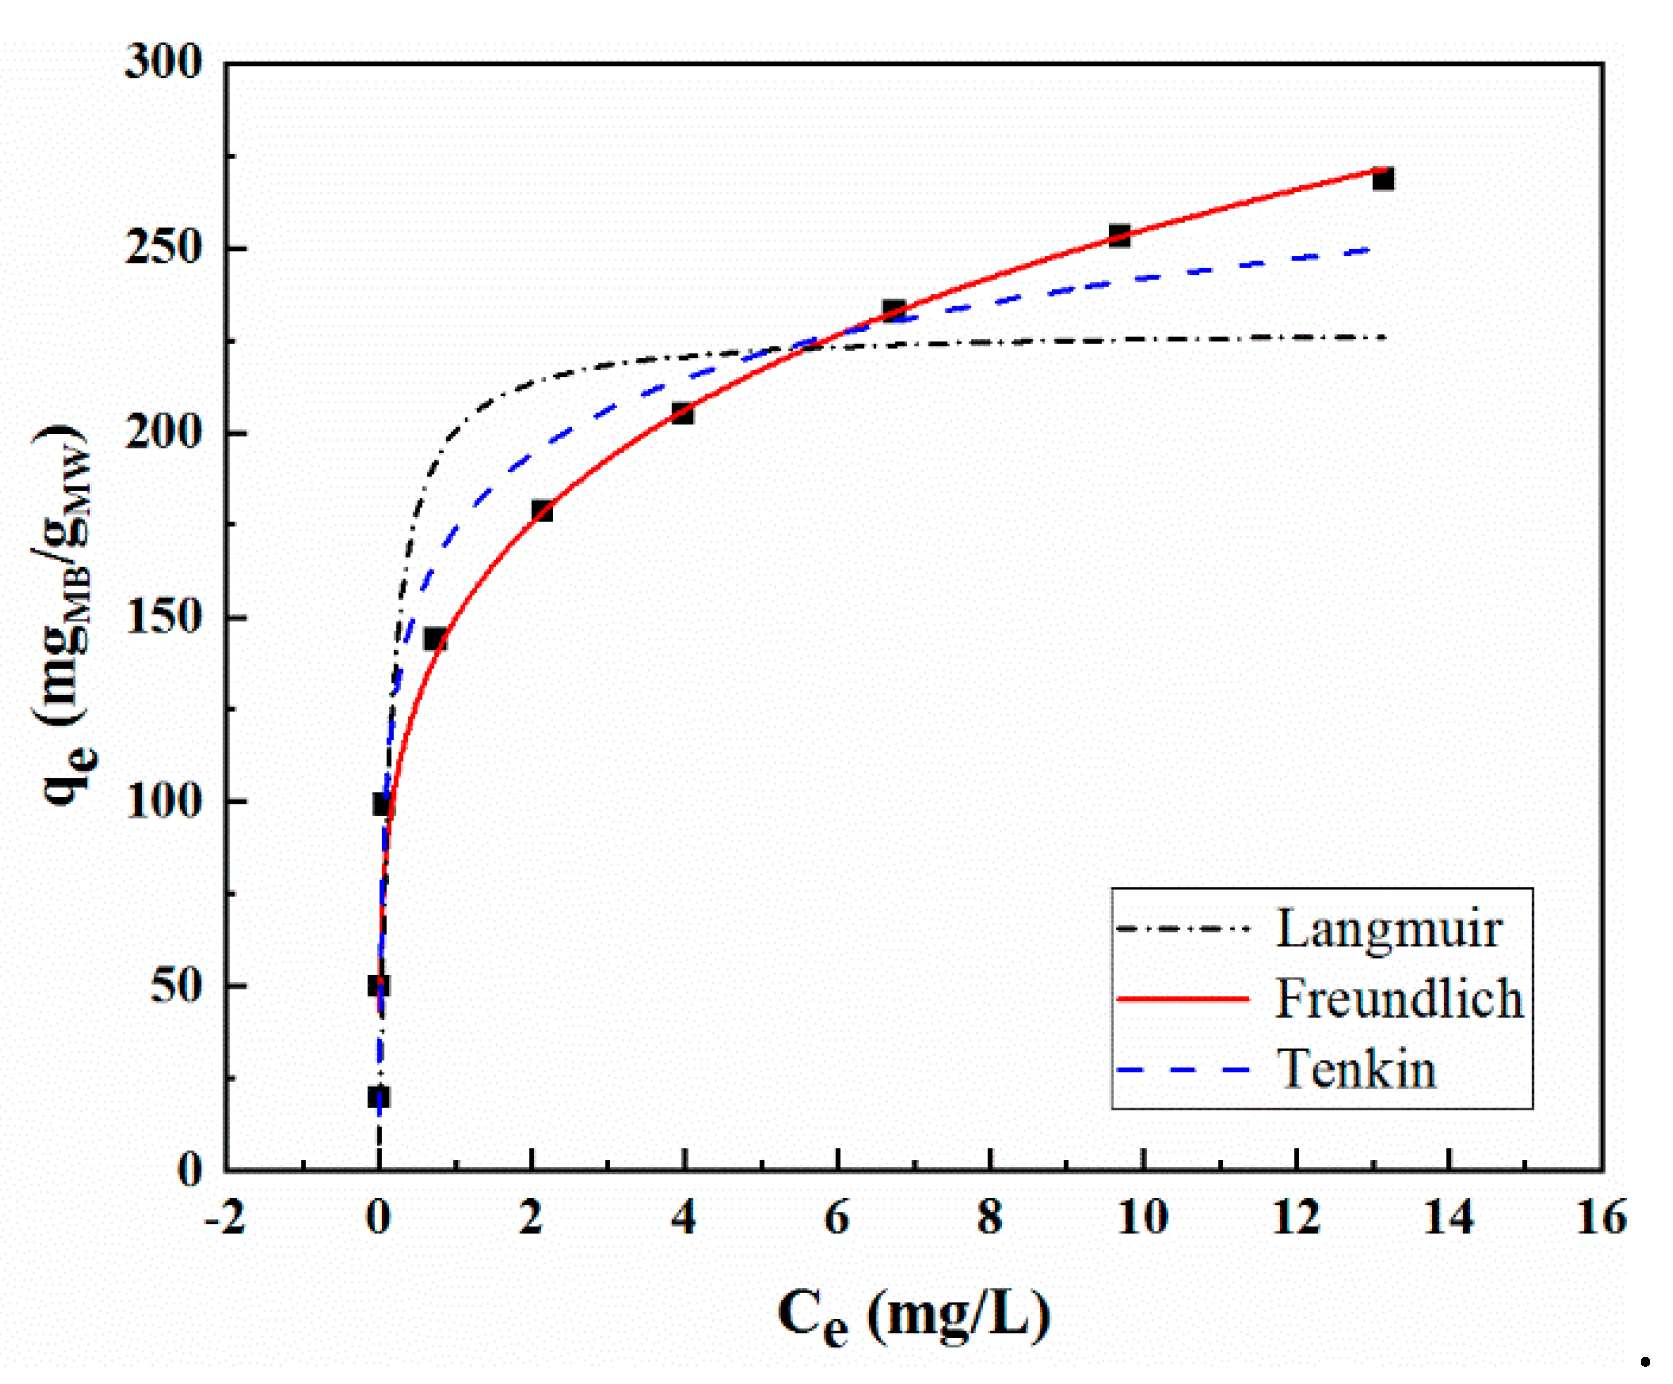
2.6. Adsorption Thermodynamics

The adsorption isotherm of the composite material of methylene blue was studied under the condition of 25 °C, 10 mg MoS2/WO3, and the adsorption time of 24 h. The variation range of the initial concentration of MB solution was from 2 to 40 mg/L (2 mg/L, 5 mg/L, 10 mg/L, 15 mg/L, 20 mg/L, 25 mg/L, 30 mg/L, 35 mg/L, 40 mg/L). The most common expressions describing the solid–liquid adsorption isotherm are the Langmuir equation, the Freundlich equation, and the Tenkin equation. The validity of the isotherm models fitting can be determined by their linearization curve, as shown in Figure 8. The regression coefficient (R2) was used as a criterion to compare the fitness of each model.
The linear form of Langmuir isotherm equation is expressed as the following (Equation (4)):
C e q e = 1 k q m   +   C e q m ,
where Ce (mg/L) and qe (mg/L) are the equilibrium concentration of the adsorbate in liquid-phase and solid-phase, respectively; Qm (mg/g) is the maximum monolayer coverage capacity adsorbent; and k (L/mg) is the Langmuir adsorption constant. One of the most important characteristics of the Langmuir adsorption isotherm equation is that the dimensionless separation factor RL is defined, which is expressed as in Equation (5):
R L   =   1 1   +   k C 0 ,
where RL is used to represent the properties of adsorption process. If 0 < RL < 1, it indicates that the adsorption process is preferential adsorption.
The linear expression of Freundlich isotherm equation is shown in Equation (6):
ln q e = l n K i   +   1 m l n C e ,
where Ki (mg/L) is a constant to describe the sorption capacity, and m is a constant representing the favorability of the sorption system, and the value of 1/m indicates the effect of concentration on the adsorption capacity [40,41].
The Temkin is one of the isotherm fitting equations that similar to the Freundlich isotherm. The model equation is expressed as the following (Equation (7)):
q e = A l n ( B · C e ) ,
where A is a constant related to heat of adsorption, B (L/g) is the Temkin isotherm equilibrium binding constant.
The constants obtained by fitting the three isotherms are summarized in Table 2. According to the regression coefficients, the Freundlich isotherm model was the best to describe the adsorption data, which implies that multi-layer adsorption with uneven adsorption energy may occur in the MB–MoS2/WO3 system. In this work, the value of 1/m was between 0.1 and 0.5 (1/m = 0.2052), which indicates favorable adsorption of MB onto MoS2/WO3 [42]. Moreover, a uniform distribution of bounding energy rather than a uniform adsorption energy may also have taken place in the MB–MoS2/WO3 system, because the regression coefficients for the Temkin isotherm model were relatively high (R2 = 0.9779). As shown in Figure 8, when the concentration of MB at equilibrium was within the range of 2~15 mg/L, the Langmuir isotherm model also fitted well. This phenomenon may be due to the Langmuir isotherm being valid for the low ion concentrations and the monolayer adsorption capacity of adsorbents is insufficient. The comparison of maximum adsorption capacities of MB on some other reported adsorbents are shown in Table 3. It can be seen that MoS2/WO3 prepared in this work exhibited higher adsorption capacity, which is expected to be an ideal adsorbent in a worse environment.

3. Materials and Methods

3.1. Fabrication of WO3 Nanorods

The preparation process of rod-like WO3 can be found in Reference 20 for details [20].

3.2. Synthesis of MoS2/WO3 Composites

The formation process of MoS2/WO3 composites was similar to that of Ying et al. [20]. Typically, 90 mg sodium molybdate (Na2MoO4·2H2O) and 180 mg thioacetamide (C2H5NS) were dissolved in 60 mL deionized water to form a transparent solution. While stirring, 60 mg WO3 nanorods was added into the above solution and then the pH was adjusted to 1.5 with a certain concentration of hydrochloric acid. Then, a suspension was obtained and transferred into a 100 mL Teflon-lined autoclave and then maintained at 220 °C for 24 h. The product was centrifuged and washed three times with deionized water and anhydrous ethanol, and then dried at 60 °C for 20 h.

3.3. Characterization

The crystallization and the phase composition were characterized by X-ray diffraction (XRD) with a PAN analytical X’ Pert PRO X-ray diffractometer (PANanalytical B.V., Almelo, The Netherlands) using Cu Kα radiation (λ = 1.5418 Å). The X-ray tube voltage and current were set at 40 kV and 40 mA with a step size of 0.033°/s. The morphology and element mappings of MoS2/WO3 composites were determined with Hitachi S-4800 scanning electron microscopy (SEM, Tokyo, Japan) and a Tecnai G2 F30 S-Twin transmission electron microscopy (TEM, FEI Company, Hillsborough, OR, USA), respectively. The chemical state of each element of the composite material was characterized by X-ray photoelectron spectroscopy (XPS, Kratos Axis Ultra DLD, Shimadzu Kratos, Manchester, UK). For XPS characterization, spectra representing the C 1s, O 1s, S 2p, Mo 3d, and W 4f photoelectrons were recorded. The test results were processed by XPSPEAK4.1 software (4.1, Hong Kong, China). All binding energies (BE) were calibrated based on the C1s of adventitious carbon (284.8 eV). A UV-visible spectrophotometer (Shanghai Jinghua 7600, Shanghai, China) was adopted to detect the adsorption spectrum of the sample.

3.4. Adsorption Test

The adsorption experiments were conducted under dark conditions at a range of different temperatures to test the adsorption process of organic dye onto MoS2/WO3. Typically, MoS2/WO3 adsorbent was added to 100 mL MB solution, and then the mixture was magnetically stirred. After a certain time, about 5 mL of suspension was taken out from the stirred mixture and filtered to remove the adsorbent. Then, the resulting solution was measured by a UV-vis 7600 spectrophotometer (Shanghai Jinghua Instruments) at the wavelength range of 400~800 nm. For the efficient study of adsorption, 10 mg MoS2/WO3 was dispersed in a 100 mL MB solution of 10 mg/L. The mixture was continually stirred at different temperature (from 25 °C to 0 °C) for 62 min and then the absorbance was measured in order to compare the effect of temperature on adsorption rate. Furthermore, different initial concentrations of MB solution were stirred continuously at 25 °C for 24 h to ensure that the adsorption/desorption equilibrium was reached, and then the absorbance was measured to study the thermodynamic properties of adsorption. The degradation of MB was quantified from the decrease in the intensity of the associated characteristic absorption band at 664 nm. The quantity of MB adsorbed on MoS2/WO3 within a certain period time was calculated by mass balance, as shown in Equation (8), and the degradation rate of MB was determined using Equation (9):
q t = C 0 C t m   ×   V ,
η = C 0 C t C 0 = A 0 A t A 0 ,
where qt (mg/g) is the pollutant concentration in solid phrase at time t (min), m is the weight of adsorbent (g), V (mL) is the volume of MB solution, and η is the degradation rate, C0 (mg/L) and Ct (mg/L) are the concentrations of MB at time 0 and t (min), A0 is the initial adsorbance of the solution, At is the adsorbance of each time period.

4. Conclusions

In general, MoS2/WO3 composites prepared by the two-step hydrothermal method with rod-shaped WO3 as the template have good adsorption efficiency and are expected to be used as an ideal adsorbent to remove organic dye from wastewater at low temperatures, as well as at room-temperature. According to SEM and TEM images, the composites of MoS2-coated WO3 nanorods were smoothly obtained. The surface of the structure was loose, which can provide a large number of active sites for the adsorption reaction. The XPS results showed that besides MoS2 and WO3 in the products, there were also new chemical bonds formed. The chemical structures Mo–S–W and W–O–Mo, newly generated, both had good electro-active sites, so the ability of the composite material to adsorb positively charged dye was greatly improved. It can be concluded from the adsorption thermodynamics and kinetic simulation results that the adsorption of MB onto MoS2/WO3 is easy to carry out. Moreover, the adsorption capacity of the adsorbent and adsorption efficiency were found to be mildly affected by temperature, even at 0 °C. All the above results show that the as-prepared MoS2/WO3 composites would have broad prospects of application for removing organic dyes from wastewater.

Supplementary Materials

The following are available online. Figure S1. The Zeta potential of WO3 (1) and MoS2/WO3 (2).

Author Contributions

Methodology, Y.Z.; conceptualization, W.H.; formal analysis and writing—original draft, J.W.; investigation, Y.W.; review and editing, H.Z.; Z.P.; Q.Y. All authors have read and agreed to the published version of the manuscript.

Funding

This work was supported by the Science and Technology Projects of Zhejiang Province (Grant No. 2107C37002).

Conflicts of Interest

The authors declare no conflict of interest.

References

  1. Ravikumar, K.; Deebika, B.; Balu, K. Decolourization of aqueous dye solutions by a novel adsorbent: Application of statistical designs and surface plots for the optimization and regression analysis. J. Hazard. Mater. 2005, 1, 75–83. [Google Scholar] [CrossRef] [PubMed]
  2. Robinson, T.; Mcmullan, G.; Marchant, R.; Nigam, p. Remediation of dyes in textile effluent: A critical review on current treatment technologies with a proposed alternative. Bioresour. Technol. 2001, 3, 247–255. [Google Scholar] [CrossRef]
  3. Ritika; Manjot, K.; Ahmad, U.; Surinder, K.; Surinder, S.; Sushil, K.; Fouad, H.; Othman, Y. Rapid Solar-Light Driven Superior Photocatalytic Degradation of Methylene Blue Using MoS2-ZnO Heterostructure Nanorods Photocatalyst. Mater. 2018, 11, 2254. [Google Scholar] [CrossRef] [PubMed] [Green Version]
  4. Xiao, X.; Sun, Y.; Sun, W.; Shen, H.; Zheng, H.; Xu, Y.; Zhao, J.; Wu, H.; Liu, C. Advanced treatment of actual textile dye wastewater by Fenton-flocculation process. Can. J. Chem. Eng. 2017, 7, 1245–1252. [Google Scholar] [CrossRef]
  5. Malik, P.K.; Saha, S.K. Oxidation of direct dyes with hydrogen peroxide using ferrous ion as catalyst. Sep. Purif. Technol. 2003, 3, 241–250. [Google Scholar] [CrossRef]
  6. Negar, D.K.; Reza, K.; Saeideh, K.E.; Saeid, M.; Seeram, R.; Hu, J. Visible Light Driven Heterojunction Photocatalyst of CuO–Cu2O Thin Films for Photocatalytic Degradation of Organic Pollutants. Nanomater. 2019, 9, 1011. [Google Scholar] [CrossRef] [Green Version]
  7. Martinezhuitle, C.A.; Brillas, E. Decontamination of wastewaters containing synthetic organic dyes by electrochemical methods: A general review. Appl. Catal. 2009, 3, 105–145. [Google Scholar] [CrossRef]
  8. Zhou, X.; Xu, M.; Wang, L.; Liu, X. The Adsorption of Methylene Blue by an Amphiphilic Block Co-Poly (Arylene Ether Nitrile) Microsphere-Based Adsorbent: Kinetic, Isotherm, Thermodynamic and Mechanistic Studies. Nanomater. 2019, 9, 1356. [Google Scholar] [CrossRef] [Green Version]
  9. Jiri, K.; Vojtech, A.; Ondrej, Z. Fabrication of Graphene/Molybdenum Disulfide Composites and Their Usage as Actuators for Electrochemical Sensors and Biosensors. Molecules 2019, 24, 3374. [Google Scholar] [CrossRef] [Green Version]
  10. Shang, S.; Lindwall, G.; Wang, G.Y.; Redwing, J.M.; Anderson, T.; Liu, Z. Lateral Versus Vertical Growth of Two-Dimensional Layered Transition-Metal Dichalcogenides: Thermodynamic Insight into MoS2. Nano Lett. 2016, 9, 5742–5750. [Google Scholar] [CrossRef]
  11. Wei, T.; Lau, W.; An, X.; Yu, X. Interfacial Charge Transfer in MoS2/TiO2 Heterostructured Photocatalysts: The Impact of Crystal Facets and Defects. Moleclus 2019, 24, 1769. [Google Scholar] [CrossRef] [PubMed] [Green Version]
  12. Sabarinathan, M.; Harish, S.; Archana, J.; Navaneethan, J.; Ikeda, H.; Hayakawa, Y. Controlled exfoliation of monodispersed MoS2 layered nanostructures by a ligand-assisted hydrothermal approach for the realization of ultrafast degradation of an organic pollutant. RSC Adv. 2016, 111, 109495–109505. [Google Scholar] [CrossRef]
  13. Hou, J.; Zhao, Q.; Li, T.; Hu, J.; Li, P.; Li, G. Spherical MoS2/WO3 Composite Semiconductor: Preparation and Photocatalytic Performance for RhB. Chin. J. Inorg. Chem. 2017, 9, 1527–1536. [Google Scholar] [CrossRef]
  14. Li, J.; Zhang, M.; Li, Q.; Yang, J. Enhanced visible light activity on direct contact Z-scheme g-C3N4-TiO2 photocatalyst. Appl. Surf. Sci. 2017, 184–193. [Google Scholar] [CrossRef]
  15. Zhu, B.; Xia, P.; Li, Y.; Ho, W.; Yu, J. Fabrication and photocatalytic activity enhanced mechanism of direct Z-scheme g-C3N4/Ag2WO4 photocatalyst. Appl. Surf. Sci. 2017, 175–183. [Google Scholar] [CrossRef]
  16. Wang, S.; Yang, X.; Zhang, X.; Ding, X.; Yang, Z.; Dai, K. A plate-on-plate sandwiched Z-scheme heterojunction photocatalyst: BiOBr-Bi2MoO6 with enhanced photocatalytic performance. Appl. Surf. Sci. 2017, 194–201. [Google Scholar] [CrossRef]
  17. Liu, J.; Cheng, B.; Yu, J. A new understanding of the photocatalytic mechanism of the direct Z-scheme g-C3N4/TiO2 heterostructure. Phys. Chem. Chem. Phys. 2016, 45, 31175–31183. [Google Scholar] [CrossRef]
  18. He, K.; Xie, J.; Luo, X.; Wen, J.; Ma, S.; Li, X.; Fang, Y.; Zhang, X. Enhanced visible light photocatalytic H2 production over Z-scheme g-C3N4 nansheets/WO3 nanorods nanocomposites loaded with Ni(OH)x cocatalysts. Chin. J. Catal. 2017, 2, 240–252. [Google Scholar] [CrossRef]
  19. Liu, Y.; Wang, R.; Yang, R.; Hong, D.; Jiang, Y.; Shen, C.; Liang, K.; Xu, A. Enhanced visible-light photocatalytic activity of Z-scheme graphitic carbon nitride/oxygen vacancy-richzinc oxide hybrid photocatalysts. Chin. J. Catal. 2015, 12, 2135–2144. [Google Scholar] [CrossRef]
  20. Ying, J.; Wang, J.; Yang, Q.; Hu, X.; Zheng, Y.; Huang, W. Synthesis and adsorption properties of MoS2/WO3 nanocomposite. Funct. Mater. 2018, 7, 7062–7069. [Google Scholar] [CrossRef]
  21. Yang, Y.; Zhang, K.; Lin, H.; Li, X.; Chan, H.; Yang, L.; Gao, Q. MoS2–Ni3S2 Heteronanorods as Efficient and Stable Bifunctional Electrocatalysts for Overall Water Splitting. ACS Catals. 2017, 4, 2357–2366. [Google Scholar] [CrossRef]
  22. Li, A.; Feng, J.; Zhang, Y.; Wang, R.; Liu, H.; Wang, G.; Cheng, F.; Xi, P. Epitaxial Heterogeneous Interfaces on N-NiMoO4/NiS2 Nanowires/Nanosheets to Boost Hydrogen and Oxygen Production for Overall Water Splitting. Adv. Funct. Mater. 2019, 1, 1805298. [Google Scholar] [CrossRef] [Green Version]
  23. Cui, Z.; Sun, Y.G. From tremella-like MoS2 to α-MoO3 nanoplates: Sintering synthesis and adsorption properties. Micro Nano Lett. 2017, 9, 652–665. [Google Scholar] [CrossRef]
  24. Gao, M.; Liang, J.; Zheng, J.; Xu, Y.; Jiang, J.; Gao, Q.; Li, J.; Yu, S. An efficient molybdenum disulfide/cobalt diselenide hybrid catalyst for electrochemical hydrogen generation. Nat. Commun. 2015, 1, 5982. [Google Scholar] [CrossRef]
  25. Li, Y.; Yin, K.; Wang, K.; Lu, X.; Zhang, Y.; Liu, Y.; Yan, D.; Song, D.; Luo, S. Engineering MoS2 nanomesh with holes and lattice defects for highly active hydrogen evolution reaction. Appl. Catal. 2018, 239, 537–544. [Google Scholar] [CrossRef]
  26. Sun, M.Y.; Alan, E.N.; John, A. A DFT study of WS2, NiWS, and CoWS hydrotreating catalysts: Energeties and surface structures. J. Catal. 2004, 226, 41–53. [Google Scholar] [CrossRef]
  27. Li, L.; Liu, S.; Zhu, T. Application of activated carbon derived from scrap tires for adsorption of Rhodamine, B. J. Environ. Sci. 2010, 8, 1273–1280. [Google Scholar] [CrossRef]
  28. Eftekhari, S.; Habibi-Yangjeh, A.; Sohrabnezhad, S. Application of AlMCM-41 for competitive adsorption of methylene blue and rhodamine B: Thermodynamic and kinetic studies. J. Hazard. Mater. 2010, 1, 349–355. [Google Scholar] [CrossRef]
  29. Vimonses, V.; Lei, S.; Bo, J.; Chow, J.; Saint, C. Kinetic study and equilibrium isotherm analysis of Congo Red adsorption by clay materials. Chem. Eng. J. 2010, 2, 354–364. [Google Scholar] [CrossRef]
  30. Motsa, M.M.; Mamba, B.B.; Thwala, J.M.; Msagati, T.A.M. Preparation, characterization, and application of polypropylene–clinoptilolite composites for the selective adsorption of lead from aqueous media. J. Colloid Inter. Sci. 2011, 359, 210–219. [Google Scholar] [CrossRef]
  31. Liu, T.H.; Li, Y.H.; Du, Q.J.; Sun, J.K.; Jiao, Y.Q.; Yang, G.M.; Wang, Z.H.; Xia, Y.Z.; Zhang, W.; Wang, K.L.; et al. Adsorption of methylene blue from aqueous solution by graphene. Colloids Surfaces B 2012, 90, 197–203. [Google Scholar] [CrossRef] [PubMed]
  32. Li, Y.H.; Du, Q.J.; Liu, T.H.; Peng, X.J.; Wang, J.J.; Sun, J.K.; Wang, Y.H.; Wu, S.L.; Wang, Z.H.; Xia, Y.Z.; et al. Comparative study of methylene blue dye adsorption onto activated carbon, graphene oxide, and carbon nanotubes. Chem. Eng. Res. Des. 2013, 91, 361–368. [Google Scholar] [CrossRef]
  33. Zhang, J.; Li, F.; Sun, Q. Rapid and Selective Adsorption of Cationic Dyes by a Unique Metal-organic Framework with Decorated Pore Surface. Appl. Surf. Sci. 2018, 1219–1226. [Google Scholar] [CrossRef]
  34. Wang, T.; Kailasam, K.; Xiao, P.; Chen, G.; Chen, G.; Wang, L.; Li, J.; Zhu, J. Adsorption removal of organic dyes on covalent triazine framework (CTF). Microporous Mesoporous Mater. 2014, 187, 63–70. [Google Scholar] [CrossRef]
  35. Viegas, R.M.C.; Campinas, M.; Costa, H.; Rosa, M.J. How do the HSDM and Boyd’s model compare for estimating intraparticle diffusion coefficients in adsorption processes. Adsorption 2014, 20, 737–746. [Google Scholar] [CrossRef]
  36. Mckay, G. The adsorption of dyestuffs from aqueous solution using activated carbon: Analytical solution for batch adsorption based on external mass transfer and. Chem. Eng. J. 1983, 3, 187–196. [Google Scholar] [CrossRef]
  37. Ding, L.; Bo, Z.; Gao, W.; Liu, Q.; Wang, Z.; Guo, Y.; Wang, X.; Liu, Y. Adsorption of Rhodamine-B from aqueous solution using treated rice husk-based activated carbon. Colloid. Surf. A. 2014, 446, 1–7. [Google Scholar] [CrossRef]
  38. Sun, P.; Xu, L.; Li, J.; Zhai, P.; Zhang, H.; Zhang, Z.; Zhu, Z. Hydrothermal synthesis of mesoporous Mg3Si2O5(OH)4 microspheres as high-performance adsorbents for dye removal. Chem. Eng. J. 2018, 377–388. [Google Scholar] [CrossRef]
  39. Olu-Owolabi, B.I.; Diagboya, P.N.; Adebowale, K.O. Evaluation of pyrene sorption-desorption on tropical soils. J. Env. Manag. 2014, 137, 1–9. [Google Scholar] [CrossRef] [Green Version]
  40. Mckay, G.; Blair, H.S.; Gardner, J.R. Adsorption of dyes on chitin. I. Equilib. Stud. J. Appl. Poly. Sci. 1982, 8, 3043–3057. [Google Scholar] [CrossRef]
  41. De Sá, A.; Abreu, A.S.; Moura, I.; Machado, A.V. Polymeric materials for metal sorption from hydric resources. Water Purif. 2017, 289–322. [Google Scholar] [CrossRef]
  42. Inyinbor, A.A.; Adekola, F.A.; Olatunji, G.A. Kinetics, Isotherms and thermodynamic modeling of liquid phase adsorption of Rhodamine B dye onto Raphia hookerie fruit epicarp. Water Resour. Indust. 2016, 15, 14–27. [Google Scholar] [CrossRef] [Green Version]
  43. Feng, M.; You, W.; Wu, Z.; Chen, Q.; Zhan, H. Mildly alkaline preparation and methyleneblue adsorption capacity of hierarchical flower-like sodium titanate. Appl. Mater. Inter. 2013, 23, 12654–12662. [Google Scholar] [CrossRef] [PubMed]
  44. Senthilkumaar, S.; Varadarajan, P.R.; Porkodi, K.; Subbhuraam, C.V. Adsorption of methylene blue onto jute fiber carbon: Kinetics and equilibrium studies. J. Colloid Interface Sci. 2005, 284, 78–82. [Google Scholar] [CrossRef]
  45. Acemioglu, B. Batch kinetic study of sorption of methylene blue by perlite. Chem. Eng. J. 2005, 1, 73–81. [Google Scholar] [CrossRef]
  46. Ozer, A.; Dursun, G. Removal of methylene blue from aqueous solution by dehydrated wheat bran carbon. J. Hazard. Mater. 2007, 1–2, 262–269. [Google Scholar] [CrossRef]
  47. Li, Z.; Meng, M.; Zhang, Z. Equilibrium and kinetic modelling of adsorption of Rhodamine B on MoS2. Mater. Res. Bull. 2019, 238–244. [Google Scholar] [CrossRef]
Sample Availability: Samples of the compounds are not available.
Figure 1. X-ray diffraction (XRD) patterns of WO3 (a), MoS2 (b), and MoS2/WO3 (c).
Molecules 25 00002 g001
Figure 2. Scanning electron microscopy (SEM) images of WO3 (a), MoS2 (b), and MoS2/WO3 (c).
Molecules 25 00002 g002
Figure 3. Element mapping of MoS2/WO3.
Molecules 25 00002 g003
Figure 4. X-ray photoelectron spectroscopy (XPS) spectra of Mo 3d, S 2p, O 1s, and W 4f in the as-prepared MoS2, WO3, and MoS2/WO3.
Molecules 25 00002 g004
Figure 5. Relationship between adsorption capacity and time at different temperatures.
Molecules 25 00002 g005
Figure 6. Effect of reaction temperature on the degradation rate of methylene blue (MB).
Molecules 25 00002 g006
Figure 7. (a) pesudo-first order, (b) pesudo-second order, and (c) intra-particle diffusion model plots for adsorption data of MB onto MoS2/WO3 at different temperatures.
Molecules 25 00002 g007
Figure 8. Fitting of equilibrium data to various adsorption isotherms.
Molecules 25 00002 g008
Table 1. Kinetic parameters of the pseudo-first and pseudo-second order model and intra-particle diffusion model.
Temperature (°C)qe exp (mg/g)Pseudo-First Order ModelPseudo-Second Order ModelIntra-Particle Diffusion Model
k1 (min−1)qe cal (mg/g)R2k2·103 (g·mg−1·min−1)qe cal (mg/g)R2kp (g·g−1·min1/2)CiR2
2599.5990.066583.7130.98531.1506110.4970.999210.976921.81900.9802
2099.5880.043367.0780.98261.1562106.3830.999510.659619.88560.9806
1599.5590.034976.2560.98580.7608106.6100.999211.27568.87400.9912
1099.5750.029069.0300.95981.037498.8140.999110.176814.00030.9851
599.5650.028877.6760.97720.6904103.0930.999210.96615.63020.9934
099.5590.025471.6210.95110.947496.0610.999410.064710.63410.9397
Table 2. Summary of isotherm parameters.
IsothermsConstantsMoS2/WO3
LangmuirQm228.2849
b7.1529
R20.8718
FreundlichKi161.5729
1/m0.2052
R20.9898
TemkinA29.5634
B354.7873
R20.9779
Table 3. The reported maximum monolayer coverage capacity of MB onto other adsorbents.
AdsorbentsQ0 (mg/g)Reference
Flower-like sodium titanate58.0[43]
Jute fiber carbon74[44]
Perlite94[45]
Dehydrated wheat bran122.0[46]
MoS2136.99[47]
MoS2/WO3268.42This study
Q0 is the maximum adsorption capacity of a material reported in the literature under certain conditions.

