
Determination of Urinary Pterins by Capillary Electrophoresis Coupled with LED-Induced Fluorescence Detector


Abstract
:1. Introduction
2. Results and Discussion
2.1. CE Conditions Optimization
2.2. Method Validation
2.3. Stability Study
2.4. Analysis of Urine Samples
3. Materials and Methods
3.1. Chemicals and Reagents
3.2. Instrumentation
3.3. General CE Procedure
3.4. Sample Buffer, BGE, and Oxidizing Solution
3.5. Pterins Stock Solutions
3.6. Urine Samples
3.7. Oxidation Procedure
3.8. LOD, LOQ, and Linear Range Determination
4. Conclusions
Supplementary Materials
Author Contributions
Funding
Acknowledgments
Conflicts of Interest
References
- Fukushima, T.; Shiota, T. Pterins in human urine. J. Biol. Chem. 1972, 247, 4549–4556. [Google Scholar]
- Voet, D.; Voet, J.G. Biochemistry, 2nd ed.; Voet, D., Voet, J.G., Eds.; John Wiley & Sons, Ltd.: New York, NY, USA, 1995; Volume 23, pp. 104–105. [Google Scholar]
- Koslinski, P.; Bujak, R.; Daghir, E.; Markuszewski, M.J. Metabolic profiling of pteridines for determination of potential biomarkers in cancer diseases. Electrophoresis 2011, 32, 2044–2054. [Google Scholar] [CrossRef]
- Murata, S.; Ichinose, H.; Urano, F. Tetrahydrobiopterin and Related Biologically Important Pterins. In Bioactive Heterocycles II; Eguchi, S., Ed.; Springer: Berlin/Heidelberg, Germany, 2007; pp. 127–171. [Google Scholar]
- Hevel, J.M.; Marletta, M.A. Macrophage nitric oxide synthase: Relationship between enzyme-bound tetrahydrobiopterin and synthase activity. Biochemistry 1992, 31, 7160–7165. [Google Scholar] [CrossRef]
- Schüttelkopf, A.W.; Hardy, L.W.; Beverley, S.M.; Hunter, W.N. Structures of Leishmania major Pteridine Reductase Complexes Reveal the Active Site Features Important for Ligand Binding and to Guide Inhibitor Design. J. Mol. Biol. 2005, 352, 105–116. [Google Scholar] [CrossRef] [PubMed]
- Ito, K.; Kawanishi, S. Photoinduced Hydroxylation of Deoxyguanosine in DNA by Pterins: Sequence Specificity and Mechanism. Biochemistry 1997, 36, 1774–1781. [Google Scholar] [CrossRef]
- Petroselli, G.; Erra-Balsells, R.; Cabrerizo, F.M.; Lorente, C.; Capparelli, A.L.; Braun, A.M.; Oliveros, E.; Thomas, A.H. Photosensitization of 2′-deoxyadenosine-5′-monophosphate by pterin. Org. Biomol. Chem. 2007, 5, 2792–2799. [Google Scholar] [CrossRef]
- Smutna, M.; Svoboda, M.; Breinekova, K. Pterins as Sensors of Response to the Application of Fe3+-Dextran in Piglets. Sensors 2010, 10, 890–900. [Google Scholar] [CrossRef] [PubMed]
- Suga, T.; Munesada, K. The Pigments in the Dorsal Skin of Frogs. J. Nat. Prod. 1988, 51, 713–718. [Google Scholar] [CrossRef] [PubMed]
- Bel, Y.; Porcar, M.; Socha, R.; Němec, V.; Ferré, J. Analysis of pteridines in Pyrrhocoris apterus (L.) (heteroptera, pyrrhocoridae) during development and in body-color mutants. Arch. Insect Biochem. Physiol. 1997, 34, 83–98. [Google Scholar] [CrossRef]
- Porcar, M.; Bel, Y.; Socha, R.; Němec, V.; Ferré, J. Identification of pteridines in the firebug, Pyrrhocoris apterus (L.) (Heteroptera, Pyrrhocoridae) by high -performance liquid chromatography. J. Chromatogr. A 1996, 724, 193–197. [Google Scholar] [CrossRef]
- Niva, C.C.; Takeda, M. Color changes in Halyomorpha brevis (Heteroptera: Pentatomidae) correlated with distribution of pteridines: Regulation by environmental and physiological factors. Comp. Biochem. Physiol. Part B Biochem. Mol. Biol. 2002, 132, 653–660. [Google Scholar] [CrossRef]
- Rutowski, R.L.; Macedonia, J.M.; Morehouse, N.; Taylor-Taft, L. Pterin pigments amplify iridescent ultraviolet signal in males of the orange sulphur butterfly, Colias eurytheme. Proc. R. Soc. B Biol. Sci. 2005, 272, 2329–2335. [Google Scholar] [CrossRef]
- Basu, P.; Burgmayer, S.J.N. Pterin chemistry and its relationship to the molybdenum cofactor. Coord. Chem. Rev. 2011, 255, 1016–1038. [Google Scholar] [CrossRef] [PubMed]
- Gibbons, S.E.; Stayton, I.; Ma, Y. Optimization of urinary pteridine analysis conditions by CE-LIF for clinical use in early cancer detection. Electrophoresis 2009, 30, 3591–3597. [Google Scholar] [CrossRef] [PubMed]
- Ma, Y.; Burton, C. Pteridine detection in urine: The future of cancer diagnostics? Biomark. Med. 2013, 7, 679–681. [Google Scholar] [CrossRef] [PubMed]
- Gamagedara, S.; Gibbons, S.; Ma, Y. Investigation of urinary pteridine levels as potential biomarkers for noninvasive diagnosis of cancer. Clin. Chim. Acta 2011, 412, 120–128. [Google Scholar] [CrossRef] [PubMed]
- Martín Tornero, E.; Durán Merás, I.; Espinosa-Mansilla, A. HPLC determination of serum pteridine pattern as biomarkers. Talanta 2014, 128, 319–326. [Google Scholar] [CrossRef]
- Tomšíková, H.; Tomšík, P.; Solich, P.; Nováková, L. Determination of pteridines in biological samples with an emphasis on their stability. Bioanalysis 2013, 5, 2307–2326. [Google Scholar] [CrossRef]
- Tomšíková, H.; Solich, P.; Nováková, L. Sample preparation and UHPLC-FD analysis of pteridines in human urine. J. Pharm. Biomed. Anal. 2014, 95, 265–272. [Google Scholar] [CrossRef]
- Van Daele, J.; Blancquaert, D.; Kiekens, F.; Van Der Straeten, D.; Lambert, W.E.; Stove, C.P. Degradation and interconversion of plant pteridines during sample preparation and ultra-high performance liquid chromatography–tandem mass spectrometry. Food Chem. 2016, 194, 1189–1198. [Google Scholar] [CrossRef]
- Mansilla, A.E.; Merás, I.D.; Salinas, F. Analysis of pteridines and creatinine in urine by HPLC with serial fluorimetric and photometric detectors. Chromatographia 2001, 53, 510–514. [Google Scholar] [CrossRef]
- Kośliński, P.; Jarzemski, P.; Markuszewski, M.J.; Kaliszan, R. Determination of pterins in urine by HPLC with UV and fluorescent detection using different types of chromatographic stationary phases (HILIC, RP C8, RP C18). J. Pharm. Biomed. Anal. 2014, 91, 37–45. [Google Scholar] [CrossRef]
- Tani, Y.; Ohno, T. Analysis of 6R- and 6S-tetrahydrobiopterin and other pterins by reversed-phase ion-pair liquid chromatography with fluorimetric detection by post-column sodium nitrite oxidation. J. Chromatogr. B Biomed. Sci. Appl. 1993, 617, 249–255. [Google Scholar] [CrossRef]
- Shi, Z.-G.; Wu, Y.-B.; Luo, Y.-B.; Feng, Y.-Q. Analysis of Pterins in Urine by HILIC. Chromatographia 2010, 71, 761–768. [Google Scholar] [CrossRef]
- Xiong, X.; Zhang, Y.; Zhang, W. Simultaneous determination of twelve polar pteridines including dihydro- and tetrahydropteridine in human urine by hydrophilic interaction liquid chromatography with tandem mass spectrometry. Biomed. Chromatogr. 2018, 32, e4244. [Google Scholar] [CrossRef] [PubMed]
- Stea, B.; Halpern, R.M.; Smith, R.A. Separation of unconjugated pteridines by high-pressure cation-exchange liquid chromatography. J. Chromatogr. A 1979, 168, 385–393. [Google Scholar] [CrossRef]
- Klein, R. Determination of the stereoconfiguration of natural pterins by chiral high-performance liquid chromatography. Anal. Biochem. 1992, 203, 134–140. [Google Scholar] [CrossRef]
- Cha, K.W.; Park, S.I.; Lee, Y.K.; Yim, J.J. Capillary Electrophoretic Separation of Pteridine Compounds. Pteridines 1993, 4, 210. [Google Scholar] [CrossRef]
- Han, F.; Huynh, B.H.; Shi, H.; Lin, B.; Ma, Y. Pteridine Analysis in Urine by Capillary Electrophoresis Using Laser-Induced Fluorescence Detection. Anal. Chem. 1999, 71, 1265–1269. [Google Scholar] [CrossRef]
- Fabricant, S.A.; Kemp, D.J.; Krajíček, J.; Bosáková, Z.; Herberstein, M.E. Mechanisms of Color Production in a Highly Variable Shield-Back Stinkbug, Tectocoris diopthalmus (Heteroptera: Scutelleridae), and Why It Matters. PLoS ONE 2013, 8, e64082. [Google Scholar] [CrossRef]
- Krajicek, J.; Kozlik, P.; Exnerova, A.; Stys, P.; Bursova, M.; Cabala, R.; Bosakova, Z. Capillary electrophoresis of pterin derivatives responsible for the warning coloration of Heteroptera. J. Chromatography. A 2014, 1336, 94–100. [Google Scholar] [CrossRef] [PubMed]
- Couderc, F.; Ong-Meang, V.; Poinsot, V. Capillary electrophoresis hyphenated with UV-native-laser induced fluorescence detection (CE/UV-native-LIF). Electrophoresis 2017, 38, 135–149. [Google Scholar] [CrossRef]
- Kumazawa, K.; Tabata, H. A Three-Dimensional Fluorescence Analysis of the Wings of Male Morpho sulkowskyi and Papilio xuthus Butterflies. Zool. Sci. 2001, 18, 1073–1079. [Google Scholar] [CrossRef]
- Thomas, A.H.; Lorente, C.; Capparelli, A.L.; Pokhrel, M.R.; Braun, A.M.; Oliveros, E. Fluorescence of pterin, 6-formylpterin, 6-carboxypterin and folic acid in aqueous solution: pH effects. Photochem. Photobiol. Sci. 2002, 1, 421–426. [Google Scholar] [CrossRef] [PubMed]
- DiScipio, R.M.; Santiago, R.Y.; Taylor, D.; Crespo-Hernández, C.E. Electronic relaxation pathways of the biologically relevant pterin chromophore. Phys. Chem. Chem. Phys. 2017, 19, 12720–12729. [Google Scholar] [CrossRef] [PubMed]
- Zetalif LED. Available online: http://www.adelis-tech.com/product/zetalif-led/ (accessed on 15 March 2019).
- Sharikova, A.V. UV Laser and LED Induced Fluorescence Spectroscopy for Detection of trace Amounts of Organics in Drinking Water and Water Sources. Master’s Thesis, University of South Florida, Tampa, FL, USA, 2009. [Google Scholar]
- Mitchell, B.L.; Yasui, Y.; Li, C.I.; Fitzpatrick, A.L.; Lampe, P.D. Impact of freeze-thaw cycles and storage time on plasma samples used in mass spectrometry based biomarker discovery projects. Cancer Inform. 2005, 1, 98–104. [Google Scholar] [CrossRef] [PubMed]
- Cuhadar, S.; Koseoglu, M.; Atay, A.; Dirican, A. The effect of storage time and freeze-thaw cycles on the stability of serum samples. Biochem. Med. 2013, 23, 70. [Google Scholar] [CrossRef]
- Hernandes, V.V.; Barbas, C.; Dudzik, D. A review of blood sample handling and pre-processing for metabolomics studies. Electrophoresis 2017, 38, 2232–2241. [Google Scholar] [CrossRef]
- Rotter, M.; Brandmaier, S.; Prehn, C.; Adam, J.; Rabstein, S.; Gawrych, K.; Brüning, T.; Illig, T.; Lickert, H.; Adamski, J.; et al. Stability of targeted metabolite profiles of urine samples under different storage conditions. Metab. Off. J. Metab. Soc. 2017, 13, 4. [Google Scholar] [CrossRef]
- Erben, V.; Bhardwaj, M.; Schrotz-King, P.; Brenner, H. Metabolomics Biomarkers for Detection of Colorectal Neoplasms: A Systematic Review. Cancers 2018, 10, 246. [Google Scholar] [CrossRef]
Sample Availability: Samples of the compounds are not available from the authors. |


| Analyte | Linear Range (µM) | Linear Equation | LOD (µM) | LOQ (µM) | ||||
|---|---|---|---|---|---|---|---|---|
| R2 | y = ax + b | a ± SD | b ± SD | |||||
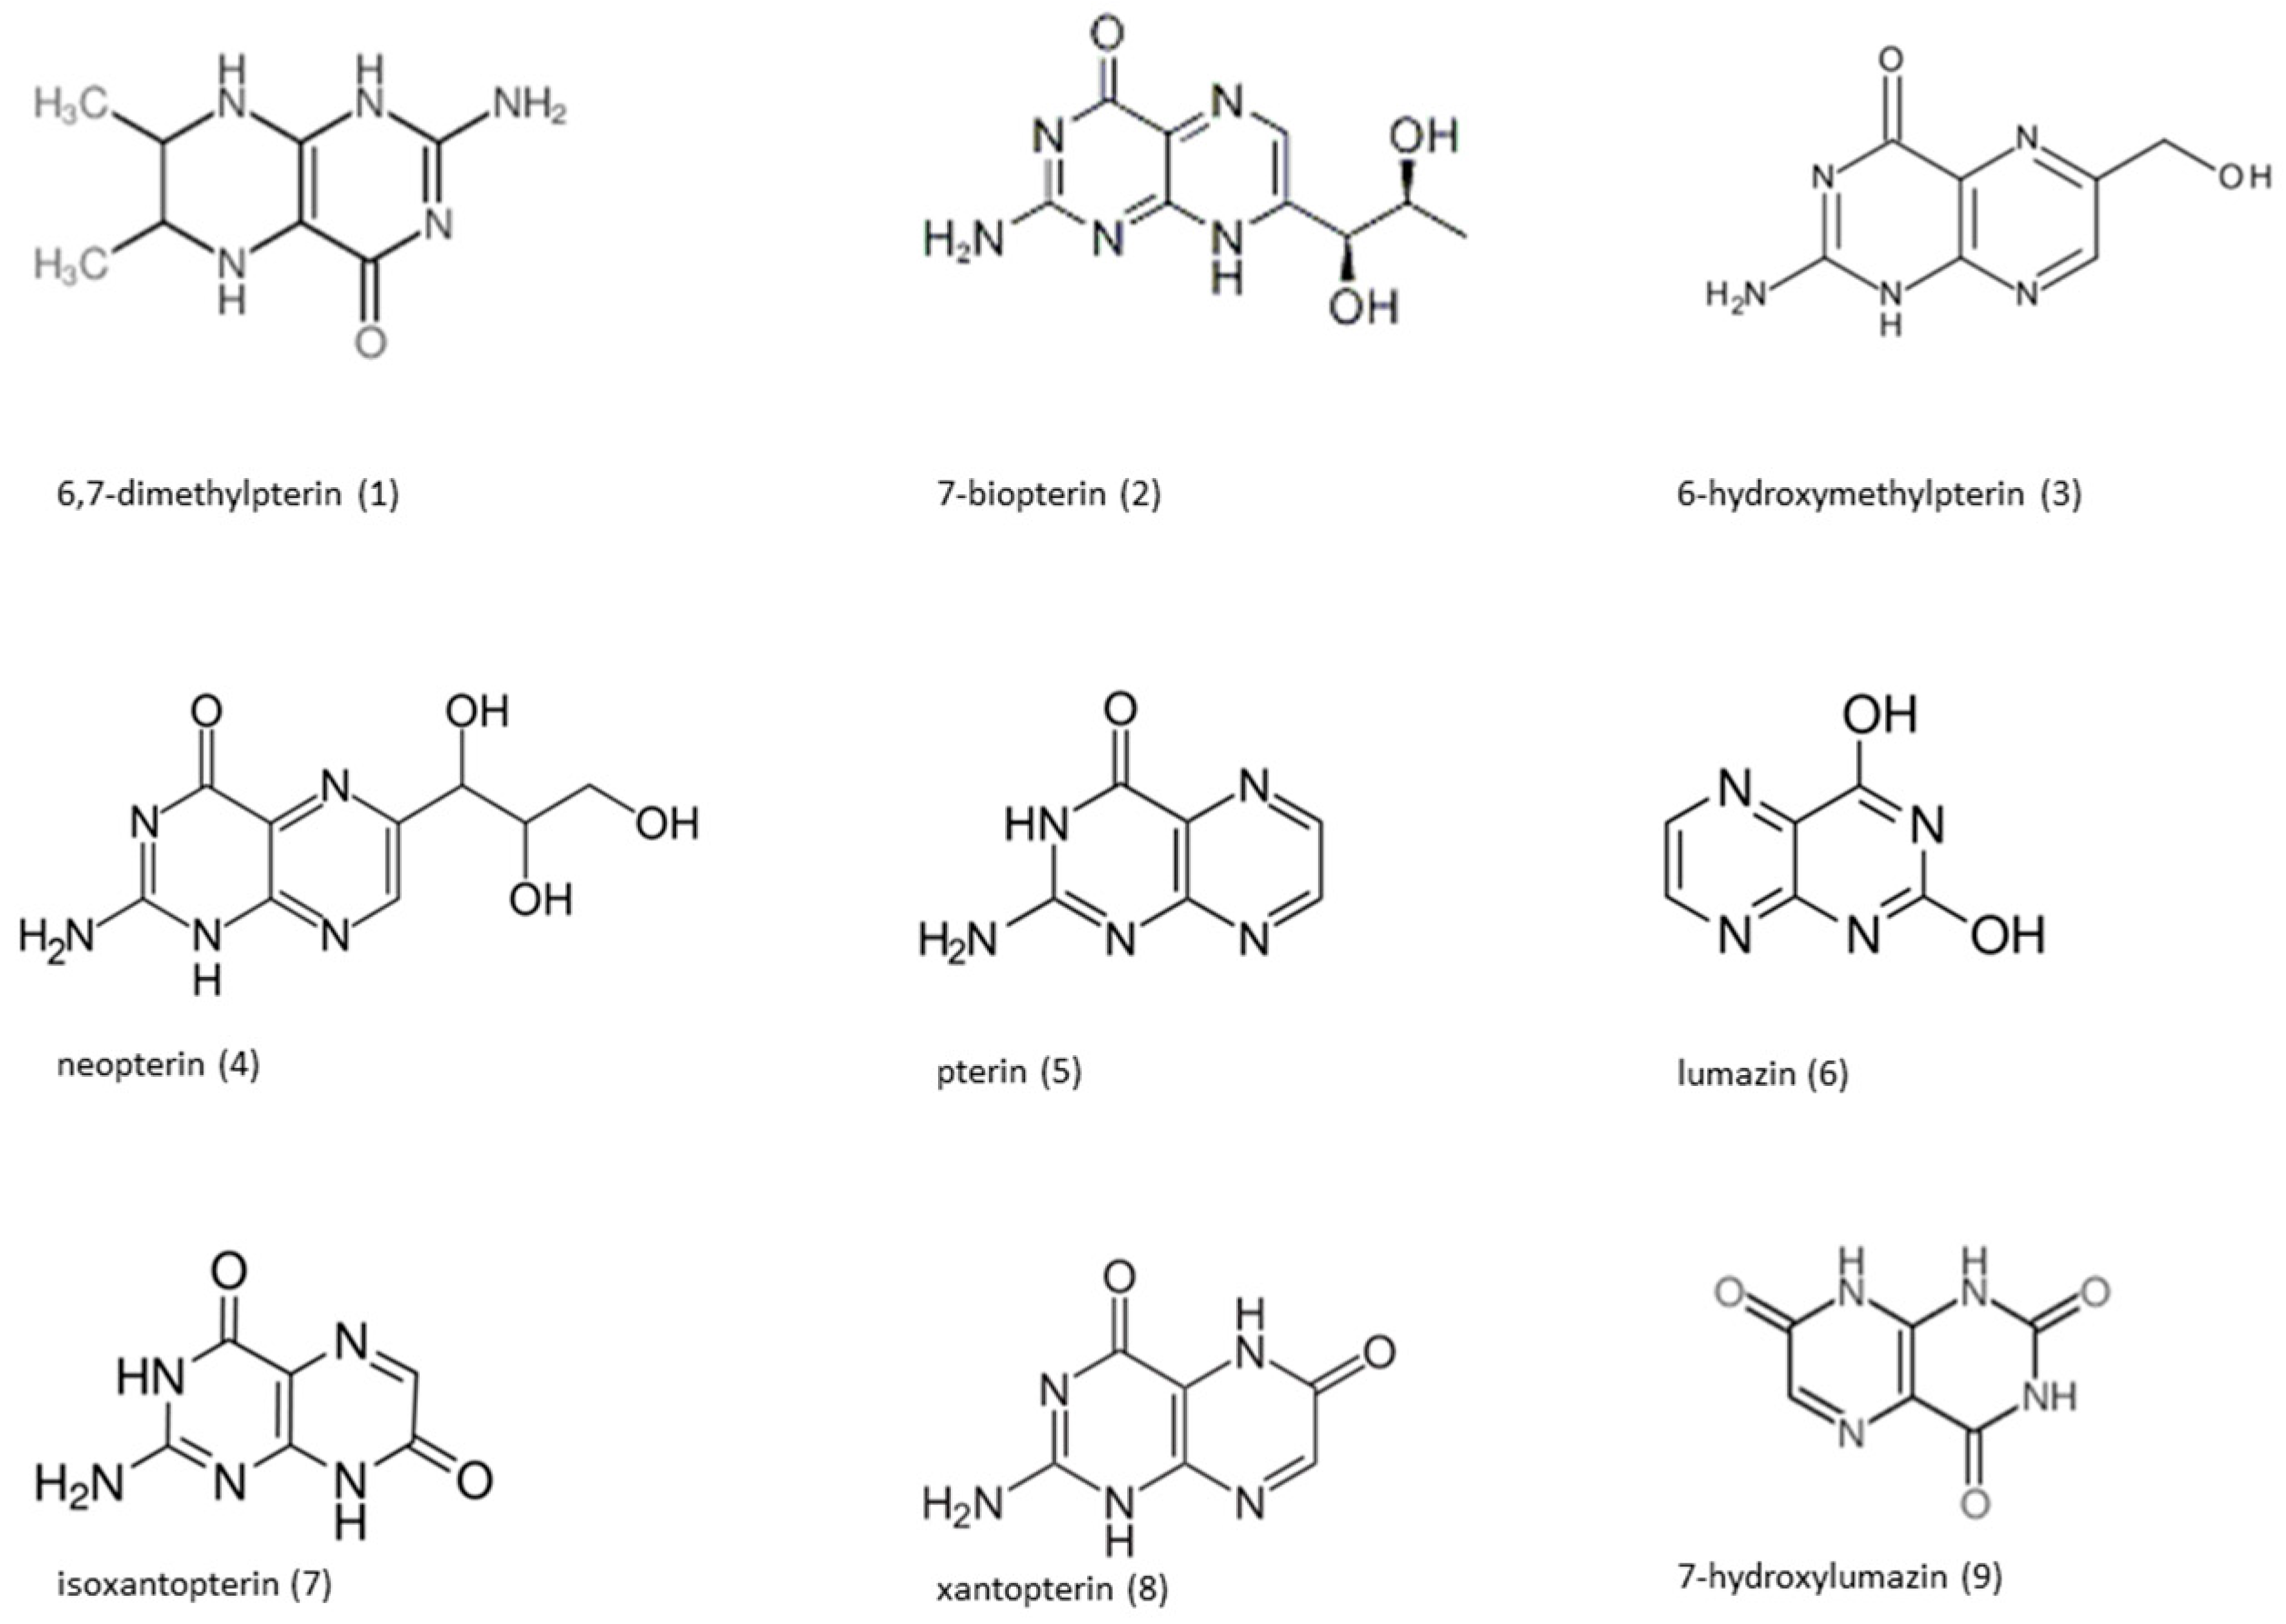
| 1 | 6,7-dimethylpterin | 0.3–15 | 0.998 | y = 6.4243x − 0.0314 | 0.094 | 0.002 | 0.1 | 0.3 |
| 2 | 7-biopterin | 0.3–15 | 0.996 | y = 2.7664x + 0.0009 | 0.026 | 0.018 | 0.1 | 0.3 |
| 3 | 6-hydroxymethylpterin | 0.3–15 | 0.999 | y = 5.7163x − 0.0263 | 0.036 | 0.003 | 0.1 | 0.3 |
| 4 | Neopterin | 0.3–15 | 0.999 | y = 3.5174x - 0.0099 | 0.016 | 0.008 | 0.1 | 0.3 |
| 5 | Pterin | 0.3–15 | 0.999 | y = 2.181x + 0.0005 | 0.017 | 0.004 | 0.1 | 0.3 |
| 6 | Lumazin | 0.3–15 | 0.999 | y = 2.3918x − 0.0048 | 0.008 | 0.005 | 0.1 | 0.3 |
| 7 | Isoxantopterin | 0.3–15 | 0.999 | y = 1.7642x − 0.0043 | 0.029 | 0.002 | 0.1 | 0.3 |
| 8 | Xantopterin | 0.3–15 | 0.999 | y = 1.2531x + 0.003 | 0.012 | 0.002 | 0.1 | 0.3 |
| 9 | 7-hydroxylumazin | 0.3–15 | 0.996 | y = 1.4541x + 0.0127 | 0.020 | 0.013 | 0.1 | 0.3 |
| Analyte | Concentration | Repeatability | Accuracy (%) (n = 5) | ||
|---|---|---|---|---|---|
| Level | (µM) | Intra-Day %RSD (n = 5) | Inter-Day %RSD (n = 15) | ||
| 6,7-dimethylpterin | LQC | 0.75 | 1.56 | 4.95 | 106.20 |
| MQC | 4 | 2.15 | 5.33 | 96.10 | |
| HQC | 12 | 0.80 | 3.14 | 91.70 | |
| 7-biopterin | LQC | 0.75 | 2.53 | 4.71 | 110.20 |
| MQC | 4 | 0.98 | 0.98 | 103.60 | |
| HQC | 12 | 2.42 | 6.59 | 100.50 | |
| 6-hydroxymethylpterin | LQC | 0.75 | 1.44 | 3.92 | 110.60 |
| MQC | 4 | 1.54 | 5.54 | 98.49 | |
| HQC | 12 | 0.87 | 7.24 | 96.28 | |
| Neopterin | LQC | 0.75 | 2.61 | 5.94 | 106.80 |
| MQC | 4 | 1.21 | 6.47 | 95.66 | |
| HQC | 12 | 1.40 | 5.48 | 93.20 | |
| Pterin | LQC | 0.75 | 1.94 | 5.64 | 102.90 |
| MQC | 4 | 1.26 | 6.45 | 95.70 | |
| HQC | 12 | 0.62 | 5.34 | 94.30 | |
| Lumazin | LQC | 0.75 | 3.12 | 6.74 | 107.40 |
| MQC | 4 | 1.69 | 6.85 | 97.50 | |
| HQC | 12 | 2.10 | 3.96 | 92.40 | |
| Isoxantopterin | LQC | 0.75 | 3.86 | 30.45 | 84.10 |
| MQC | 4 | 5.22 | 22.92 | 79.50 | |
| HQC | 12 | 2.55 | 22.12 | 71.20 | |
| Xantopterin | LQC | 0.75 | 4.95 | 5.32 | 106.70 |
| MQC | 4 | 2.57 | 10.57 | 105.70 | |
| HQC | 12 | 1.63 | 5.17 | 94.20 | |
| 7-hydroxylumazin | LQC | 0.75 | 3.27 | 7.17 | 103.30 |
| MQC | 4 | 3.43 | 7.36 | 105.90 | |
| HQC | 12 | 3.53 | 7.64 | 106.40 | |
| Analyte | Concentration | Stability% | %RSD | |||
|---|---|---|---|---|---|---|
| Level | (µM) | After 3 h | After 6 h | |||
| 1 | 6,7-dimethylpterin | LQC | 0.75 | 94 | 88 | 7.0 |
| HQC | 12.00 | 105 | 102 | 5.2 | ||
| 2 | 7-biopterin | LQC | 0.75 | 89 | 87 | 7.1 |
| HQC | 12.00 | 103 | 105 | 4.8 | ||
| 3 | 6-hydroxymethylpterin | LQC | 0.75 | 89 | 88 | 7.1 |
| HQC | 12.00 | 105 | 102 | 5.6 | ||
| 4 | Neopterin | LQC | 0.75 | 93 | 88 | 7.7 |
| HQC | 12.00 | 107 | 102 | 6.8 | ||
| 5 | Pterin | LQC | 0.75 | 95 | 91 | 6.1 |
| HQC | 12.00 | 106 | 101 | 6.7 | ||
| 6 | Lumazin | LQC | 0.75 | 92 | 89 | 6.5 |
| HQC | 12.00 | 105 | 101 | 7.0 | ||
| 7 | Isoxantoptein | LQC | 0.75 | 93 | 91 | 6.5 |
| HQC | 12.00 | 106 | 101 | 6.9 | ||
| 8 | Xantopterin | LQC | 0.75 | 96 | 93 | 6.6 |
| HQC | 12.00 | 105 | 101 | 6.6 | ||
| 9 | 7-hydroxylumazin | LQC | 0.75 | 90 | 73 | 14.1 |
| Analyte | Concentration | Stability% | %RSD | |||
|---|---|---|---|---|---|---|
| Level | (µM) | After 24 h | After 48 h | |||
| 1 | 6,7-dimethylpterin | LQC | 0.75 | 94 | 94 | 4.1 |
| HQC | 12.00 | 97 | 103 | 3.2 | ||
| 2 | 7-biopterin | LQC | 0.75 | 84 | 104 | 13.1 |
| HQC | 12.00 | 111 | 107 | 5.6 | ||
| 3 | 6-hydroxymethylpterin | LQC | 0.75 | 91 | 93 | 7.6 |
| HQC | 12.00 | 108 | 101 | 4.0 | ||
| 4 | Neopterin | LQC | 0.75 | 95 | 87 | 9.0 |
| HQC | 12.00 | 100 | 98 | 3.1 | ||
| 5 | Pterin | LQC | 0.75 | 98 | 86 | 8.9 |
| HQC | 12.00 | 107 | 94 | 6.3 | ||
| 6 | Lumazin | LQC | 0.75 | 94 | 83 | 11.4 |
| HQC | 12.00 | 97 | 88 | 10.2 | ||
| 7 | Isoxantoptein | LQC | 0.75 | 97 | 62 | 21.8 |
| HQC | 12.00 | 91 | 98 | 13.4 | ||
| 8 | Xantopterin | LQC | 0.75 | 98 | 92 | 7.0 |
| HQC | 12.00 | 101 | 94 | 4.4 | ||
| 9 | 7-hydroxylumazin | LQC | 0.75 | 89 | 72 | 17.0 |
| HQC | 12.00 | 96 | 92 | 5.3 | ||
| Analyte | Concentration Measured (µM) | ||||||||||
|---|---|---|---|---|---|---|---|---|---|---|---|
| C1 * | C2 | C4 | C4 | C5 | H1 ** | H2 | H3 | H4 | H5 | ||
| 1 | 6,7-dimethylpterin | NA | 0.84 | 1.80 | NA | 0.36 | 0.33 | 0.82 | 0.59 | NA | NA |
| 2 | 7-biopterin | 3.67 | 1.40 | NA | 2.43 | 2.31 | 3.11 | 3.04 | 8.06 | 0.53 | 1.73 |
| 3 | 6-hydroxymethylpterin | NA | NA | 0.99 | 1.15 | NA | 0.31 | NA | NA | 0.64 | 1.40 |
| 4 | Neopterin | 2.06 | 0.72 | 0.39 | 1.01 | 1.05 | 1.05 | 0.92 | 3.37 | 0.86 | 0.97 |
| 5 | Pterin | 2.08 | 0.67 | 0.49 | 1.94 | 1.05 | 1.10 | 1.62 | 4.91 | 0.57 | 1.44 |
| 6 | Lumazin | 2.12 | NA | 0.74 | 6.43 | NA | NA | 0.65 | 1.42 | 3.43 | 10.63 |
| 8 | Xantopterin | 0.78 | 2.48 | 0.84 | 8.72 | 4.94 | 6.20 | 5.16 | 0.80 | 3.53 | 4.63 |
| 9 | 7-hydroxylumazin | 10.63 | 0.86 | 12.29 | 2.14 | 3.54 | 3.64 | 3.75 | 3.71 | 10.5 | 1.15 |
© 2019 by the authors. Licensee MDPI, Basel, Switzerland. This article is an open access article distributed under the terms and conditions of the Creative Commons Attribution (CC BY) license (http://creativecommons.org/licenses/by/4.0/).
Share and Cite
Grochocki, W.; Buszewska-Forajta, M.; Macioszek, S.; J. Markuszewski, M. Determination of Urinary Pterins by Capillary Electrophoresis Coupled with LED-Induced Fluorescence Detector. Molecules 2019, 24, 1166. https://doi.org/10.3390/molecules24061166
Grochocki W, Buszewska-Forajta M, Macioszek S, J. Markuszewski M. Determination of Urinary Pterins by Capillary Electrophoresis Coupled with LED-Induced Fluorescence Detector. Molecules. 2019; 24(6):1166. https://doi.org/10.3390/molecules24061166
Chicago/Turabian StyleGrochocki, Wojciech, Magdalena Buszewska-Forajta, Szymon Macioszek, and Michał J. Markuszewski. 2019. "Determination of Urinary Pterins by Capillary Electrophoresis Coupled with LED-Induced Fluorescence Detector" Molecules 24, no. 6: 1166. https://doi.org/10.3390/molecules24061166
APA StyleGrochocki, W., Buszewska-Forajta, M., Macioszek, S., & J. Markuszewski, M. (2019). Determination of Urinary Pterins by Capillary Electrophoresis Coupled with LED-Induced Fluorescence Detector. Molecules, 24(6), 1166. https://doi.org/10.3390/molecules24061166