Preservation of Cichoric Acid Antioxidant Properties Loaded in Heat Treated Lactoferrin Nanoparticles


Abstract
1. Introduction
2. Results and Discussion
2.1. Result of Fluorescence Measurement of LF
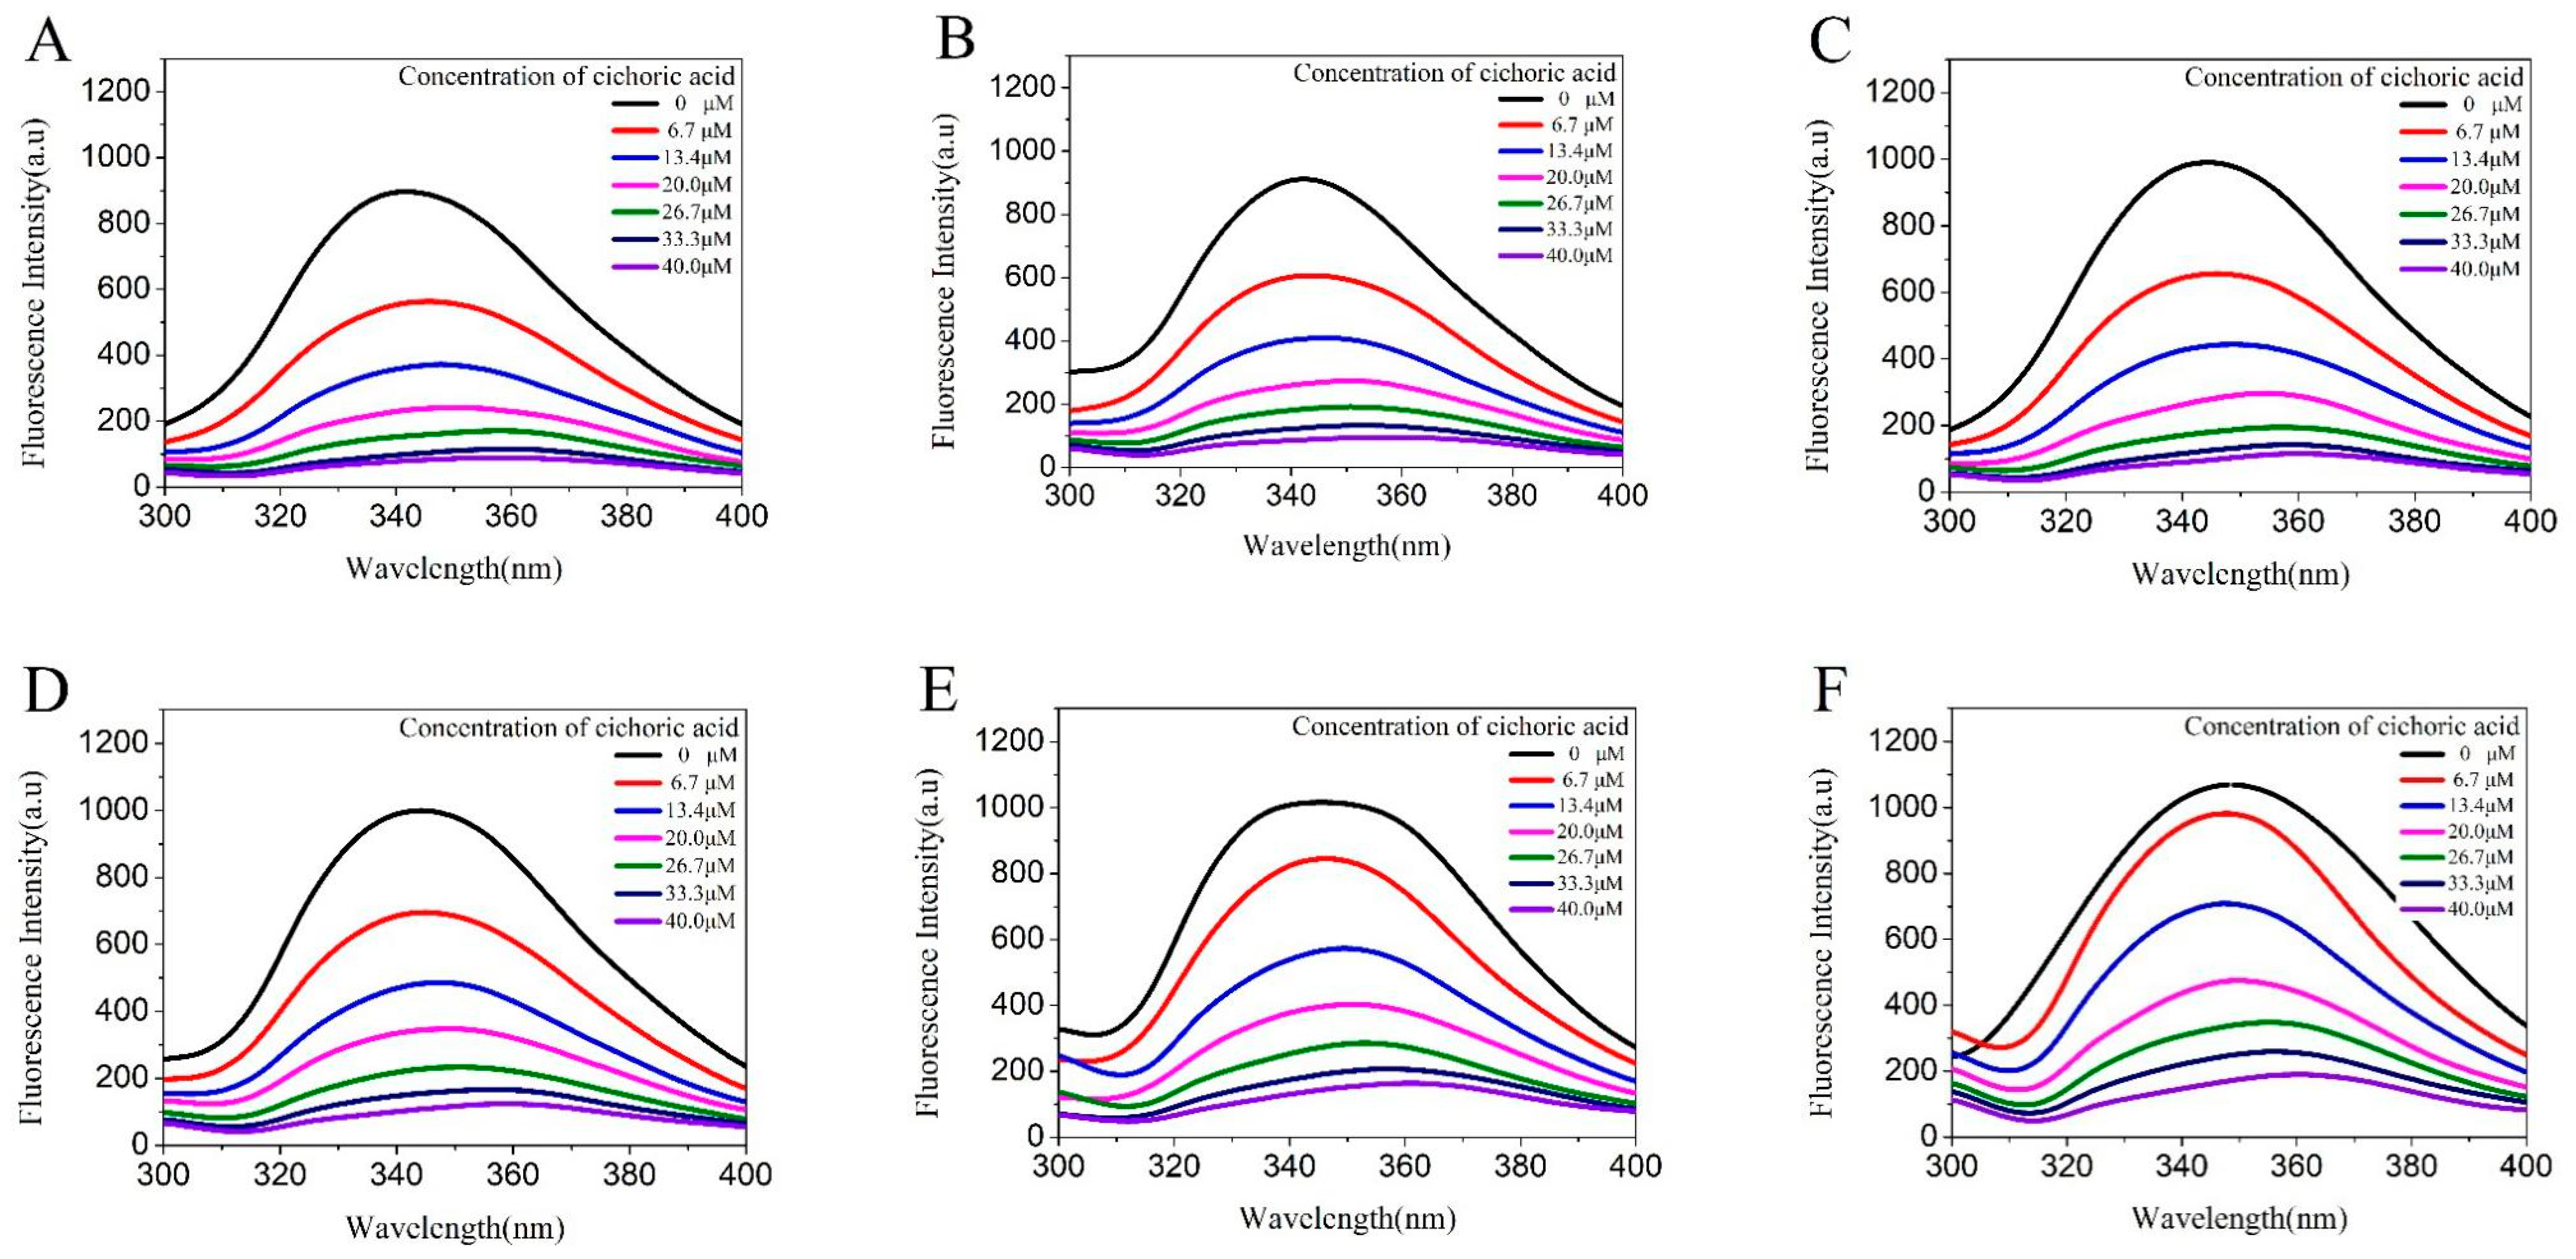
2.1.1. Fluorescence Spectroscopy
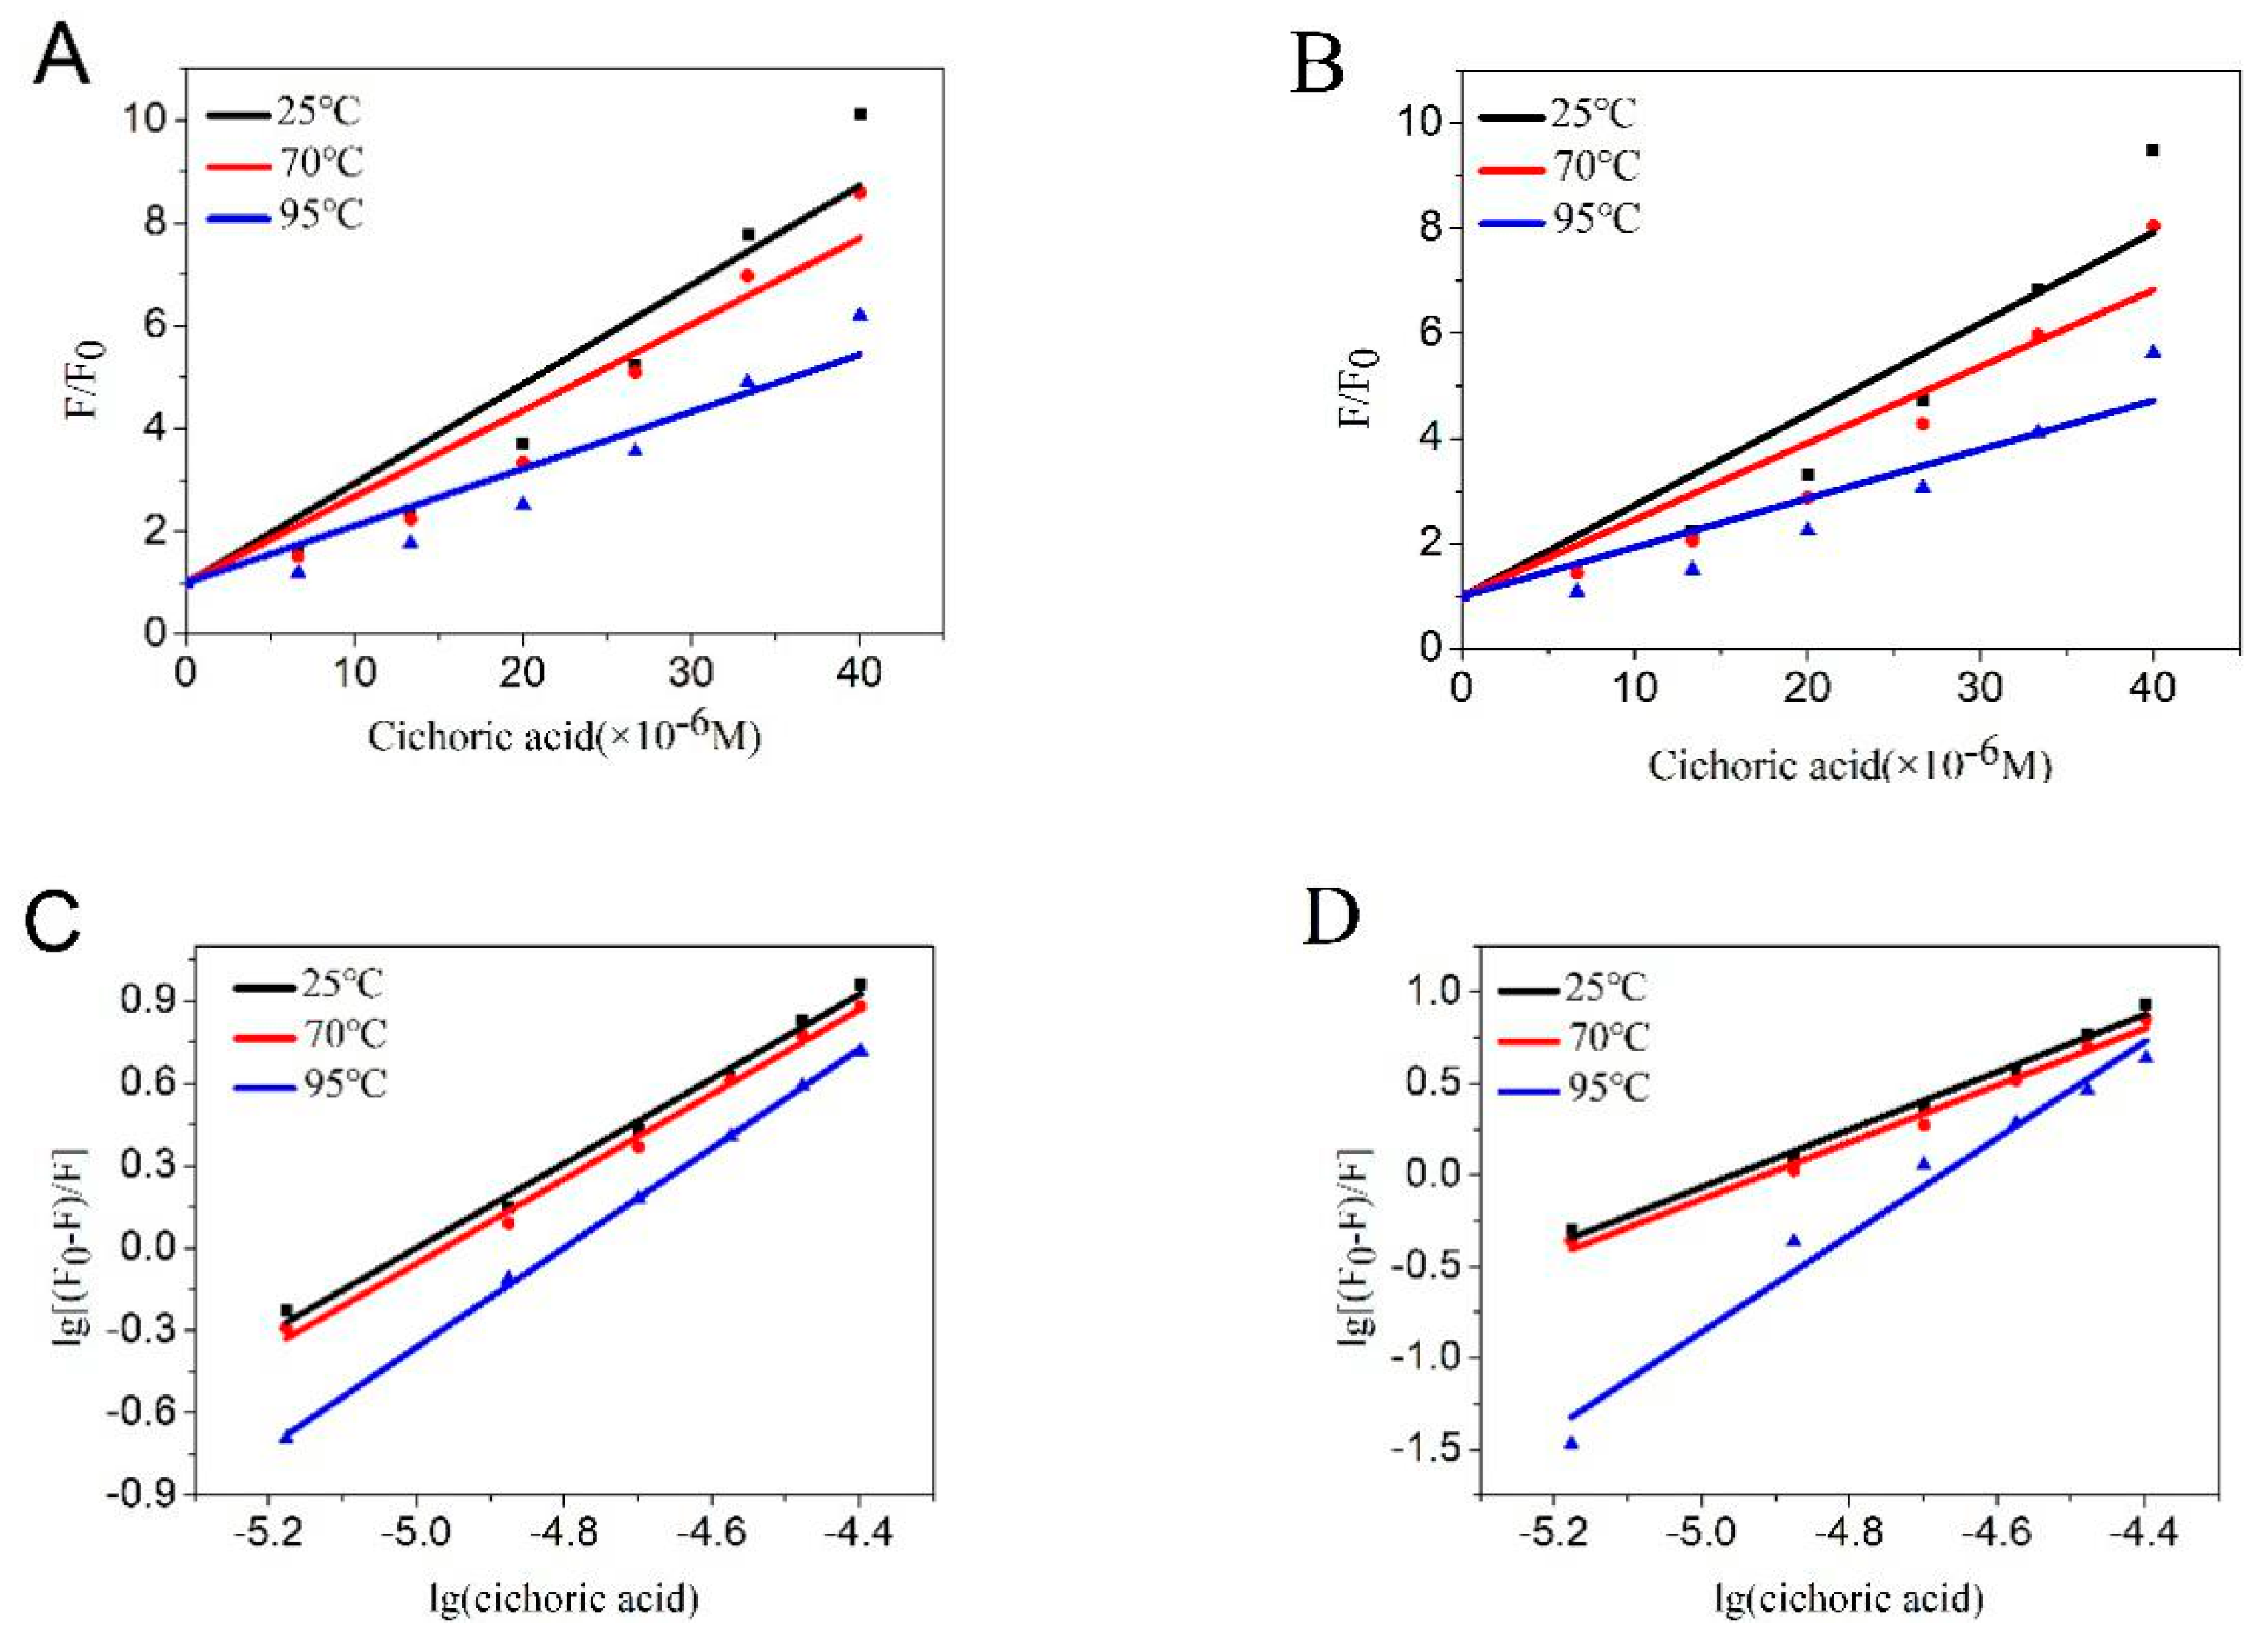
2.1.2. Quenching Type
2.1.3. Binding Constants and Binding Sites
2.1.4. Thermodynamic Parameters and Types of Action
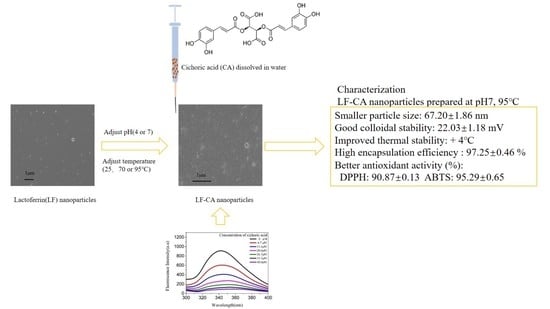
2.2. Characterization of Nanoparticles
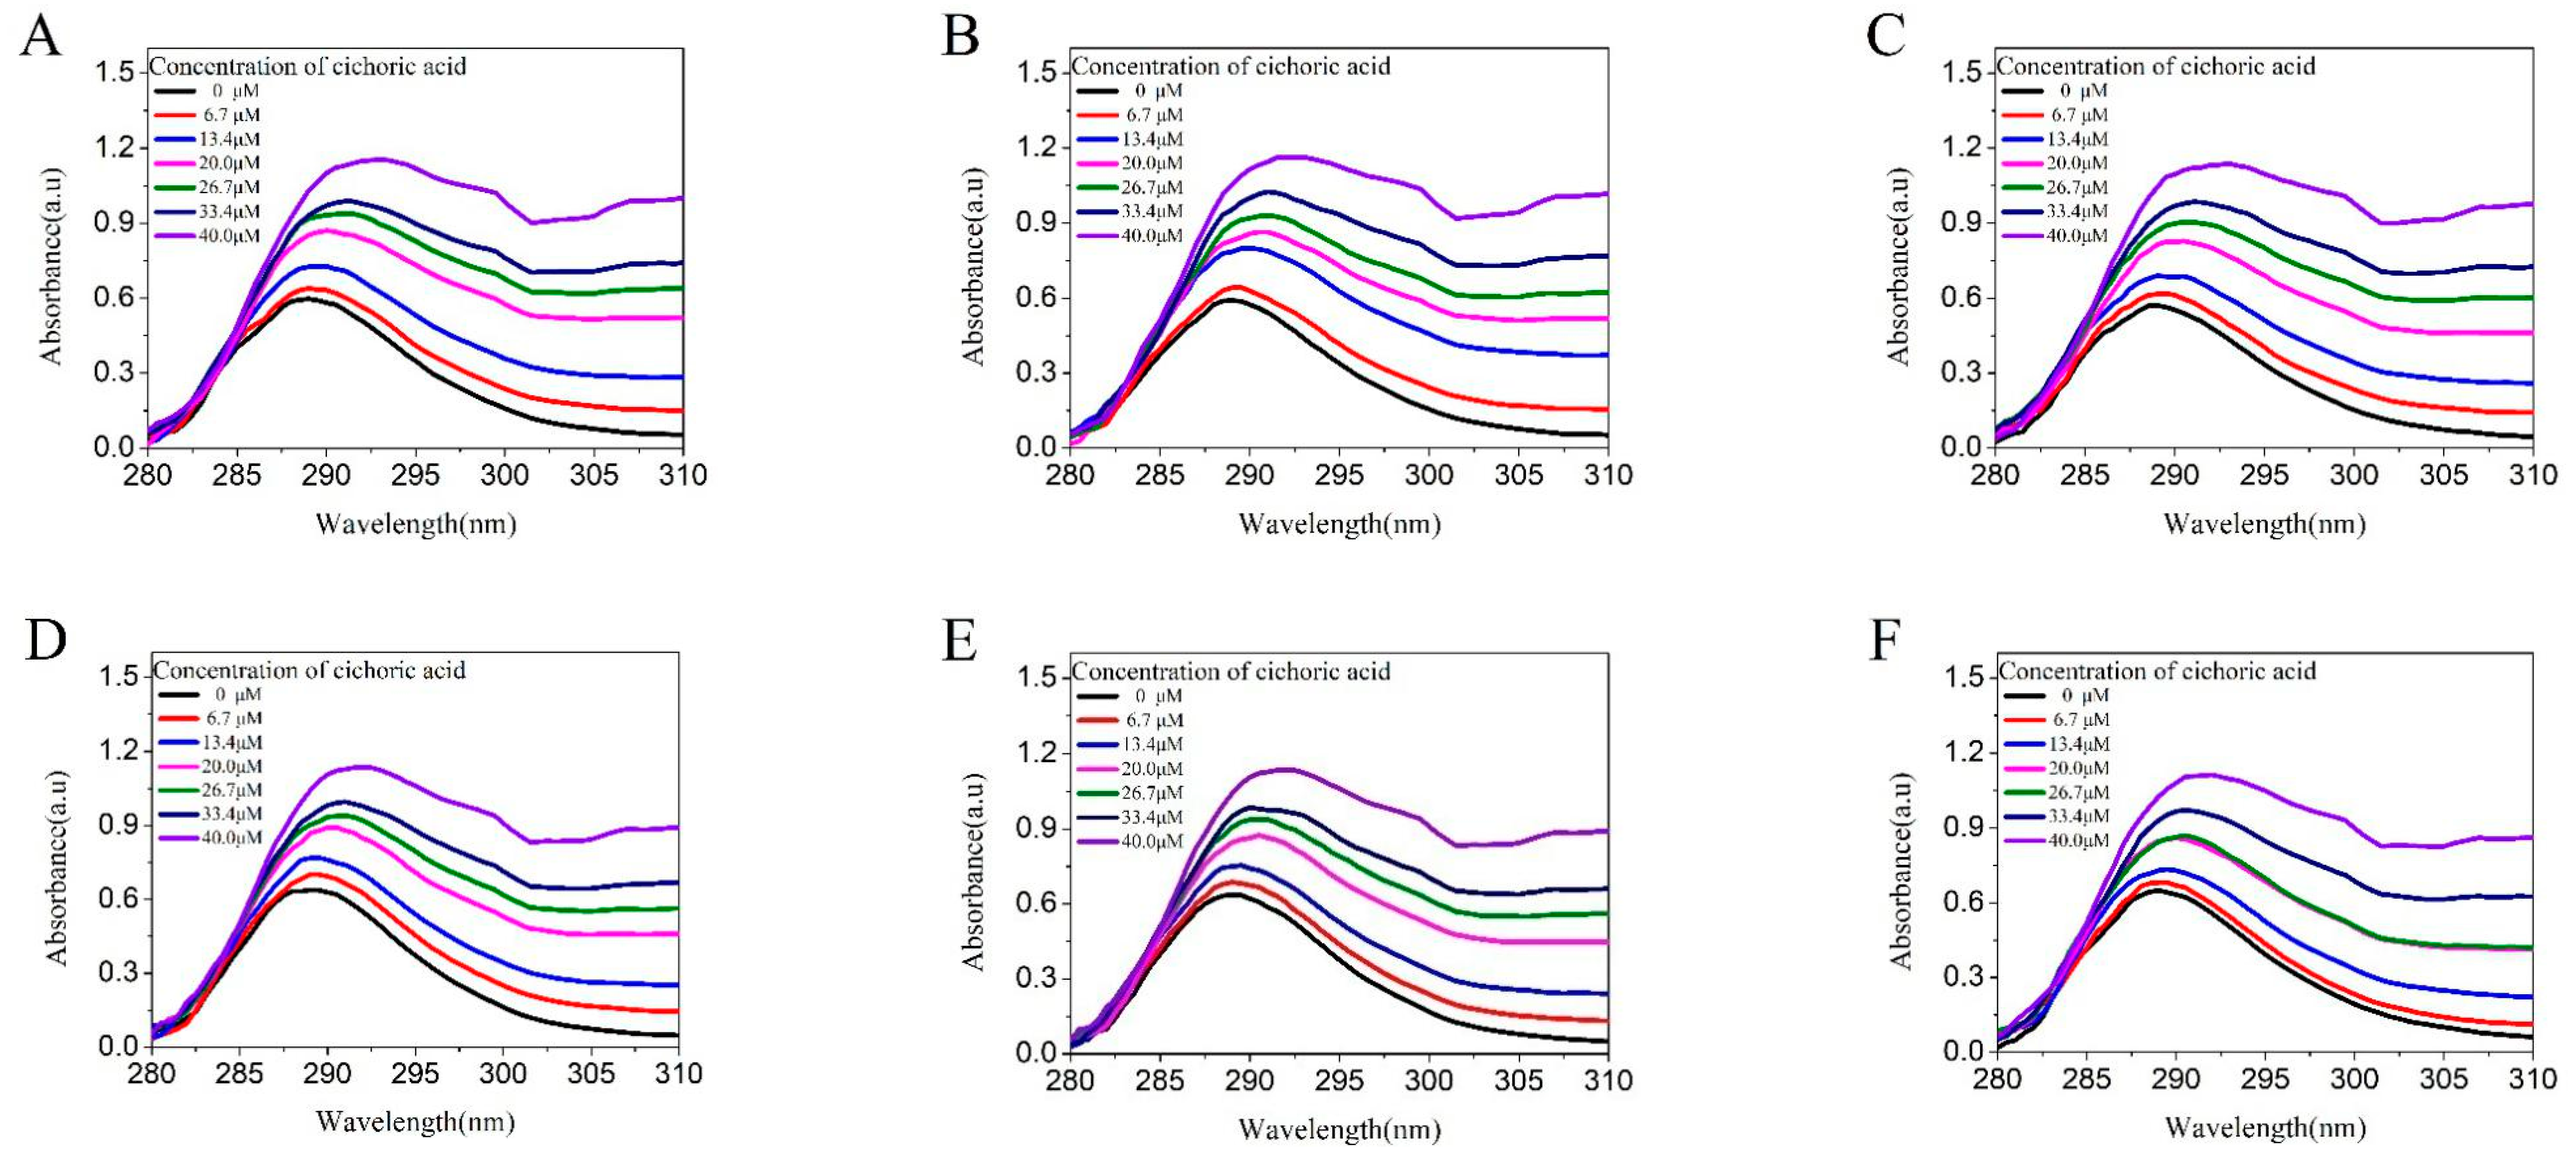
2.2.1. UV Light Spectral Scanning
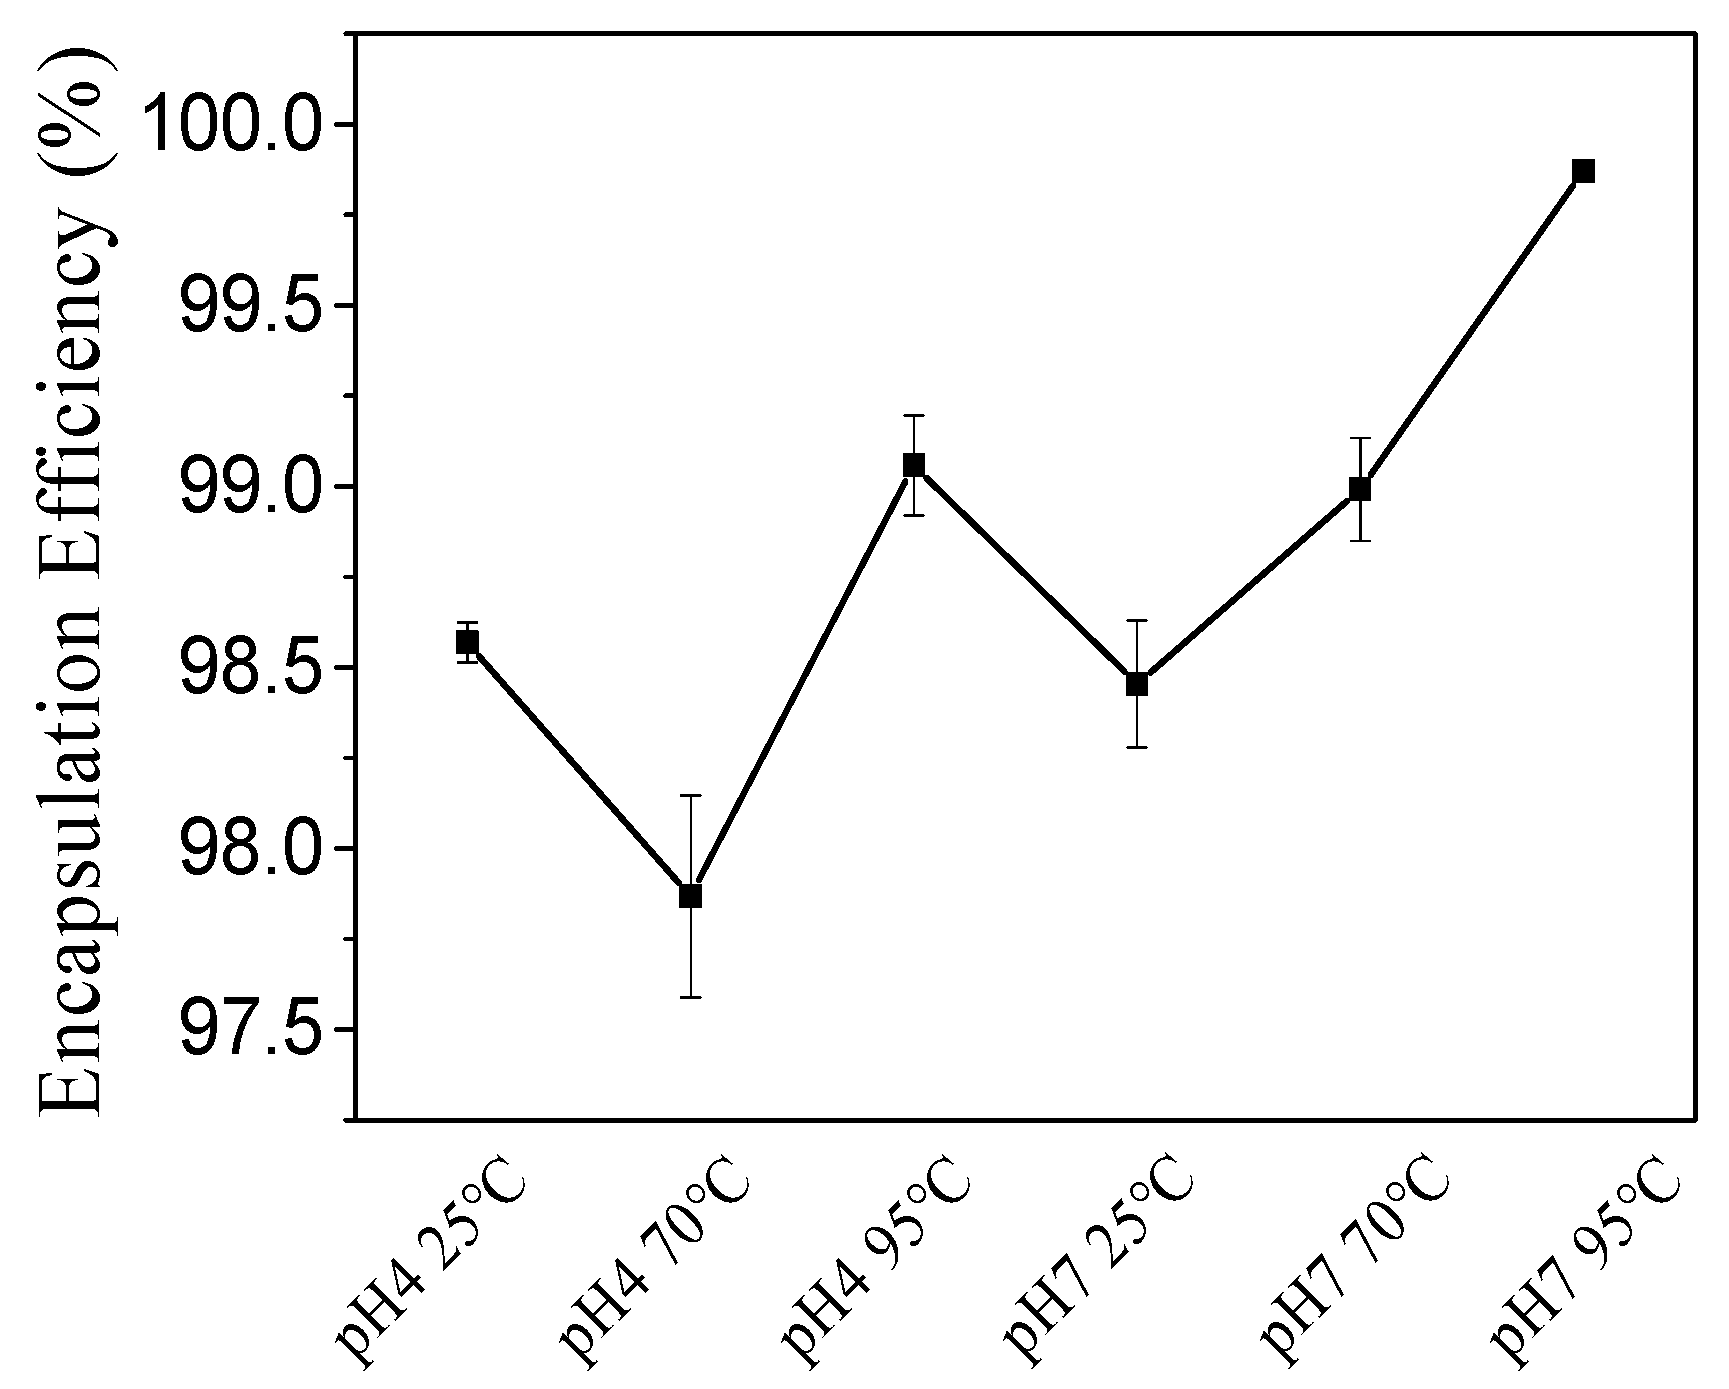
2.2.2. EE (%)
2.2.3. The Particle Size, Zeta-Potential, and PdI
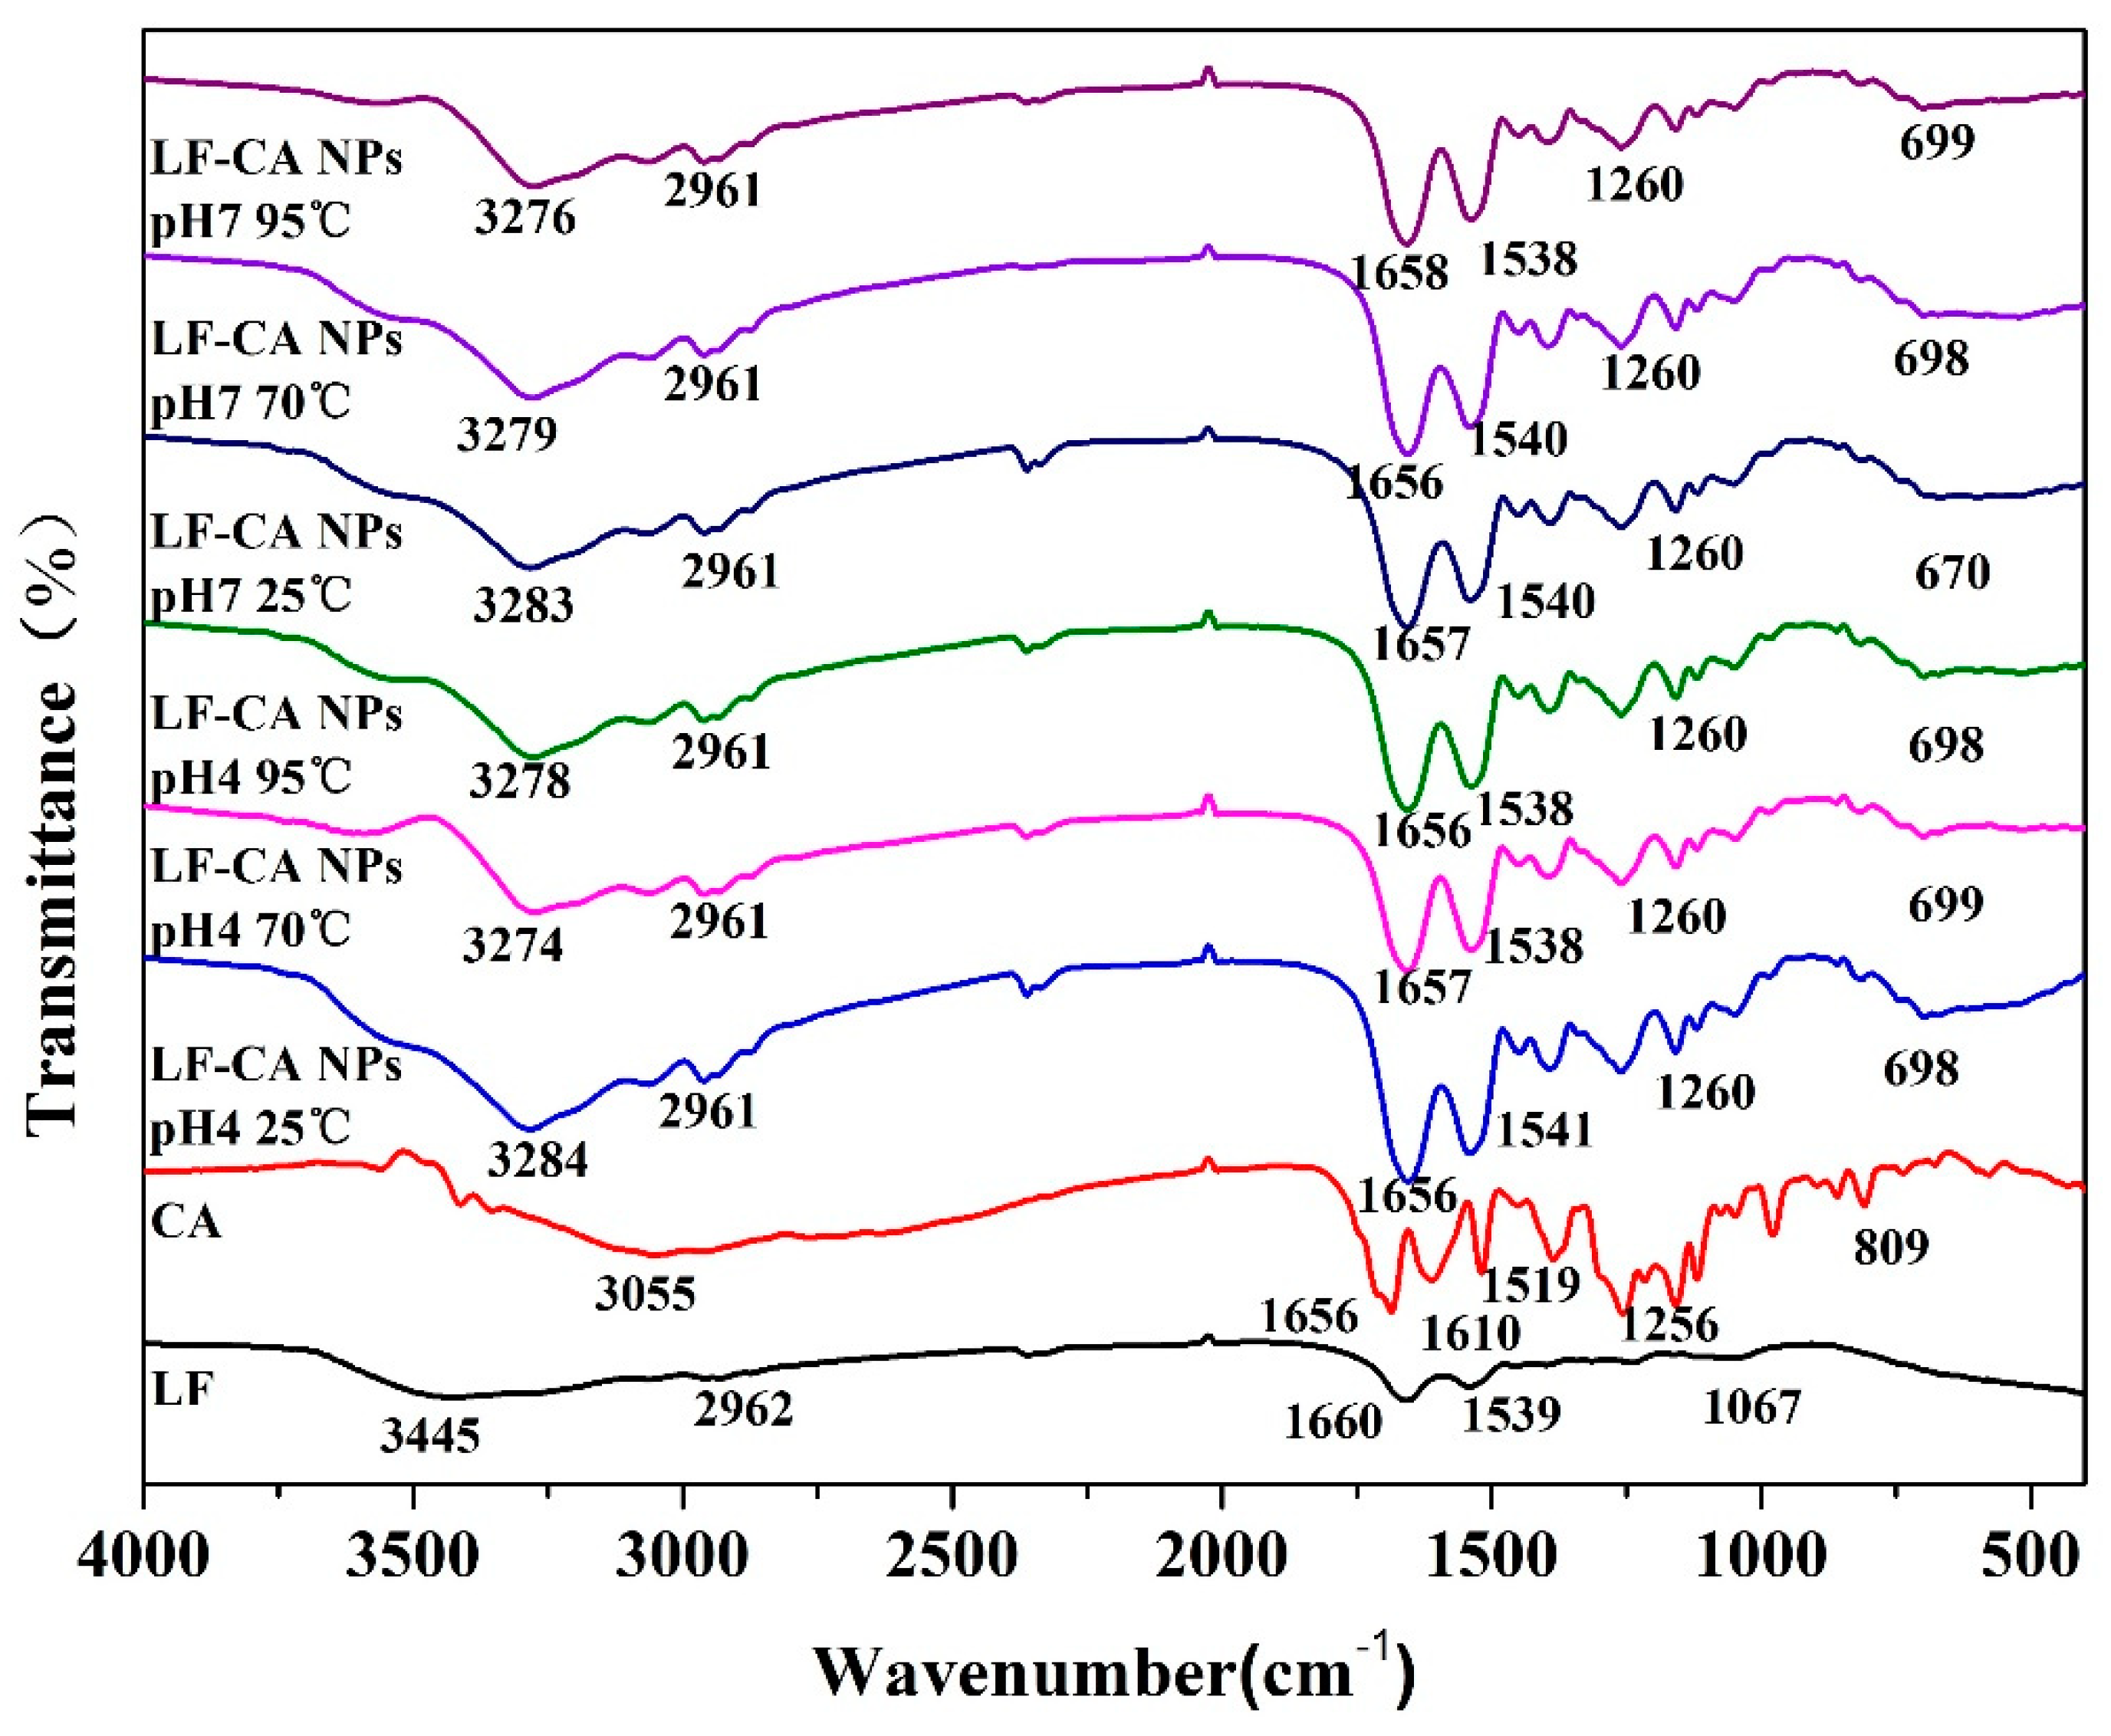
2.2.4. FTIR
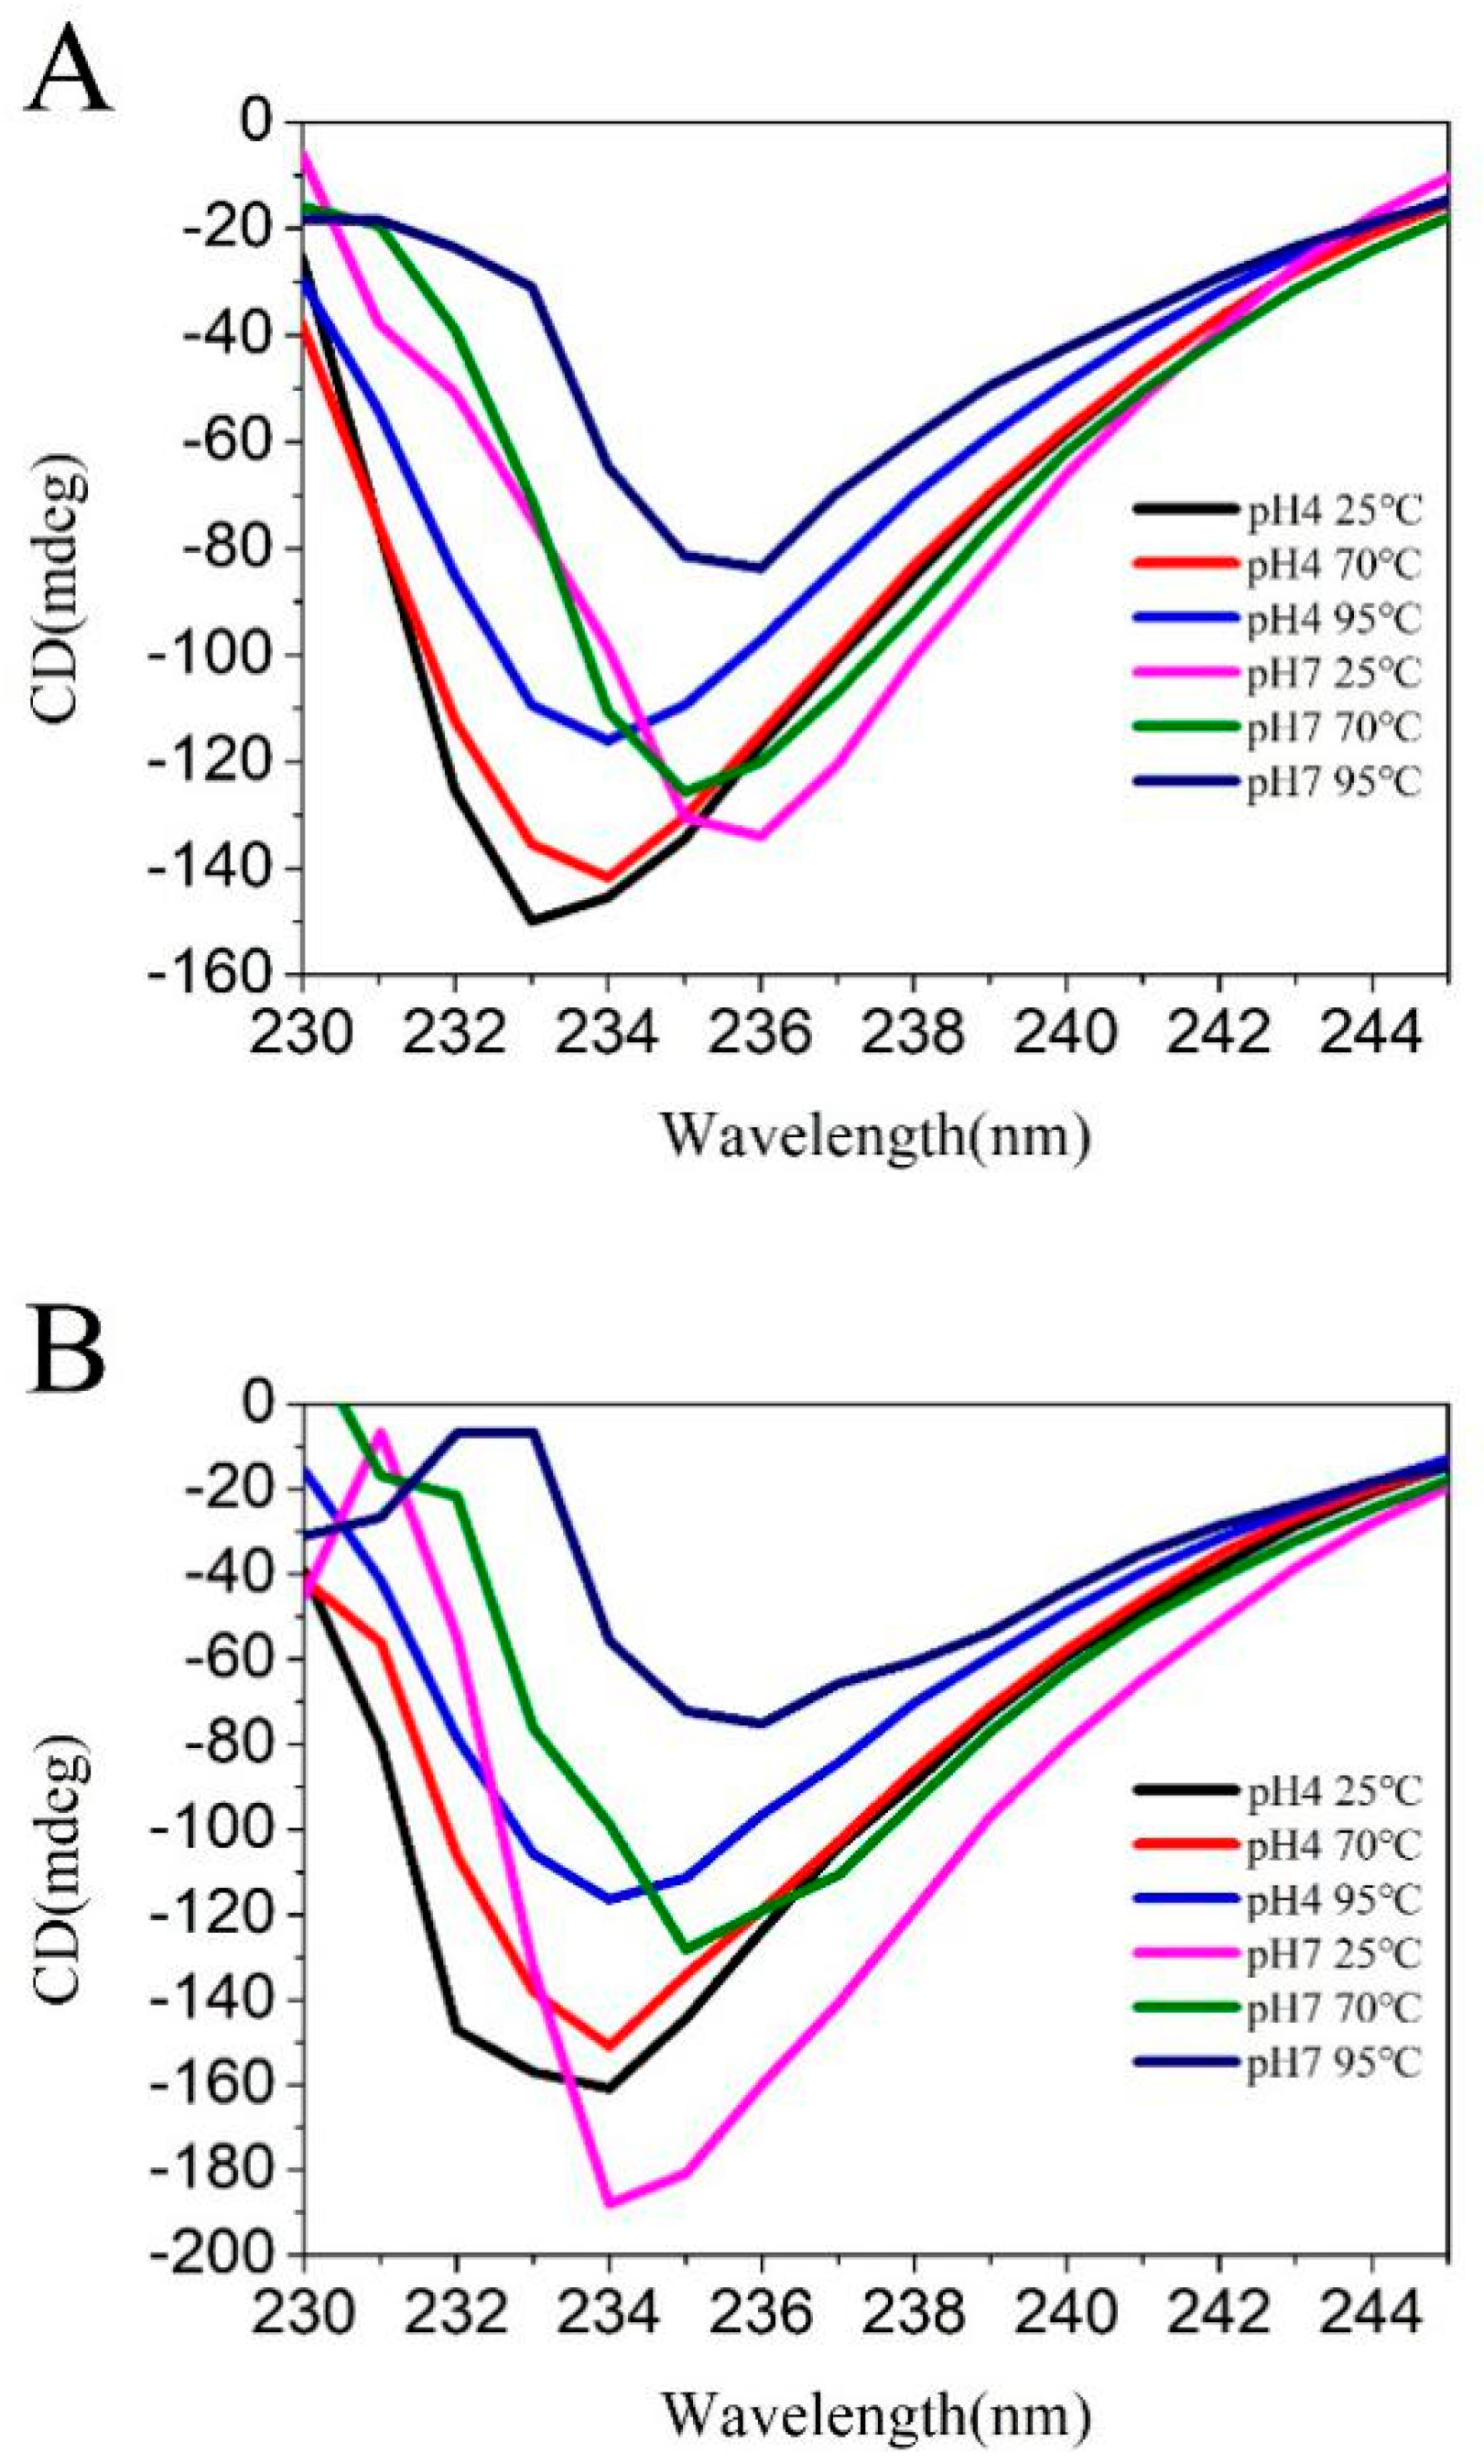
2.2.5. CD
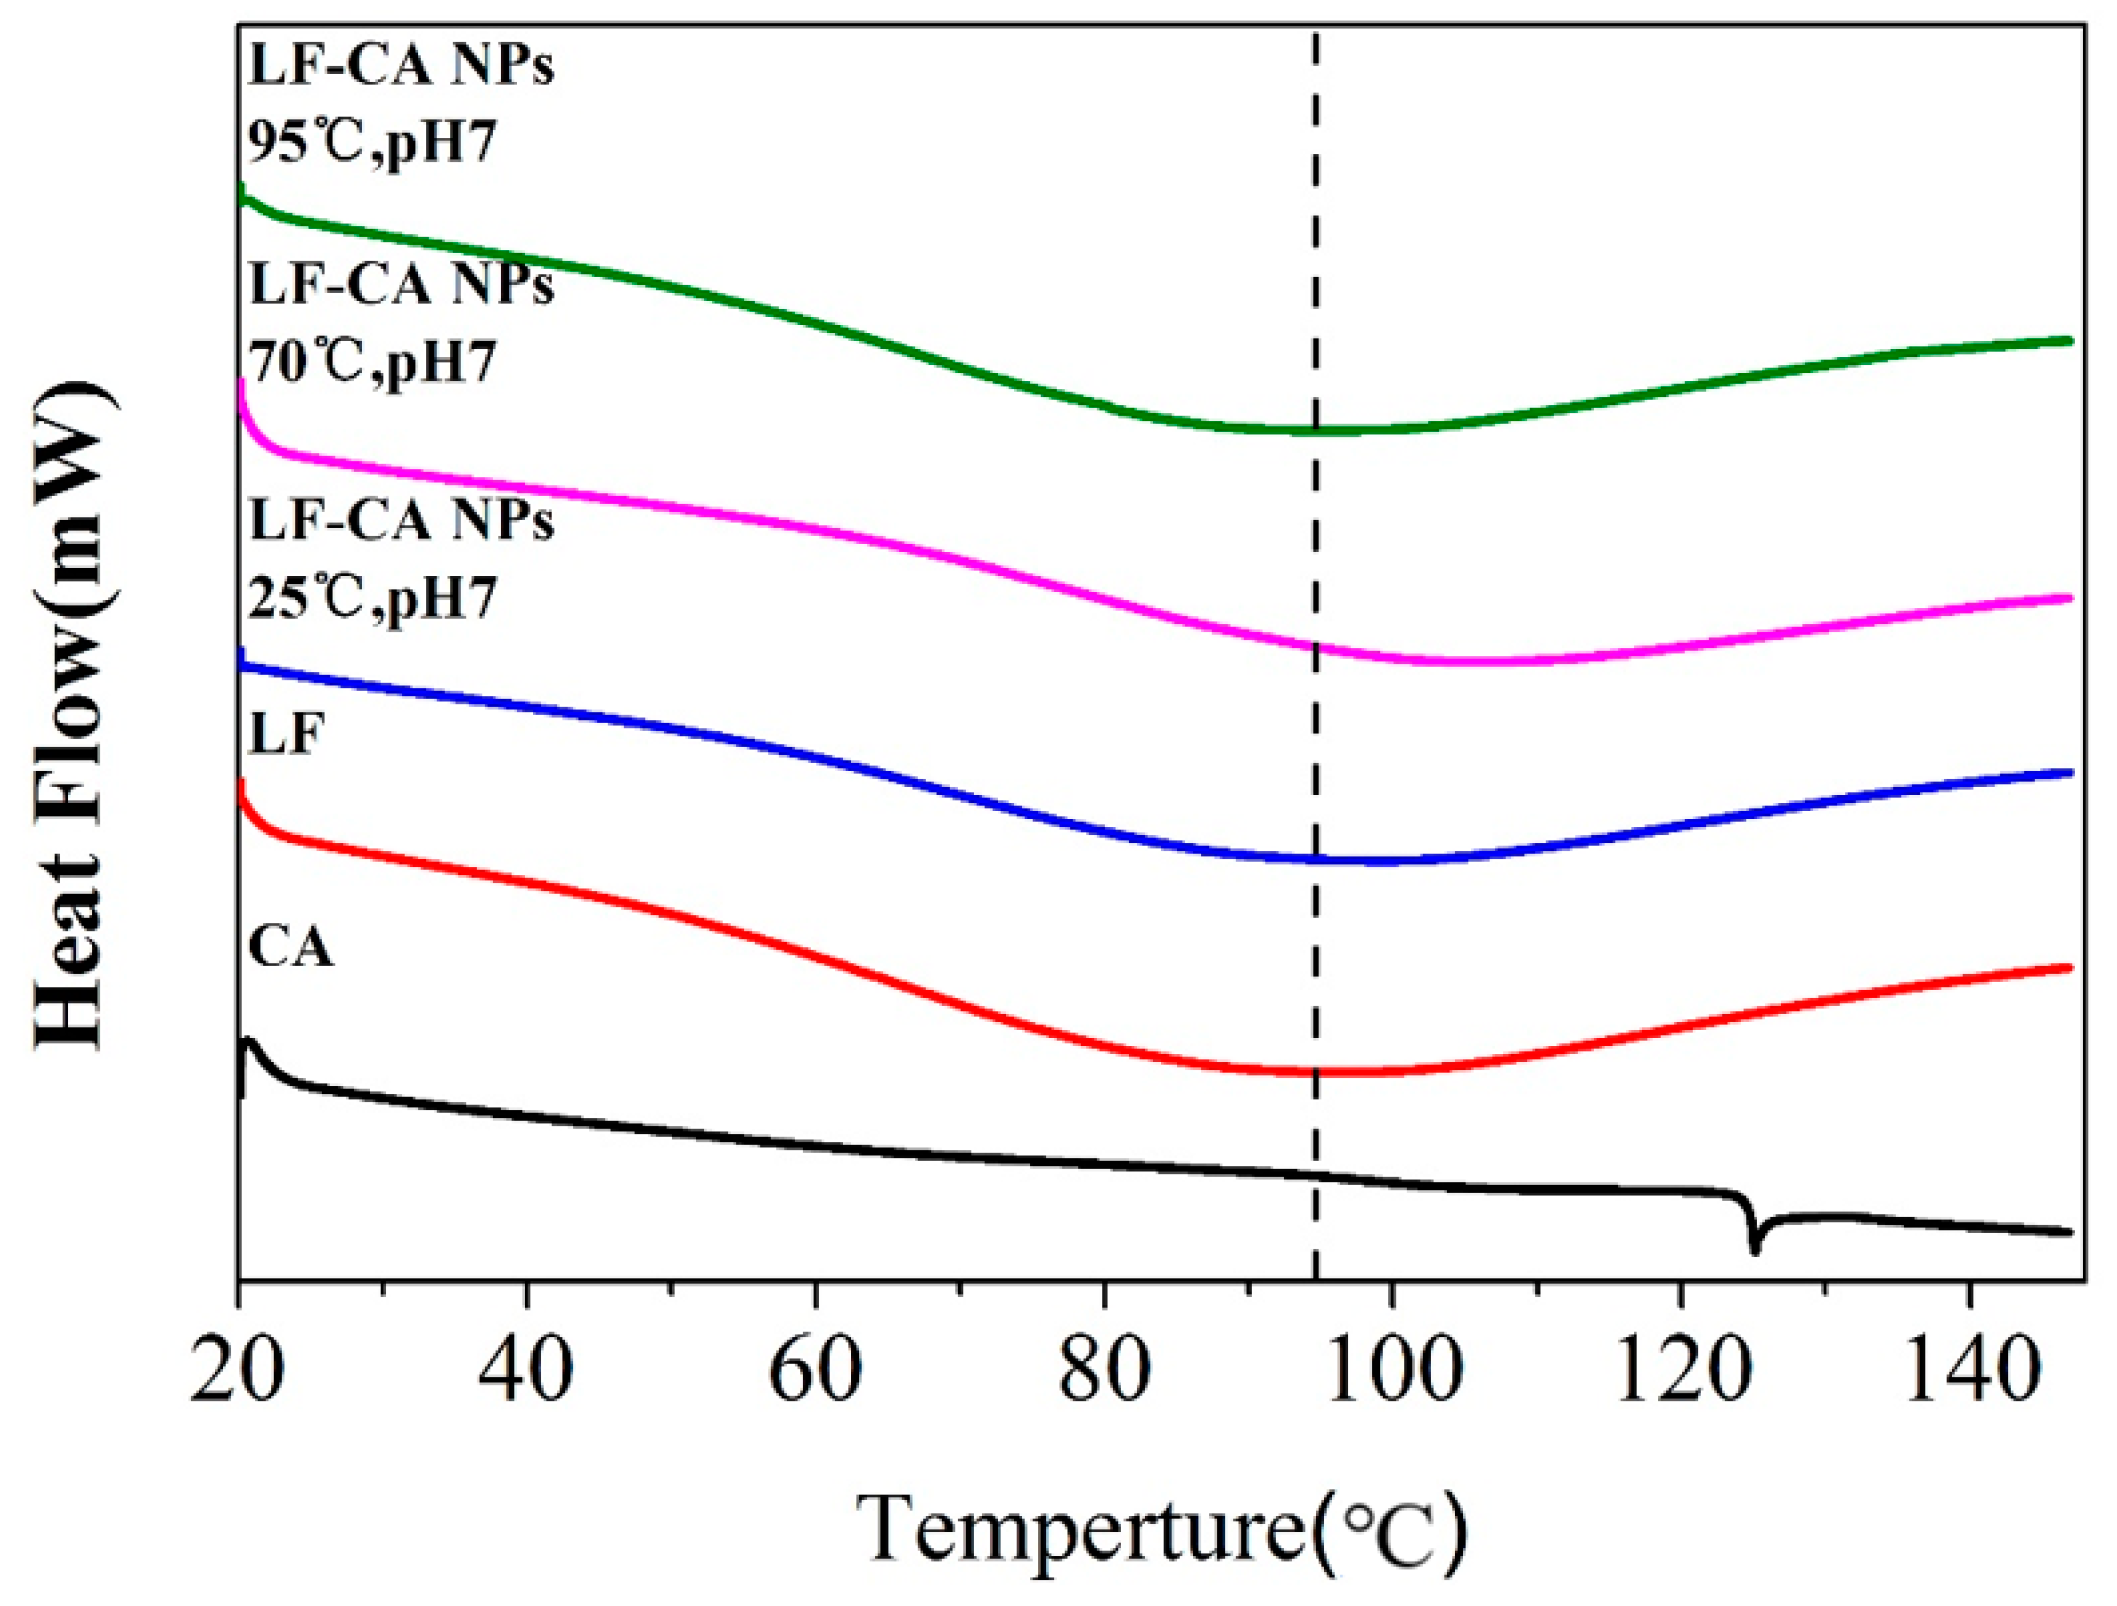
2.2.6. DSC
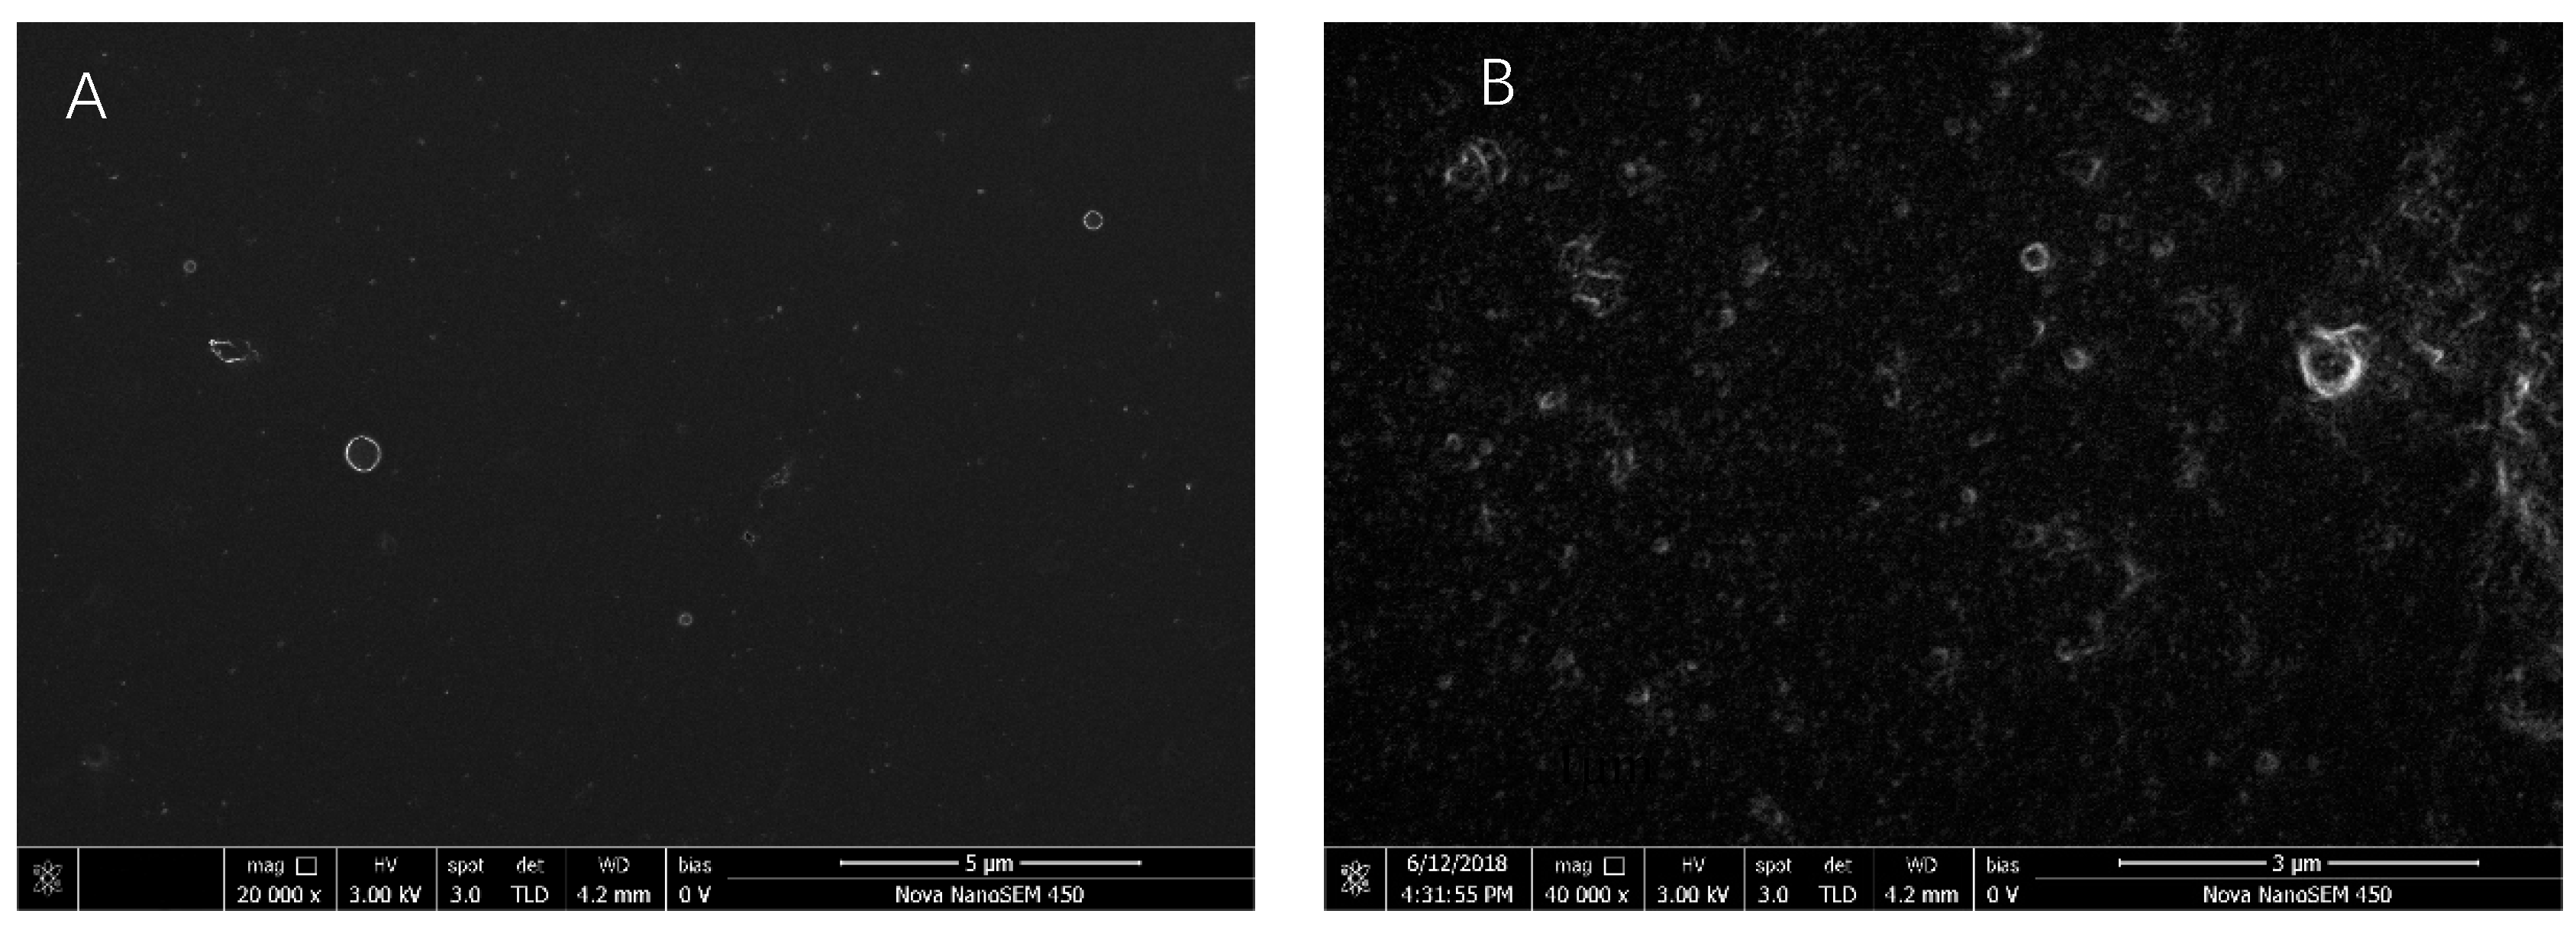
2.2.7. Morphological Analysis
2.3. In Vitro Antioxidant Activities
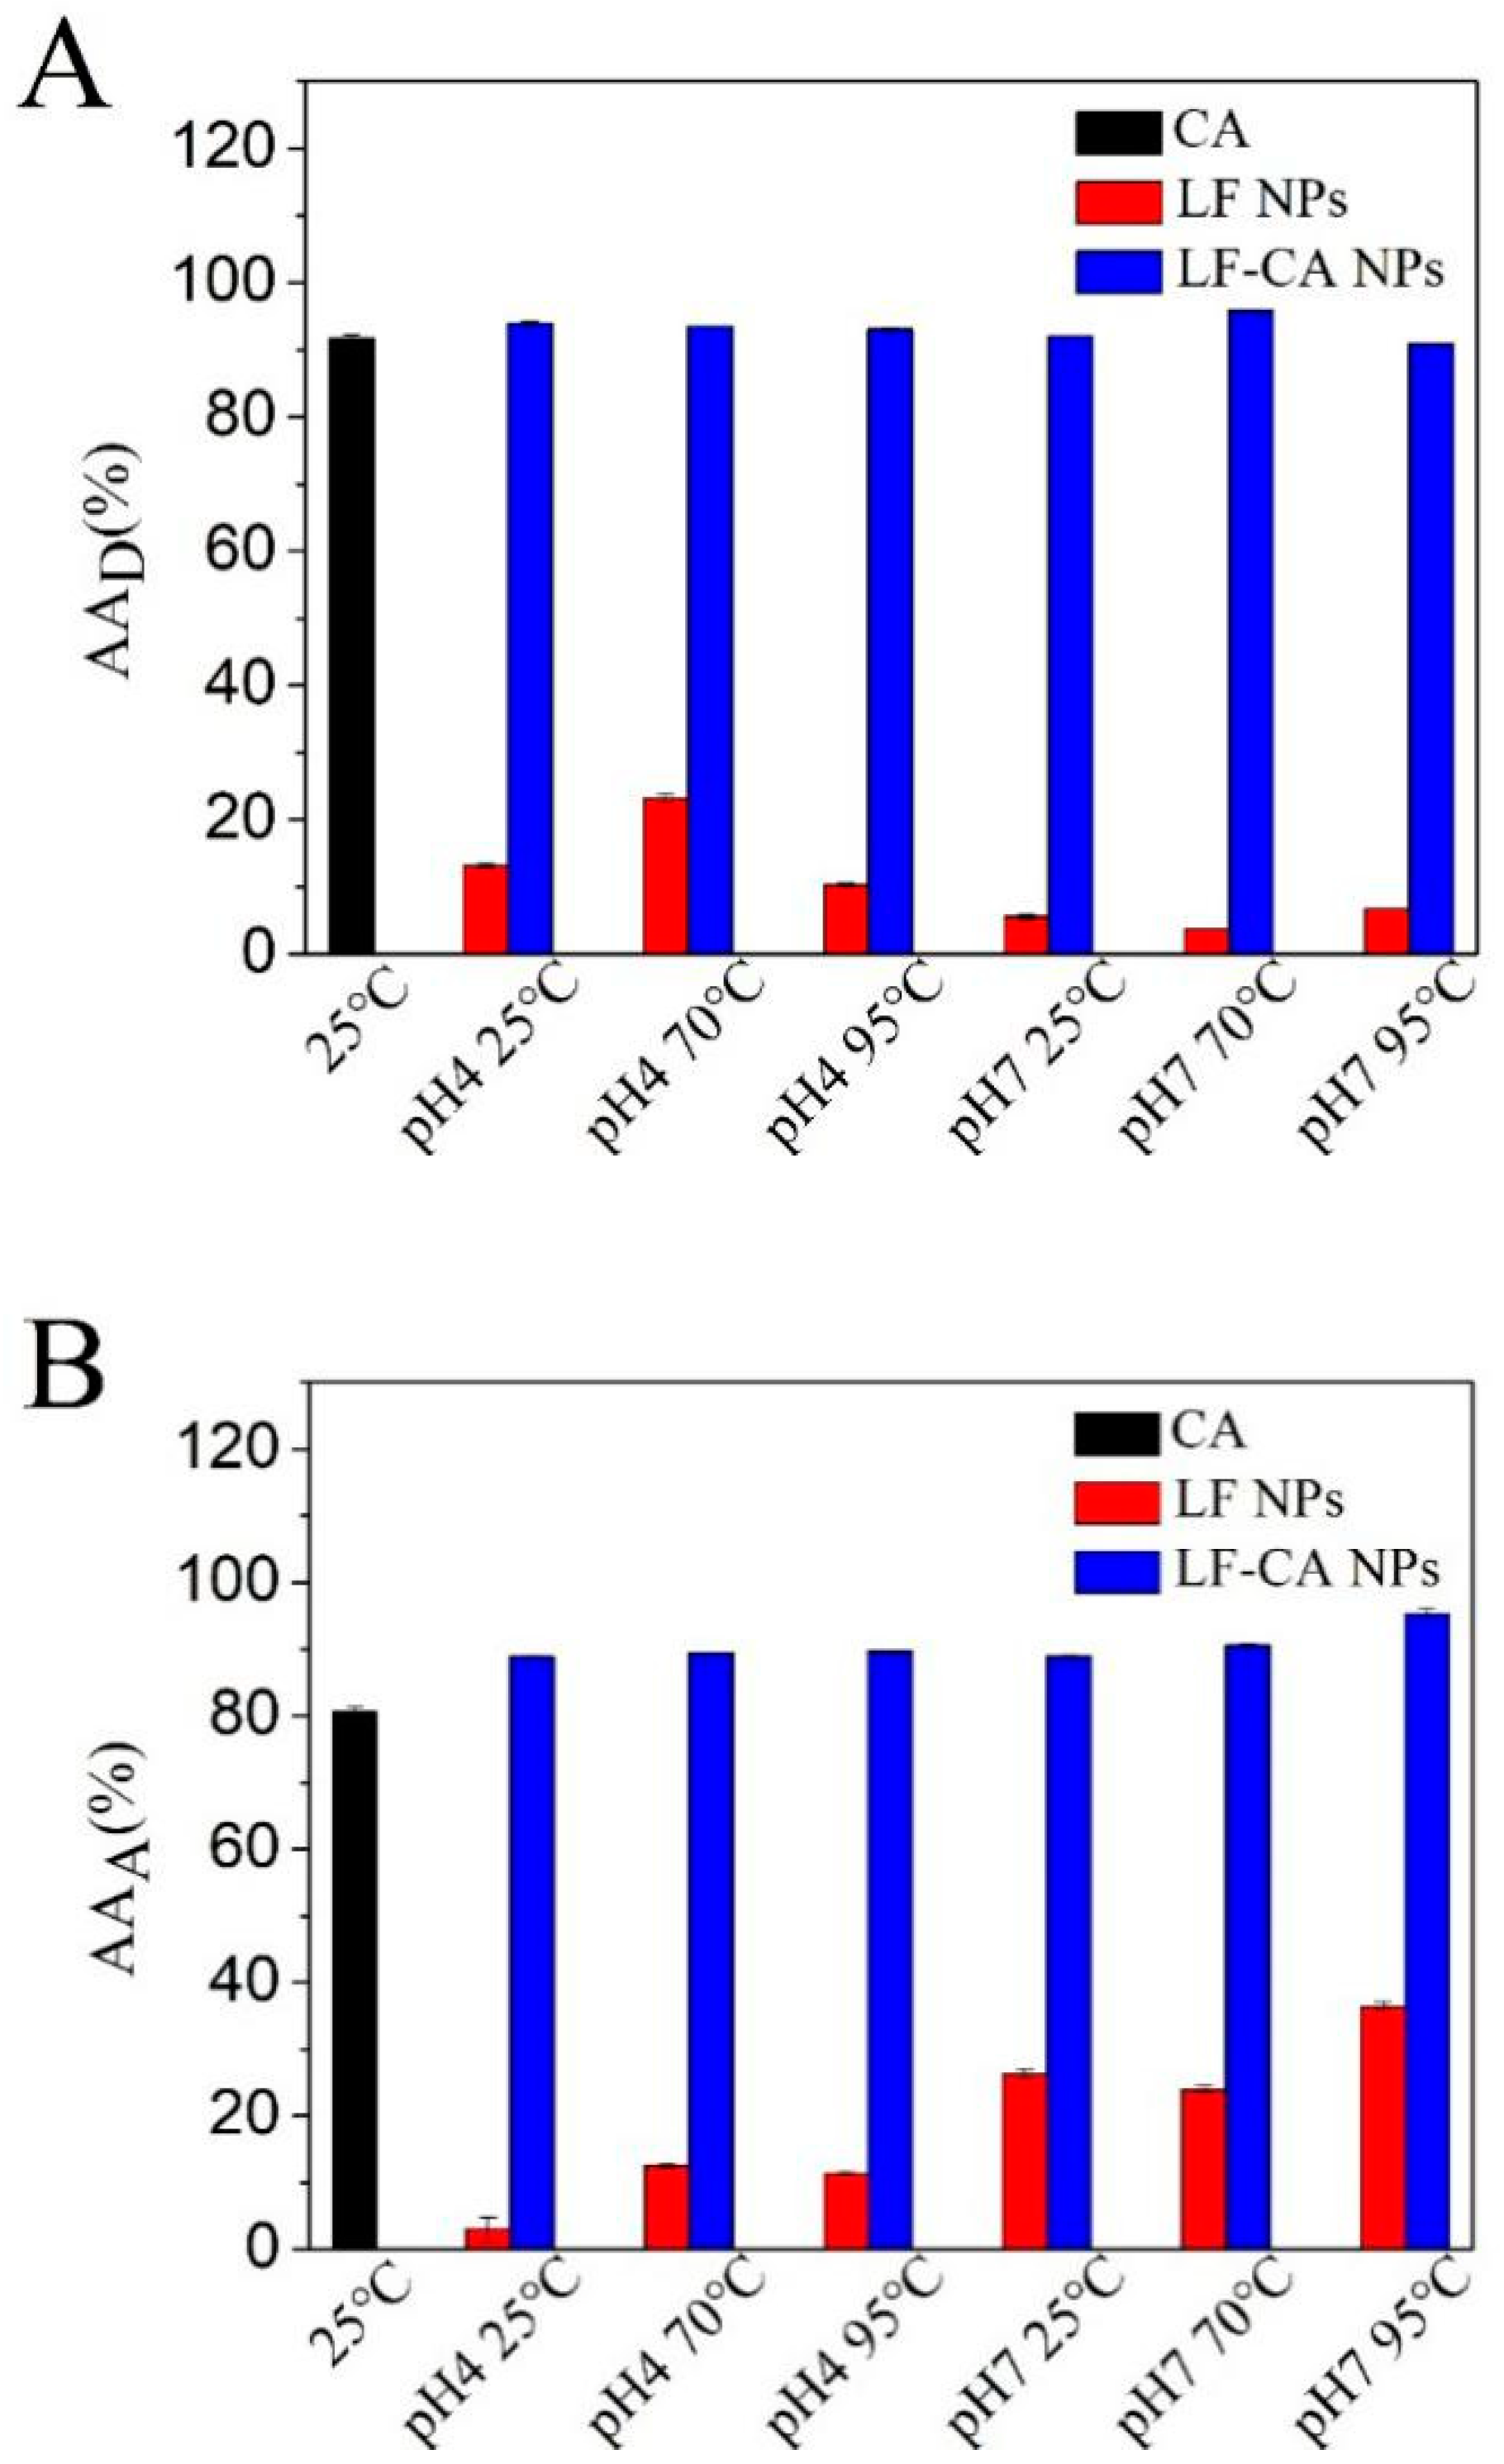
2.3.1. DPPH Radical Scavenging Activity
2.3.2. ABTS Radical Scavenging Experiment
3. Materials and Methods
3.1. Materials and Chemicals
3.2. Preparation of LF-CA Nanoparticles
3.3. Fluorescence Spectroscopy
3.4. UV Light Spectral Scanning
3.5. Encapsulation Efficiency (EE)
3.6. Particle Size, Zeta-Potential and Polydispersity Index
3.7. FTIR
3.8. CD
3.9. DSC
3.10. Scanning Electron Microscope (SEM)
3.11. In Vitro Antioxidant Activities
3.12. Statistical Analysis
4. Conclusions
Author Contributions
Funding
Conflicts of Interest
References
- Schlernitzauer, A.; Oiry, C.; Hamad, R.; Galas, S.; Cortade, F.; Chabi, B.; Casas, F.; Pessemesse, L.; Fouret, G.; Feillet-Coudray, C.; et al. Chicoric acid is an antioxidant molecule that stimulates amp kinase pathway in l6 myotubes and extends lifespan in caenorhabditis elegans. PLoS ONE 2013, 8, e78788. [Google Scholar] [CrossRef]
- Thygesen, L.; Thulin, J.; Mortensen, A.; Skibsted, L.; Molgaard, P. Antioxidant activity of cichoric acid and alkamides from Echinacea purpurea, alone and in combination. Food Chem. 2007, 101, 74–81. [Google Scholar] [CrossRef]
- DalbyBrown, L.; Barsett, H.; Landbo, A.K.R.; Meyer, A.S.; Mølgaard, P. Synergistic antioxidative effects of alkamides, caffeic acid derivatives, and polysaccharide fractions from Echinacea purpurea on in vitro oxidation of human low-density lipoproteins. J. Agric. Food Chem. 2005, 53, 9413–9423. [Google Scholar] [CrossRef] [PubMed]
- Cerqueira, M.A.; Souza, B.W.S.; Teixeira, J.A.; Vicente, A.A. Effect of glycerol and corn oil on physicochemical properties of polysaccharide films—A comparative study. Food Hydrocoll. 2012, 27, 175–184. [Google Scholar] [CrossRef]
- Zhang, H.L.; Dai, L.H.; Wu, Y.H.; Yu, X.P.; Zhang, Y.Y.; Guan, R.F.; Liu, T.; Zhao, J. Evaluation of hepatocyteprotective and anti-hepatitis b virus properties of cichoric acid from cichorium intybus leaves in cell culture. Biol. Pharm. Bull. 2014, 37, 1214–1220. [Google Scholar] [CrossRef] [PubMed]
- Lee, N.Y.; Chung, K.S.; An, H.J. Chicoric acid inhibits the production of pro-inflammatory cytokines through inhibition of NF-κB signaling pathway in HMC-1 human mast cells. Integr. Med. Res. 2015, 4, 56. [Google Scholar] [CrossRef]
- Nüsslein, B.; Kurzmann, M.; Bauer, R.; Kreis, W. Enzymatic degradation of cichoric acid in Echinacea purpurea preparations. J. Nat. Prod. 2000, 63, 1615–1618. [Google Scholar] [CrossRef] [PubMed]
- Bauer, R. Echinacea drugs—Effects and active ingredients. Z. Ärztl. Fortbild. 1996, 90, 111–115. [Google Scholar] [PubMed]
- Livesey, J.; Awang, D.V.; Arnason, J.T.; Letchamo, W.; Barrett, M.; Pennyroyal, G. Effect of temperature on stability of marker constituents in Echinacea purpurea root formulations. Phytomed. Int. J. Phytother. Phytopharm. 1999, 6, 347–349. [Google Scholar] [CrossRef]
- Baker, E.N.; Baker, H.M. Molecular structure, binding properties and dynamics of lactoferrin. Cell. Mol. Life Sci. 2005, 62, 2531–2539. [Google Scholar] [CrossRef] [PubMed]
- Zhou, Y.; Zeng, Z.; Zhang, W.; Xiong, W.; Wu, M.; Tan, Y.; Yi, W.; Xiao, L.; Li, X.; Huang, C.; et al. Lactotransferrin: A candidate tumor suppressor—deficient expression in human nasopharyngeal carcinoma and inhibition of npc cell proliferation by modulating the mitogen-activated protein kinase pathway. Int. J. Cancer 2008, 123, 2065–2072. [Google Scholar] [CrossRef]
- Moreno-Navarrete, J.M.; Ortega, F.J.; Bassols, J.; Ricart, W.; Fernández-Real, J.M. Decreased circulating lactoferrin in insulin resistance and altered glucose tolerance as a possible marker of neutrophil dysfunction in type 2 diabetes. J. Clin. Endocrinol. Metab. 2009, 94, 4036–4044. [Google Scholar] [CrossRef]
- Roberts, A.K.; Chierici, R.; Sawatzki, G.; Hill, M.J.; Volpato, S.; Vigi, V. Supplementation of an adapted formula with bovine lactoferrin: 1. effect on the infant faecal flora. Acta Paediatr. 2010, 81, 119–124. [Google Scholar] [CrossRef]
- Fujita, K.; Matsuda, E.; Sekine, K.; Iigo, M.; Tsuda, H. Lactoferrin enhances Fas expression and apoptosis in the colon mucosa of azoxymethane-treated rats. Carcinogenesis 2004, 25, 1961. [Google Scholar] [CrossRef] [PubMed]
- Liu, F.G.; Zhang, S.H.; Li, J.Y.; Mcclements, D.J.; Liu, X.B. Recent development of lactoferrin-based vehicles for the delivery of bioactive compounds: Complexes, emulsions, and nanoparticles. Trends Food Sci. Technol. 2018, 79, 67–77. [Google Scholar] [CrossRef]
- Yan, J.K.; Qiu, W.Y.; Wang, Y.Y.; Wu, J.Y. Biocompatible polyelectrolyte complex nanoparticles from lactoferrin and pectin as potential vehicles for antioxidative curcumin. J. Agric. Food Chem. 2017, 65, 5720–5730. [Google Scholar] [CrossRef] [PubMed]
- Zhang, Z.H.; Wang, X.P.; Aym, W.Y.; Munyendo, W.L.; Lv, H.X.; Zhou, J.P. Studies on lactoferrin nanoparticles of gambogic acid for oral delivery. Drug Deliv. 2013, 20, 86–93. [Google Scholar] [CrossRef] [PubMed]
- Lakowitz, J.R. Principle of fluorescence spectroscopy. Naturwissenschaften 1991, 78, 456–457. [Google Scholar]
- Vijayabharathi, R.; Sathyadevi, P.; Krishnamoorthy, P.; Senthilraja, D.; Brunthadevi, P.; Sathyabama, S.; Priyadarisini, V.B. Interaction studies of resistomycin from streptomyces aurantiacus aaa5 with calf thymus dna and bovine serum albumin. Spectrochim. Acta A Mol. Biomol. Spectrosc. 2012, 89, 294–300. [Google Scholar] [CrossRef]
- Shang, L.; Wang, Y.; Jiang, J.; Dong, S. pH-dependent protein conformational changes in albumin:gold nanoparticle bioconjugates: A spectroscopic study. Lang. ACS J. Surf. Coll. 2007, 23, 2714–2721. [Google Scholar] [CrossRef] [PubMed]
- Lakowicz, J.R.; Weber, G. Quenching of fluorescence by oxygen. a probe for structural fluctuations in macromolecules. Biochemistry 1973, 12, 4161–4170. [Google Scholar] [CrossRef] [PubMed]
- Du, W.; Teng, T.; Zhou., C.C.; Xi, L.; Wang, J.Z. Spectroscopic studies on the interaction of bovine serum albumin with ginkgolic acid: Binding characteristics and structural analysis. J. Lumin. 2012, 132, 1207–1214. [Google Scholar] [CrossRef]
- Liu, B.; Xue, C.; Wang, J.; Yang, C.; Zhao, F.; Lv, Y. Study on the competitive reaction between bovine serum albumin and neomycin with ponceau S as fluorescence probe. J. Lumin. 2010, 130, 1999–2003. [Google Scholar] [CrossRef]
- Schmitt, C.; Bovay, C.; Rouvet, M.; Shojaei-Rami, S.; Kolodziejczyk, E. Whey protein soluble aggregates from heating with NaCl: Physicochemical, interfacial, and foaming properties. Lang. ACS J. Surf. Coll. 2007, 23, 4155–4166. [Google Scholar] [CrossRef] [PubMed]
- Bengoechea, C.; Peinado, I.; Mcclements, D.J. Formation of protein nanoparticles by controlled heat treatment of lactoferrin: Factors affecting particle characteristics. Food Hydrocoll. 2011, 25, 1354–1360. [Google Scholar] [CrossRef]
- Coeugniet, E.G.; Elek, E. Immunomodulation with Viscum album and Echinacea purpurea extracts. Onkologie 1987, 10, 27–33. [Google Scholar] [CrossRef] [PubMed]
- Pereira, R.N.; Souza, B.W.; Cerqueira, M.A.; Teixeira, J.A.; Vicente, A.A. Effects of electric fields on protein unfolding and aggregation: Influence on edible films formation. Biomacromolecules 2010, 11, 2912–2918. [Google Scholar] [CrossRef] [PubMed]
- McClements, D.J. Non-covalent interactions between proteins and polysaccharides. Biotechnol. Adv. 2006, 24, 621–625. [Google Scholar] [CrossRef] [PubMed]
- Pelissari, F.M.; Grossmann, M.V.E.; Yamashita, F.; Pineda, E.A.G. Antimicrobial, mechanical, and barrier properties of cassava starch-chitosan films incorporated with oregano essential oil. J. Agric. Food Chem. 2009, 57, 7499–7504. [Google Scholar] [CrossRef] [PubMed]
- Stéphanieve, P.; Alfonsgj, V.; Antoniejwg, V.; Gerrita, V.K.; Harry, G. Covalent interactions between proteins and oxidation products of caffeoylquinic acid (chlorogenic acid). J. Sci. Food Agric. 2007, 87, 2502–2510. [Google Scholar]
- Chen, S.; Zhang, N.; Tang, C.H. Influence of nanocomplexation with curcumin on emulsifying properties and emulsion oxidative stability of soy protein isolate at PH 3.0 and 7.0. Food Hydrocoll. 2016, 61, 102–112. [Google Scholar] [CrossRef]
- Teng, H.; Guo, L.; Zhao, X. Content determination of cichoric acid in onychium japonicum (thunb.) kunze by HPLC. Int. Conf. Biotechnol. Med. Sci. 2016. [Google Scholar] [CrossRef]
- Hu, B.; Ma, F.; Yang, Y.; Xie, M.; Zhang, C.; Xu, Y.; Zeng, X. Antioxidant nanocomplexes for delivery of epigallocatechin-3-gallate. J. Agric. Food Chem. 2016, 64, 3422–3429. [Google Scholar] [CrossRef] [PubMed]
- Duan, X.; Li, M.; Shao, J.; Chen, H.; Xu, X.; Jin, Z.; Liu, X. Effect of oxidative modification on structural and foaming properties of egg white protein. Food Hydrocoll. 2018, 75, 223–228. [Google Scholar] [CrossRef]
- Wang, P.; Chen, H.; Mohanad, B.; Xu, L.; Ning, Y.; Xu, J.; Wu, F.; Yang, N.; Jin, Z.; Xu, X. Effect of frozen storage on physico-chemistry of wheat gluten proteins: Studies on gluten-, glutenin- and gliadin-rich fractions. Food Hydrocoll. 2014, 39, 187–194. [Google Scholar] [CrossRef]
- Gulcin, I.; Kufrevioglu, O.I.; Buyukokuroglu, M.E. Antioxidant, antimicrobial, antiulcer and analgesic activities of nettle (Urtica dioica L.). J. Ethnopharmacol. 2004, 90, 205–215. [Google Scholar] [CrossRef] [PubMed]
- Re, R.; Pellegrini, N.; Proteggente, A.; Pannala, A.; Yang, M.; Rive-Evans, C. Antioxidant activity applying a improved ABTS radical cation assay. Free Radical Biol. Med. 1999, 26, 1231–1237. [Google Scholar] [CrossRef]
Sample Availability: Samples of the compounds lactoferrin-cichoric acid nanoparticles are available from the authors. |


| Temperature (°C) | pH | Ksv (×105 L/mol) | Kq (×1013 L mol−1·S−1) | r |
|---|---|---|---|---|
| 25 | 4 | 1.702 | 1.702 | 0.955 |
| 70 | 4 | 1.531 | 1.531 | 0.958 |
| 95 | 4 | 0.983 | 0.904 | 0.951 |
| 25 | 7 | 1.475 | 1.475 | 0.957 |
| 70 | 7 | 1.257 | 1.257 | 0.955 |
| 95 | 7 | 0.783 | 0.783 | 0.944 |
| Temperature (°C) | pH | Ka (L/mol) | n | r |
|---|---|---|---|---|
| 25 | 4 | 4.94 × 10⁷ | 1.539 | 0.996 |
| 70 | 4 | 4.55 × 10⁷ | 1.543 | 0.997 |
| 95 | 4 | 4.92 × 10⁸ | 1.811 | 1.000 |
| 25 | 7 | 6.14 × 10⁷ | 1.571 | 0.996 |
| 70 | 7 | 4.30 × 10⁷ | 1.553 | 0.995 |
| 95 | 7 | 1.88 × 10¹⁰ | 2.178 | 0.997 |
| Temperature (°C) | pH | △G (kJ·mol−1) | △S (J·mol−1·k−1) | △H (KJ·mol−1) |
|---|---|---|---|---|
| 95 | 4 | −61.23 | 247.74 | 29.93 |
| 70 | 4 | −50.29 | 142.10 | −1.55 |
| 25 | 4 | −43.89 | ||
| 95 | 7 | −72.38 | 399.27 | 74.55 |
| 70 | 7 | −50.12 | 126.54 | −6.72 |
| 25 | 7 | −44.43 |
| Temperature (°C) | pH | LF NPs | LF-CA NPs | ||||
|---|---|---|---|---|---|---|---|
| Particle Size (nm) | PdI | Zeta Potential (mV) | Particle Size (nm) | PdI | Zeta Potential (mV) | ||
| 25 °C | 4 | 492.63 ± 16.24a | 0.49 ± 0.02a | 22.33 ± 0.96b | 473.70 ± 12.38a | 0.45 ± 0.04b | 19.87 ± 0.61b |
| 70 °C | 543.40 ± 29.00a | 0.55 ± 0.03a | 26.23 ± 2.55a | 314.50 ± 6.70c | 0.69 ± 0.05a | 27.97 ± 1.30a | |
| 95 °C | 485.30 ± 10.94a | 0.45 ± 0.01b | 26.73 ± 0.77a | 437.23 ± 10.58b | 0.48 ± 0.03b | 25.47 ± 0.05a | |
| 25 °C | 7 | 346.63 ± 19.32b | 0.42 ± 0.05b | 21.70 ± 0.16b | 344.47 ± 16.72c | 0.38 ± 0.01c | 15.98 ± 0.24c |
| 70 °C | 106.37 ± 8.02c | 0.52 ± 0.03a | 25.83 ± 0.90a | 86.69 ± 6.94d | 0.51 ± 0.11ab | 16.63 ± 0.66c | |
| 95 °C | 75.75 ± 2.16d | 0.45 ± 0.04b | 27.53 ± 0.68a | 67.20 ± 1.86e | 0.47 ± 0.02b | 22.03 ± 1.18b | |
| Temperature (°C) | pH | LF NPs | LF-CA NPs | ||||||
|---|---|---|---|---|---|---|---|---|---|
| α-Helix (%) | β-Sheet (%) | β-Turns (%) | Random Coil (%) | α-Helix (%) | β-Sheet (%) | β-Turns (%) | Random Coil (%) | ||
| 25 | 4 | 19.30 ± 0.10 | 41.30 ± 0.20 | 19.63 ± 0.03 | 45.85 ± 0.05 | 20.30 ± 0.90 | 37.95 ± 3.45 | 19.20 ± 0.50 | 47.00 ± 0.60 |
| 70 | 19.60 ± 0.50 | 40.00 ± 2.35 | 19.40 ± 0.40 | 46.20 ± 0.70 | 19.35 ± 1.75 | 40.25 ± 3.45 | 19.25 ± 0.05 | 47.40 ± 4.20 | |
| 95 | 19.20 ± 0.75 | 41.90 ± 2.05 | 19.70 ± 0.15 | 47.00 ± 1.15 | 18.60 ± 0.60 | 42.15 ± 1.75 | 19.40 ± 0.10 | 49.15 ± 0.25 | |
| 25 | 7 | 19.80 ± 0.05 | 40.20 ± 0.25 | 20.00 ± 0.10 | 46.10 ± 0.35 | 20.15 ± 0.50 | 36.20 ± 0.50 | 18.65 ± 0.50 | 50.40 ± 0.60 |
| 70 | 21.50 ± 0.60 | 35.30 ± 2.45 | 19.10 ± 0.45 | 44.30 ± 1.25 | 19.50 ± 0.10 | 39.70 ± 0.50 | 19.25 ± 0.05 | 48.55 ± 0.55 | |
| 95 | 18.90 ± 0.40 | 43.30 ± 1.25 | 19.90 ± 0.10 | 46.60 ± 0.45 | 17.95 ± 1.25 | 47.80 ± 4.90 | 20.50 ± 0.40 | 46.35 ± 1.65 | |
© 2018 by the authors. Licensee MDPI, Basel, Switzerland. This article is an open access article distributed under the terms and conditions of the Creative Commons Attribution (CC BY) license (http://creativecommons.org/licenses/by/4.0/).
Share and Cite
Li, J.; Zhao, C.; Wei, L.; Li, X.; Liu, F.; Zhang, M.; Liu, X.; Wang, Y. Preservation of Cichoric Acid Antioxidant Properties Loaded in Heat Treated Lactoferrin Nanoparticles. Molecules 2018, 23, 2678. https://doi.org/10.3390/molecules23102678
Li J, Zhao C, Wei L, Li X, Liu F, Zhang M, Liu X, Wang Y. Preservation of Cichoric Acid Antioxidant Properties Loaded in Heat Treated Lactoferrin Nanoparticles. Molecules. 2018; 23(10):2678. https://doi.org/10.3390/molecules23102678
Chicago/Turabian StyleLi, Junyi, Caicai Zhao, Liping Wei, Xiang Li, Fuguo Liu, Min Zhang, Xuebo Liu, and Yutang Wang. 2018. "Preservation of Cichoric Acid Antioxidant Properties Loaded in Heat Treated Lactoferrin Nanoparticles" Molecules 23, no. 10: 2678. https://doi.org/10.3390/molecules23102678
APA StyleLi, J., Zhao, C., Wei, L., Li, X., Liu, F., Zhang, M., Liu, X., & Wang, Y. (2018). Preservation of Cichoric Acid Antioxidant Properties Loaded in Heat Treated Lactoferrin Nanoparticles. Molecules, 23(10), 2678. https://doi.org/10.3390/molecules23102678