
Green Leaf Volatiles in the Atmosphere—Properties, Transformation, and Significance


Abstract
Contents
| 1. Introduction | 2 |
| 2. Sources of GLV | 6 |
| 2.1. Reasons or Causes of Emissions | 6 |
| 2.2. Synthesis in Plants | 6 |
| 2.3. Emission Data | 8 |
| 3. Physical Properties of GLV | 15 |
| 3.1. Solubility in Water and Partition Coefficients | 15 |
| 3.2. UV Spectra | 21 |
| 4. Gas-Phase Chemistry | 27 |
| 4.1. Products and Mechanisms | 27 |
| 4.1.1. Reactions with OH | 28 |
| 4.1.2. Reactions with NO3 | 35 |
| 4.1.3. Reactions with O3 | 38 |
| 4.1.4. Reactions with Cl | 44 |
| 4.1.5. Gas-Phase Photolysis | 51 |
| 4.2. Gas-Phase Kinetics | 52 |
| 4.2.1. Gas-Phase Reactions with OH Radicals | 53 |
| 4.2.2 Gas-Phase Reactions with NO3 Radicals | 58 |
| 4.2.3. Gas-Phase Reactions with O3 | 61 |
| 4.2.4. Gas-Phase Reactions with Cl Radicals | 64 |
| 4.2.5. Gas-Phase Photolysis | 68 |
| 4.2.6. SAR and LFPR Methods | 69 |
| 5. Aqueous-Phase Kinetic | 69 |
| 6. Multiphase and Heterogeneous Transformation | 72 |
| 6.1. Smog-Chamber Studies | 72 |
| 6.2. Ambient Aerosols | 83 |
| 6.3. Aqueous and Multiphase Mechanisms | 83 |
| 7. Atmospheric Impact of GLV | 89 |
| 7.1. Atmospheric Lifetimes of GLV | 89 |
| 7.2. SOA Potential of GLV | 93 |
| 8. Conclusions | 94 |
| Abbreviations | 95 |
| References | 96 |
1. Introduction
2. Sources of GLV
2.1. Reasons or Causes of Emission
2.2. Synthesis in Plants
2.3. Emission Data
3. Physical Properties of GLV
3.1. Solubility in Water and Partition Coefficients
3.2. UV Spectra


4. Gas-Phase Chemistry
4.1. Products and Mechanisms
4.1.1. Reactions with OH

| GLV | Product | Yield % | Expt Table 8 | Ref. |
|---|---|---|---|---|
| Pentan-1-ol | Pentanal | 40.5 ± 8.2 | X | [184] |
| Butanal | 16.2 ± 3.7 | |||
| Propanal | 8.1 ± 1.9 | |||
| Etanal | 18.1 ± 4.2 | |||
| Formaldehyde | 25.1 ± 1.3 | |||
| 5-hydroxy-2-pentanone | observed | |||
| 3-hydroxypropanal | observed | |||
| 1-penten-3-ol | Formaldehyde | 35 ± 4 | I | [185] |
| Glycolaldehyde | 47 ± 6 | |||
| (Z)-2-penten-1-ol | Formaldehyde | 11 ± 2 | ||
| Propanal | 91 ± 13 | |||
| Glycolaldehyde | 87 ± 11 | |||
| (E)-2-hexen-1-ol | Butanal | Main | II | [176] |
| (E)-3-hexen-1-ol | Propanal | Main | II | [176] |
| 37 ± 7 | III | [175] | ||
| (Z)-3-hexen-1-ol | Propanal | Main | II | [176] |
| 58 ± 8 | IV | [180] | ||
| 74.6 ± 6.7 | VIII | [183] | ||
| 3-hydroxypropanal | 101 ± 24 | IV | [180] | |
| 48 + 48/−24 | VIII | [183] | ||
| 3,4-dihydroxyhexanoic acid | Observed | IV | [180] | |
| Dihydroxynitrates MW 179 (see Scheme 10) | Observed | IV, VIII | [180,183] | |
| Hydroxycarbonyl MW 132 (see Scheme 11) | Observed | VIII | [183] | |
| (Z)-3-hepten-1-ol | Butanal | 33 ± 3 | III | [175] |
| (E)-2-hexenylacetate | Butanal | Observed | XI | [186] |
| 2-methyl-3-buten-2-ol | Acetone | 14.1 ± 0.2 | V | [182] |
| 52 ± 5 molar | VI | [179] | ||
| 58 ± 4 | VII | [178] | ||
| observed | IV | [180] | ||
| 67 ± 5 | IX | [177] | ||
| Formaldehyde | 9.3 ± 3.3 | V | [182] | |
| 35 ± 4 molar | VI | [179] | ||
| 29 ± 3 | VII | [178] | ||
| observed | IV | [180] | ||
| 33 ± 3 | IX | [177] | ||
| Formic acid | 9.3 ± 3.3 | V | [182] | |
| Glycolaldehyde | 28.0 ± 2.8 | V | [182] | |
| 50 ± 5 molar | VI | [179] | ||
| 61 ± 9 | VII | [178] | ||
| 78 ± 20 | IX | [177] | ||
| 66 ± 2 | XIII a | [187] | ||
| 29 ± 5 | XIII a | [187] | ||
| 2-hydroxy-2-methylpropanal | 19 ± 7 | VII | [178] | |
| 31 ± 4 | IV | [180] | ||
| 31 ± 11 | IX | [177] | ||
| 12 ± 2 | XIII a | [187] | ||
| 37 ± 7 | XIII b | [187] | ||
| Dihydroxynitrates MW 165 (see Scheme 13) | observed | IV | [180] | |
| Organic nitrates | 5 ± 2 | VII | [178] | |
| Glyoxal | 26 | XIII a | [187] | |
| 37 | XIII b | [187] | ||
| CO | observed | V | [182] | |
| CO2 | observed | V | [182] | |
| Nonanal | 1-nitooxy octane | 40 | XII | [188] |
| Expt | Photoreactor | Detection | Temp. | p | OH Source | Ref. | ||
|---|---|---|---|---|---|---|---|---|
| Type | Vol. dm3 | Material | K | atm | ||||
| I | Chamber | 47 | Steel | LP FTIR | 298 | 1 | Ethyl nitrite | [185] |
| II | Bag | 80 | Teflon | GC-FID (SPME) | 298 | 1 | H2O2 | [176] |
| III | Chamber | 1080 | Quartz | LP FTIR | 298 | 1 | H2O2 | [175] |
| IV | Chamber | 7000 | Teflon | GC-FID, GC-MS, API-MS | 296 | 0.97 | Methyl nitrite | [180] |
| V | Chamber | 480 | Teflon | LP FTIR | 295 | 0.97 | H2O2 | [182] |
| VI | Chamber | 47 | Steel | LP FTIR | 295 | Methyl nitrite | [179] | |
| VII | Chamber | 5800 | Teflon | LP FTIR, GC-FID, GC-MS, API-MS/MS | 298 | 1 | Ethyl nitrite | [178] |
| VIII | Chamber | 6500–7900 | Teflon | GC-FID, GC-MS, API-MS | 298 | 1 | Methyl nitrite | [183] |
| IX | LISA CRAC EUPHORE | LP FTIR | 298 | 1 | HONO, n-propyl nitrite | [177] | ||
| X | Reactor | 480 | Duran | LF FIR, GC-PI | 298 | 0.97 | Methyl nitrite | [184] |
| XI | Bag | 80 | Teflon | GC-FID | 298 | 1 | H2O2 | [186] |
| XII | Chamber | 5000 | Teflon | GC-FID | 298 | 1 | Isopropyl nitrite | [188] |
| XIII a | Chamber | 28,000 | Teflon | LIP | 294–298 | Cyclohexane | [187] | |
| XIII b | Cyclohexane NOx | |||||||
4.1.2. Reactions with NO3
4.1.3. Reactions with O3
4.1.4. Reactions with Cl
4.1.5. Gas-Phase Photolysis
4.2. Gas-Phase Kinetics
4.2.1. Gas-Phase Reactions with OH Radicals
4.2.2. Gas-Phase Reactions with NO3 Radicals
4.2.3. Gas-Phase Reactions with O3
4.2.4. Gas-Phase Reactions with Cl Radicals
4.2.5. Gas-Phase Photolysis
4.2.6. SAR and LFPR Methods
5. Aqueous-Phase Kinetics
6. Multiphase and Heterogeneous Transformation
6.1. Smog-Chamber Studies
6.2. Ambient Aerosols
6.3. Aqueous and Multiphase Mechanisms
7. Atmospheric Impact of GLV
7.1. Atmospheric Lifetimes of GLV
7.2. SOA Potential of GLV
8. Conclusions
Author Contributions
Funding
Institutional Review Board Statement
Informed Consent Statement
Data Availability Statement
Acknowledgments
Conflicts of Interest
Abbreviations
| AAT | alcohol acyltransferase |
| ADH | alcohol dehydrogenase |
| AMS | aerosol mass spectrometry |
| AOC | allene oxide cyclase |
| AOS | allene oxide synthase |
| Aqu | aqueous |
| BVOC | biogenic volatile organic compounds |
| CEAS | cavity-enhanced absorption spectroscopy |
| CRAC | smog chamber at the University of Cork |
| DFT | density functional theory |
| DHIP | dihydroxoisopropanol |
| DMAPP | dimethylallyl pyrophosphate (dimethylallyl diphosphate) |
| DW | dry weight (mass) |
| EI | electron ionization (in mass spectrometry) |
| EUPHORE | environmental smog chamber in Valencia, Spain |
| EVK | ethyl vinyl ketone (1-penten-3-one) |
| FID | flame ionization detector (in gas chromatography) |
| FTIR | Fourier transform infrared spectroscopy |
| GC | gas chromatography |
| GLV | green leaf volatiles |
| HMW | higher molecular weight |
| JA | jasmonic acid |
| LC | liquid chromatography |
| LDI | laser desorption ionization (in mass spectrometry) |
| LFER | linear free energy relation |
| LISA | smog chamber at the Laboratoire Interuniversitaire des Systèmes Atmosphériques in Paris |
| LOX | lipoxygenase |
| LWC | liquid water contents, m3 (water) m−3 (air) |
| MBO | 2-methyl-3-buten-2-ol |
| MEGAN | Model of Emission of Gases and Aerosols from Nature |
| MeJa | methyl jasmonate |
| MeSa | methyl salicylate |
| MS | mass spectrometry |
| MW | molecular weight |
| NIR | near infra-red (spectroscopy) |
| PAR | photosynthetically active radiation |
| PI | photoionization detector |
| PLP-LIF | pulsed laser photolysis—laser-induced fluorescence |
| PLP-RF | pulse laser photolysis—resonance fluorescence |
| PM | particulate matter, ambient aerosol |
| RH | relative humidity (%) |
| RRKM | Rice–Ramsperger–Kassel–Marcus theory |
| SAR | structure-activity relation |
| SMPS | scanning mobility particle sizer |
| SOA | secondary organic aerosol |
| SPME | solid-phase microextraction |
| SRR | structure-reactivity relation |
| TOF | time of flight analyzer (in mass spectrometry) |
| UV | ultraviolet |
| VOC | volatile organic compounds |
| yr, yrs | year, years |
References
- Matsui, K.; Koeduka, T. Green leaf volatiles in plant signaling and response. In Lipids in Plant and Algae Development; Nakamura, Y., LiBeisson, Y., Eds.; Springer: New York, NY, USA, 2016; Volume 86, pp. 427–443. [Google Scholar]
- Dong, F.; Fu, X.M.; Watanabe, N.; Su, X.G.; Yang, Z.Y. Recent Advances in the Emission and Functions of Plant Vegetative Volatiles. Molecules 2016, 21, 124. [Google Scholar] [CrossRef] [PubMed]
- Holopainen, J.K. Can forest trees compensate for stress-generated growth losses by induced production of volatile compounds? Tree Physiology 2011, 31, 1356–1377. [Google Scholar] [CrossRef]
- Baldwin, I.T.; Halitschke, R.; Paschold, A.; von Dahl, C.C.; Preston, C.A. Volatile Signaling in Plant-Plant Interactions: “Talking Trees” in the Genomics Era. Science 2006, 311, 812–815. [Google Scholar] [CrossRef]
- Arimura, G.; Pearse, I.S. Chapter One—From the Lab Bench to the Forest: Ecology and Defence Mechanisms of Volatile-Mediated ‘Talking Trees’. In Advances in Botanical Research; Becard, G., Ed.; Academic Press: Cambridge, MA, USA, 2017; Volume 82, pp. 3–17. [Google Scholar]
- Farmer, E.E. Surface-to-air signals. Nature 2001, 411, 854–856. [Google Scholar] [CrossRef]
- Shulaev, V.; Silverman, P.; Raskin, I. Airborne signalling by methyl salicylate in plant pathogen resistance. Nature 1997, 385, 718–721. [Google Scholar] [CrossRef]
- Loreto, F.; Schnitzler, J.-P. Abiotic stresses and induced BVOCs. Trends Plant Sci. 2010, 15, 154–166. [Google Scholar] [CrossRef] [PubMed]
- Shen, J.Y.; Tieman, D.; Jones, J.B.; Taylor, M.G.; Schmelz, E.; Huffaker, A.; Bies, D.; Chen, K.S.; Klee, H.J. A 13-lipoxygenase, TomloxC, is essential for synthesis of C5 flavour volatiles in tomato. J. Exp. Bot. 2014, 65, 419–428. [Google Scholar] [CrossRef] [PubMed]
- Hatanaka, A. The biogeneration of green odor by green leaves. Phytochemistry 1993, 34, 1201–1218. [Google Scholar] [CrossRef]
- Matsui, K.; Sugimoto, K.; Mano, J.; Ozawa, R.; Takabayashi, J. Differential Metabolisms of Green Leaf Volatiles in Injured and Intact Parts of a Wounded Leaf Meet Distinct Ecophysiological Requirements. PLoS ONE 2012, 7, e10036433. [Google Scholar] [CrossRef]
- de Gouw, J.A.; Howard, C.J.; Custer, T.G.; Fall, R. Emissions of volatile organic compounds from cut grass and clover are enhanced during the drying process. Geophys. Res. Lett. 1999, 26, 811–814. [Google Scholar] [CrossRef]
- Jardine, K.; Barron-Gafford, G.A.; Norman, J.P.; Abrell, L.; Monson, R.K.; Meyers, K.T.; Pavao-Zuckerman, M.; Dontsova, K.; Kleist, E.; Werner, C.; et al. Green leaf volatiles and oxygenated metabolite emission bursts from mesquite branches following light-dark transitions. Photosynth. Res. 2012, 113, 321–333. [Google Scholar] [CrossRef]
- Loreto, F.; Barta, C.; Brilli, F.; Nogues, I. On the induction of volatile organic compound emissions by plants as consequence of wounding or fluctuations of light and temperature. Plant Cell Environ. 2006, 29, 1820–1828. [Google Scholar] [CrossRef]
- Brilli, F.; Ruuskanen, T.M.; Schnitzhofer, R.; Muller, M.; Breitenlechner, M.; Bittner, V.; Wohlfahrt, G.; Loreto, F.; Hansel, A. Detection of Plant Volatiles after Leaf Wounding and Darkening by Proton Transfer Reaction "Time-of-Flight" Mass Spectrometry (PTR-TOF). PLoS ONE 2011, 6, e0020419. [Google Scholar] [CrossRef] [PubMed]
- Jardine, K.J.; Chambers, J.Q.; Holm, J.; Jardine, A.B.; Fontes, C.G.; Zorzanelli, R.F.; Meyers, K.T.; de Souza, V.F.; Garcia, S.; Gimenez, B.O.; et al. Green leaf volatile emissions during high temperature and drought stress in a Central Amazon rainforest. Plants 2015, 4, 678. [Google Scholar] [CrossRef]
- Karl, T.; Harren, F.; Warneke, C.; de Gouw, J.; Grayless, C.; Fall, R. Senescing grass crops as regional sources of reactive volatile organic compounds. J. Geophys. Res. Atmos. 2005, 110, 12. [Google Scholar] [CrossRef]
- Kirstine, W.; Galbally, I.; Ye, Y.R.; Hooper, M. Emissions of volatile organic compounds (primarily oxygenated species) from pasture. J. Geophys. Res. Atmos. 1998, 103, 10605–10619. [Google Scholar] [CrossRef]
- Kirstine, W.V.; Galbally, I.E. A simple model for estimating emissions of volatile organic compounds from grass and cut grass in urban airsheds and its application to two Australian cities. J. Air Waste Manag. Assoc. 2004, 54, 1299–1311. [Google Scholar] [CrossRef]
- Scala, A.; Allmann, S.; Mirabella, R.; Haring, M.; Schuurink, R. Green Leaf Volatiles: A Plant’s Multifunctional Weapon against Herbivores and Pathogens. Int. J. Mol. Sci. 2013, 14, 17781. [Google Scholar] [CrossRef]
- Hansel, A.K.; Ehrenhauser, F.S.; Richards-Henderson, N.K.; Anastasio, C.; Valsaraj, K.T. Aqueous-phase oxidation of green leaf volatiles by hydroxyl radical as a source of SOA: Product identification from methyl jasmonate and methyl salicylate oxidation. Atmos. Environ. 2015, 102, 43–51. [Google Scholar] [CrossRef]
- Richards-Henderson, N.K.; Hansel, A.K.; Valsaraj, K.T.; Anastasio, C. Aqueous oxidation of green leaf volatiles by hydroxyl radical as a source of SOA: Kinetics and SOA yields. Atmos. Environ. 2014, 95, 105–112. [Google Scholar] [CrossRef]
- Maffei, M.E. Sites of synthesis, biochemistry and functional role of plant volatiles. S. Afr. J. Bot. 2010, 76, 612–631. [Google Scholar] [CrossRef]
- Fisher, A.J.; Baker, B.M.; Greenberg, J.P.; Fall, R. Enzymatic Synthesis of Methylbutenol from Dimethylallyl Diphosphate in Needles of Pinus sabiniana. Arch. Biochem. Biophys. 2000, 383, 128–134. [Google Scholar] [CrossRef]
- Guenther, A.; Geron, C.; Pierce, T.; Lamb, B.; Harley, P.; Fall, R. Natural emissions of non-methane volatile organic compounds; carbon monoxide, and oxides of nitrogen from North America. Atmos. Environ. 2000, 34, 2205–2230. [Google Scholar] [CrossRef]
- Mochizuki, S.; Sugimoto, K.; Koeduka, T.; Matsui, K. Arabidopsis lipoxygenase 2 is essential for formation of green leaf volatiles and five-carbon volatiles. FEBS Lett. 2016, 590, 1017–1027. [Google Scholar] [CrossRef] [PubMed]
- Fisher, A.J.; Grimes, H.D.; Fall, R. The biochemical origin of pentenol emissions from wounded leaves. Phytochemistry 2003, 62, 159–163. [Google Scholar] [CrossRef]
- Mayland, H.F.; Flath, R.A.; Shewmaker, G.E. Volatiles from Fresh and Air-Dried Vegetative Tissues of Tall Fescue (Festuca arundinacea Schreb.): Relationship to Cattle Preference. J. Agric. Food Chem. 1997, 45, 2204–2210. [Google Scholar] [CrossRef]
- Fall, R.; Karl, T.; Jordon, A.; Lindinger, W. Biogenic C5VOCs: Release from leaves after freeze-thaw wounding and occurrence in air at a high mountain observatory. Atmos. Environ. 2001, 35, 3905–3916. [Google Scholar] [CrossRef]
- López-Gresa, M.P.; Lisón, P.; Campos, L.; Rodrigo, I.; Rambla, J.L.; Granell, A.; Conejero, V.; Bellés, J.M. A Non-targeted Metabolomics Approach Unravels the VOCs Associated with the Tomato Immune Response against Pseudomonas syringae. Front. Plant Sci. 2017, 8, 1188. [Google Scholar] [CrossRef]
- Connor, E.C.; Rott, A.S.; Zeder, M.; Juttner, F.; Dorn, S. (13)C-labelling patterns of green leaf volatiles indicating different dynamics of precursors in Brassica leaves. Phytochemistry 2008, 69, 1304–1312. [Google Scholar] [CrossRef] [PubMed]
- Matsui, K. Green leaf volatiles: Hydroperoxide lyase pathway of oxylipin metabolism. Curr. Opin. Plant Biol. 2006, 9, 274–280. [Google Scholar] [CrossRef]
- Fall, R.; Karl, T.; Hansel, A.; Jordan, A.; Lindinger, W. Volatile organic compounds emitted after leaf wounding: On-line analysis by proton-transfer-reaction mass spectrometry. J. Geophys. Res. Atmos. 1999, 104, 15963–15974. [Google Scholar] [CrossRef]
- Engelberth, J.; Alborn, H.T.; Schmelz, E.A.; Tumlinson, J.H. Airborne signals prime plants against insect herbivore attack. Proc. Natl. Acad. Sci. USA 2004, 101, 1781–1785. [Google Scholar] [CrossRef]
- Croft, K.P.C.; Juttner, F.; Slusarenko, A.J. Volatile products of the lipoxygenase pathway evolved from Phaseolus-vulgaris (L.) leaves inoculated with Pseudomonas syringae pv phaseolicola. Plant Physiol. 1993, 101, 13–24. [Google Scholar] [CrossRef] [PubMed]
- Fukui, Y.; Doskey, P.V. Identification of nonmethane organic compound emissions from grassland vegetation. Atmos. Environ. 2000, 34, 2947–2956. [Google Scholar] [CrossRef]
- Rose, U.; Manukian, A.; Heath, R.R.; Tumlinson, J.H. Volatile Semiochemicals Released from Undamaged Cotton Leaves (A Systemic Response of Living Plants to Caterpillar Damage). Plant Physiol. 1996, 111, 487–495. [Google Scholar] [CrossRef]
- Matsui, K.; Minami, A.; Hornung, E.; Shibata, H.; Kishimoto, K.; Ahnert, V.; Kindl, H.; Kajiwara, T.; Feussner, I. Biosynthesis of fatty acid derived aldehydes is induced upon mechanical wounding and its products show fungicidal activities in cucumber. Phytochemistry 2006, 67, 649–657. [Google Scholar] [CrossRef] [PubMed]
- Matsui, K.; Kurishita, S.; Hisamitsu, A.; Kajiwara, T. A lipid-hydrolysing activity involved in hexenal formation. Biochem. Soc. Trans. 2000, 28, 857–860. [Google Scholar] [CrossRef]
- Peterson, D.L.; Böröczky, K.; Tumlinson, J.; Cipollini, D. Ecological fitting: Chemical profiles of plant hosts provide insights on selection cues and preferences for a major buprestid pest. Phytochemistry 2020, 176, 112397. [Google Scholar] [CrossRef] [PubMed]
- Zhang, Q.-H.; Birgersson, G.; Zhu, J.; Löfstedt, C.; Löfqvist, J.; Schlyter, F. Leaf Volatiles from Nonhost Deciduous Trees: Variation by Tree Species, Season and Temperature, and Electrophysiological Activity in Ips typographus. J. Chem. Ecol. 1999, 25, 1923–1943. [Google Scholar] [CrossRef]
- Gaquerel, E.; Weinhold, A.; Baldwin, I.T. Molecular Interactions between the Specialist Herbivore Manduca sexta (Lepidoptera, Sphigidae) and Its Natural Host Nicotiana attenuata. VIII. An Unbiased GCxGC-ToFMS Analysis of the Plant’s Elicited Volatile Emissions. Plant Physiol. 2009, 149, 1408–1423. [Google Scholar] [CrossRef]
- Kessler, A.; Baldwin, I.T. Defensive function of herbivore-induced plant volatile emissions in nature. Science 2001, 291, 2141–2144. [Google Scholar] [CrossRef] [PubMed]
- Blande, J.D.; Korjus, M.; Holopainen, J.K. Foliar methyl salicylate emissions indicate prolonged aphid infestation on silver birch and black alder. Tree Physiol. 2010, 30, 404–416. [Google Scholar] [CrossRef] [PubMed]
- Wiedinmyer, C.; Guenther, A.; Harley, P.; Hewitt, N.; Geron, C.; Artaxo, P.; Steinbrecher, R.; Rasmussen, R. Global organic emissions from vegetation. In Emissions of Atmospheric Trace Compound; Granier, C., Artaxo, P., Reeves, C.E., Eds.; Springer: Dordrecht, The Netherlands, 2004; pp. 115–170. [Google Scholar] [CrossRef]
- Karl, T.G.; Spirig, C.; Rinne, J.; Stroud, C.; Prevost, P.; Greenberg, J.; Fall, R.; Guenther, A. Virtual disjunct eddy covariance measurements of organic compound fluxes from a subalpine forest using proton transfer reaction mass spectrometry. Atmos. Chem. Phys. 2002, 2, 279–291. [Google Scholar] [CrossRef]
- Geron, C.D.; Daly, R.W.; Arnts, R.R.; Guenther, A.B.; Mowry, F.L. Canopy level emissions of 2-methyl-3-buten-2-ol, monoterpenes, and sesquiterpenes from an experimental Pinus taeda plantation. Sci. Total Environ. 2016, 565, 730–741. [Google Scholar] [CrossRef] [PubMed]
- Fischer, K.B.; Gold, C.S.; Harvey, R.M.; Petrucci, A.N.; Petrucci, G.A. Ozonolysis Chemistry and Phase Behavior of 1-Octen-3-ol-Derived Secondary Organic Aerosol. ACS Earth Space Chem. 2020, 4, 1298–1308. [Google Scholar] [CrossRef]
- Creelman, R.A.; Mullet, J.E. Biosynthesis and action of jasmonates in plants. Annu. Rev. Plant Physiol. Plant Mol. Biol. 1997, 48, 355–381. [Google Scholar] [CrossRef]
- Guenther, A.B.; Jiang, X.; Heald, C.L.; Sakulyanontvittaya, T.; Duhl, T.; Emmons, L.K.; Wang, X. The Model of Emissions of Gases and Aerosols from Nature version 2.1 (MEGAN2.1): An extended and updated framework for modeling biogenic emissions. Geosci. Model Dev. 2012, 5, 1471–1492. [Google Scholar] [CrossRef]
- Sindelarova, K.; Granier, C.; Bouarar, I.; Guenther, A.; Tilmes, S.; Stavrakou, T.; Müller, J.F.; Kuhn, U.; Stefani, P.; Knorr, W. Global data set of biogenic VOC emissions calculated by the MEGAN model over the last 30 years. Atmos. Chem. Phys. 2014, 14, 9317–9341. [Google Scholar] [CrossRef]
- Su, Q.; Yang, F.; Zhang, Q.; Tong, H.; Hu, Y.; Zhang, X.; Xie, W.; Wang, S.; Wu, Q.; Zhang, Y. Defence priming in tomato by the green leaf volatile (Z)-3-hexenol reduces whitefly transmission of a plant virus. Plant Cell Environ. 2020, 43, 2797–2811. [Google Scholar] [CrossRef] [PubMed]
- Guo, R.-Z.; Yan, H.-Y.; Li, X.-X.; Zou, X.-X.; Zhang, X.-J.; Yu, X.-N.; Ci, D.-W.; Wang, Y.-F.; Si, T. Green leaf volatile (Z)-3-hexeny-1-yl acetate reduces salt stress in peanut by affecting photosynthesis and cellular redox homeostasis. Physiol. Plant. 2020, 170, 75–92. [Google Scholar] [CrossRef]
- Wakai, J.; Kusama, S.; Nakajima, K.; Kawai, S.; Okumura, Y.; Shiojiri, K. Effects of trans-2-hexenal and cis-3-hexenal on post-harvest strawberry. Sci. Rep. 2019, 9, 10112. [Google Scholar] [CrossRef] [PubMed]
- Cofer, T.M.; Engelberth, M.; Engelberth, J. Green leaf volatiles protect maize (Zea mays) seedlings against damage from cold stress. Plant Cell Environ. 2018, 41, 1673–1682. [Google Scholar] [CrossRef] [PubMed]
- Payá, C.; López-Gresa, M.P.; Intrigliolo, D.S.; Rodrigo, I.; Bellés, J.M.; Lisón, P. (Z)-3-Hexenyl Butyrate Induces Stomata Closure and Ripening in Vitis vinifera. Agronomy 2020, 10, 1122. [Google Scholar] [CrossRef]
- Jiménez, E.; Lanza, B.; Antiñolo, M.; Albaladejo, J. Photooxidation of leaf-wound oxygenated compounds, 1-penten-3-ol, (Z)-3-hexen-1-ol, and 1-penten-3-one, initiated by OH radicals and sunlight. Environ. Sci. Technol. 2009, 43, 1831–1837. [Google Scholar] [CrossRef]
- Yli-Pirilä, P.; Copolovici, L.; Kännaste, A.; Noe, S.; Blande, J.D.; Mikkonen, S.; Klemola, T.; Pulkkinen, J.; Virtanen, A.; Laaksonen, A.; et al. Herbivory by an Outbreaking Moth Increases Emissions of Biogenic Volatiles and Leads to Enhanced Secondary Organic Aerosol Formation Capacity. Environ. Sci. Technol. 2016, 50, 11501–11510. [Google Scholar] [CrossRef]
- Tsigaridis, K.; Daskalakis, N.; Kanakidou, M.; Adams, P.J.; Artaxo, P.; Bahadur, R.; Balkanski, Y.; Bauer, S.E.; Bellouin, N.; Benedetti, A.; et al. The AeroCom evaluation and intercomparison of organic aerosol in global models. Atmos. Chem. Phys. 2014, 14, 10845–10895. [Google Scholar] [CrossRef]
- Khan, M.A.H.; Jenkin, M.E.; Foulds, A.; Derwent, R.G.; Percival, C.J.; Shallcross, D.E. A modeling study of secondary organic aerosol formation from sesquiterpenes using the STOCHEM global chemistry and transport model. J. Geophys. Res. Atmos. 2017, 122, 4426–4439. [Google Scholar] [CrossRef]
- Hodzic, A.; Kasibhatla, P.S.; Jo, D.S.; Cappa, C.D.; Jimenez, J.L.; Madronich, S.; Park, R.J. Rethinking the global secondary organic aerosol (SOA) budget: Stronger production, faster removal, shorter lifetime. Atmos. Chem. Phys. 2016, 16, 7917–7941. [Google Scholar] [CrossRef]
- Carlton, A.G.; Wiedinmyer, C.; Kroll, J.H. A review of secondary organic aerosol (SOA) formation from isoprene. Atmos. Chem. Phys. 2009, 9, 4987–5005. [Google Scholar] [CrossRef]
- Lim, H.-J.; Carlton, A.G.; Turpin, B.J. Isoprene Forms Secondary Organic Aerosol through Cloud Processing: Model Simulations. Environ. Sci. Technol. 2005, 39, 4441–4446. [Google Scholar] [CrossRef]
- Lin, G.; Penner, J.E.; Zhou, C. How will SOA change in the future? Geophys. Res. Lett. 2016, 43, 1718–1726. [Google Scholar] [CrossRef]
- Hamilton, J.F.; Lewis, A.C.; Carey, T.J.; Wenger, J.C.; Garcia, E.B.I.; Munoz, A. Reactive oxidation products promote secondary organic aerosol formation from green leaf volatiles. Atmos. Chem. Phys. 2009, 9, 3815–3823. [Google Scholar] [CrossRef]
- Dicke, M.; Loreto, F. Induced plant volatiles: From genes to climate change. Trends Plant Sci. 2010, 15, 115–117. [Google Scholar] [CrossRef] [PubMed]
- Peñuelas, J.; Staudt, M. BVOCs and global change. Trends Plant Sci. 2010, 15, 133–144. [Google Scholar] [CrossRef] [PubMed]
- Holopainen, J.K.; Gershenzon, J. Multiple stress factors and the emission of plant VOCs. Trends Plant Sci. 2010, 15, 176–184. [Google Scholar] [CrossRef]
- Noziere, B.; Kalberer, M.; Claeys, M.; Allan, J.; D’Anna, B.; Decesari, S.; Finessi, E.; Glasius, M.; Grgic, I.; Hamilton, J.F.; et al. The molecular identification of organic compounds in the atmosphere: State of the art and challenges. Chem. Rev. 2015, 115, 3919–3983. [Google Scholar] [CrossRef]
- Herrmann, H.; Schaefer, T.; Tilgner, A.; Styler, S.A.; Weller, C.; Teich, M.; Otto, T. Tropospheric aqueous-phase chemistry: Kinetics, mechanisms, and its coupling to a changing gas phase. Chem. Rev. 2015, 115, 4259–4334. [Google Scholar] [CrossRef] [PubMed]
- Mellouki, A.; Wallington, T.J.; Chen, J. Atmospheric chemistry of oxygenated volatile organic compounds: Impacts on air quality and climate. Chem. Rev. 2015, 115, 3984–4014. [Google Scholar] [CrossRef] [PubMed]
- Holopainen, J.K.; Kivimäenpää, M.; Nizkorodov, S.A. Plant-derived Secondary Organic Material in the Air and Ecosystems. Trends Plant Sci. 2017, 22, 744–753. [Google Scholar] [CrossRef] [PubMed]
- Ameye, M.; Allmann, S.; Verwaeren, J.; Smagghe, G.; Haesaert, G.; Schuurink, R.C.; Audenaert, K. Green leaf volatile production by plants: A meta-analysis. New Phytol. 2018, 220, 666–683. [Google Scholar] [CrossRef]
- López-Gresa, M.P.; Payá, C.; Ozáez, M.; Rodrigo, I.; Conejero, V.; Klee, H.; Bellés, J.M.; Lisón, P. A New Role for Green Leaf Volatile Esters in Tomato Stomatal Defense Against Pseudomonas syringe pv. tomato. Front. Plant Sci. 2018, 9, 1855. [Google Scholar] [CrossRef] [PubMed]
- Kivimäenpää, M.; Babalola, A.B.; Joutsensaari, J.; Holopainen, J.K. Methyl Salicylate and Sesquiterpene Emissions Are Indicative for Aphid Infestation on Scots Pine. Forests 2020, 11, 573. [Google Scholar] [CrossRef]
- Niinemets, Ü.; Kännaste, A.; Copolovici, L. Quantitative patterns between plant volatile emissions induced by biotic stresses and the degree of damage. Front. Plant Sci. 2013, 4, 262. [Google Scholar] [CrossRef] [PubMed]
- Mattiacci, L.; Rocca, B.A.; Scascighini, N.; D’Alessandro, M.; Hern, A.; Dorn, S. Systemically induced plant volatiles emitted at the time of “danger”. J. Chem. Ecol. 2001, 27, 2233–2252. [Google Scholar] [CrossRef] [PubMed]
- Engelberth, J. Primed to grow: A new role for green leaf volatiles in plant stress responses. Plant Signal. Behav. 2020, 15, 1701240. [Google Scholar] [CrossRef]
- Arimura, G.-I.; Kost, C.; Boland, W. Herbivore-induced, indirect plant defences. Biochim. Biophys. Acta (BBA) Mol. Cell Biol. Lipids 2005, 1734, 91–111. [Google Scholar] [CrossRef] [PubMed]
- Cui, H.; Wei, J.; Su, J.; Li, C.; Ge, F. Elevated O3 increases volatile organic compounds via jasmonic acid pathway that promote the preference of parasitoid Encarsia formosa for tomato plants. Plant Sci. 2016, 253, 243–250. [Google Scholar] [CrossRef] [PubMed]
- Pinto, D.M.; Nerg, A.M.; Holopainen, J.K. The role of ozone-reactive compounds, terpenes, and green leaf volatiles (GLVs), in the orientation of Cotesia plutellae. J. Chem. Ecol. 2007, 33, 2218–2228. [Google Scholar] [CrossRef] [PubMed]
- Hanley, M.E.; Shannon, R.W.R.; Lemoine, D.G.; Sandey, B.; Newland, P.L.; Poppy, G.M. Riding on the wind: Volatile compounds dictate selection of grassland seedlings by snails. Ann. Bot. 2018, 122, 1075–1083. [Google Scholar] [CrossRef] [PubMed]
- Dudareva, N.; Negre, F.; Nagegowda, D.A.; Orlova, I. Plant volatiles: Recent advances and future perspectives. Crit. Rev. Plant Sci. 2006, 25, 417–440. [Google Scholar] [CrossRef]
- Engelberth, J.; Engelberth, M. Variability in the Capacity to Produce Damage-Induced Aldehyde Green Leaf Volatiles among Different Plant Species Provides Novel Insights into Biosynthetic Diversity. Plants 2020, 9, 213. [Google Scholar] [CrossRef]
- Albaladejo, J.; Ballesteros, B.; Jiménez, E.; Martén, P.; Marténez, E. A PLP–LIF kinetic study of the atmospheric reactivity of a series of C4–C7 saturated and unsaturated aliphatic aldehydes with OH. Atmos. Environ. 2002, 36, 3231–3239. [Google Scholar] [CrossRef]
- König, G.; Brunda, M.; Puxbaum, H.; Hewitt, C.N.; Duckham, S.C.; Rudolph, J. Relative contribution of oxygenated hydrocarbons to the total biogenic VOC emissions of selected mid-European agricultural and natural plant species. Atmos. Environ. 1995, 29, 861–874. [Google Scholar] [CrossRef]
- García-Plazaola, J.I.; Portillo-Estrada, M.; Fernández-Marín, B.; Kännaste, A.; Niinemets, Ü. Emissions of carotenoid cleavage products upon heat shock and mechanical wounding from a foliose lichen. Environ. Exp. Bot. 2017, 133, 87–97. [Google Scholar] [CrossRef]
- Eller, A.S.D.; Sekimoto, K.; Gilman, J.B.; Kuster, W.C.; de Gouw, J.A.; Monson, R.K.; Graus, M.; Crespo, E.; Warneke, C.; Fall, R. Volatile organic compound emissions from switchgrass cultivars used as biofuel crops. Atmos. Environ. 2011, 45, 3333–3337. [Google Scholar] [CrossRef]
- Heiden, A.C.; Hoffmann, T.; Kahl, J.; Kley, D.; Klockow, D.; Langebartels, C.; Mehlhorn, H.; Sandermann, H., Jr.; Schraudner, M.; Schuh, G.; et al. Emission of volatile organic compounds from ozone-exposed plants. Ecol. Appl. 1999, 9, 1160–1167. [Google Scholar] [CrossRef]
- Helmig, D.; Klinger, L.F.; Guenther, A.; Vierling, L.; Geron, C.; Zimmerman, P. Biogenic volatile organic compound emissions (BVOCs) I. Identifications from three continental sites in the U.S. Chemosphere 1999, 38, 2163–2187. [Google Scholar] [CrossRef]
- Semiz, G.; Blande, J.D.; Heijari, J.; Işık, K.; Niinemets, Ü.; Holopainen, J.K. Manipulation of VOC emissions with methyl jasmonate and carrageenan in the evergreen conifer Pinus sylvestris and evergreen broadleaf Quercus ilex. Plant Biol. 2012, 14, 57–65. [Google Scholar] [CrossRef]
- Harvey, R.M.; Zahardis, J.; Petrucci, G.A. Establishing the contribution of lawn mowing to atmospheric aerosol levels in American suburbs. Atmos. Chem. Phys. 2014, 14, 797–812. [Google Scholar] [CrossRef]
- Giacomuzzi, V.; Cappellin, L.; Nones, S.; Khomenko, I.; Biasioli, F.; Knight, A.L.; Angeli, S. Diel rhythms in the volatile emission of apple and grape foliage. Phytochemistry 2017, 138, 104–115. [Google Scholar] [CrossRef]
- Fukui, Y.; Doskey, P.V. Air-surface exchange of nonmethane organic compounds at a grassland site: Seasonal variations and stressed emissions. J. Geophys. Res. Atmos. 1998, 103, 13153–13168. [Google Scholar] [CrossRef]
- Arey, J.; Winer, A.M.; Atkinson, R.; Aschmann, S.M.; Long, W.D.; Lynn Morrison, C. The emission of (Z)-3-hexen-1-ol, (Z)-3-hexenylacetate and other oxygenated hydrocarbons from agricultural plant species. Atmos. Environ. Part A Gen. Top. 1991, 25, 1063–1075. [Google Scholar] [CrossRef]
- Bamberger, I.; Hortnagl, L.; Schnitzhofer, R.; Graus, M.; Ruuskanen, T.M.; Muller, M.; Dunkl, J.; Wohlfahrt, G.; Hansel, A. BVOC fluxes above mountain grassland. Biogeosciences 2010, 7, 1413–1424. [Google Scholar] [CrossRef]
- Gray, D.W.; Lerdau, M.T.; Goldstein, A.H. Influences of temperature history, water stress, and needle age on methylbutenol emissions. Ecology 2003, 84, 765–776. [Google Scholar] [CrossRef]
- Harley, P.; Eller, A.; Guenther, A.; Monson, R.K. Observations and models of emissions of volatile terpenoid compounds from needles of ponderosa pine trees growing in situ: Control by light, temperature and stomatal conductance. Oecologia 2014, 176, 35–55. [Google Scholar] [CrossRef]
- Juráň, S.; Pallozzi, E.; Guidolotti, G.; Fares, S.; Šigut, L.; Calfapietra, C.; Alivernini, A.; Savi, F.; Večeřová, K.; Křůmal, K.; et al. Fluxes of biogenic volatile organic compounds above temperate Norway spruce forest of the Czech Republic. Agric. For. Meteorol. 2017, 232, 500–513. [Google Scholar] [CrossRef]
- Baker, B.; Guenther, A.; Greenberg, J.; Goldstein, A.; Fall, R. Canopy fluxes of 2-methyl-3-buten-2-ol over a ponderosa pine forest by relaxed eddy accumulation: Field data and model comparison. J. Geophys. Res. Atmos. 1999, 104, 26107–26114. [Google Scholar] [CrossRef]
- Schade, G.W.; Goldstein, A.H. Fluxes of oxygenated volatile organic compounds from a ponderosa pine plantation. J. Geophys. Res. Atmos. 2001, 106, 3111–3123. [Google Scholar] [CrossRef]
- Baker, B.; Guenther, A.; Greenberg, J.; Fall, R. Canopy Level Fluxes of 2-Methyl-3-buten-2-ol, Acetone, and Methanol by a Portable Relaxed Eddy Accumulation System. Environ. Sci. Technol. 2001, 35, 1701–1708. [Google Scholar] [CrossRef]
- Arnts, R.R.; Mowry, F.L.; Hampton, G.A. A high-frequency response relaxed eddy accumulation flux measurement system for sampling short-lived biogenic volatile organic compounds. J. Geophys. Res. Atmos. 2013, 118, 4860–4873. [Google Scholar] [CrossRef]
- Schade, G.W.; Goldstein, A.H.; Gray, D.W.; Lerdau, M.T. Canopy and leaf level 2-methyl-3-buten-2-ol fluxes from a ponderosa pine plantation. Atmos. Environ. 2000, 34, 3535–3544. [Google Scholar] [CrossRef]
- Harley, P.; Fridd-Stroud, V.; Greenberg, J.; Guenther, A.; Vasconcellos, P. Emission of 2-methyl-3-buten-2-ol by pines: A potentially large natural source of reactive carbon to the atmosphere. J. Geophys. Res. Atmos. 1998, 103, 25479–25486. [Google Scholar] [CrossRef]
- Karl, T.; Guenther, A.; Turnipseed, A.; Patton, E.G.; Jardine, K. Chemical sensing of plant stress at the ecosystem scale. Biogeosciences 2008, 5, 1287–1294. [Google Scholar] [CrossRef]
- Copolovici, L.; Kännaste, A.; Remmel, T.; Niinemets, Ü. Volatile organic compound emissions from Alnus glutinosa under interacting drought and herbivory stresses. Environ. Exp. Bot. 2014, 100, 55–63. [Google Scholar] [CrossRef] [PubMed]
- Brilli, F.; Hortnagl, L.; Bamberger, I.; Schnitzhofer, R.; Ruuskanen, T.M.; Hansel, A.; Loreto, F.; Wohlfahrt, G. Qualitative and quantitative characterization of volatile organic compound emissions from cut grass. Environ. Sci. Technol. 2012, 46, 3859–3865. [Google Scholar] [CrossRef]
- Karl, T.; Guenther, A.; Lindinger, C.; Jordan, A.; Fall, R.; Lindinger, W. Eddy covariance measurements of oxygenated volatile organic compound fluxes from crop harvesting using a redesigned proton-transfer-reaction mass spectrometer. J. Geophys. Res. Atmos. 2001, 106, 24157–24167. [Google Scholar] [CrossRef]
- Karl, T.; Guenther, A.; Jordan, A.; Fall, R.; Lindinger, W. Eddy covariance measurement of biogenic oxygenated VOC emissions from hay harvesting. Atmos. Environ. 2001, 35, 491–495. [Google Scholar] [CrossRef]
- de Carvalho, A.B.; Kato, M.; Rezende, M.M.; Pereira, P.; de Andrade, J.B. Determination of carbonyl compounds in the atmosphere of charcoal plants by HPLC and UV detection. J. Sep. Sci. 2008, 31, 1686–1693. [Google Scholar] [CrossRef] [PubMed]
- Karl, T.; Fall, R.; Jordan, A.; Lindinger, W. On-line analysis of reactive VOCs from urban lawn mowing. Environ. Sci. Technol. 2001, 35, 2926–2931. [Google Scholar] [CrossRef] [PubMed]
- Gentner, D.R.; Ormeno, E.; Fares, S.; Ford, T.B.; Weber, R.; Park, J.H.; Brioude, J.; Angevine, W.M.; Karlik, J.F.; Goldstein, A.H. Emissions of terpenoids, benzenoids, and other biogenic gas-phase organic compounds from agricultural crops and their potential implications for air quality. Atmos. Chem. Phys. 2014, 14, 5393–5413. [Google Scholar] [CrossRef]
- Goldan, P.D.; Kuster, W.C.; Fehsenfeld, F.C.; Montzka, S.A. The observation of a C5 alcohol emission in a North American pine forest. Geophys. Res. Lett. 1993, 20, 1039–1042. [Google Scholar] [CrossRef]
- Guenther, A.; Karl, T.; Harley, P.; Wiedinmyer, C.; Palmer, P.I.; Geron, C. Estimates of global terrestrial isoprene emissions using MEGAN (Model of Emissions of Gases and Aerosols from Nature). Atmos. Chem. Phys. 2006, 6, 3181–3210. [Google Scholar] [CrossRef]
- Heiden, A.C.; Kobel, K.; Langebartels, C.; Schuh-Thomas, G.; Wildt, J. Emissions of oxygenated volatile organic compounds from plants - part I: Emissions from lipoxygenase activity. J. Atmos. Chem. 2003, 45, 143–172. [Google Scholar] [CrossRef]
- US_EPA. Estimation Programs Interface Suite™ for Microsoft® Windows, v 4.11; United States Environmental Protection Agency: Washington, DC, USA, 2012. [Google Scholar]
- Hine, J.; Mookerjee, P.K. Structural effects on rates and equilibriums. XIX. Intrinsic hydrophilic character of organic compounds. Correlations in terms of structural contributions. J. Org. Chem. 1975, 40, 292–298. [Google Scholar] [CrossRef]
- Altschuh, J.; Bruggemann, R.; Santl, H.; Eichinger, G.; Piringer, O.G. Henry’s law constants for a diverse set of organic chemicals: Experimental determination and comparison of estimation methods. Chemosphere 1999, 39, 1871–1887. [Google Scholar] [CrossRef]
- Sander, R. Compilation of Henry’s law constants (version 4.0) for water as solvent. Atmos. Chem. Phys. 2015, 15, 4399–4981. [Google Scholar] [CrossRef]
- Staudinger, J.; Roberts, P.V. A critical review of Henry’s law constants for environmental applications. Crit. Rev. Environ. Sci. Technol. 1996, 26, 205–297. [Google Scholar] [CrossRef]
- Sangster, J. Octanol-water partition coefficients of simple organic compounds. J. Phys. Chem. Ref. Data 1989, 18, 1111–1229. [Google Scholar] [CrossRef]
- Abraham, M.H.; Le, J.; Acree, W.E.; Carr, P.W.; Dallas, A.J. The solubility of gases and vapours in dry octan-1-ol at 298 K. Chemosphere 2001, 44, 855–863. [Google Scholar] [CrossRef]
- Shunthirasingham, C.; Cao, X.S.; Lei, Y.D.; Wania, F. Large bubbles reduce the surface sorption artifact of the inert gas stripping method. J. Chem. Eng. Data 2013, 58, 792–797. [Google Scholar] [CrossRef]
- Hansch, C.; Quinlan, J.E.; Lawrence, G.L. Linear free-energy relationship between partition coefficients and aqueous solubility of organic liquids. J. Org. Chem. 1968, 33, 347. [Google Scholar] [CrossRef]
- Suzuki, T. Development of an automatic estimation system for both the partition-coefficient and aqueous solubility. J. Comput.-Aided Mol. Des. 1991, 5, 149–166. [Google Scholar] [CrossRef]
- Karl, T.; Yeretzian, C.; Jordan, A.; Lindinger, W. Dynamic measurements of partition coefficients using proton-transfer-reaction mass spectrometry (PTR–MS). Int. J. Mass Spectrom. 2003, 223–224, 383–395. [Google Scholar] [CrossRef]
- Sander, R. Compilation of Henry’s Law Constants for Inorganic and Organic Species of Potential Importance in Environmental Chemistry; Max-Planck Institute of Chemistry: Mainz, Germany, 1999; p. 107. [Google Scholar]
- Zhou, X.; Mopper, K. Apparent partition coefficients of 15 carbonyl compounds between air and seawater and between air and freshwater; implications for air-sea exchange. Environ. Sci. Technol. 1990, 24, 1864–1869. [Google Scholar] [CrossRef]
- Vempati, H.; Vaitilingom, M.; Zhang, Z.H.; Liyana-Arachchi, T.P.; Stevens, C.S.; Hung, F.R.; Valsararj, K.T. Physico-chemical properties of green leaf volatiles (GLV) for ascertaining atmospheric fate and transport in fog. Adv. Environ. Res. 2018, 7, 139–159. [Google Scholar] [CrossRef]
- Buttery, R.G.; Bomben, J.L.; Guadagni, D.G.; Ling, L.C. Volatilities of organic flavor compounds in foods. J. Agric. Food Chem. 1971, 19, 1045–1048. [Google Scholar] [CrossRef]
- Nozière, B.; Voisin, D.; Longfellow, C.A.; Friedli, H.; Henry, B.E.; Hanson, D.R. The Uptake of Methyl Vinyl Ketone, Methacrolein, and 2-Methyl-3-butene-2-ol onto Sulfuric Acid Solutions. J. Phys. Chem. A 2006, 110, 2387–2395. [Google Scholar] [CrossRef][Green Version]
- Iraci, L.T.; Baker, B.M.; Tyndall, G.S.; Orlando, J.J. Measurements of the Henry’s Law Coefficients of 2-Methyl-3-buten-2-ol, Methacrolein, and Methylvinyl Ketone. J. Atmos. Chem. 1999, 33, 321–330. [Google Scholar] [CrossRef]
- Roberts, D.D.; Pollien, P. Analysis of aroma release during microwave heating. J. Agric. Food Chem. 1997, 45, 4388–4392. [Google Scholar] [CrossRef]
- Meylan, W.M.; Howard, P.H. Estimating octanol-air partition coefficients with octanol-water partition coefficients and Henry’s law constants. Chemosphere 2005, 61, 640–644. [Google Scholar] [CrossRef]
- Yalkowsky, S.H.; Valvani, S.C. Solubility and partitioning. 1. Solubility of non-electrolytes in water. J. Pharm. Sci. 1980, 69, 912–922. [Google Scholar] [CrossRef] [PubMed]
- Riddick, J.A.; Bunger, W.B.; Sakano, T.K. Organic Solvents: Physical Properties and Methods of Purification, 4th ed.; John Wiley and Sons: New York, NY, USA, 1986. [Google Scholar]
- Mackay, D.; Yeun, A.T.K. Mass-transfer coefficient correlations for volatilization of organic solutes from water. Environ. Sci. Technol. 1983, 17, 211–217. [Google Scholar] [CrossRef]
- Daubert, T.E.; Danner, R.P. Physical and Thermodynamic Properties of Pure Chemicals: Data Compilation; Taylor & Francis: Washington, DC, USA, 1989. [Google Scholar]
- Amoore, J.E.; Buttery, R.G. Partition-coefficients and comparative olfactometry. Chem. Sens. Flavour 1978, 3, 57–71. [Google Scholar] [CrossRef]
- Yalkowsky, S.H.; Dannenfelser, R. Aquasol Database of Aqueous Solubility, Version 5; College of Pharmacy, University of Arizona: Tuscon, AR, USA, 1992. [Google Scholar]
- Yaws, C.L. Handbook of Vapor Pressure; Gulf Pub. Co.: Houston, TX, USA, 1994. [Google Scholar]
- Butler, J.A.V.; Ramchandani, C.N.; Thomson, D.W. 58. The solubility of non-electrolytes. Part I. The free energy of hydration of some aliphatic alcohols. J. Chem. Soc. 1935, 280–285. [Google Scholar] [CrossRef]
- Buttery, R.G.; Ling, L.; Guadagni, D.G. Food volatiles. Volatilities of aldehydes, ketones, and esters in dilute water solution. J. Agric. Food Chem. 1969, 17, 385–389. [Google Scholar] [CrossRef]
- Hwang, Y.L.; Olson, J.D.; Keller, G.E. Steam stripping for removal of organic pollutants from water. 2. Vapor-liquid-equilibrium data. Ind. Eng. Chem. Res. 1992, 31, 1759–1768. [Google Scholar] [CrossRef]
- Li, J.J.; Carr, P.W. Measurement of water-hexadecane partition-coefficients by headspace gas-chromatography and calculation of limiting activity-coefficients in water. Anal. Chem. 1993, 65, 1443–1450. [Google Scholar] [CrossRef]
- Mackay, D.; Shiu, W.-Y.; Shiu, W.-Y.; Lee, S.C. Handbook of Physical-Chemical Properties and Environmental Fate for Organic Chemicals, 2nd ed.; CRC Press: Boca Raton, FL, USA, 2006. [Google Scholar] [CrossRef]
- Rytting, J.H.; Huston, L.P.; Higuchi, T. Thermodynamic group contributions for hydroxyl, amino, and methylene groups. J. Pharm. Sci. 1978, 67, 615–618. [Google Scholar] [CrossRef]
- Buttery, R.G.; Guadagni, D.G.; Okano, S. Air-water partition coefficients of some aldehydes. J. Sci. Food Agric. 1965, 16, 691–692. [Google Scholar] [CrossRef]
- Sieg, K.; Fries, E.; Puttmann, W. Analysis of benzene, toluene, ethylbenzene, xylenes and n-aldehydes in melted snow water via solid-phase dynamic extraction combined with gas chromatography/mass spectrometry. J. Chromatogr. A 2008, 1178, 178–186. [Google Scholar] [CrossRef] [PubMed]
- Gupta, A.K.; Teja, A.S.; Chai, X.S.; Zhu, J.Y. Henry’s constants of n-alkanols (methanol through n-hexanol) in water at temperatures between 40 degrees C and 90 degrees C. Fluid Phase Equilib. 2000, 170, 183–192. [Google Scholar] [CrossRef]
- Falabella, J.B.; Nair, A.; Teja, A.S. Henry’s constants of 1-alkanols and 2-ketones in salt solutions. J. Chem. Eng. Data 2006, 51, 1940–1945. [Google Scholar] [CrossRef]
- Harvey, A.H. Applications of Near-Critical Dilute-Solution Thermodynamics. Ind. Eng. Chem. Res. 1998, 37, 3080–3088. [Google Scholar] [CrossRef]
- Teja, A.S.; Gupta, A.K.; Bullock, K.; Chai, X.-S.; Zhu, J. Henry’s constants of methanol in aqueous systems containing salts. Fluid Phase Equilib. 2001, 185, 265–274. [Google Scholar] [CrossRef]
- Dohnal, V.; Fenclova, D.; Vrbka, P. Temperature dependences of limiting activity coefficients, Henry’s law constants, and derivative infinite dilution properties of lower (C-1-C-5) 1-alkanols in water. Critical compilation, correlation, and recommended data. J. Phys. Chem. Ref. Data 2006, 35, 1621–1651. [Google Scholar] [CrossRef]
- Liyana-Arachchi, T.P.; Hansel, A.K.; Stevens, C.; Ehrenhauser, F.S.; Valsaraj, K.T.; Hung, F.R. Molecular modeling of the green leaf volatile methyl salicylate on atmospheric air/water interfaces. J. Phys. Chem. A 2013, 117, 4436–4443. [Google Scholar] [CrossRef]
- Liyana-Arachchi, T.P.; Zhang, Z.; Vempati, H.; Hansel, A.K.; Stevens, C.; Pham, A.T.; Ehrenhauser, F.S.; Valsaraj, K.T.; Hung, F.R. Green leaf volatiles on atmospheric air/water interfaces: A combined experimental and molecular simulation study. J. Chem. Eng. Data 2014, 59, 3025–3035. [Google Scholar] [CrossRef]
- Kerr, J.B.; Fioletov, V.E. Surface ultraviolet radiation. Atmos. Ocean. 2008, 46, 159–184. [Google Scholar] [CrossRef]
- Jiménez, E.; Lanza, B.; Martínez, E.; Albaladejo, J. Daytime tropospheric loss of hexanal and trans-2-hexenal: OH kinetics and UV photolysis. Atmos. Chem. Phys. 2007, 7, 1565–1574. [Google Scholar] [CrossRef]
- Xing, J.-H.; Ono, M.; Kuroda, A.; Obi, K.; Sato, K.; Imamura, T. Kinetic Study of the Daytime Atmospheric Fate of (Z)-3-Hexenal. J. Phys. Chem. A 2012, 116, 8523–8529. [Google Scholar] [CrossRef] [PubMed]
- O’Connor, M.P.; Wenger, J.C.; Mellouki, A.; Wirtz, K.; Munoz, A. The atmospheric photolysis of E-2-hexenal, Z-3-hexenal and E,E-2,4-hexadienal. Phys. Chem. Chem. Phys. 2006, 8, 5236–5246. [Google Scholar] [CrossRef] [PubMed]
- Kalalian, C.; Samir, B.; Roth, E.; Chakir, A. UV absorption spectra of trans-2-pentenal, trans-2-hexenal and 2-methyl-2-pentenal. Chem. Phys. Lett. 2019, 718, 22–26. [Google Scholar] [CrossRef]
- Sarang, K.; Otto, T.; Rudzinski, K.; Grgić, I.; Nestorowicz, K.; Herrmann, H.; Szmigielski, R. Reaction kinetics of green leaf volatiles with sulfate, hydroxyl and nitrate radicals in tropospheric aqueous-phase. Environ. Sci. Technol. 2021. [Google Scholar] [CrossRef]
- Canosa-Mas, C.E.; Duffy, J.M.; King, M.D.; Thompson, K.C.; Wayne, R.P. The atmospheric chemistry of methyl salicylate—reactions with atomic chlorine and with ozone. Atmos. Environ. 2002, 36, 2201–2205. [Google Scholar] [CrossRef]
- Rudich, Y.; Talukdar, R.; Burkholder, J.B.; Ravishankara, A.R. Reaction of Methylbutenol with the OH Radical: Mechanism and Atmospheric Implications. J. Phys. Chem. 1995, 99, 12188–12194. [Google Scholar] [CrossRef]
- Tang, Y.; Zhu, L. Wavelength-Dependent Photolysis of n-Hexanal and n-Heptanal in the 280−330-nm Region. J. Phys. Chem. A 2004, 108, 8307–8316. [Google Scholar] [CrossRef]
- Atkinson, R.; Arey, J. Gas-phase tropospheric chemistry of biogenic volatile organic compounds: A review. Atmos. Environ. 2003, 37 Supp. 2, 197–219. [Google Scholar] [CrossRef]
- Atkinson, R.; Arey, J. Atmospheric Degradation of Volatile Organic Compounds. Chem. Rev. 2003, 103, 4605–4638. [Google Scholar] [CrossRef] [PubMed]
- Vereecken, L.; Francisco, J.S. Theoretical studies of atmospheric reaction mechanisms in the troposphere. Chem. Soc. Rev. 2012, 41, 6259–6293. [Google Scholar] [CrossRef] [PubMed]
- Atkinson, R. Atmospheric chemistry of VOCs and NOx. Atmos. Environ. 2000, 34, 2063–2101. [Google Scholar] [CrossRef]
- Gai, Y.; Lin, X.; Ma, Q.; Hu, C.; Gu, X.; Zhao, W.; Fang, B.; Zhang, W.; Long, B.; Long, Z. Experimental and Theoretical Study of Reactions of OH Radicals with Hexenols: An Evaluation of the Relative Importance of the H-Abstraction Reaction Channel. Environ. Sci. Technol. 2015, 49, 10380–10388. [Google Scholar] [CrossRef]
- Du, B.; Zhang, W. Atmospheric reaction of OH radicals with 2-methyl-3-buten-2-ol (MBO): Quantum chemical investigation on the reaction mechanism. Comput. Theor. Chem. 2012, 999, 109–120. [Google Scholar] [CrossRef]
- Davis, M.E.; Gilles, M.K.; Ravishankara, A.R.; Burkholder, J.B. Rate coefficients for the reaction of OH with (E)-2-pentenal, (E)-2-hexenal, and (E)-2-heptenal. Phys. Chem. Chem. Phys. 2007, 9, 2240–2248. [Google Scholar] [CrossRef]
- Atkinson, R.; Arey, J.; Aschmann, S.M.; Corchnoy, S.B.; Shu, Y. Rate constants for the gas-phase reactions of cis-3-Hexen-1-ol, cis-3-Hexenylacetate, trans-2-Hexenal, and Linalool with OH and NO3 radicals and O3 at 296 ± 2 K, and OH radical formation yields from the O3 reactions. Int. J. Chem. Kinet. 1995, 27, 941–955. [Google Scholar] [CrossRef]
- Gibilisco, R.G.; Blanco, M.a.B.; Bejan, I.; Barnes, I.; Wiesen, P.; Teruel, M.A. Atmospheric Sink of (E)-3-Hexen-1-ol, (Z)-3-Hepten-1-ol, and (Z)-3-Octen-1-ol: Rate Coefficients and Mechanisms of the OH-Radical Initiated Degradation. Environ. Sci. Technol. 2015, 49, 7717–7725. [Google Scholar] [CrossRef] [PubMed]
- Gibilisco, R.G.; Santiago, A.N.; Teruel, M.A. OH-initiated degradation of a series of hexenols in the troposphere. Rate coefficients at 298 K and 1 atm. Atmos. Environ. 2013, 77, 358–364. [Google Scholar] [CrossRef]
- Carrasco, N.; Doussin, J.F.; O’Connor, M.; Wenger, J.C.; Picquet-Varrault, B.; Durand-Jolibois, R.; Carlier, P. Simulation Chamber Studies of the Atmospheric Oxidation of 2-Methyl-3-Buten-2-ol: Reaction with Hydroxyl Radicals and Ozone Under a Variety of Conditions. J. Atmos. Chem. 2007, 56, 33–55. [Google Scholar] [CrossRef]
- Alvarado, A.; Tuazon, E.C.; Aschmann, S.M.; Arey, J.; Atkinson, R. Products and mechanisms of the gas-phase reactions of OH radicals and O3 with 2-methyl-3-buten-2-ol. Atmos. Environ. 1999, 33, 2893–2905. [Google Scholar] [CrossRef]
- Ferronato, C.; Orlando, J.J.; Tyndall, G.S. Rate and mechanism of the reactions of OH and Cl with 2-methyl-3-buten-2-ol. J. Geophys. Res. Atmos. 1998, 103, 25579–25586. [Google Scholar] [CrossRef]
- Reisen, F.; Aschmann, S.M.; Atkinson, R.; Arey, J. Hydroxyaldehyde Products from Hydroxyl Radical Reactions of Z-3-Hexen-1-ol and 2-Methyl-3-buten-2-ol Quantified by SPME and API-MS. Environ. Sci. Technol. 2003, 37, 4664–4671. [Google Scholar] [CrossRef]
- Orlando, J.J.; Tyndall, G.S. Laboratory studies of organic peroxy radical chemistry: An overview with emphasis on recent issues of atmospheric significance. Chem. Soc. Rev. 2012, 41, 6294–6317. [Google Scholar] [CrossRef] [PubMed]
- Fantechi, G.; Jensen, N.R.; Hjorth, J.; Peeters, J. Mechanistic studies of the atmospheric oxidation of methyl butenol by OH radicals, ozone and NO3 radicals. Atmos. Environ. 1998, 32, 3547–3556. [Google Scholar] [CrossRef]
- Aschmann, S.M.; Shu, Y.; Arey, J.; Atkinson, R. Products of the gas-phase reactions of cis-3-hexen-1-ol with OH radicals and O3. Atmos. Environ. 1997, 31, 3551–3560. [Google Scholar] [CrossRef]
- Cavalli, F.; Barnes, I.; Becker, K.H. FT-IR kinetic and product study of the OH radical-initiated oxidation of 1-pentanol. Environ. Sci. Technol. 2000, 34, 4111–4116. [Google Scholar] [CrossRef]
- Orlando, J.J.; Tyndall, G.S.; Ceazan, N. Rate coefficients and product yields from reaction of OH with 1-penten-3-ol, (Z)-2-penten-1-ol, and allyl alcohol (2-propen-1-ol). J. Phys. Chem. A 2001, 105, 3564–3569. [Google Scholar] [CrossRef]
- Gaona-Colmán, E.; Blanco, M.B.; Teruel, M.A. Kinetics and product identification of the reactions of (E)-2-hexenyl acetate and 4-methyl-3-penten-2-one with OH radicals and Cl atoms at 298 K and atmospheric pressure. Atmos. Environ. 2017, 161, 155–166. [Google Scholar] [CrossRef]
- Chan, A.W.H.; Galloway, M.M.; Kwan, A.J.; Chhabra, P.S.; Keutsch, F.N.; Wennberg, P.O.; Flagan, R.C.; Seinfeld, J.H. Photooxidation of 2-Methyl-3-Buten-2-ol (MBO) as a Potential Source of Secondary Organic Aerosol. Environ. Sci. Technol. 2009, 43, 4647–4652. [Google Scholar] [CrossRef]
- Bowman, J.H.; Barket, D.J.; Shepson, P.B. Atmospheric chemistry of nonanal. Environ. Sci. Technol. 2003, 37, 2218–2225. [Google Scholar] [CrossRef]
- Priya, A.M.; Senthilkumar, L. Reaction of OH radical and ozone with methyl salicylate–a DFT study. J. Phys. Org. Chem. 2015, 28, 542–553. [Google Scholar] [CrossRef]
- Seif, A.; Domingo, L.R.; Mazarei, E.; Zahedi, E.; Ahmadi, T.S. Atmospheric Oxidation Reactions of Methyl Salicylate as Green Leaf Volatiles by OH Radical: Theoretical Kinetics and Mechanism. Chem. Sel. 2020, 5, 12535–12547. [Google Scholar] [CrossRef]
- Noda, J.; Hallquist, M.; Langer, S.; Ljungström, E. Products from the gas-phase reaction of some unsaturated alcohols with nitrate radicals. Phys. Chem. Chem. Phys. 2000, 2, 2555–2564. [Google Scholar] [CrossRef]
- Pfrang, C.; Romero, M.T.B.; Cabanas, B.; Canosa-Mas, C.E.; Villanueva, F.; Wayne, R.P. Night-time tropospheric chemistry of the unsaturated alcohols (Z)-pent-2-en-1-ol and pent-1-en-3-ol: Kinetic studies of reactions of NO3 and N2O5 with stress-induced plant emissions. Atmos. Environ. 2007, 41, 1652–1662. [Google Scholar] [CrossRef]
- Kerdouci, J.; Picquet-Varrault, B.; Durand-Jolibois, R.; Gaimoz, C.; Doussin, J.F. An Experimental Study of the Gas-Phase Reactions of NO3 Radicals with a Series of Unsaturated Aldehydes: Trans-2-Hexenal, trans-2-Heptenal, and trans-2-Octenal. J. Phys. Chem. A 2012, 116, 10135–10142. [Google Scholar] [CrossRef] [PubMed]
- Horie, O.; Moortgat, G.K. Gas-Phase Ozonolysis of Alkenes. Recent Advances in Mechanistic Investigations. Acc. Chem. Res. 1998, 31, 387–396. [Google Scholar] [CrossRef]
- Johnson, D.; Marston, G. The gas-phase ozonolysis of unsaturated volatile organic compounds in the troposphere. Chem. Soc. Rev. 2008, 37, 699–716. [Google Scholar] [CrossRef]
- Li, J.; Sun, Y.; Cao, H.; Han, D.; He, M. Mechanisms and kinetics of the ozonolysis reaction of cis-3-hexenyl acetate and trans-2-hexenyl acetate in atmosphere: A theoretical study. Struct. Chem. 2014, 25, 71–83. [Google Scholar] [CrossRef]
- Li, J.J. Criegee mechanism of ozonolysis. In Name Reactions: A Collection of Detailed Mechanisms and Synthetic Applications; Springer: Berlin/Heidelberg, Germany, 2009; p. 161. [Google Scholar] [CrossRef]
- Jain, S.; Zahardis, J.; Petrucci, G.A. Soft Ionization Chemical Analysis of Secondary Organic Aerosol from Green Leaf Volatiles Emitted by Turf Grass. Environ. Sci. Technol. 2014, 48, 4835–4843. [Google Scholar] [CrossRef] [PubMed]
- Grosjean, D.; Grosjean, E. Carbonyl products of the ozone-unsaturated alcohol reaction. J. Geophys. Res. Atmos. 1995, 100, 22815–22820. [Google Scholar] [CrossRef]
- Grosjean, E.; Grosjean, D. The Gas Phase Reaction of Unsaturated Oxygenates with Ozone: Carbonyl Products and Comparison with the Alkene-Ozone Reaction. J. Atmos. Chem. 1997, 27, 271–289. [Google Scholar] [CrossRef]
- O’Dwyer, M.A.; Carey, T.J.; Healy, R.M.; Wenger, J.C.; Picquet-Varrault, B.; Doussin, J.F. The gas-phase ozonolysis of 1-penten-3-ol, (z)-2-penten-1-ol and 1-penten-3-one: Kinetics, products and secondary organic aerosol formation. Z. FPhys. Chem. 2010, 224, 1059–1080. [Google Scholar] [CrossRef]
- Uchida, R.; Sato, K.; Imamura, T. Gas-phase Ozone Reactions with Z-3-Hexenal and Z-3-Hexen-1-ol: Formation Yields of OH Radical, Propanal, and Ethane. Chem. Lett. 2015, 44, 457–458. [Google Scholar] [CrossRef]
- Grosjean, E.; Grosjean, D.; Seinfeld, J.H. Gas-phase reaction of ozone with trans-2-hexenal, trans-2-hexenyl acetate, ethylvinyl ketone, and 6-methyl-5-hepten-2-one. Int. J. Chem. Kinet. 1996, 28, 373–382. [Google Scholar] [CrossRef]
- Fantechi, G.; Jensen, N.R.; Saastad, O.; Hjorth, J.; Peeters, J. Reactions of Cl Atoms with Selected VOCs: Kinetics, Products and Mechanisms. J. Atmos. Chem. 1998, 31, 247–267. [Google Scholar] [CrossRef]
- Rodríguez, A.; Rodríguez, D.; Garzón, A.; Soto, A.; Aranda, A.; Notario, A. Kinetics and mechanism of the atmospheric reactions of atomic chlorine with 1-penten-3-ol and (Z)-2-penten-1-ol: An experimental and theoretical study. Phys. Chem. Chem. Phys. 2010, 12, 12245–12258. [Google Scholar] [CrossRef] [PubMed]
- Zhang, W.C.; Zhang, D.J. Theoretical investigation of the oxidation pathways of the Cl-initiated reaction of 2-methyl-3-buten-2-ol. Mol. Phys. 2012, 110, 2901–2917. [Google Scholar] [CrossRef]
- Takahashi, K.; Xing, J.H.; Hurley, M.D.; Wallington, T.J. Kinetics and Mechanism of Chlorine-Atom-Initiated Oxidation of Allyl Alcohol, 3-Buten-2-ol, and 2-Methyl-3-buten-2-ol. J. Phys. Chem. A 2010, 114, 4224–4231. [Google Scholar] [CrossRef]
- Shashikala, K.; Janardanan, D. Degradation mechanism of trans-2-hexenal in the atmosphere. Chem. Phys. Lett. 2020, 759. [Google Scholar] [CrossRef]
- Priya, A.M.; Senthilkumar, L. Degradation of methyl salicylate through Cl initiated atmospheric oxidation—A theoretical study. RSC Adv. 2014, 4, 23464–23475. [Google Scholar] [CrossRef]
- Lendar, M.; Aissat, A.; Cazaunau, M.; Daele, V.; Mellouki, A. Absolute and relative rate constants for the reactions of OH and Cl with pentanols. Chem. Phys. Lett. 2013, 582, 38–43. [Google Scholar] [CrossRef]
- Wallington, T.J.; Kurylo, M.J. The gas-phase reactions of hydroxyl radicals with a series of aliphatic-alcohols over the temperature-range 240-440-K. Int. J. Chem. Kinet. 1987, 19, 1015–1023. [Google Scholar] [CrossRef]
- Nelson, L.; Rattigan, O.; Neavyn, R.; Sidebottom, H.; Treacy, J.; Nielsen, O.J. Absolute and relative rate constants for the reactions of hydroxyl radicals and chlorine atoms with a series of aliphatic-alcohols and ethers at 298-K. Int. J. Chem. Kinet. 1990, 22, 1111–1126. [Google Scholar] [CrossRef]
- Wu, H.; Mu, Y.J.; Zhang, X.S.; Jiang, G.B. Relative rate constants for the reactions of hydroxyl radicals and chlorine atoms with a series of aliphatic alcohols. Int. J. Chem. Kinet. 2003, 35, 81–87. [Google Scholar] [CrossRef]
- Oh, S.; Andino, J.M. Kinetics of the gas-phase reactions of hydroxyl radicals with C-1-C-6 aliphatic alcohols in the presence of ammonium sulfate aerosols. Int. J. Chem. Kinet. 2001, 33, 422–430. [Google Scholar] [CrossRef]
- Grosjean, D.; Williams, E.L. Environmental persistence of organic compounds estimated from structure-reactivity and linear free-energy relationships. Unsaturated aliphatics. Atmos. Environment. Part A Gen. Top. 1992, 26, 1395–1405. [Google Scholar] [CrossRef]
- Aschmann, S.M.; Atkinson, R. Kinetics of the gas-phase reactions of the OH radical with selected glycol ethers, glycols, and alcohols. Int. J. Chem. Kinet. 1998, 30, 533–540. [Google Scholar] [CrossRef]
- Peirone, S.A.; Barrera, J.A.; Taccone, R.A.; Cometto, P.M.; Lane, S.I. Relative rate coefficient measurements of OH radical reactions with (Z)-2-hexen-1-ol and (E)-3-hexen-1-ol under simulated atmospheric conditions. Atmos. Environ. 2014, 85, 92–98. [Google Scholar] [CrossRef]
- D’Anna, B.; Andresen, Ø.; Gefen, Z.; Nielsen, C.J. Kinetic study of OH and NO3 radical reactions with 14 aliphatic aldehydes. Phys. Chem. Chem. Phys. 2001, 3, 3057–3063. [Google Scholar] [CrossRef]
- Papagni, C.; Arey, J.; Atkinson, R. Rate constants for the gas-phase reactions of a series of C3 C6 aldehydes with OH and NO3 radicals. Int. J. Chem. Kinet. 2000, 32, 79–84. [Google Scholar] [CrossRef]
- Plagens, H. Untersuchugen zum atmosphärenchemischen Abbau langkettiger Aldehyde. Ph.D. Thesis, Bergische Univerität, Wuppertal, Germany, 2001. [Google Scholar]
- Gao, T.T.; Andino, J.M.; Rivera, C.C.; Marquez, M.F. Rate Constants of the Gas-Phase Reactions of OH Radicals with trans-2-Hexenal, trans-2-Octenal, and trans-2-Nonenal. Int. J. Chem. Kinet. 2009, 41, 483–489. [Google Scholar] [CrossRef]
- Rodríguez, D.; Rodríguez, A.; Bravo, I.; Garzón, A.; Aranda, A.; Diaz-de-Mera, Y.; Notario, A. Kinetic study of the gas-phase reactions of hydroxyl radicals and chlorine atoms with cis-3-hexenylformate. Int. J. Environ. Sci. Technol. 2015, 12, 2881–2890. [Google Scholar] [CrossRef]
- Papagni, C.; Arey, J.; Atkinson, R. Rate constants for the gas-phase reactions of OH radicals with a series of unsaturated alcohols. Int. J. Chem. Kinet. 2001, 33, 142–147. [Google Scholar] [CrossRef]
- Fantechi, G.; Jensen, N.R.; Hjorth, J.; Peeters, J. Determination of the rate constants for the gas-phase reactions of methyl butenol with OH radicals, ozone, NO3 radicals, and Cl atoms. Int. J. Chem. Kinet. 1998, 30, 589–594. [Google Scholar] [CrossRef]
- Imamura, T.; Iida, Y.; Obi, K.; Nagatani, I.; Nakagawa, K.; Patroescu-Klotz, I.; Hatakeyama, S. Rate coefficients for the gas-phase reactions of OH radicals with methylbutenols at 298 K. Int. J. Chem. Kinet. 2004, 36, 379–385. [Google Scholar] [CrossRef]
- Baasandorj, M.; Stevens, P.S. Experimental and Theoretical Studies of the Kinetics of the Reactions of OH and OD with 2-Methyl-3-buten-2-ol between 300 and 415 K at Low Pressure. J. Phys. Chem. A 2007, 111, 640–649. [Google Scholar] [CrossRef] [PubMed]
- Ren, Y.G.; McGillen, M.R.; Daele, V.; Casas, J.; Mellouk, A. The fate of methyl salicylate in the environment and its role as signal in multitrophic interactions. Sci. Total Environ. 2020, 749. [Google Scholar] [CrossRef]
- Davis, M.E.; Burkholder, J.B. Rate coefficients for the gas-phase reaction of OH with (Z)-3-hexen-1-ol, 1-penten-3-ol, (E)-2-penten-1-ol, and (E)-2-hexen-1-ol between 243 and 404 K. Atmos. Chem. Phys. 2011, 11, 3347–3358. [Google Scholar] [CrossRef]
- Atkinson, R. A structure-activity relationship for the estimation of rate constants for the gas-phase reactions of OH radicals with organic compounds. Int. J. Chem. Kinet. 1987, 19, 799–828. [Google Scholar] [CrossRef]
- Zhao, Z.J.; Husainy, S.; Smith, G.D. Kinetics studies of the gas-phase reactions of NO3 radicals with series of 1-alkenes, dienes, cycloalkenes, alkenols, and alkenals. J. Phys. Chem. A 2011, 115, 12161–12172. [Google Scholar] [CrossRef] [PubMed]
- Pfrang, C.; Martin, R.; Canosa-Mas, C.; Wayne, R. Gas-phase reactions of NO3 and N2O5 with (Z)-hex-4-en-1-ol, (Z)-hex-3-en-1-ol (’leaf alcohol’), (E)-hex-3-en-1-ol, (Z)-hex-2-en-1-ol and (E)-hex-2-en-1-ol. Phys. Chem. Chem. Phys. 2006, 8, 354–363. [Google Scholar] [CrossRef]
- D’Anna, B.; Nielsen, J.C. Kinetic study of the vapour-phase reaction between aliphatic aldehydes and the nitrate radical. J. Chem. Soc. Faraday Trans. 1997, 93, 3479–3483. [Google Scholar] [CrossRef]
- Noda, J.; Holm, C.; Nyman, G.; Langer, S.; Ljungstrom, E. Kinetics of the gas-phase reaction of n-C-6-C-10 aldehydes with the nitrate radical. Int. J. Chem. Kinet. 2003, 35, 120–129. [Google Scholar] [CrossRef]
- Hallquist, M.; Langer, S.; Ljungström, E.; Wängberg, I. Rates of reaction between the nitrate radical and some unsaturated alcohols. Int. J. Chem. Kinet. 1996, 28, 467–474. [Google Scholar] [CrossRef]
- Cabañas, B.; Salgado, S.; Martín, P.; Baeza, M.T.; Martínez, E. Night-time Atmospheric Loss Process for Unsaturated Aldehydes: Reaction with NO3 Radicals. J. Phys. Chem. A 2001, 105, 4440–4445. [Google Scholar] [CrossRef]
- Rudich, Y.; Talukdar, R.K.; Fox, R.W.; Ravishankara, A.R. Rate Coefficients for Reactions of NO3 with a Few Olefins and Oxygenated Olefins. J. Phys. Chem. 1996, 100, 5374–5381. [Google Scholar] [CrossRef]
- Grosjean, E.; Grosjean, D. Rate constants for the gas-phase reactions of ozone with unsaturated aliphatic-alcohols. Int. J. Chem. Kinet. 1994, 26, 1185–1191. [Google Scholar] [CrossRef]
- Lin, X.; Ma, Q.; Yang, C.; Tang, X.; Zhao, W.; Hu, C.; Gu, X.; Fang, B.; Gai, Y.; Zhang, W. Kinetics and mechanisms of gas phase reactions of hexenols with ozone. RSC Adv. 2016, 6, 83573–83580. [Google Scholar] [CrossRef]
- Gibilisco, R.G.; Bejan, I.; Barnes, I.; Wiesen, P.; Teruel, M.A. FTIR gas kinetic study of the reactions of ozone with a series of hexenols at atmospheric pressure and 298K. Chem. Phys. Lett. 2015, 618, 114–118. [Google Scholar] [CrossRef]
- Grosjean, D.; Grosjean, E.; Williams II, E.L. Rate constants for the gas-phase reactions of ozone with unsaturated alcohols, esters, and carbonyls. Int. J. Chem. Kinet. 1993, 25, 783–794. [Google Scholar] [CrossRef]
- Zhang, Q.; Lin, X.; Gai, Y.; Ma, Q.; Zhao, W.; Fang, B.; Long, B.; Zhang, W. Kinetic and mechanistic study on gas phase reactions of ozone with a series of cis-3-hexenyl esters. RSC Adv. 2018, 8, 4230–4238. [Google Scholar] [CrossRef]
- Klawatsch-Carrasco, N.; Doussin, J.F.; Carlier, P. Absolute rate constants for the gas-phase ozonolysis of isoprene and methylbutenol. Int. J. Chem. Kinet. 2004, 36, 152–156. [Google Scholar] [CrossRef]
- Kalalian, C.; El Dib, G.; Singh, H.J.; Rao, P.K.; Roth, E.; Chakir, A. Temperature dependent kinetic study of the gas phase reaction of ozone with 1-penten-3-ol, cis-2-penten-1-ol and trans-3-hexen-1-ol: Experimental and theoretical data. Atmos. Environ. 2020, 223, 117306. [Google Scholar] [CrossRef]
- Kalalian, C.; Roth, E.; Chakir, A. Rate Coefficients for the Gas-Phase Reaction of Ozone with C5 and C6 Unsaturated Aldehydes. Int. J. Chem. Kinet. 2018, 50, 47–56. [Google Scholar] [CrossRef]
- Grira, A.; Amarandei, C.; Romanias, M.N.; El Dib, G.; Canosa, A.; Arsene, C.; Bejan, I.G.; Olariu, R.I.; Coddeville, P.; Tomas, A. Kinetic Measurements of Cl Atom Reactions with C5–C8 Unsaturated Alcohols. Atmosphere 2020, 11, 256. [Google Scholar] [CrossRef]
- Rodriguez, D.; Rodriguez, A.; Notario, A.; Aranda, A.; Diaz-de-Mera, Y.; Martinez, E. Kinetic study of the gas-phase reaction of atomic chlorine with a series of aldehydes. Atmos. Chem. Phys. 2005, 5, 3433–3440. [Google Scholar] [CrossRef]
- Teruel, M.A.; Achad, M.; Blanco, M.B. Kinetic study of the reactions of Cl atoms with alpha, beta-unsaturated carbonyl compounds at atmospheric pressure and structure activity relations (SARs). Chem. Phys. Lett. 2009, 479, 25–29. [Google Scholar] [CrossRef]
- Kaiser, E.W.; Wallington, T.J.; Hurley, M.D. Products and Mechanism of the Reaction of Chlorine Atoms with 3-Pentanone in 700-950 Torr of N-2/O-2 Diluent at 297-515 K. J. Phys. Chem. A 2010, 114, 343–354. [Google Scholar] [CrossRef]
- Gibilisco, R.G.; Bejan, I.; Barnes, I.; Wiesen, P.; Teruel, M.A. Rate coefficients at 298 K and 1 atm for the tropospheric degradation of a series of C6, C7 and C8 biogenic unsaturated alcohols initiated by Cl atoms. Atmos. Environ. 2014, 94, 564–572. [Google Scholar] [CrossRef]
- Cuevas, C.A.; Notario, A.; Martinez, E.; Albaladejo, J. Temperature-dependence study of the gas-phase reactions of atmospheric Cl atoms with a series of aliphatic aldehydes. Atmos. Environ. 2006, 40, 3845–3854. [Google Scholar] [CrossRef]
- Rodríguez, A.; Rodríguez, D.; Soto, A.; Notario, A.; Aranda, A.; Díaz-de-Mera, Y.; Bravo, I. Relative rate measurements of reactions of unsaturated alcohols with atomic chlorine as a function of temperature. Atmos. Environ. 2007, 41, 4693–4702. [Google Scholar] [CrossRef]
- NCAR. Tropospheric Ultra Visible Model. Available online: https://www2.acom.ucar.edu/modeling/tropospheric-ultraviolet-and-visible-tuv-radiation-model (accessed on 8 August 2021).
- Kwok, E.S.C.; Atkinson, R. Estimation of hydroxyl radical reaction rate constants for gas-phase organic compounds using a structure-reactivity relationship: An update. Atmos. Environ. 1995, 29, 1685–1695. [Google Scholar] [CrossRef]
- Peeters, J.; Boullart, W.; Pultau, V.; Vandenberk, S.; Vereecken, L. Structure−Activity Relationship for the Addition of OH to (Poly)alkenes: Site-Specific and Total Rate Constants. J. Phys. Chem. A 2007, 111, 1618–1631. [Google Scholar] [CrossRef] [PubMed]
- King, M.D.; Canosa-Mas, C.E.; Wayne, R.P. A structure–activity relationship (SAR) for predicting rate constants for the reaction of NO3, OH and O3 with monoalkenes and conjugated dienes. Phys. Chem. Chem. Phys. 1999, 1, 2239–2246. [Google Scholar] [CrossRef]
- Pfrang, C.; King, M.D.; Canosa-Mas, C.E.; Wayne, R.P. Structure–activity relations (SARs) for gas-phase reactions of NO3, OH and O3 with alkenes: An update. Atmos. Environ. 2006, 40, 1180–1186. [Google Scholar] [CrossRef]
- Pfrang, C.; King, M.D.; Canosa-Mas, C.E.; Wayne, R.P. Correlations for gas-phase reactions of NO3, OH and O3 with alkenes: An update. Atmos. Environ. 2006, 40, 1170–1179. [Google Scholar] [CrossRef]
- Pfrang, C.; King, M.D.; Braeckevelt, M.; Canosa-Mas, C.E.; Wayne, R.P. Gas-phase rate coefficients for reactions of NO3, OH, O3 and O(3P) with unsaturated alcohols and ethers: Correlations and structure–activity relations (SARs). Atmos. Environ. 2008, 42, 3018–3034. [Google Scholar] [CrossRef]
- Kerdouci, J.; Picquet-Varrault, B.; Doussin, J.-F. Prediction of Rate Constants for Gas-Phase Reactions of Nitrate Radical with Organic Compounds: A New Structure–Activity Relationship. Chem. Phys. Chem. 2010, 11, 3909–3920. [Google Scholar] [CrossRef]
- Ezell, M.J.; Wang, W.; Ezell, A.A.; Soskin, G.; Finlayson-Pitts, B.J. Kinetics of reactions of chlorine atoms with a series of alkenes at 1 atm and 298 K: Structure and reactivity. Phys. Chem. Chem. Phys. 2002, 4, 5813–5820. [Google Scholar] [CrossRef]
- McGillen, M.R.; Archibald, A.T.; Carey, T.; Leather, K.E.; Shallcross, D.E.; Wenger, J.C.; Percival, C.J. Structure–activity relationship (SAR) for the prediction of gas-phase ozonolysis rate coefficients: An extension towards heteroatomic unsaturated species. Phys. Chem. Chem. Phys. 2011, 13, 2842–2849. [Google Scholar] [CrossRef] [PubMed]
- Doussin, J.F.; Monod, A. Structure–activity relationship for the estimation of OH-oxidation rate constants of carbonyl compounds in the aqueous phase. Atmos. Chem. Phys. 2013, 13, 11625–11641. [Google Scholar] [CrossRef]
- Monod, A.; Doussin, J.F. Structure-activity relationship for the estimation of OH-oxidation rate constants of aliphatic organic compounds in the aqueous phase: Alkanes, alcohols, organic acids and bases. Atmos. Environ. 2008, 42, 7611–7622. [Google Scholar] [CrossRef]
- Monod, A.; Poulain, L.; Grubert, S.; Voisin, D.; Wortham, H. Kinetics of OH-initiated oxidation of oxygenated organic compounds in the aqueous phase: New rate constants, structure–activity relationships and atmospheric implications. Atmos. Environ. 2005, 39, 7667–7688. [Google Scholar] [CrossRef]
- Richards-Henderson, N.K.; Pham, A.T.; Kirk, B.B.; Anastasio, C. Secondary organic aerosol from aqueous reactions of green leaf volatiles with organic triplet excited states and singlet molecular oxygen. Environ. Sci. Technol. 2015, 49, 268–276. [Google Scholar] [CrossRef] [PubMed]
- Mael, L.E.; Jacobs, M.I.; Elrod, M.J. Organosulfate and Nitrate Formation and Reactivity from Epoxides Derived from 2-Methyl-3-buten-2-ol. J. Phys. Chem. A 2015, 119, 4464–4472. [Google Scholar] [CrossRef]
- Liu, Z.; Ge, M.; Wang, W.; Yin, S.; Tong, S. The uptake of 2-methyl-3-buten-2-ol into aqueous mixed solutions of sulfuric acid and hydrogen peroxide. Phys. Chem. Chem. Phys. 2011, 13, 2069–2075. [Google Scholar] [CrossRef]
- Ren, H.; Sedlak, J.A.; Elrod, M.J. General Mechanism for Sulfate Radical Addition to Olefinic Volatile Organic Compounds in Secondary Organic Aerosol. Environ. Sci. Technol. 2021, 55, 1456–1465. [Google Scholar] [CrossRef]
- Liyana-Arachchi, T.P.; Stevens, C.; Hansel, A.K.; Ehrenhauser, F.S.; Valsaraj, K.T.; Hung, F.R. Molecular simulations of green leaf volatiles and atmospheric oxidants on air/water interfaces. Phys. Chem. Chem. Phys. 2013, 15, 3583–3592. [Google Scholar] [CrossRef] [PubMed]
- Heath, A.; Valsaraj, K.T. An experimental study of the atmospheric oxidation of a biogenic organic compound (methyl jasmonate) in a thin water film as in fog or aerosols. Open J. Air Pollut. 2017, 6, 44–51. [Google Scholar] [CrossRef][Green Version]
- Hansel, A.K. Reaction of Green Leaf Volatiles as a Source of Secondary Organic Aerosols in Fog Droplets. Master’s Thesis, Louisiana State University, Baton Rouge, LA, USA, 2013. [Google Scholar]
- Hamilton, J.F.; Lewis, A.C.; Carey, T.J.; Wenger, J.C. Characterization of polar compounds and oligomers in secondary organic aerosol using liquid chromatography coupled to mass spectrometry. Anal. Chem. 2008, 80, 474–480. [Google Scholar] [CrossRef]
- Jaoui, M.; Kleindienst, T.E.; Offenberg, J.H.; Lewandowski, M.; Lonneman, W.A. SOA formation from the atmospheric oxidation of 2-methyl-3-buten-2-ol and its implications for PM2.5. Atmos. Chem. Phys. 2012, 12, 2173–2188. [Google Scholar] [CrossRef]
- Novelli, A.; Kaminski, M.; Rolletter, M.; Acir, I.H.; Bohn, B.; Dorn, H.P.; Li, X.; Lutz, A.; Nehr, S.; Rohrer, F.; et al. Evaluation of OH and HO2 concentrations and their budgets during photooxidation of 2-methyl-3-butene-2-ol (MBO) in the atmospheric simulation chamber SAPHIR. Atmos. Chem. Phys. 2018, 18, 11409–11422. [Google Scholar] [CrossRef]
- Lewandowski, M.; Piletic, I.R.; Kleindienst, T.E.; Offenberg, J.H.; Beaver, M.R.; Jaoui, M.; Docherty, K.S.; Edney, E.O. Secondary organic aerosol characterisation at field sites across the United States during the spring–summer period. Int. J. Environ. Anal. Chem. 2013, 93, 1084–1103. [Google Scholar] [CrossRef]
- Edney, E.O.; Kleindienst, T.E.; Conver, T.S.; McIver, C.D.; Corse, E.W.; Weathers, W.S. Polar organic oxygenates in PM2.5 at a southeastern site in the United States. Atmos. Environ. 2003, 37, 3947–3965. [Google Scholar] [CrossRef]
- Hettiyadura, A.P.S.; Al-Naiema, I.M.; Hughes, D.D.; Fang, T.; Stone, E.A. Organosulfates in Atlanta, Georgia: Anthropogenic influences on biogenic secondary organic aerosol formation. Atmos. Chem. Phys. 2019, 19, 3191–3206. [Google Scholar] [CrossRef]
- Hansen, A.M.K.; Kristensen, K.; Nguyen, Q.T.; Zare, A.; Cozzi, F.; Nøjgaard, J.K.; Skov, H.; Brandt, J.; Christensen, J.H.; Ström, J.; et al. Organosulfates and organic acids in Arctic aerosols: Speciation, annual variation and concentration levels. Atmos. Chem. Phys. 2014, 14, 7807–7823. [Google Scholar] [CrossRef]
- Barbosa, T.S.; Riva, M.; Chen, Y.Z.; da Silva, C.M.; Ameida, J.C.S.; Zhang, Z.; Gold, A.; Arbilla, G.; Bauerfeldt, G.F.; Surratt, J.D. Chemical characterization of organosulfates from the hydroxyl radical-initiated oxidation and ozonolysis of cis-3-hexen-1-ol. Atmos. Environ. 2017, 162, 141–151. [Google Scholar] [CrossRef]
- Nguyen, Q.T.; Christensen, M.K.; Cozzi, F.; Zare, A.; Hansen, A.M.K.; Kristensen, K.; Tulinius, T.E.; Madsen, H.H.; Christensen, J.H.; Brandt, J.; et al. Understanding the anthropogenic influence on formation of biogenic secondary organic aerosols in Denmark via analysis of organosulfates and related oxidation products. Atmos. Chem. Phys. 2014, 14, 8961–8981. [Google Scholar] [CrossRef]
- Kristensen, K.; Bilde, M.; Aalto, P.P.; Petaja, T.; Glasius, M. Denuder/filter sampling of organic acids and organosulfates at urban and boreal forest sites: Gas/particle distribution and possible sampling artifacts. Atmos. Environ. 2016, 130, 36–53. [Google Scholar] [CrossRef]
- Hettiyadura, A.P.S.; Stone, E.A.; Kundu, S.; Baker, Z.; Geddes, E.; Richards, K.; Humphry, T. Determination of atmospheric organosulfates using HILIC chromatography with MS detection. Atmos. Meas. Tech. 2015, 8, 2347–2358. [Google Scholar] [CrossRef]
- Hettiyadura, A.P.S.; Jayarathne, T.; Baumann, K.; Goldstein, A.H.; de Gouw, J.A.; Koss, A.; Keutsch, F.N.; Skog, K.; Stone, E.A. Qualitative and quantitative analysis of atmospheric organosulfates in Centreville, Alabama. Atmos. Chem. Phys. 2017, 17, 1343–1359. [Google Scholar] [CrossRef]
- Wang, Y.; Hu, M.; Guo, S.; Wang, Y.; Zheng, J.; Yang, Y.; Zhu, W.; Tang, R.; Li, X.; Liu, Y.; et al. The secondary formation of organosulfates under interactions between biogenic emissions and anthropogenic pollutants in summer in Beijing. Atmos. Chem. Phys. 2018, 18, 10693–10713. [Google Scholar] [CrossRef]
- Huang, R.J.; Cao, J.; Chen, Y.; Yang, L.; Shen, J.; You, Q.; Wang, K.; Lin, C.; Xu, W.; Gao, B.; et al. Organosulfates in atmospheric aerosol: Synthesis and quantitative analysis of PM2.5 from Xi’an, northwestern China. Atmos. Meas. Tech. 2018, 11, 3447–3456. [Google Scholar] [CrossRef]
- Le Breton, M.; Wang, Y.; Hallquist, Å.M.; Pathak, R.K.; Zheng, J.; Yang, Y.; Shang, D.; Glasius, M.; Bannan, T.J.; Liu, Q.; et al. Online gas- and particle-phase measurements of organosulfates, organosulfonates and nitrooxy organosulfates in Beijing utilizing a FIGAERO ToF-CIMS. Atmos. Chem. Phys. 2018, 18, 10355–10371. [Google Scholar] [CrossRef]
- Olson, C.N.; Galloway, M.M.; Yu, G.; Hedman, C.J.; Lockett, M.R.; Yoon, T.; Stone, E.A.; Smith, L.M.; Keutsch, F.N. Hydroxycarboxylic Acid-Derived Organosulfates: Synthesis, Stability, and Quantification in Ambient Aerosol. Environ. Sci. Technol. 2011, 45, 6468–6474. [Google Scholar] [CrossRef]
- Hughes, D.D.; Christiansen, M.B.; Milani, A.; Vermeuel, M.P.; Novak, G.A.; Alwe, H.D.; Dickens, A.F.; Pierce, R.B.; Millet, D.B.; Bertram, T.H.; et al. PM2.5 chemistry, organosulfates, and secondary organic aerosol during the 2017 Lake Michigan Ozone Study. Atmos. Environ. 2021, 244, 117939. [Google Scholar] [CrossRef]
- Shalamzari, M.S.; Vermeylen, R.; Blockhuys, F.; Kleindienst, T.E.; Lewandowski, M.; Szmigielski, R.; Rudzinski, K.J.; Spólnik, G.; Danikiewicz, W.; Maenhaut, W.; et al. Characterization of polar organosulfates in secondary organic aerosol from the unsaturated aldehydes 2-E-pentenal, 2-E-hexenal, and 3-Z-hexenal. Atmos. Chem. Phys. 2016, 16, 7135–7148. [Google Scholar] [CrossRef]
- Safi Shalamzari, M.; Ryabtsova, O.; Kahnt, A.; Vermeylen, R.; Hérent, M.-F.; Quetin-Leclercq, J.; Van der Veken, P.; Maenhaut, W.; Claeys, M. Mass spectrometric characterization of organosulfates related to secondary organic aerosol from isoprene. Rapid Commun. Mass Spectrom. 2013, 27, 784–794. [Google Scholar] [CrossRef] [PubMed]
- Brüggemann, M.; Xu, R.; Tilgner, A.; Kwong, K.C.; Mutzel, A.; Poon, H.Y.; Otto, T.; Schaefer, T.; Poulain, L.; Chan, M.N.; et al. Organosulfates in Ambient Aerosol: State of Knowledge and Future Research Directions on Formation, Abundance, Fate, and Importance. Environ. Sci. Technol. 2020, 54, 3767–3782. [Google Scholar] [CrossRef]
- Tolocka, M.P.; Turpin, B. Contribution of Organosulfur Compounds to Organic Aerosol Mass. Environ. Sci. Technol. 2012, 46, 7978–7983. [Google Scholar] [CrossRef] [PubMed]
- Zhang, H.; Worton, D.R.; Lewandowski, M.; Ortega, J.; Rubitschun, C.L.; Park, J.-H.; Kristensen, K.; Campuzano-Jost, P.; Day, D.A.; Jimenez, J.L.; et al. Organosulfates as Tracers for Secondary Organic Aerosol (SOA) Formation from 2-Methyl-3-Buten-2-ol (MBO) in the Atmosphere. Environ. Sci. Technol. 2012, 46, 9437–9446. [Google Scholar] [CrossRef] [PubMed]
- Shalamzari, M.S.; Kahnt, A.; Vermeylen, R.; Kleindienst, T.E.; Lewandowski, M.; Cuyckens, F.; Maenhaut, W.; Claeys, M. Characterization of polar organosulfates in secondary organic aerosol from the green leaf volatile 3-z-hexenal. Environ. Sci. Technol. 2014, 48, 12671–12678. [Google Scholar] [CrossRef]
- Faiola, C.L.; Pullinen, I.; Buchholz, A.; Khalaj, F.; Ylisirniö, A.; Kari, E.; Miettinen, P.; Holopainen, J.K.; Kivimäenpää, M.; Schobesberger, S.; et al. Secondary Organic Aerosol Formation from Healthy and Aphid-Stressed Scots Pine Emissions. ACS Earth Space Chem. 2019, 3, 1756–1772. [Google Scholar] [CrossRef] [PubMed]
- Waza, A.A. Effect of Green Leaf Volatiles (GLVS) on Secondary Organic Aerosol Formation; University of Eastern Finland: Joensuu, Finland, 2014. [Google Scholar]
- Joutsensaari, J.; Loivamäki, M.; Vuorinen, T.; Miettinen, P.; Nerg, A.M.; Holopainen, J.K.; Laaksonen, A. Nanoparticle formation by ozonolysis of inducible plant volatiles. Atmos. Chem. Phys. 2005, 5, 1489–1495. [Google Scholar] [CrossRef]
- Zhang, H.; Zhang, Z.; Cui, T.; Lin, Y.-H.; Bhathela, N.A.; Ortega, J.; Worton, D.R.; Goldstein, A.H.; Guenther, A.; Jimenez, J.L.; et al. Secondary Organic Aerosol Formation via 2-Methyl-3-buten-2-ol Photooxidation: Evidence of Acid-Catalyzed Reactive Uptake of Epoxides. Environ. Sci. Technol. Lett. 2014, 1, 242–247. [Google Scholar] [CrossRef] [PubMed]
- Knap, H.C.; Schmidt, J.A.; Jørgensen, S. Hydrogen shift reactions in four methyl-buten-ol (MBO) peroxy radicals and their impact on the atmosphere. Atmos. Environ. 2016, 147, 79–87. [Google Scholar] [CrossRef]
- Gomez-Gonzalez, Y.; Surratt, J.D.; Cuyckens, F.; Szmigielski, R.; Vermeylen, R.; Jaoui, M.; Lewandowski, M.; Offenberg, J.H.; Kleindienst, T.E.; Edney, E.O.; et al. Characterization of organosulfates from the photooxidation of isoprene and unsaturated fatty acids in ambient aerosol using liquid chromatography/(-) electrospray ionization mass spectrometry. J. Mass Spectrom. 2008, 43, 371–382. [Google Scholar] [CrossRef]
- Rudziński, K.J.; Gmachowski, L.; Kuznietsova, I. Reactions of isoprene and sulphoxy radical-anions–A possible source of atmospheric organosulphites and organosulphates. Atmos. Chem. Phys. 2009, 9, 2129–2140. [Google Scholar] [CrossRef]
- Wach, P.; Spolnik, G.; Surratt, J.D.; Blaziak, K.; Rudzinski, K.J.; Lin, Y.H.; Maenhaut, W.; Danikiewicz, W.; Claeys, M.; Szmigielski, R. Structural Characterization of Lactone-Containing MW 212 Organosulfates Originating from Isoprene Oxidation in Ambient Fine Aerosol. Environ. Sci. Technol. 2020, 54, 1415–1424. [Google Scholar] [CrossRef]
- Wach, P.; Spólnik, G.; Rudziński, K.J.; Skotak, K.; Claeys, M.; Danikiewicz, W.; Szmigielski, R. Radical oxidation of methyl vinyl ketone and methacrolein in aqueous droplets: Characterization of organosulfates and atmospheric implications. Chemosphere 2019, 214, 1–9. [Google Scholar] [CrossRef]
- Rudzinski, K. Heterogeneous and aqueous-phase transformations of isoprene. In Environmental Simulation Chambers: Application to Atmospheric Chemical Processes; Barnes, I., Rudzinski, K., Eds.; Springer: Berlin/Heidelberg, Germany, 2006; Volume 62, pp. 261–277. [Google Scholar]
- Went, F.W. Blue Hazes in the Atmosphere. Nature 1960, 187, 641–643. [Google Scholar] [CrossRef]
- Herrmann, H.; Hoffmann, D.; Schaefer, T.; Bräuer, P.; Tilgner, A. Tropospheric aqueous-phase free-radical chemistry: Radical sources, spectra, reaction kinetics and prediction tools. Chem. Phys. Chem. 2010, 11, 3796–3822. [Google Scholar] [CrossRef] [PubMed]
- White, R.P.; Murray, S.; Rohweder, M. Grassland Ecosystems; World Research Institute: Washington, DC, USA, 2000. [Google Scholar]
- Kang, S.; Nair, S.S.; Kline, K.L.; Nichols, J.A.; Wang, D.; Post, W.M.; Brandt, C.C.; Wullschleger, S.D.; Singh, N.; Wei, Y. Global simulation of bioenergy crop productivity: Analytical framework and case study for switchgrass. GCB Bioenergy 2014, 6, 14–25. [Google Scholar] [CrossRef]
- Fan, P.; Hao, M.; Ding, F.; Jiang, D.; Dong, D. Quantifying Global Potential Marginal Land Resources for Switchgrass. Energies 2020, 13, 6197. [Google Scholar] [CrossRef]


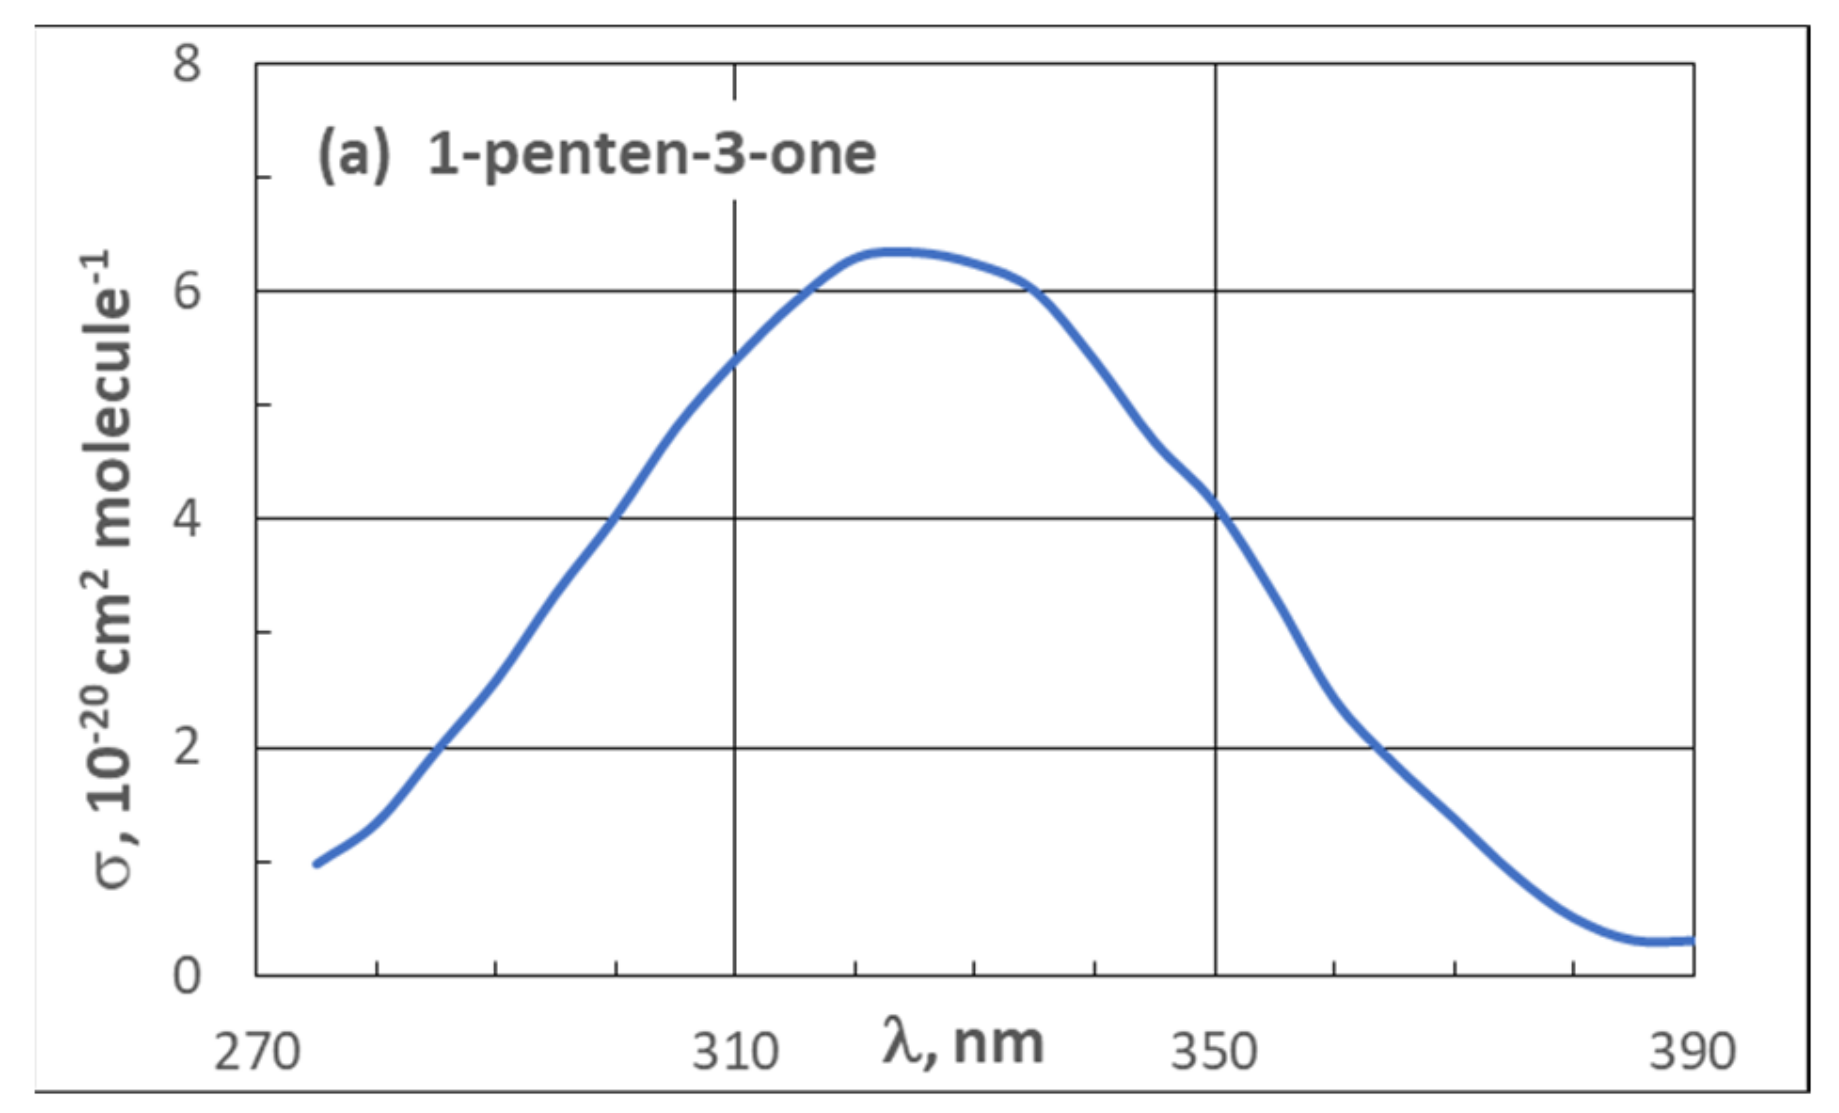
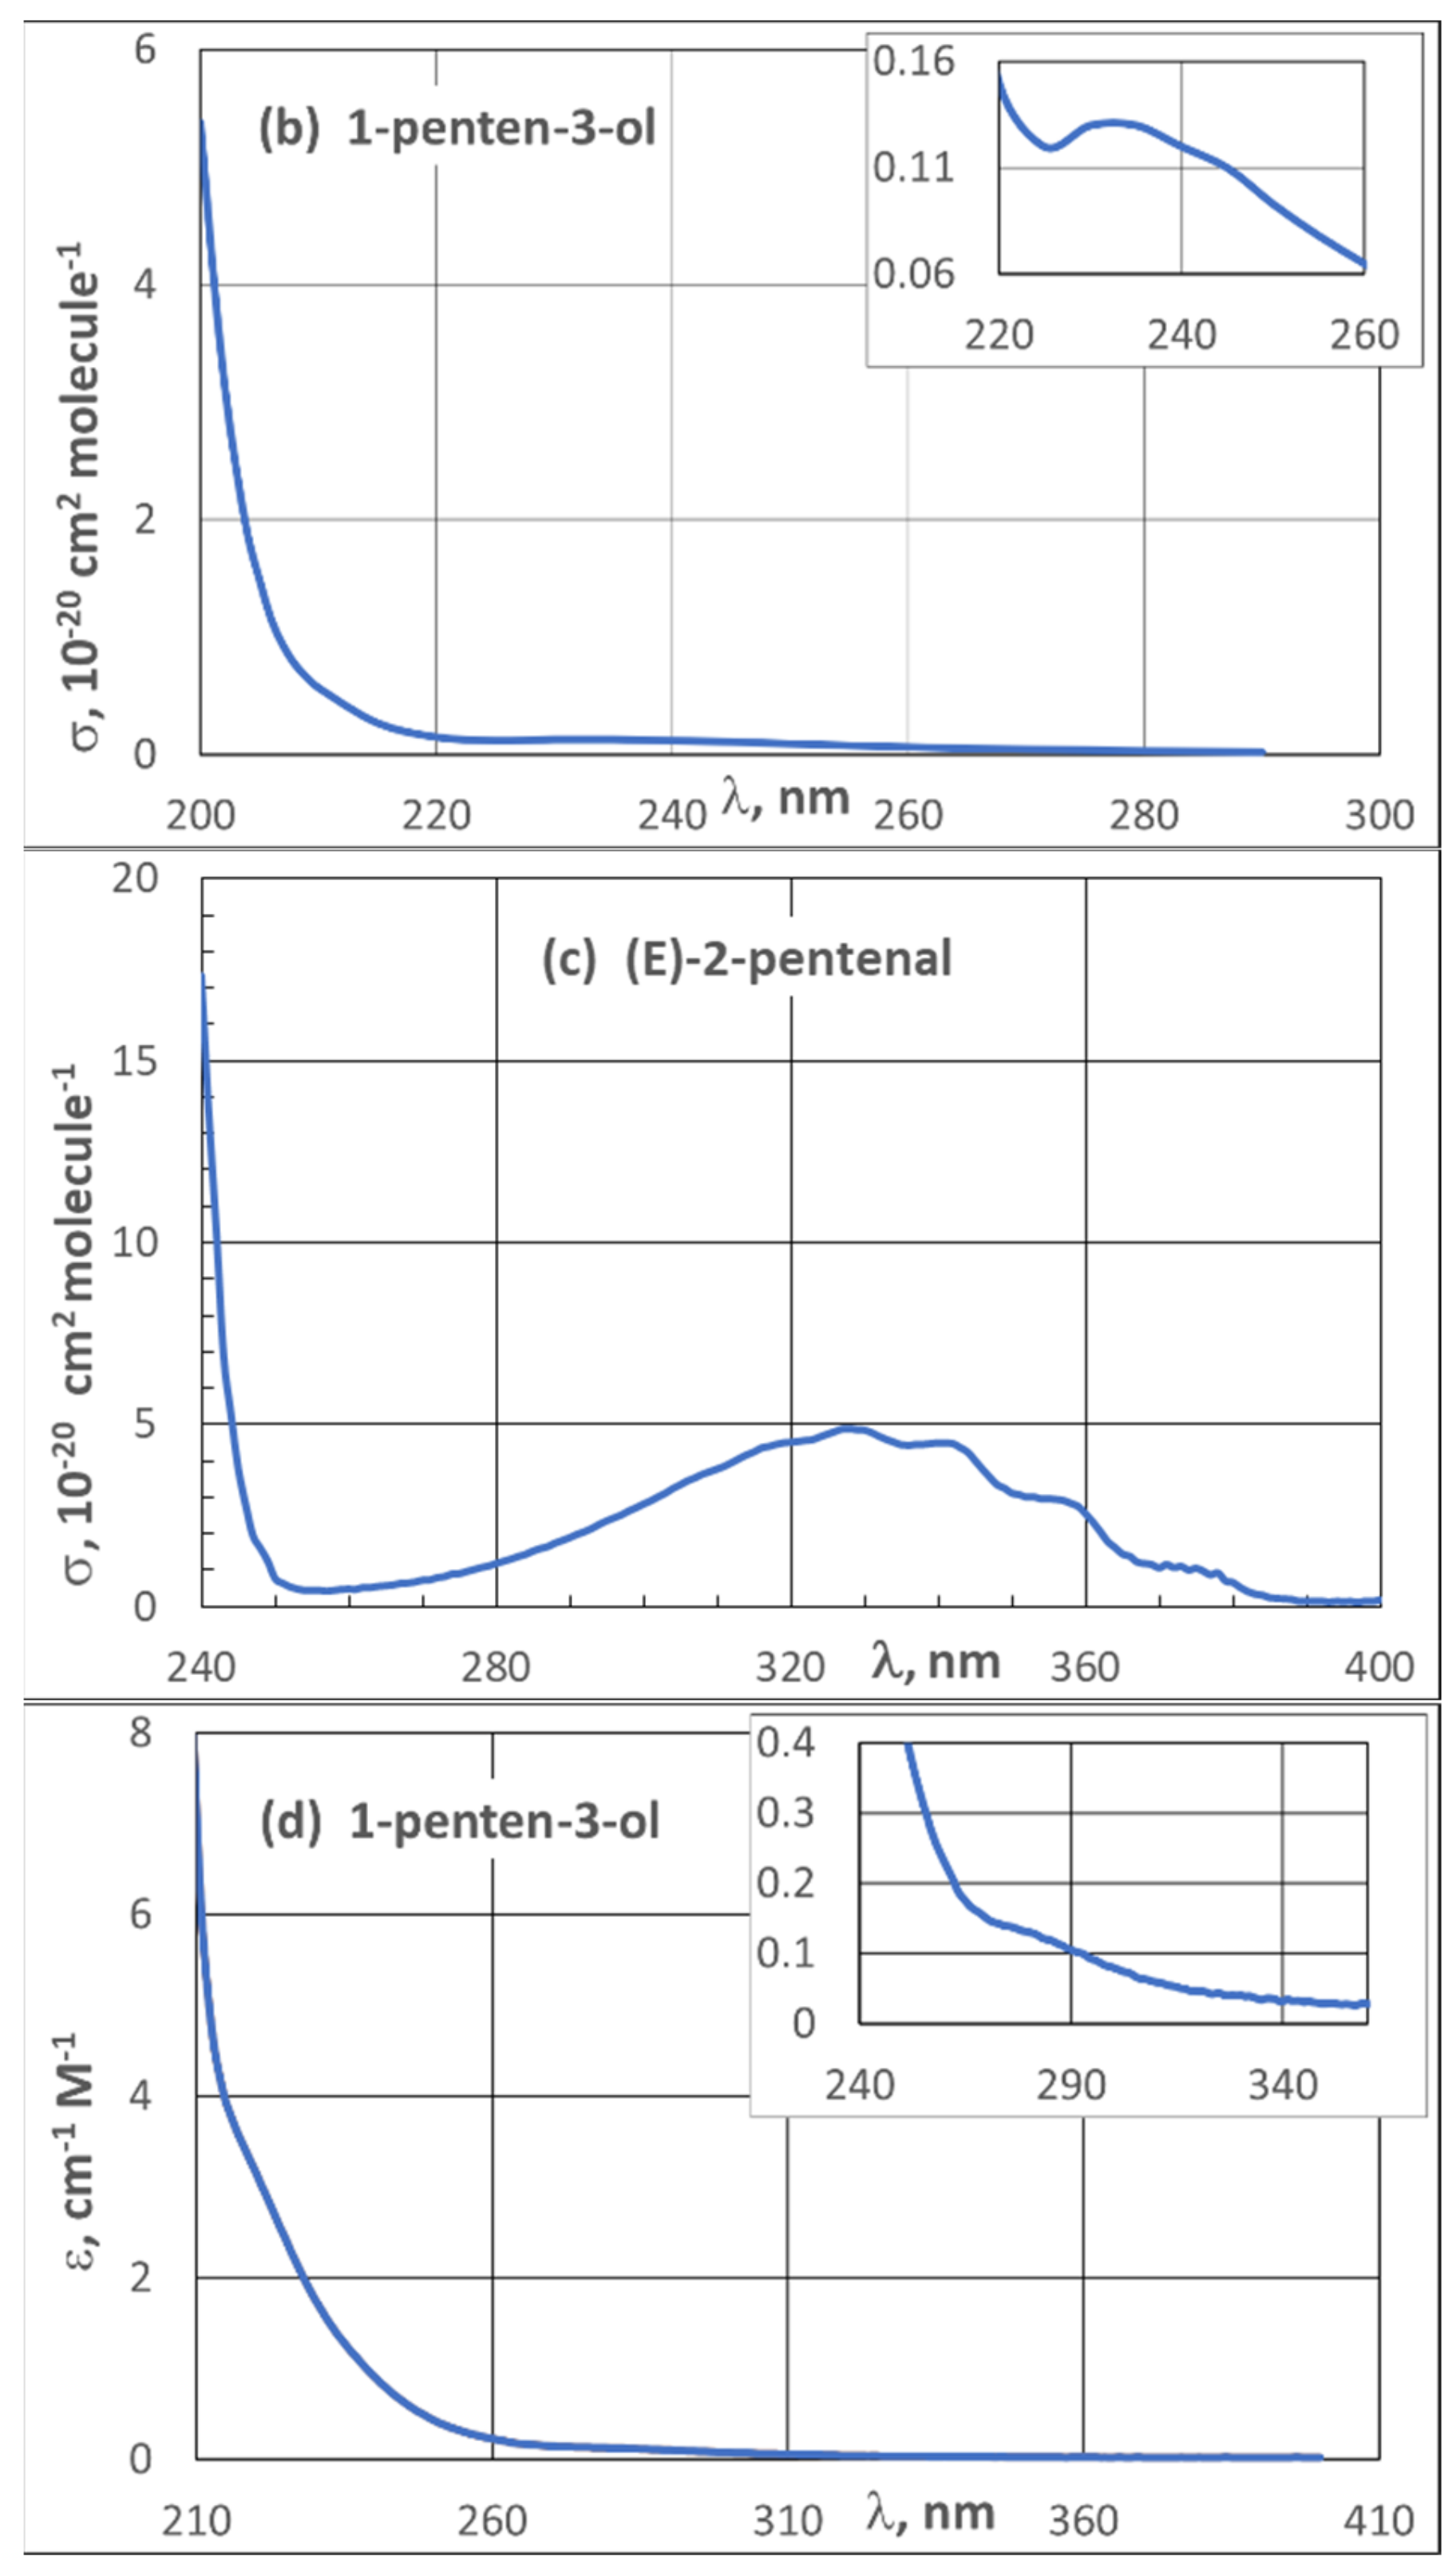
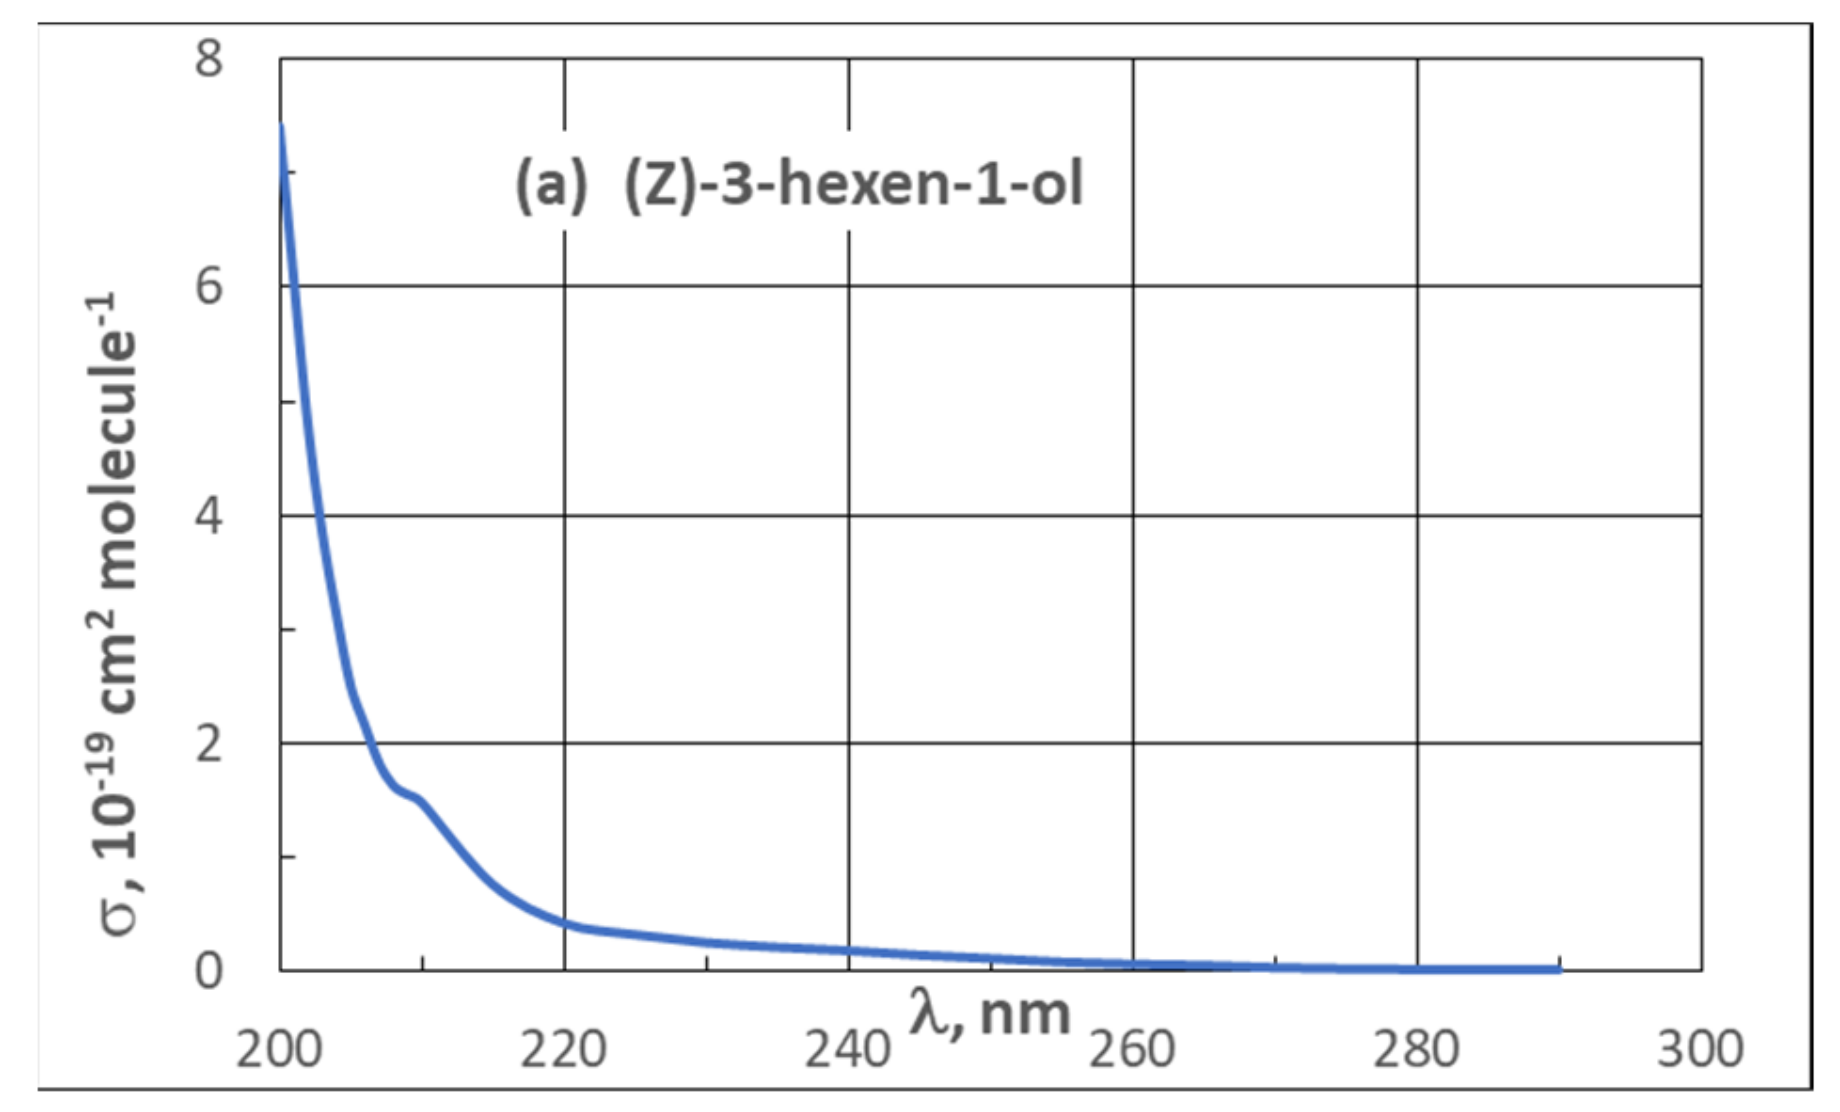
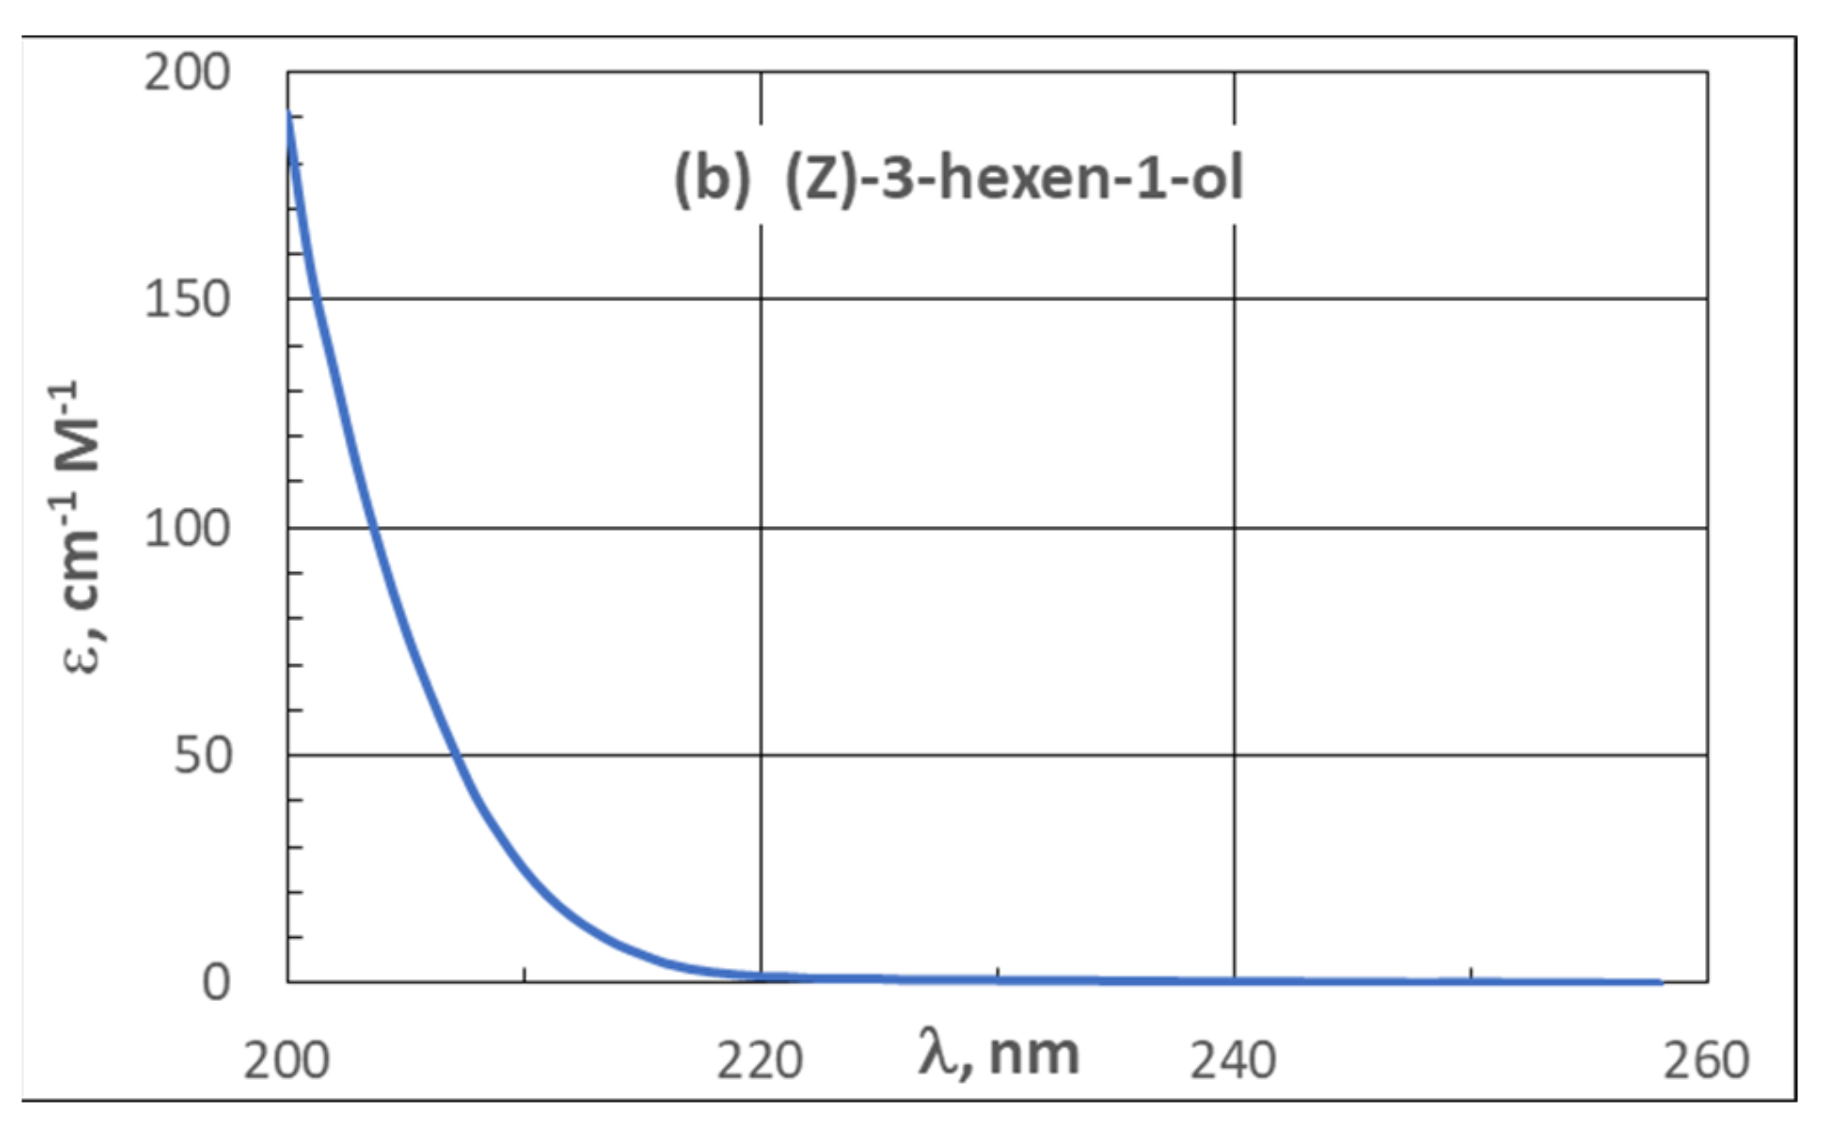
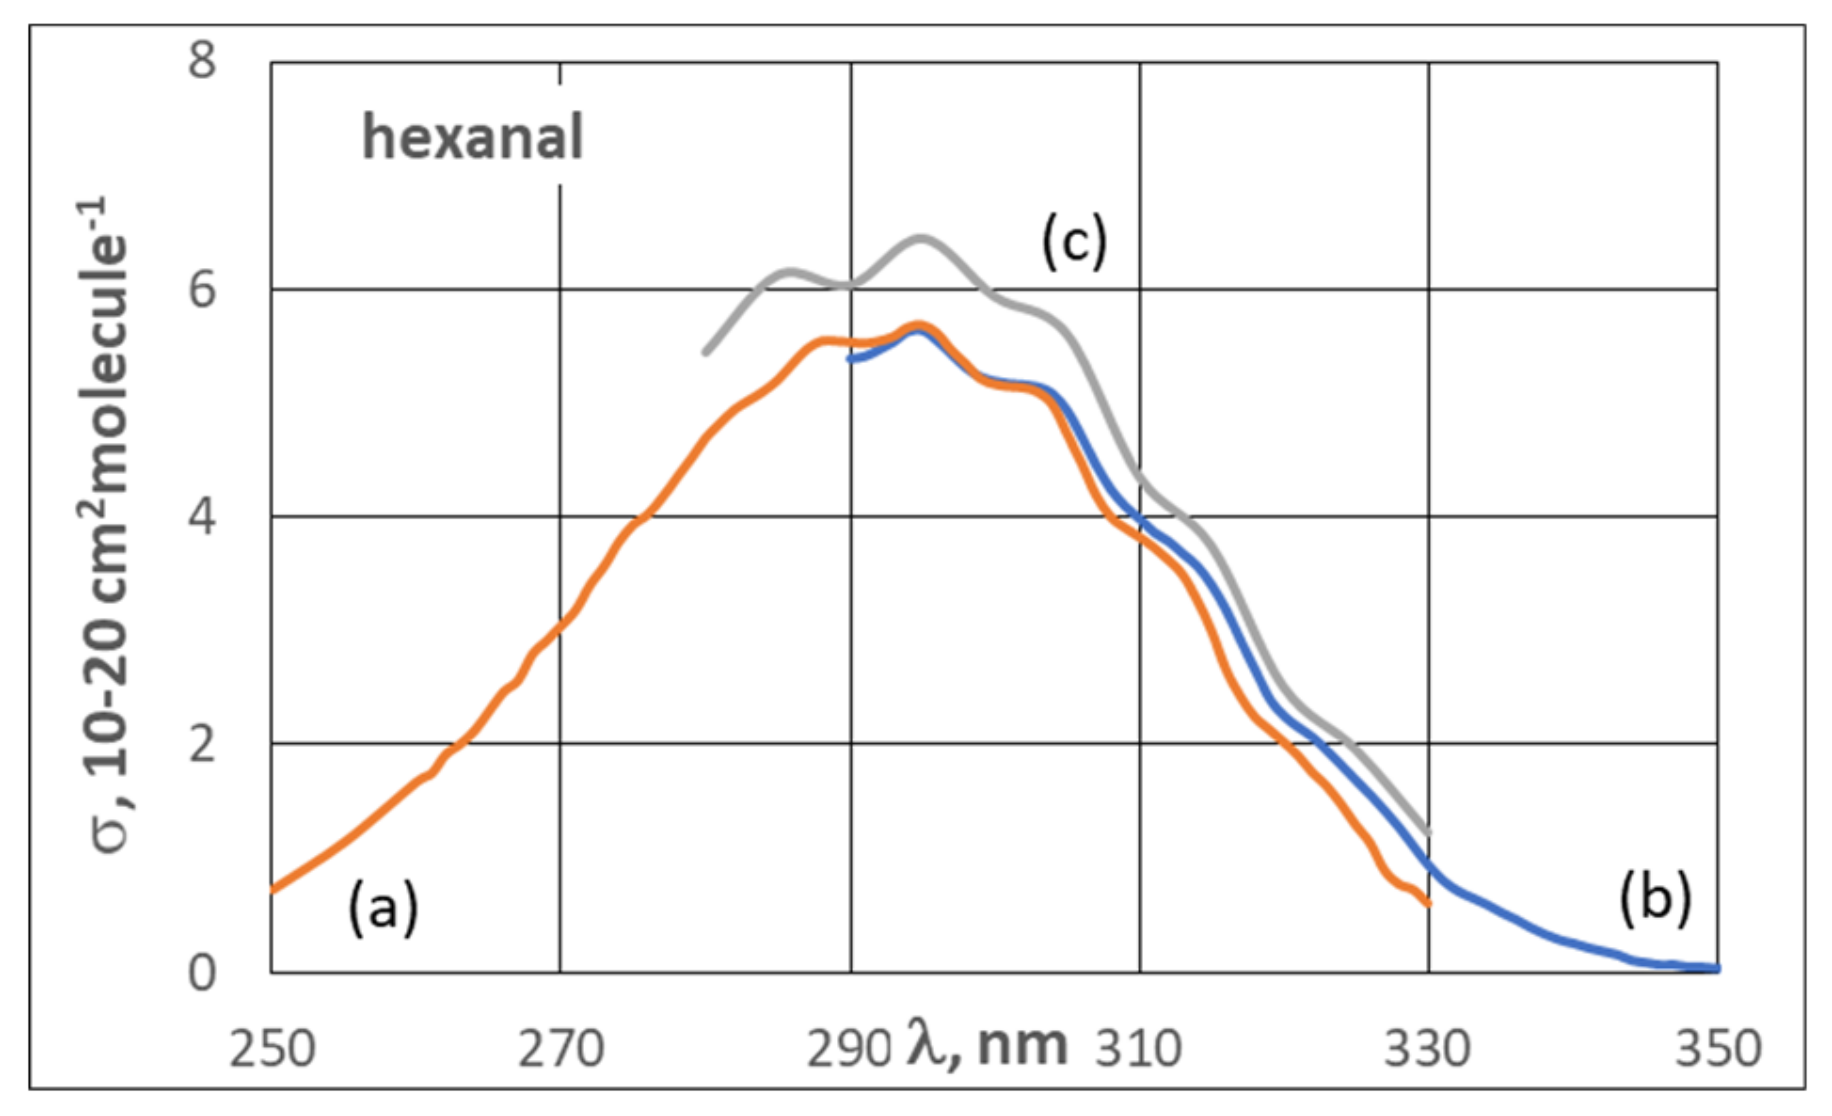
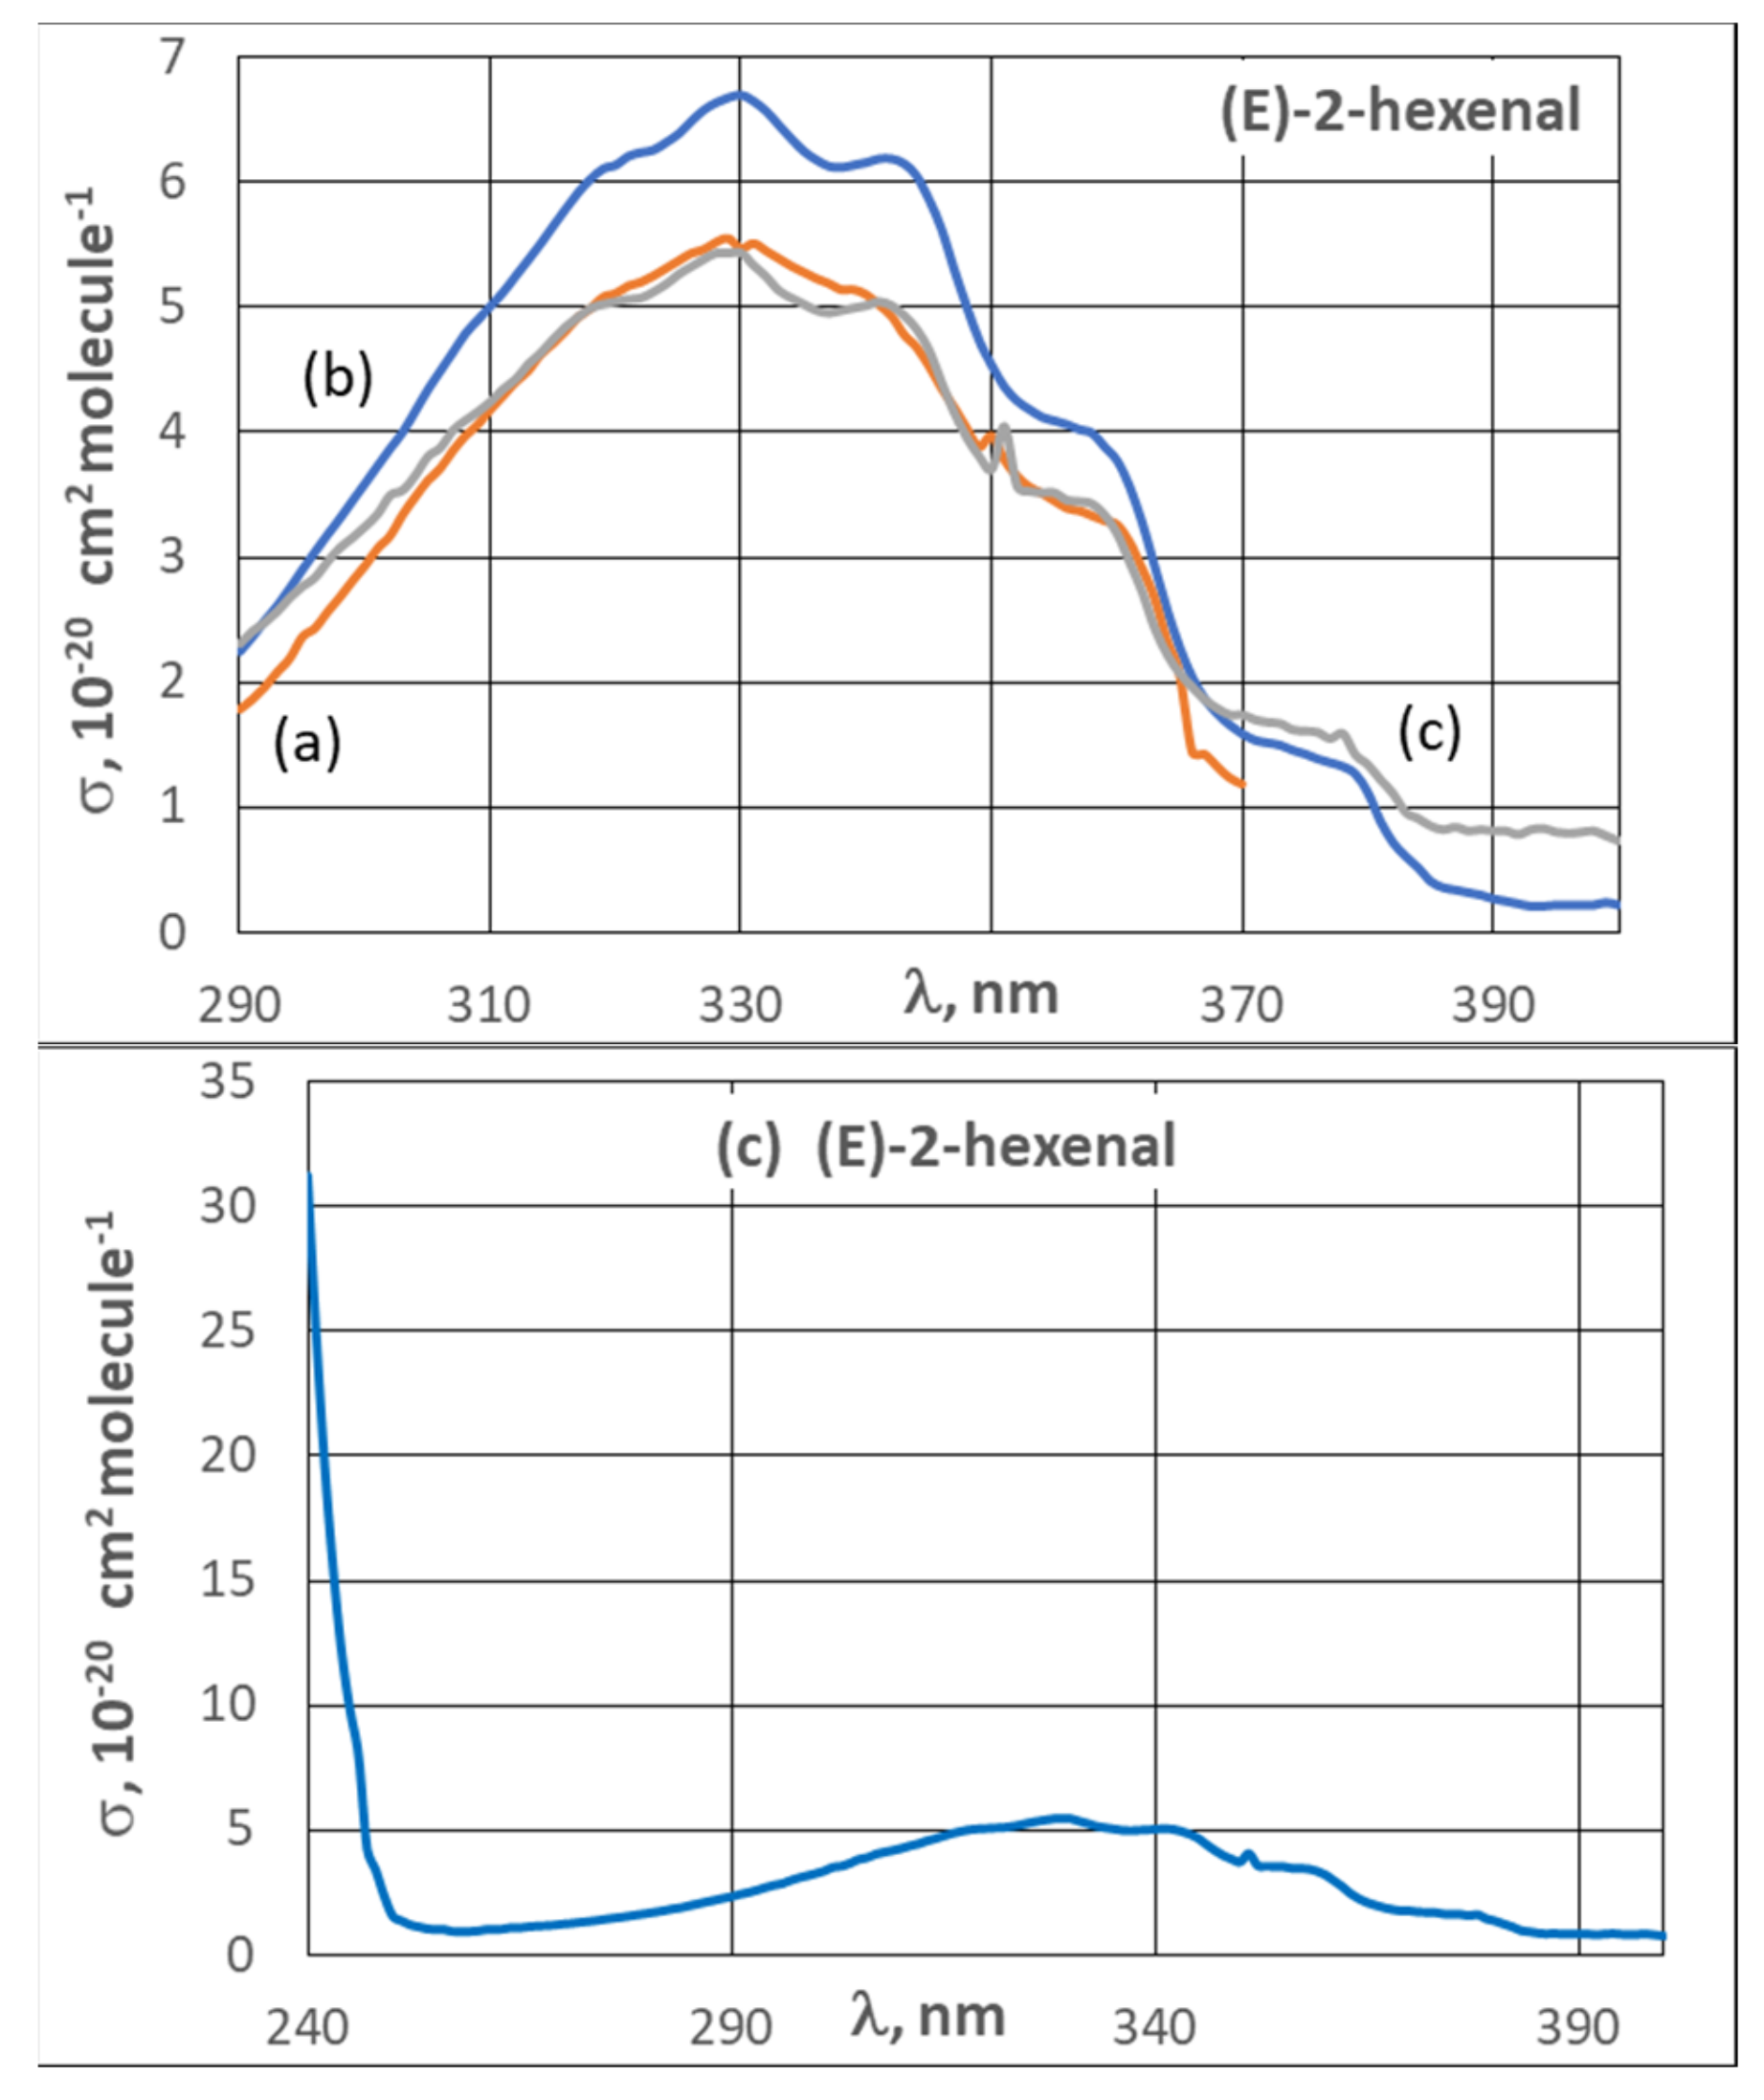
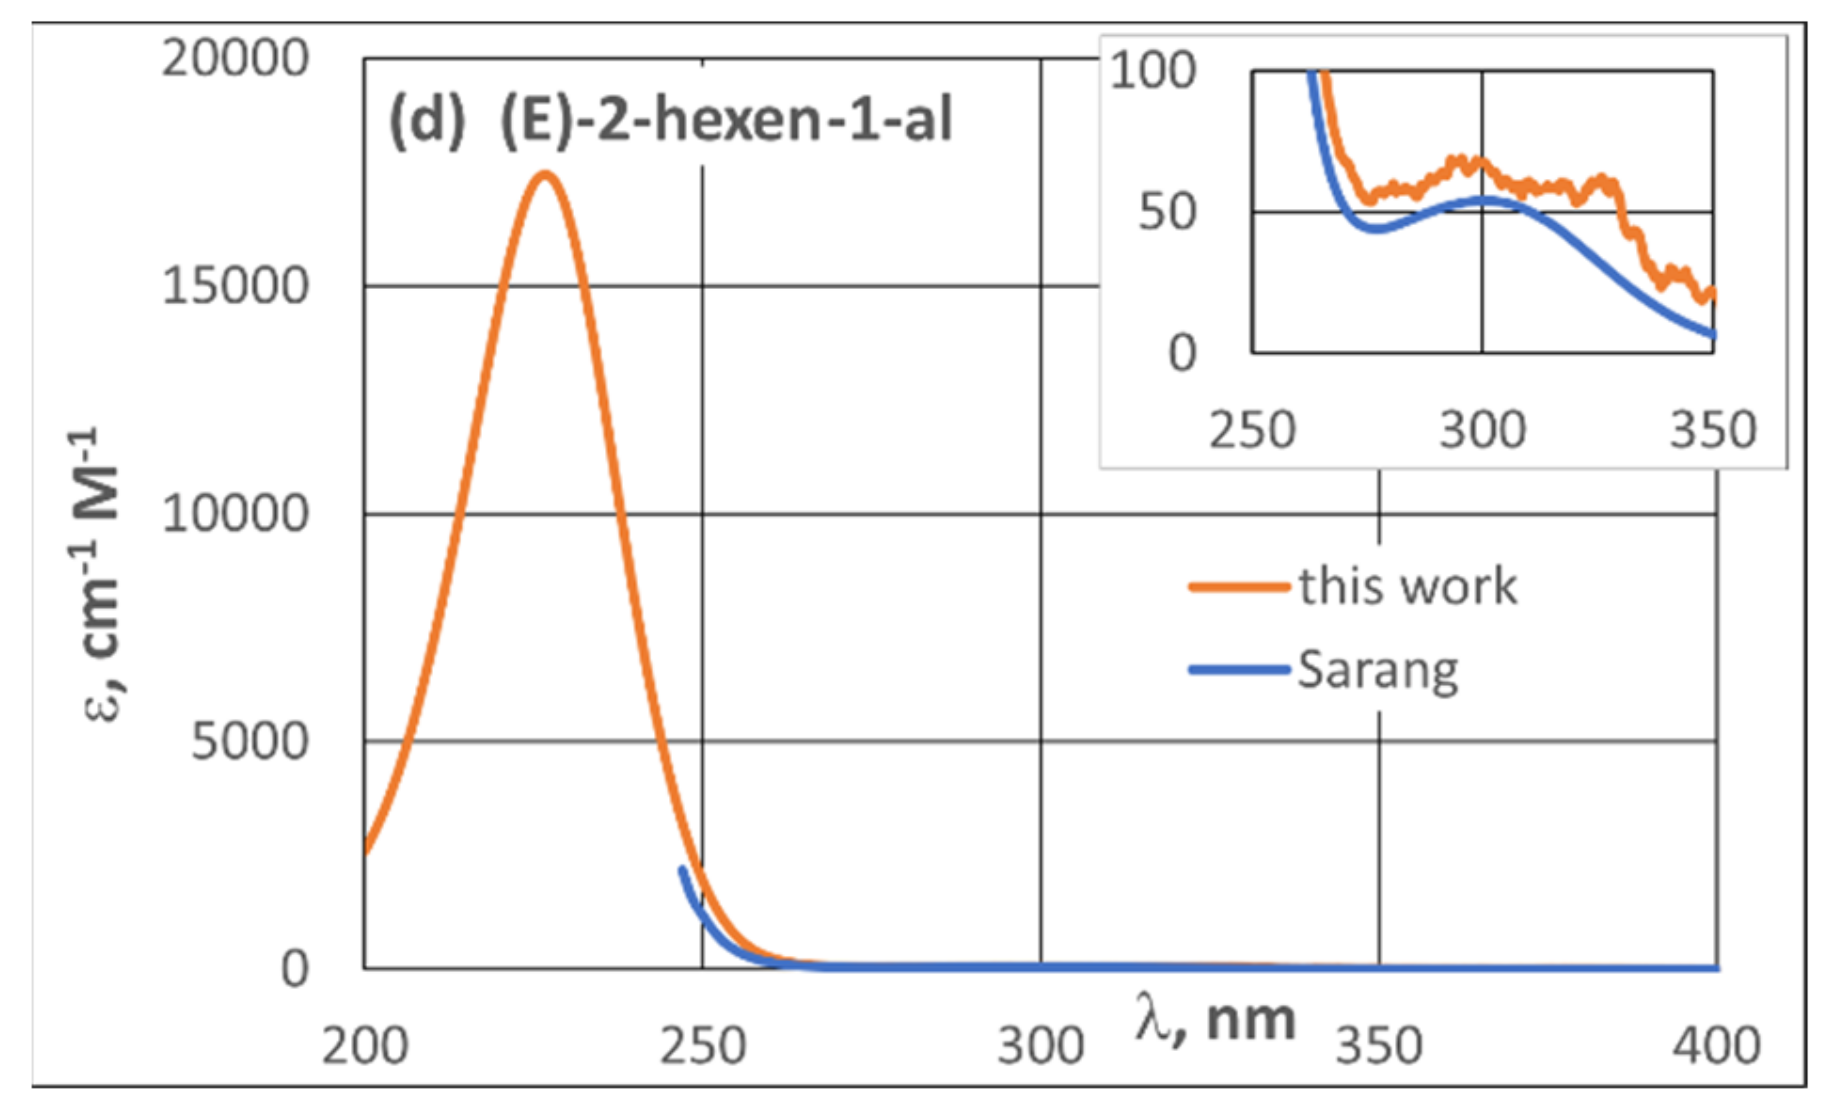
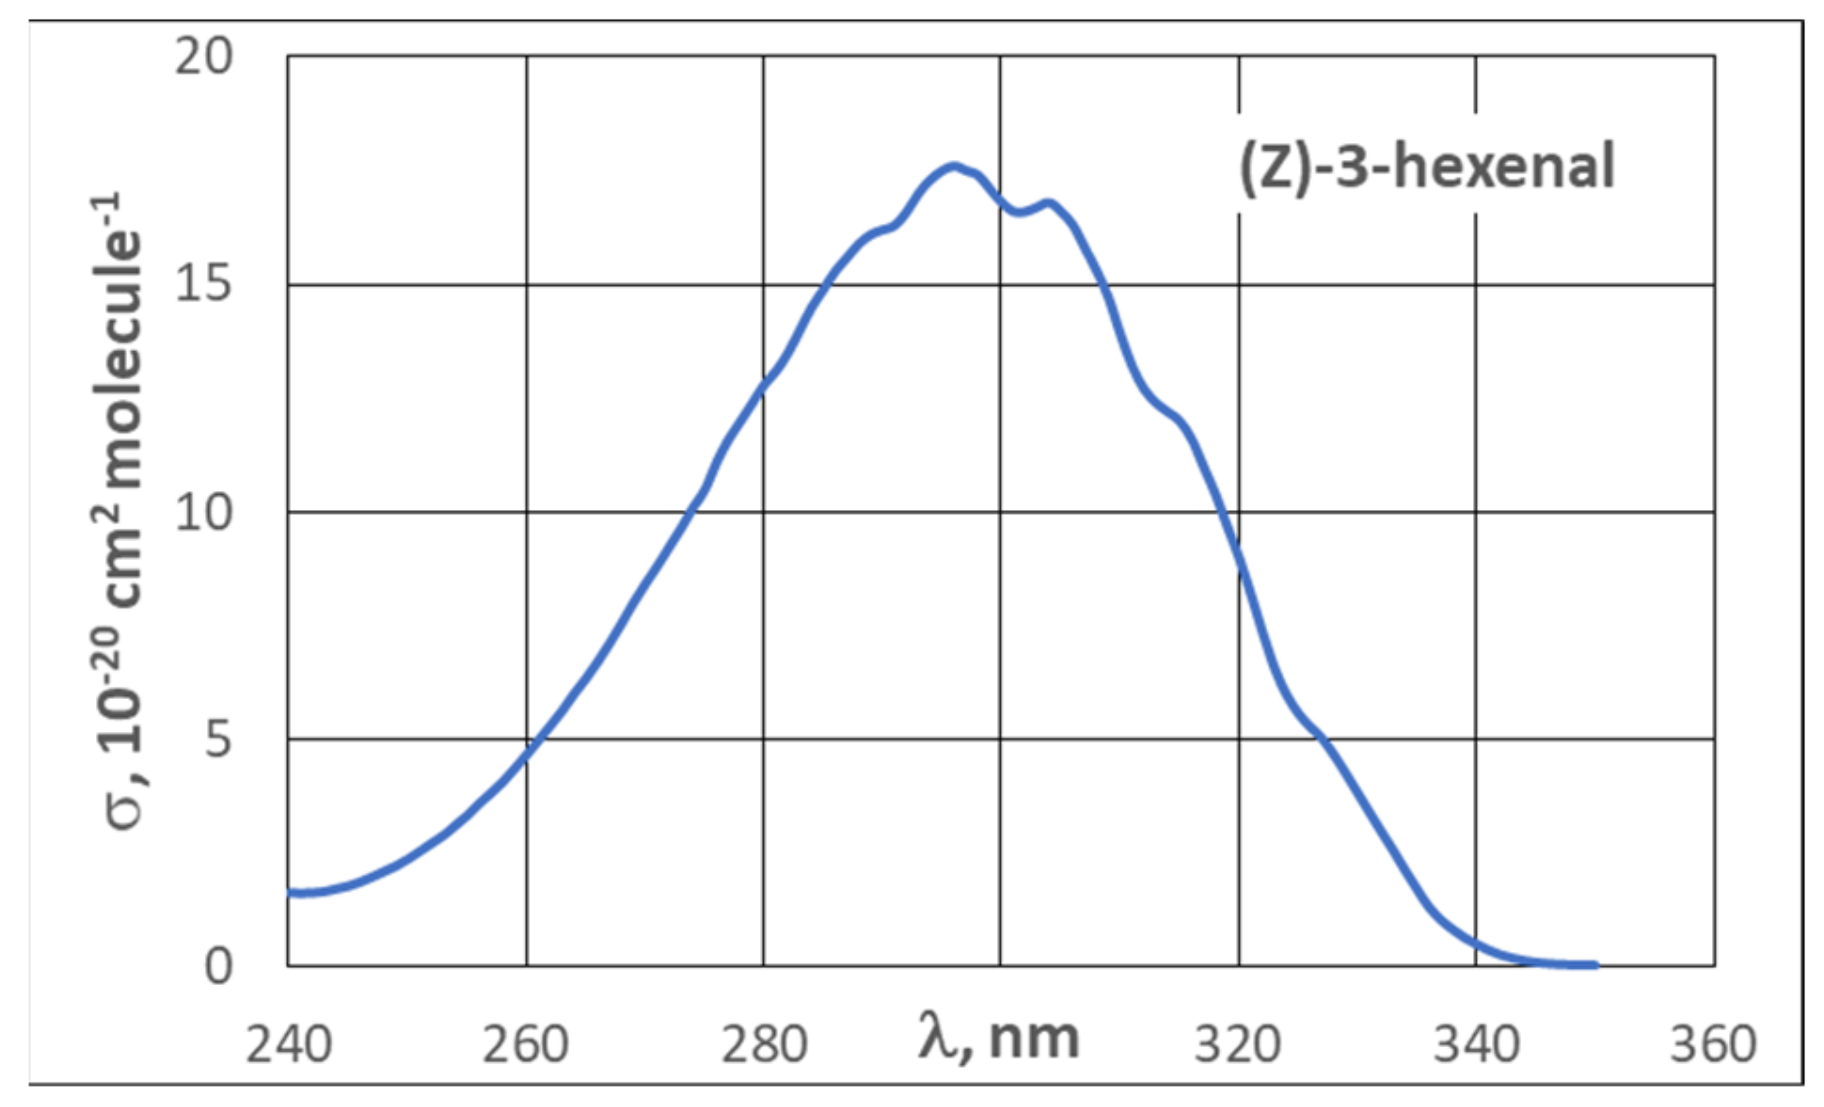
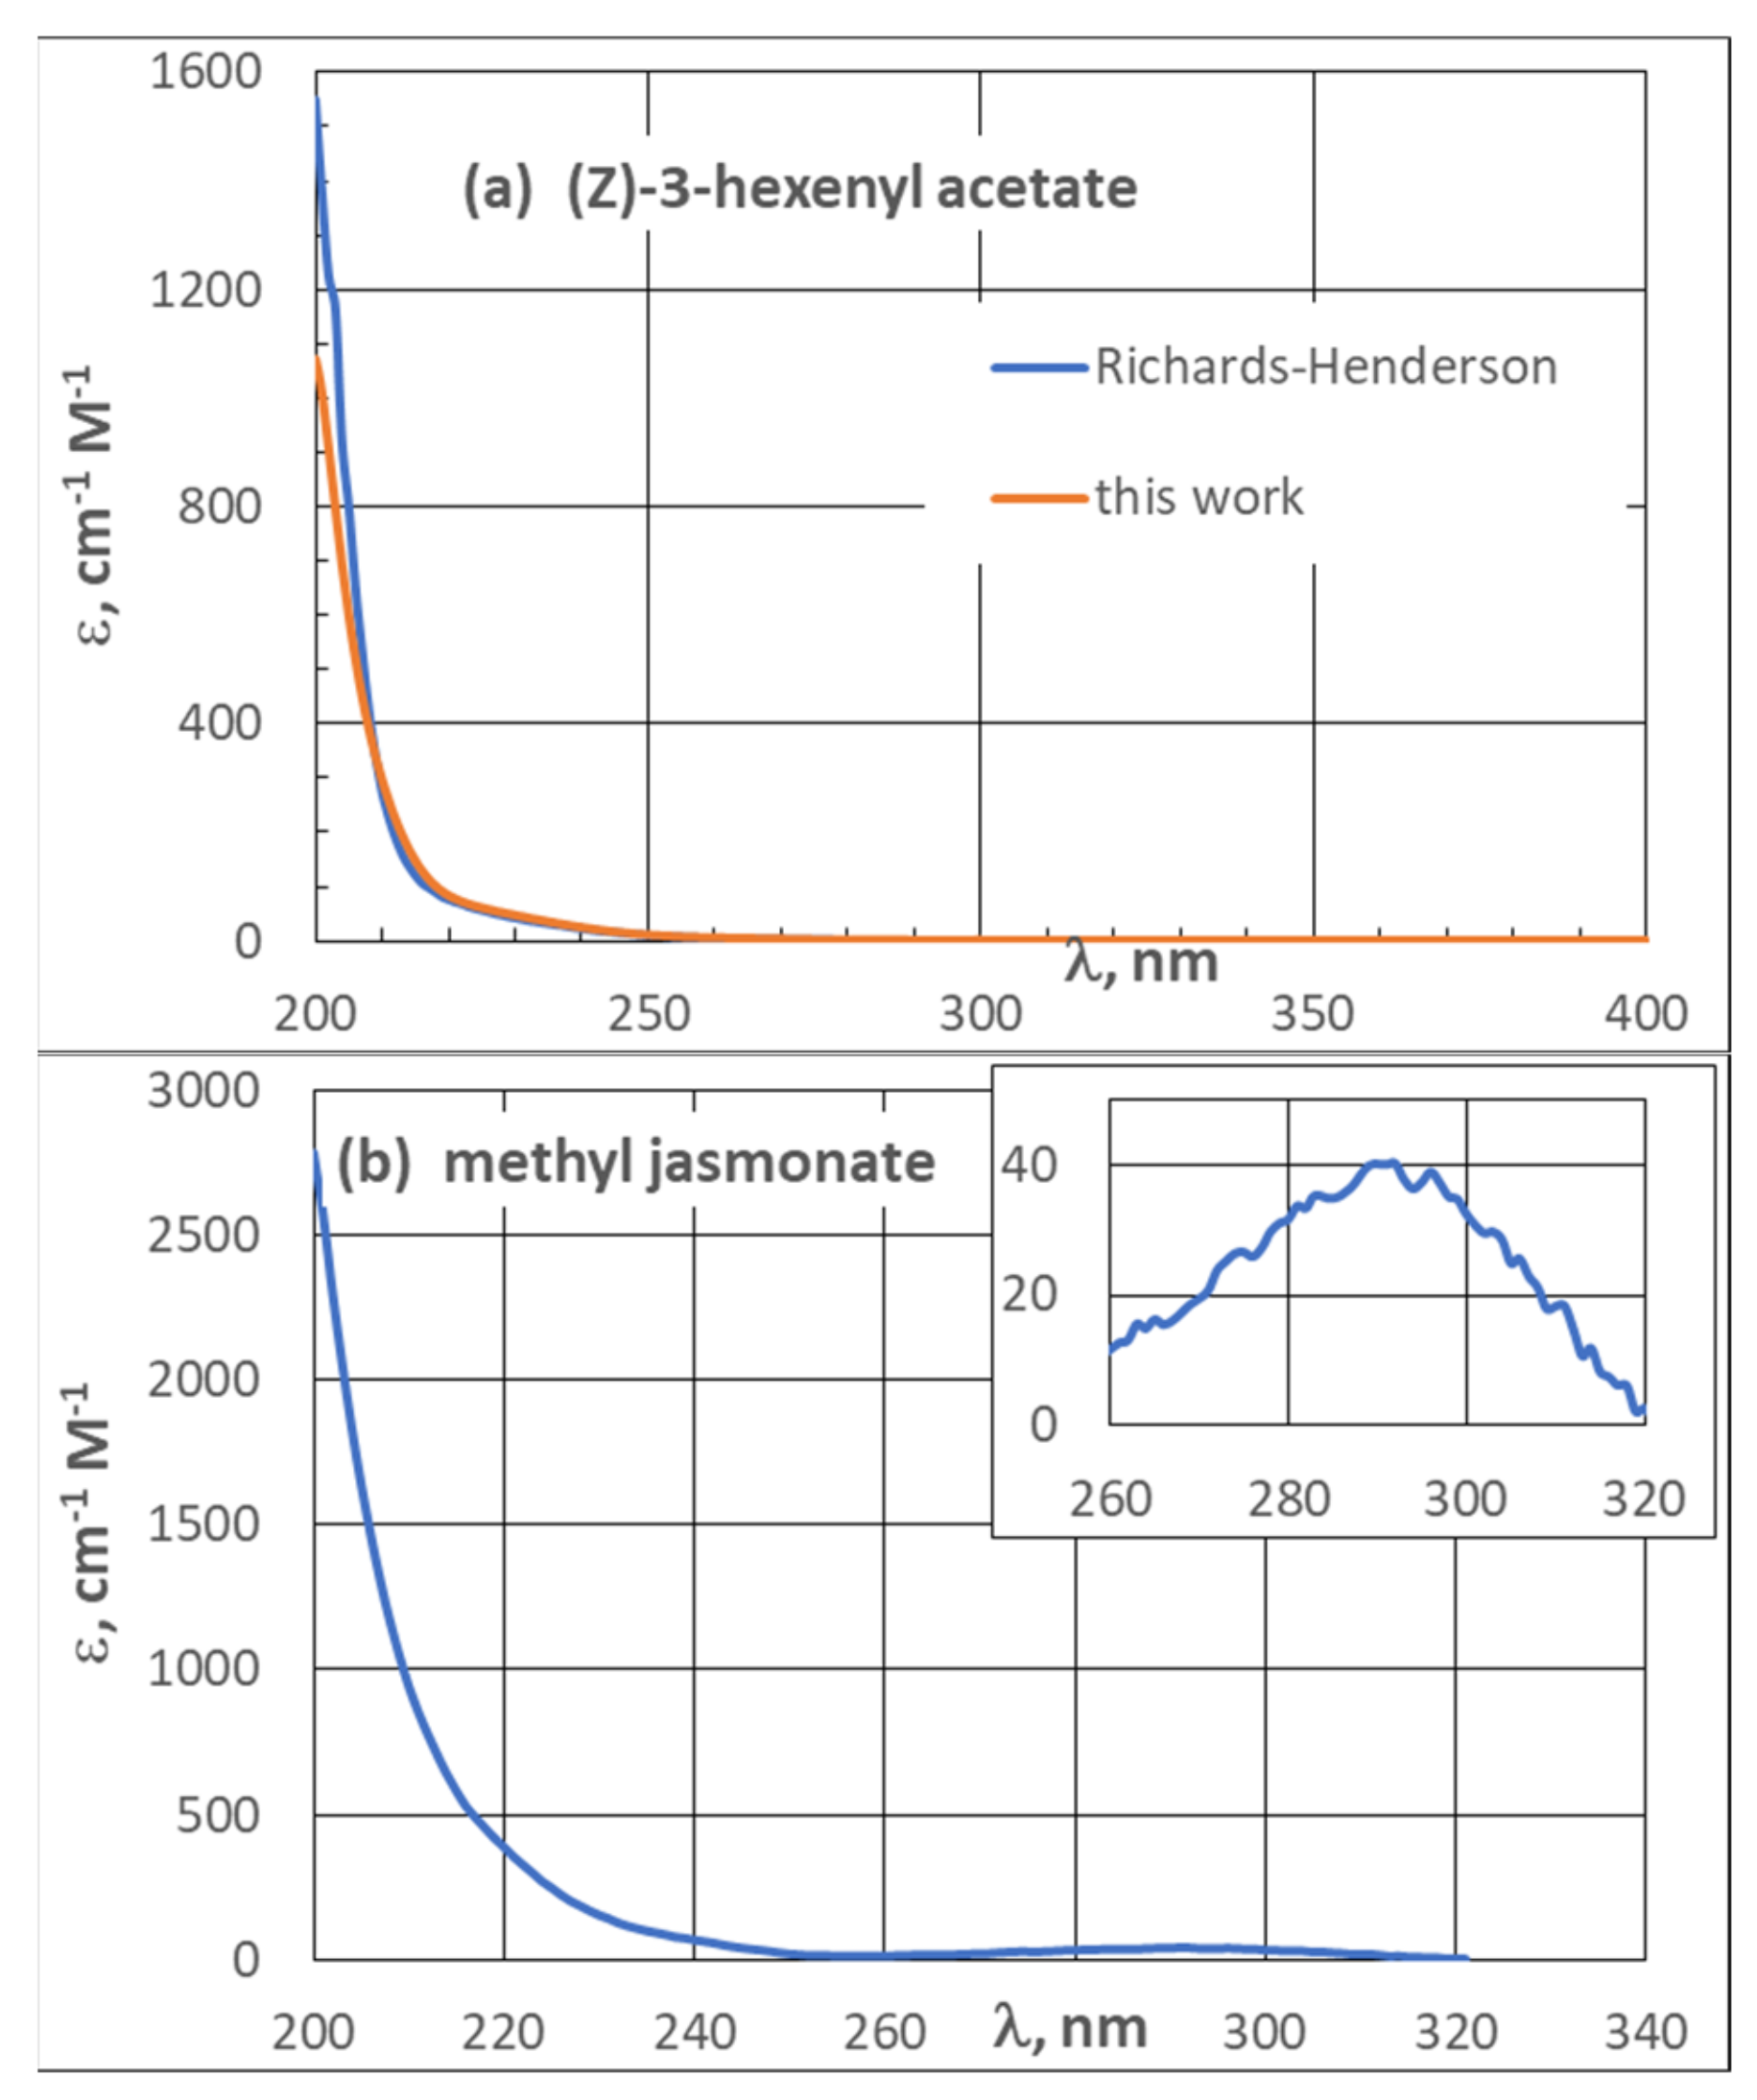
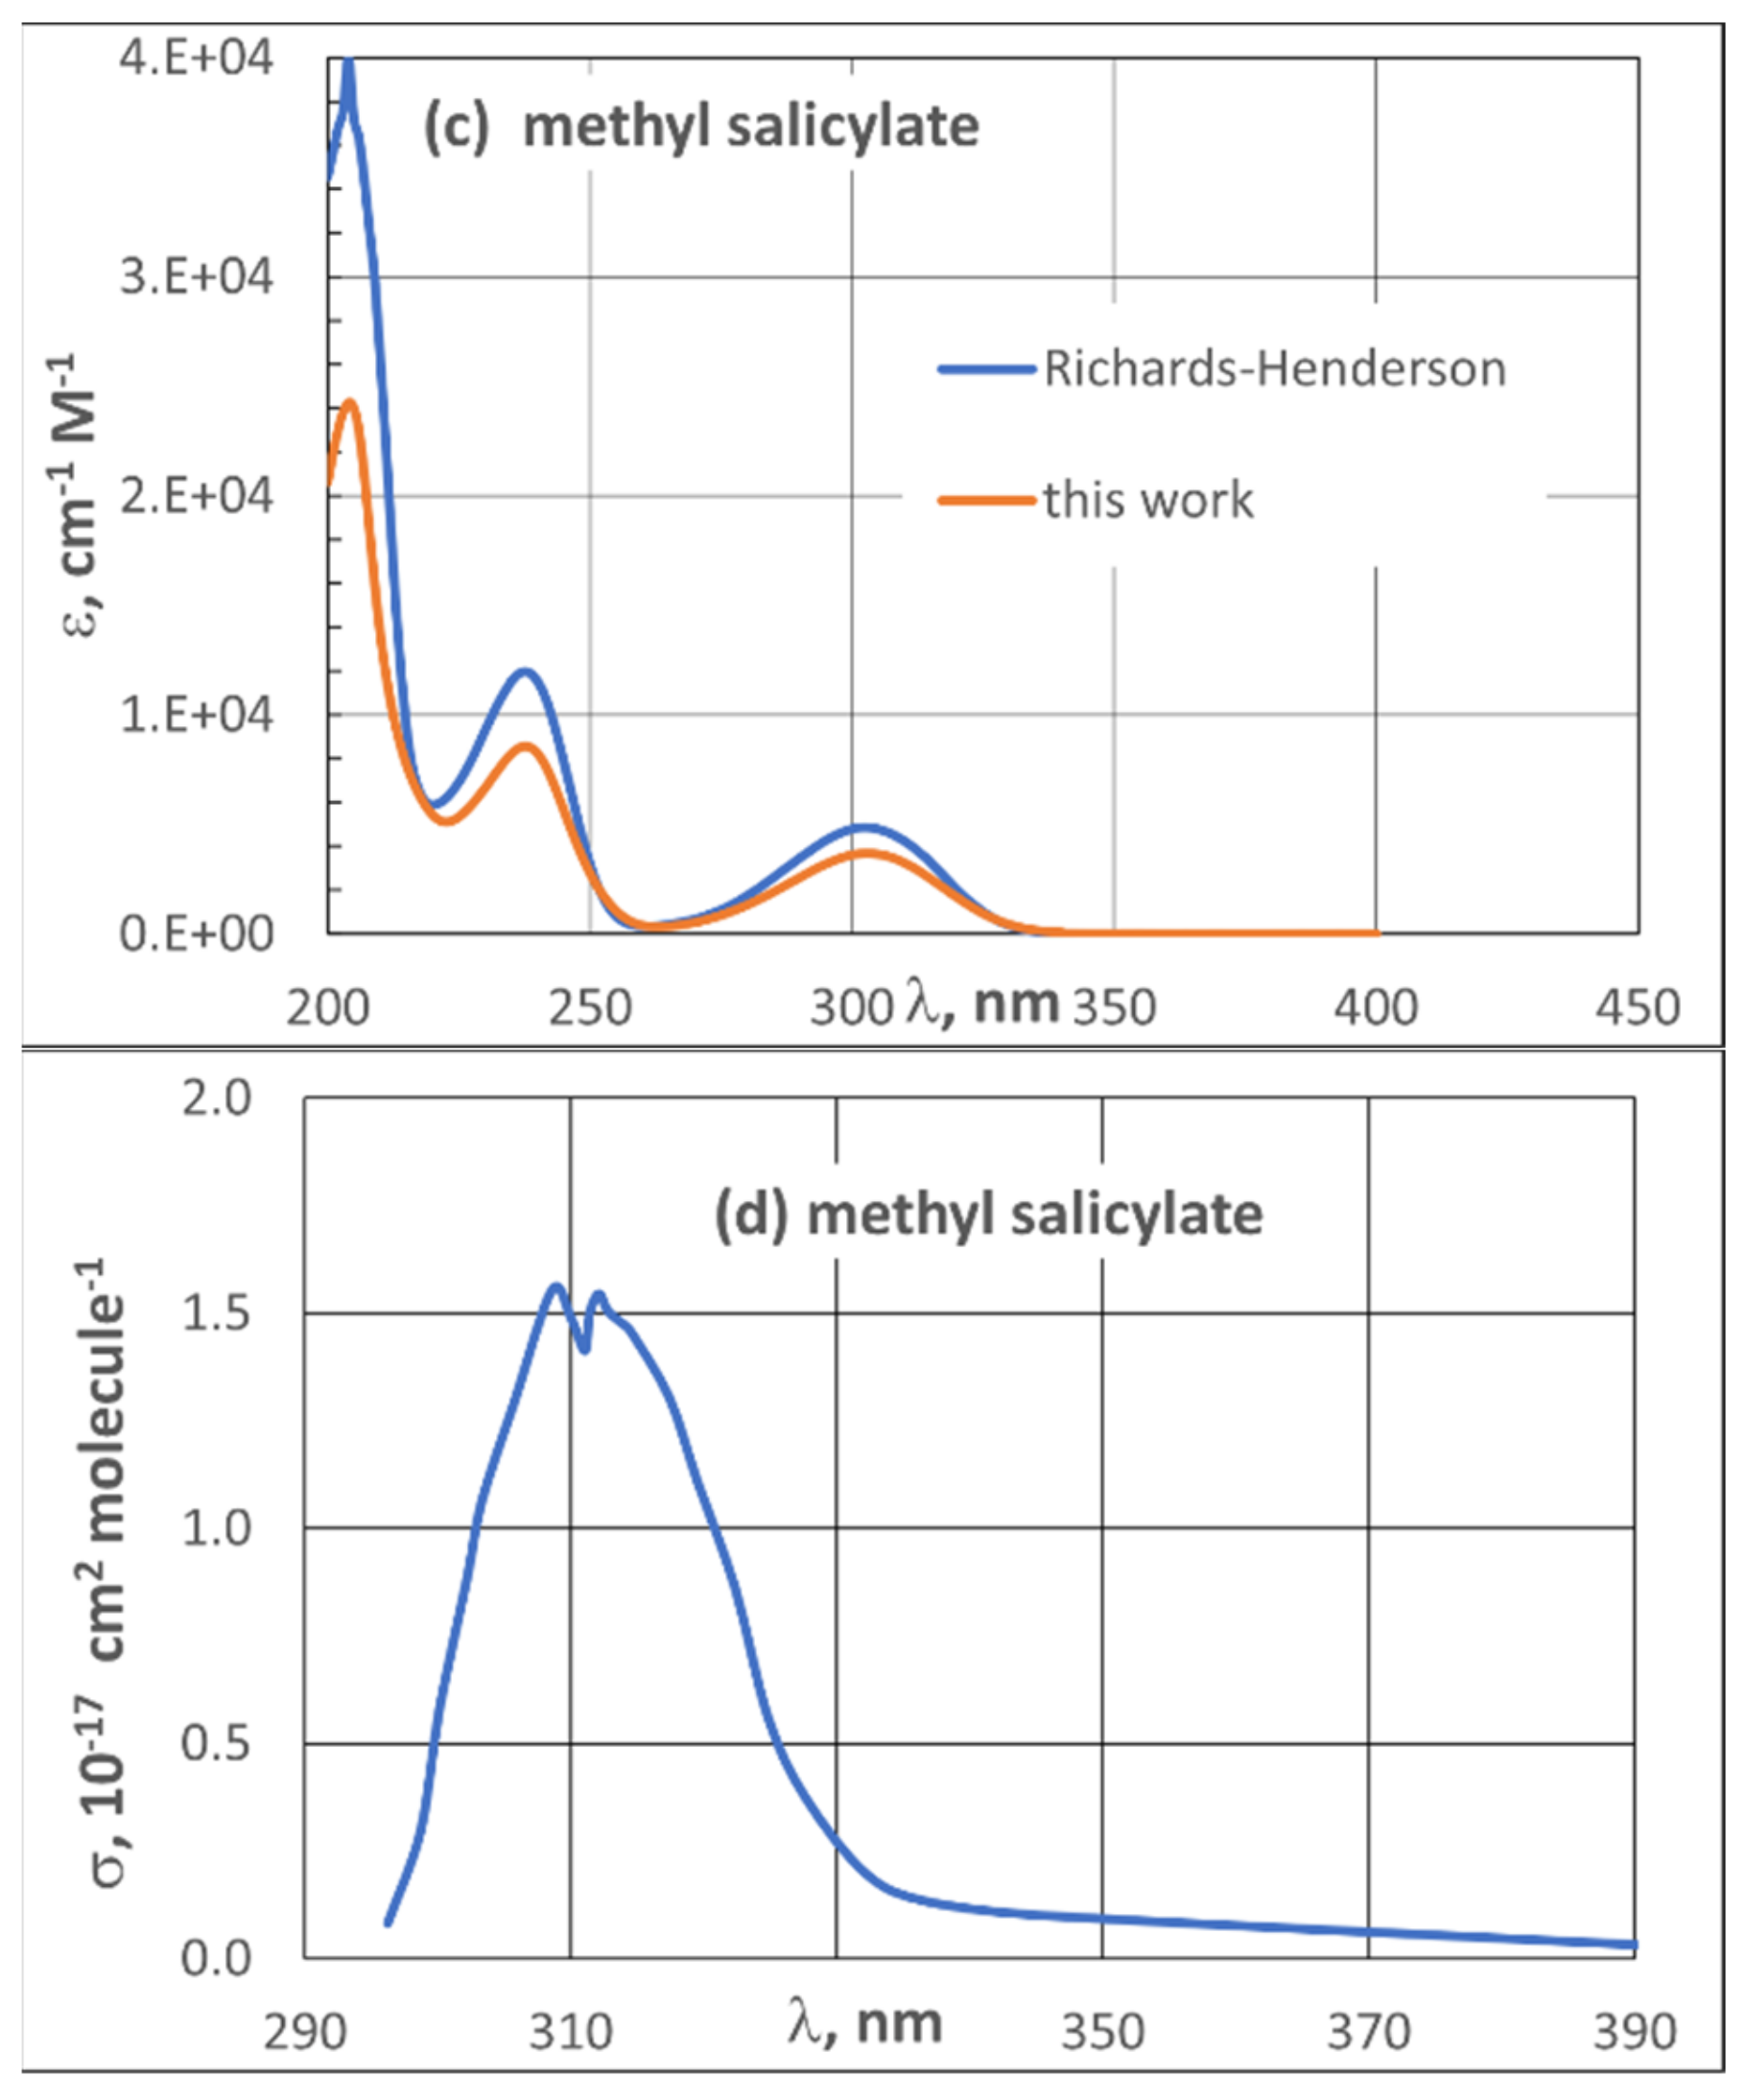
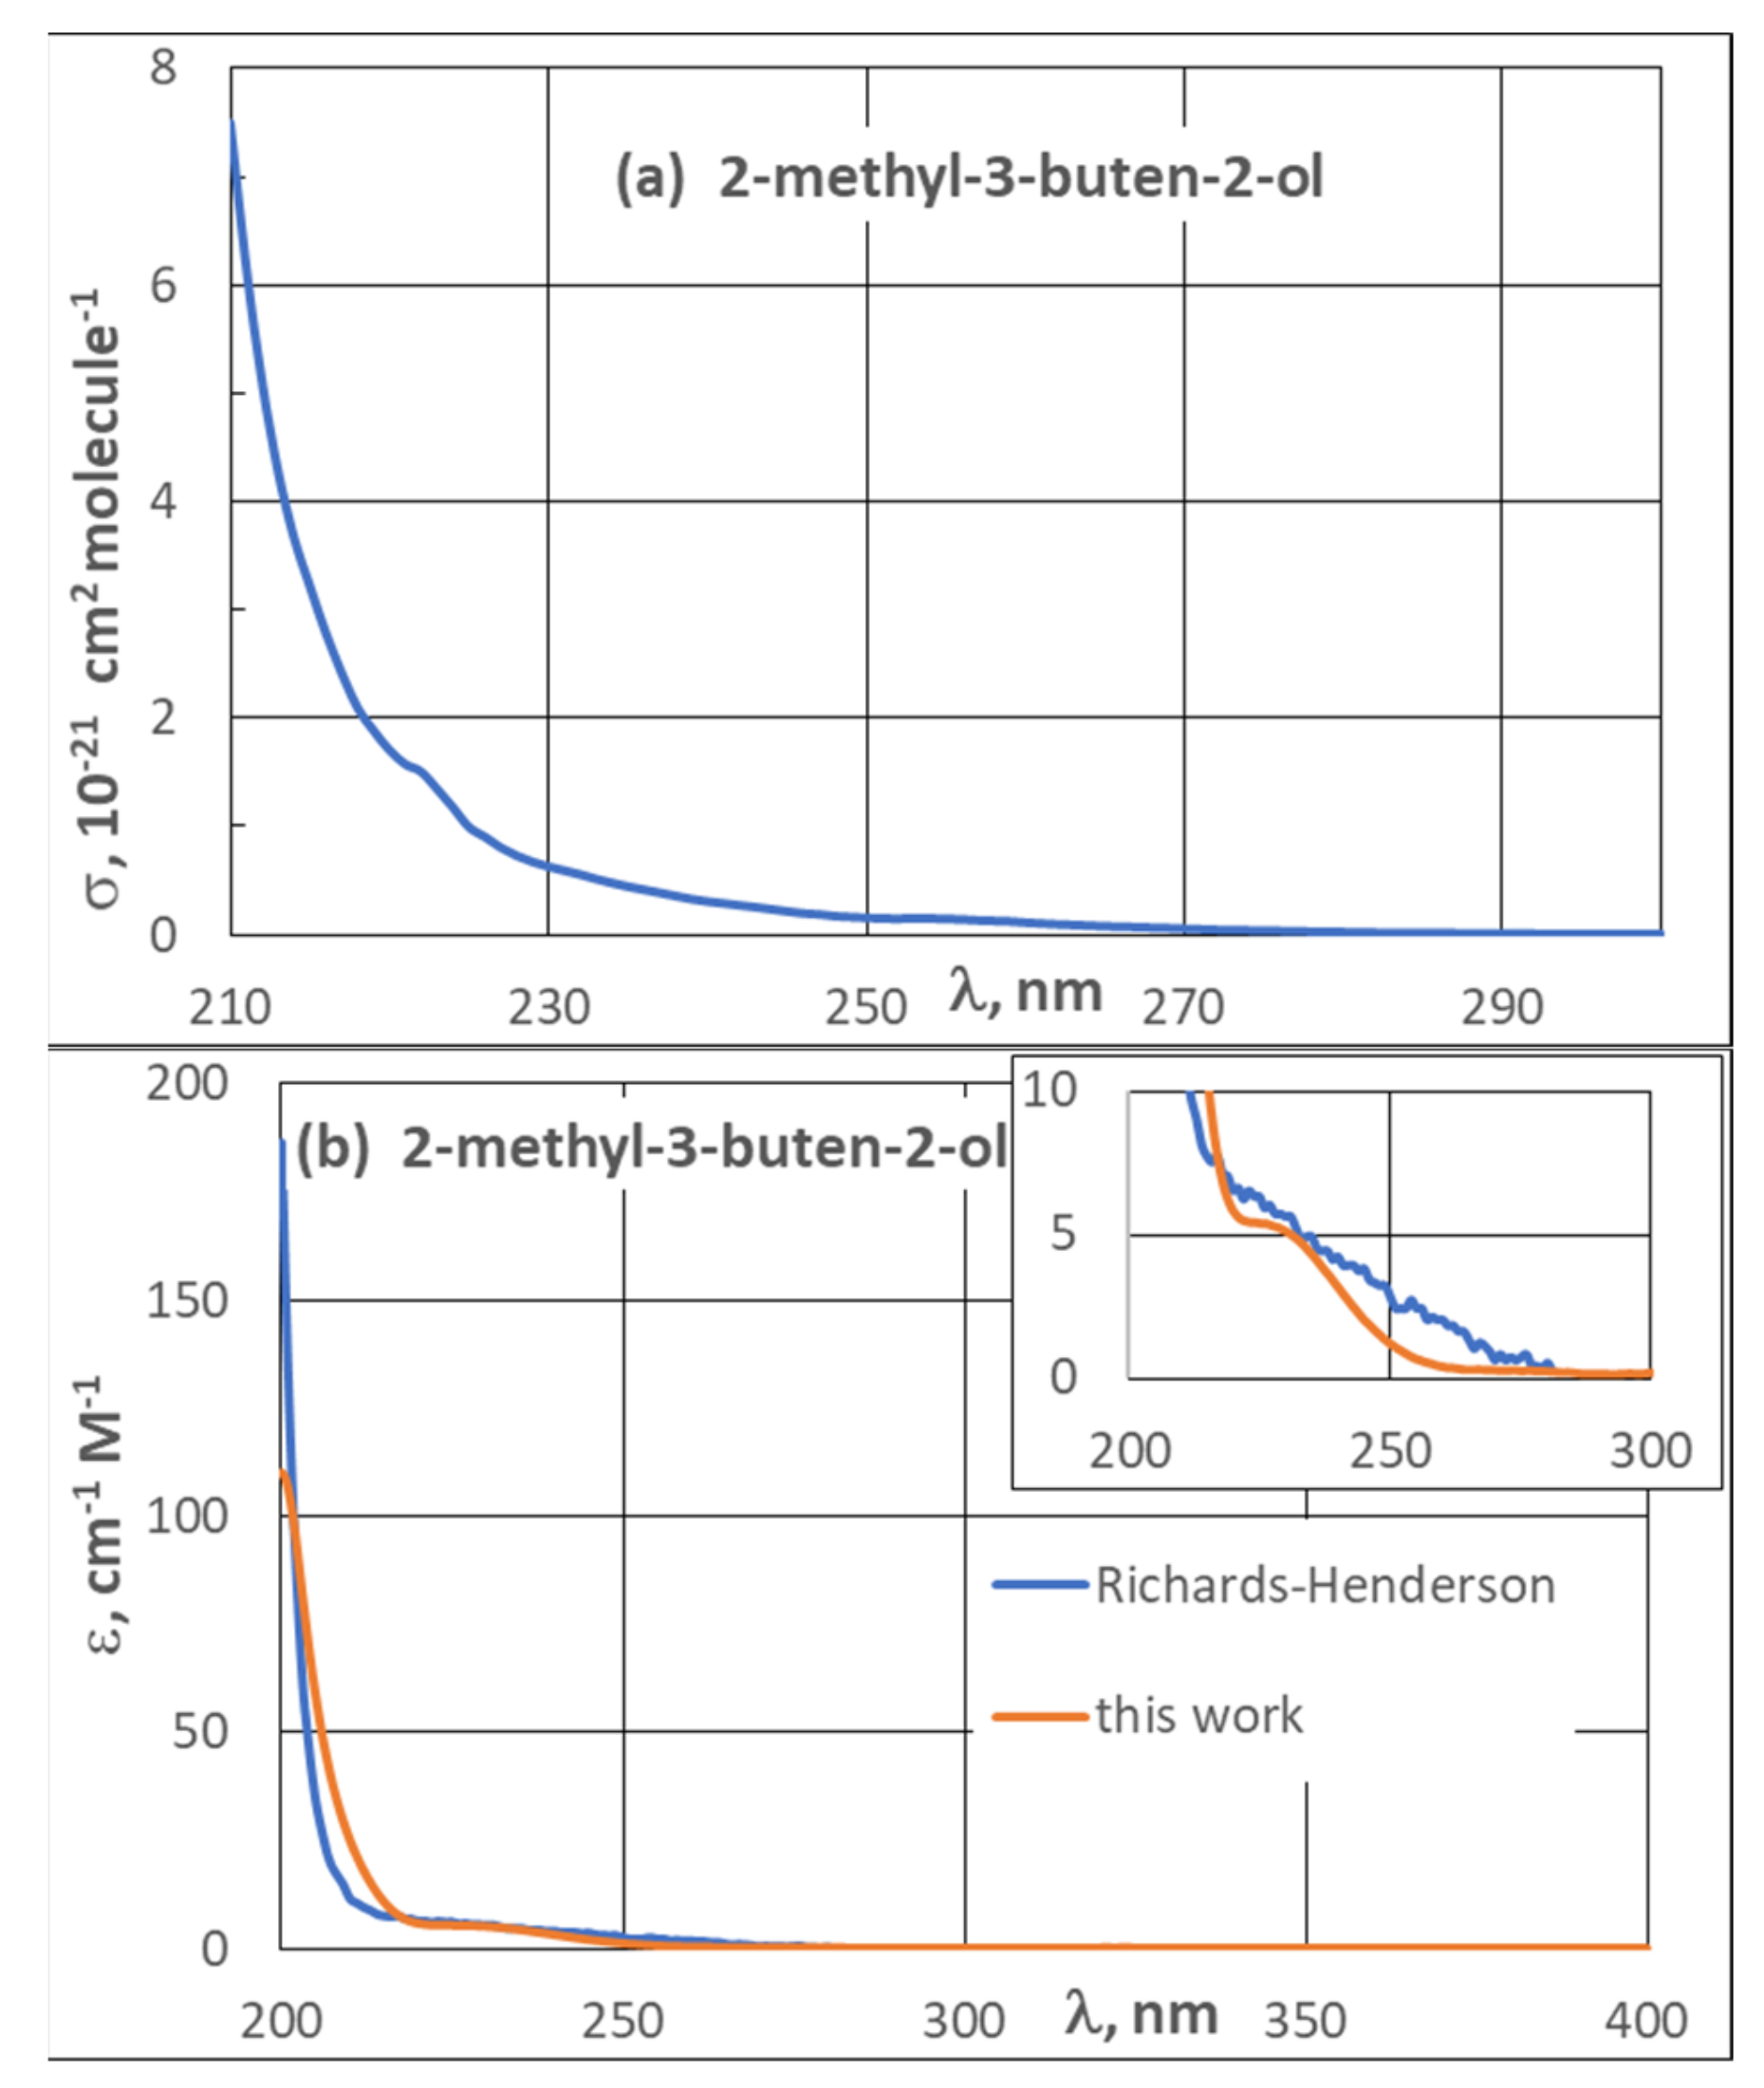
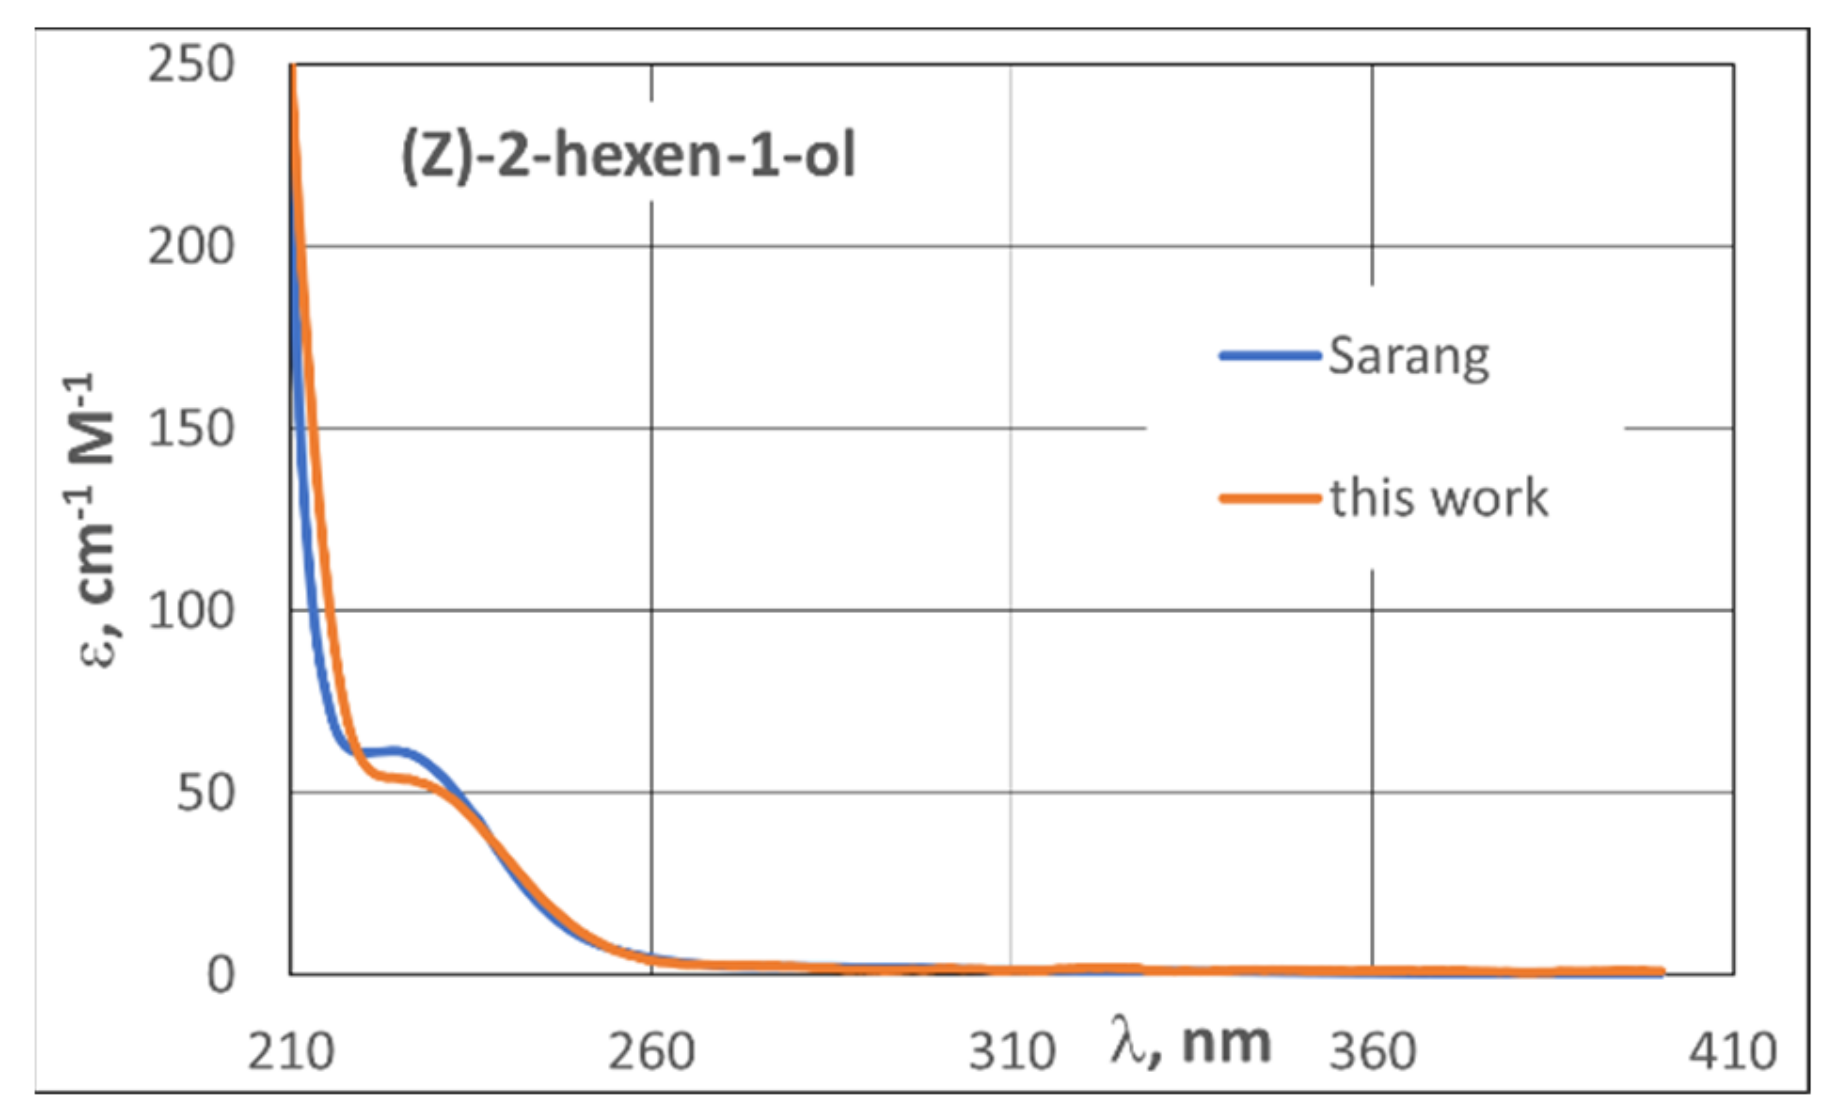
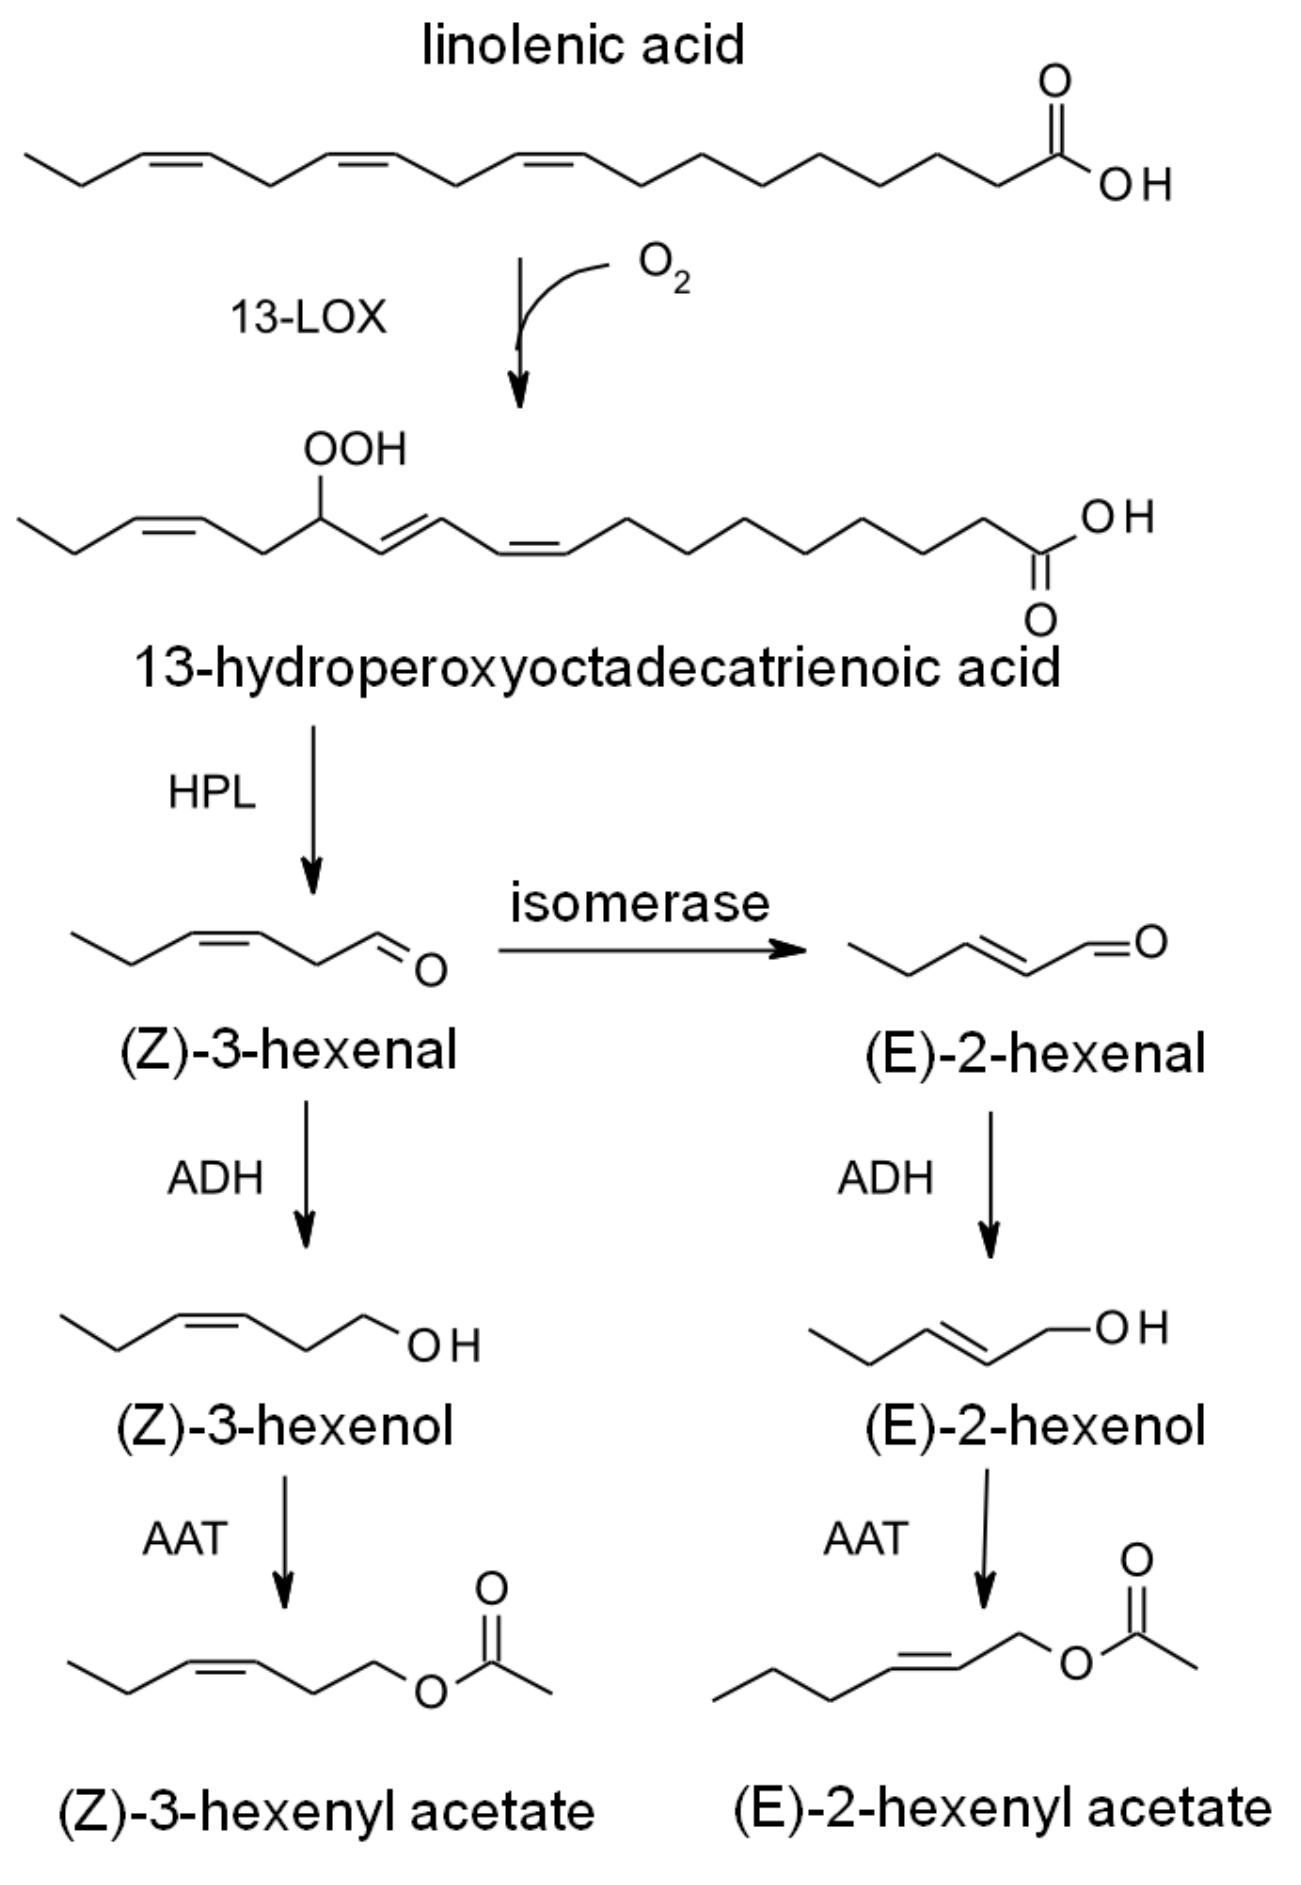
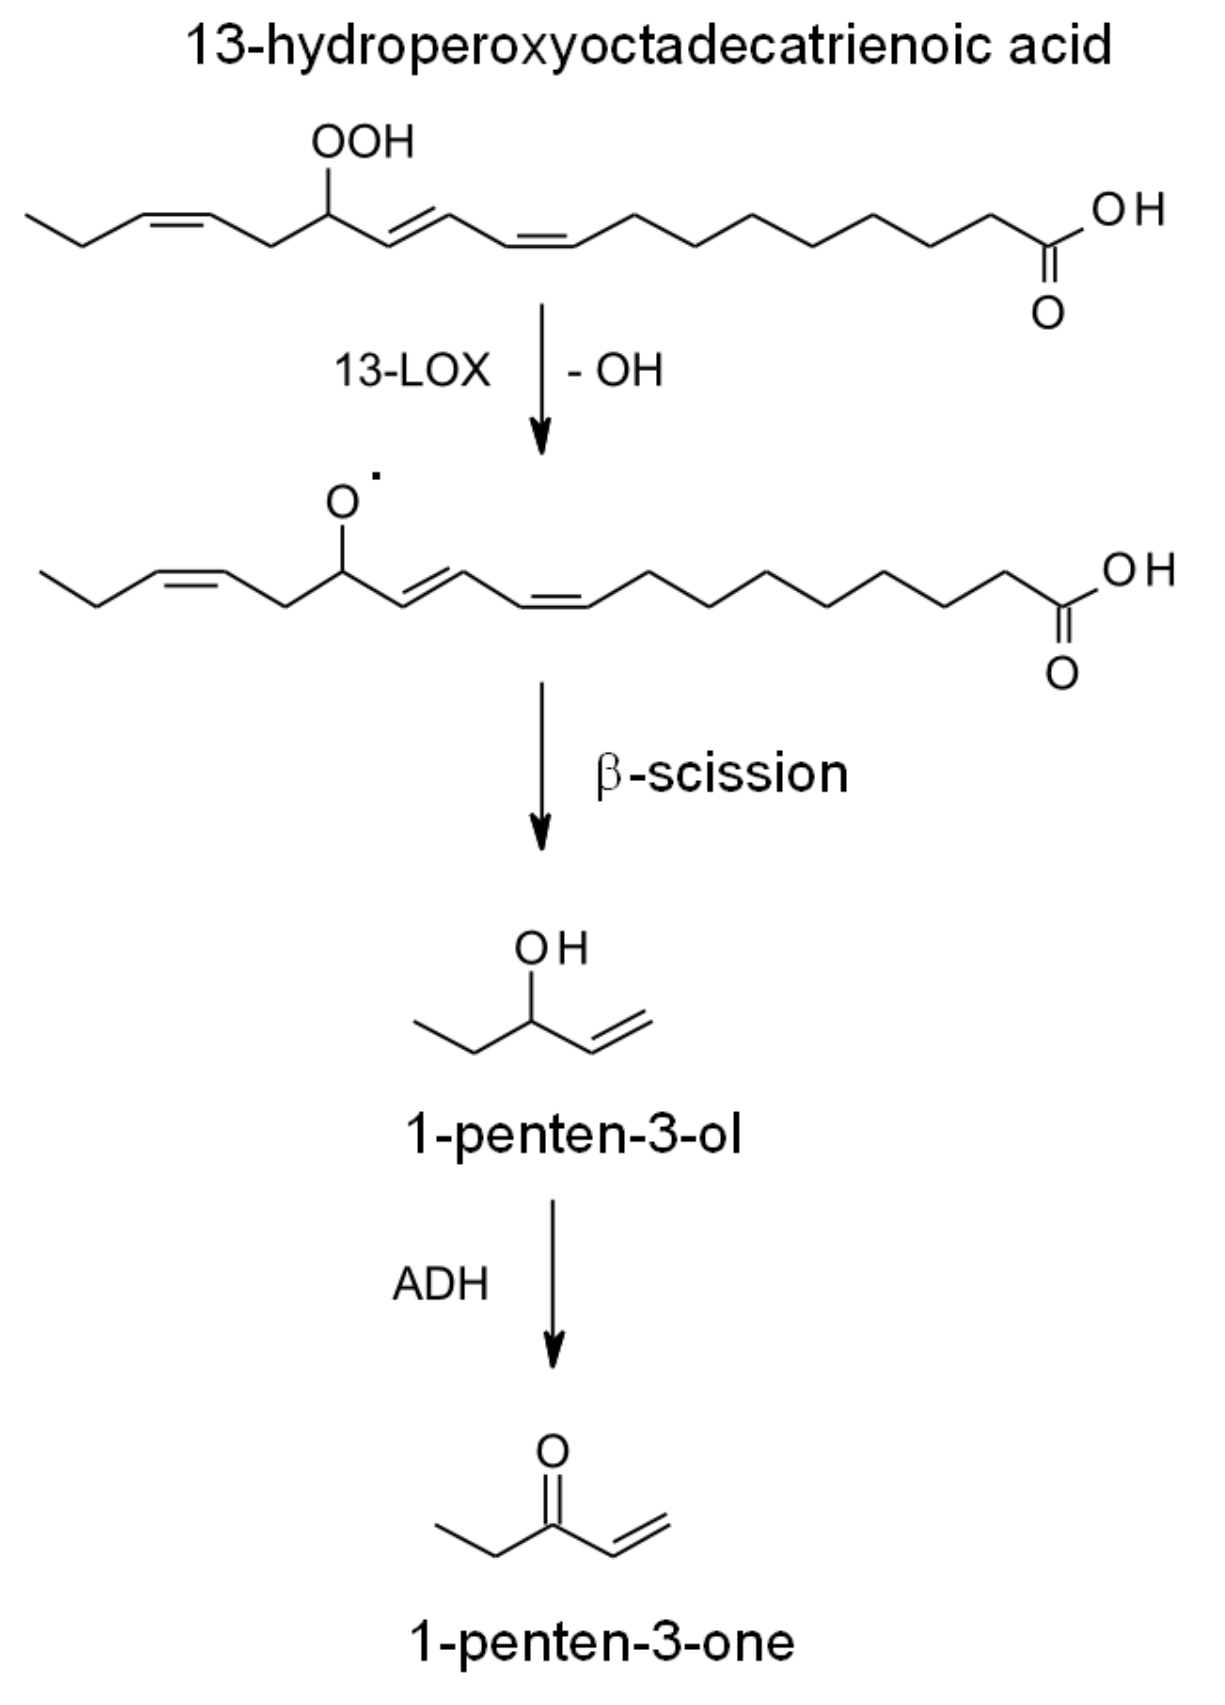
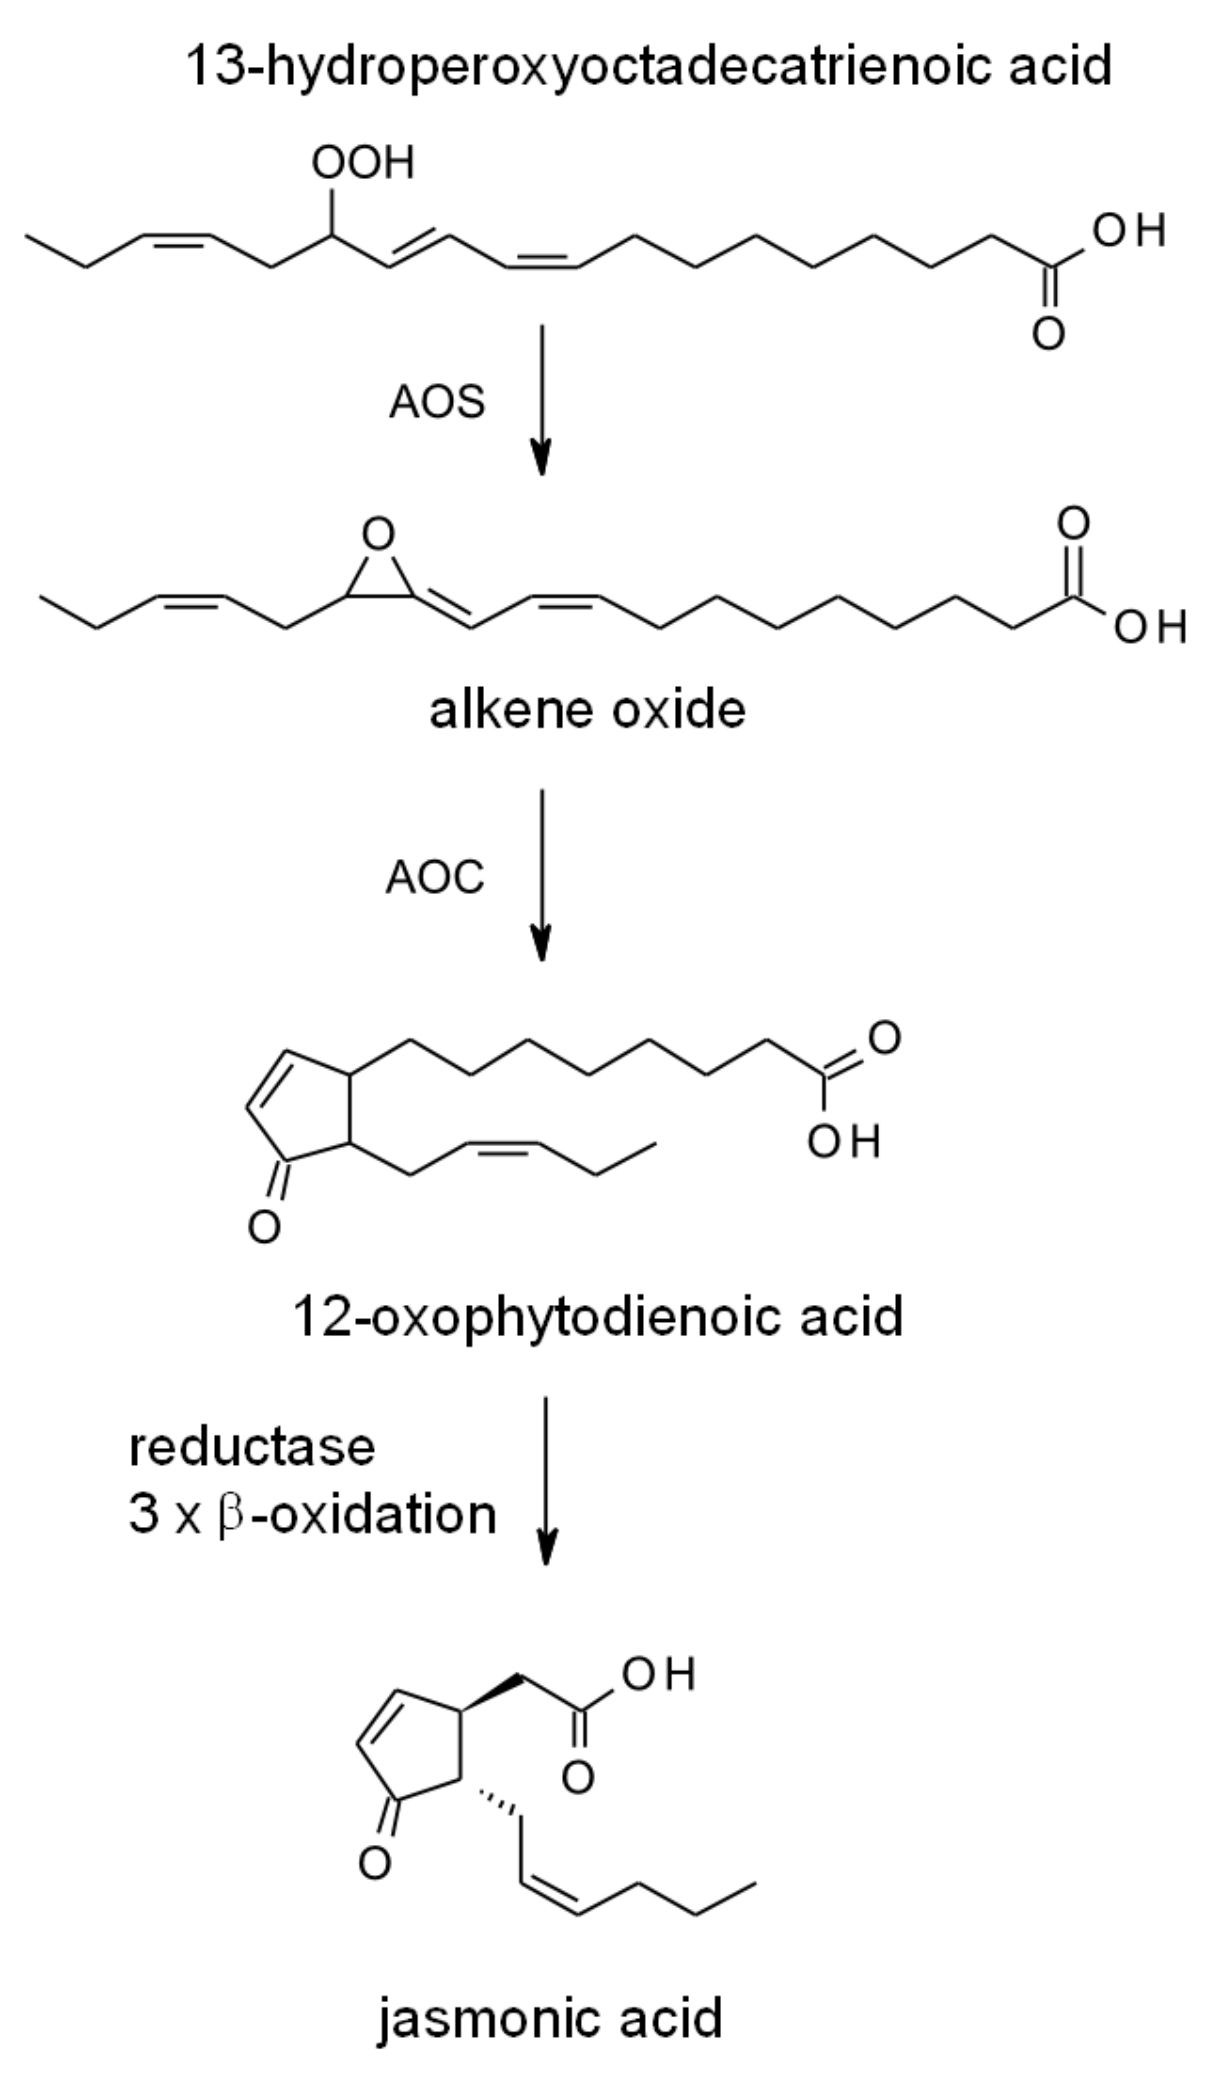
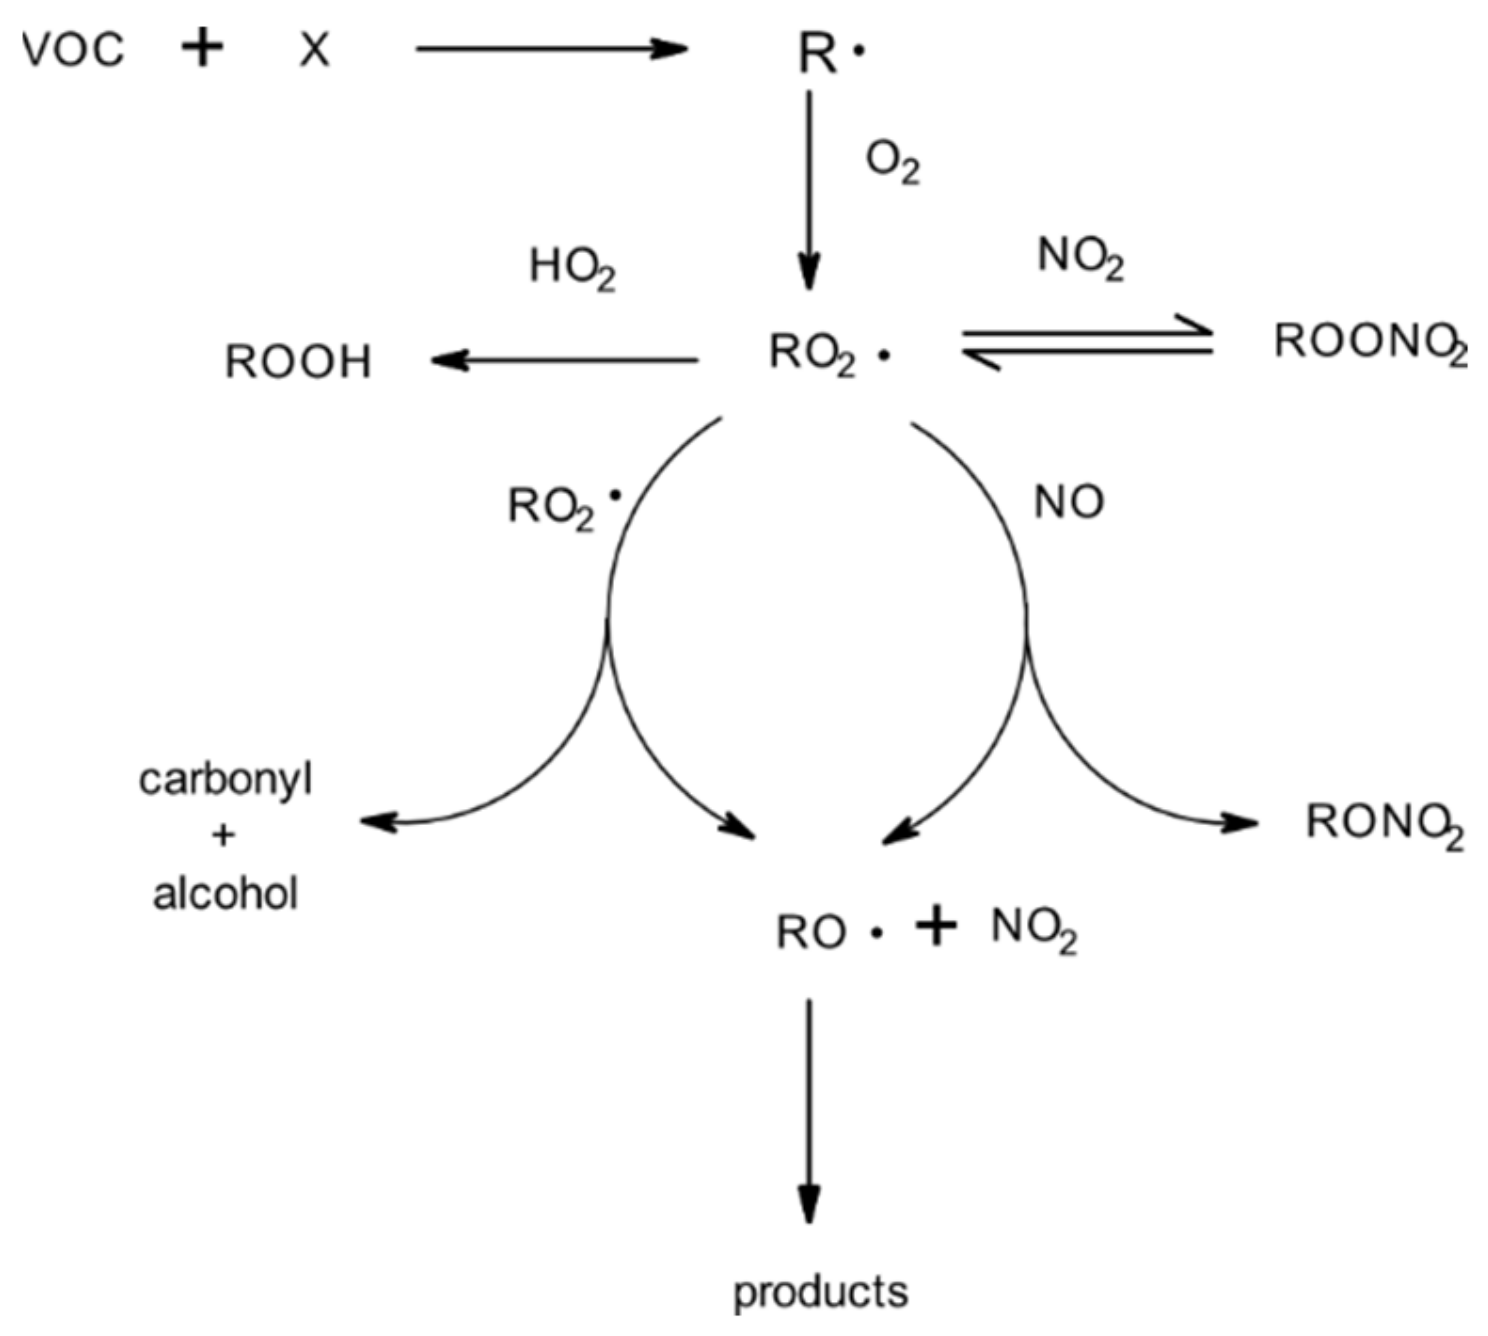
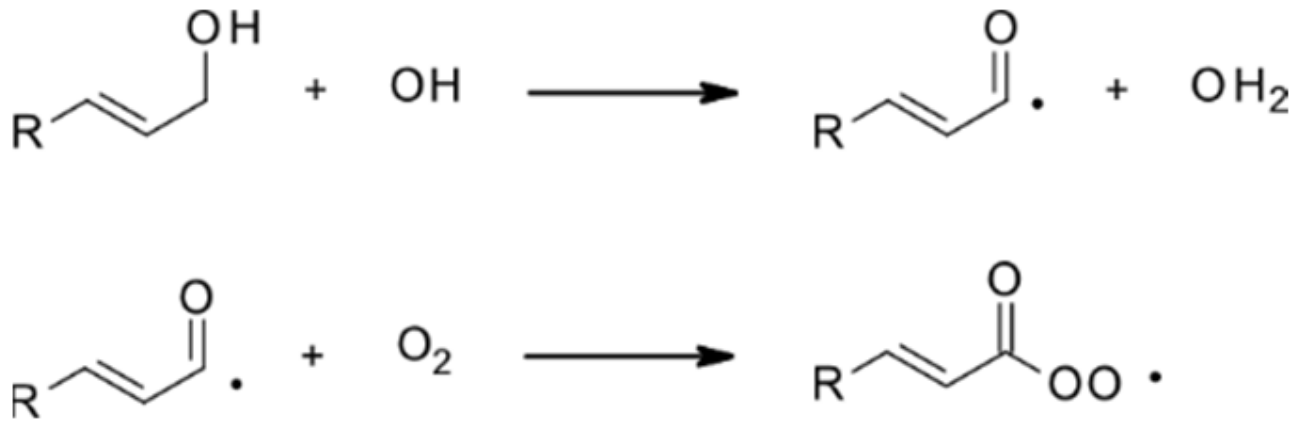
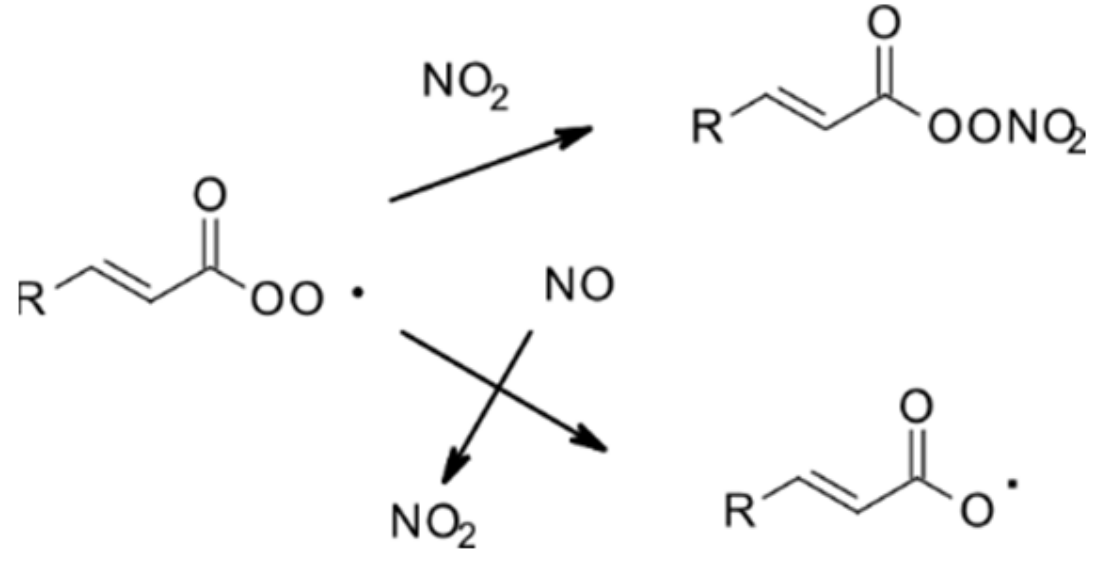
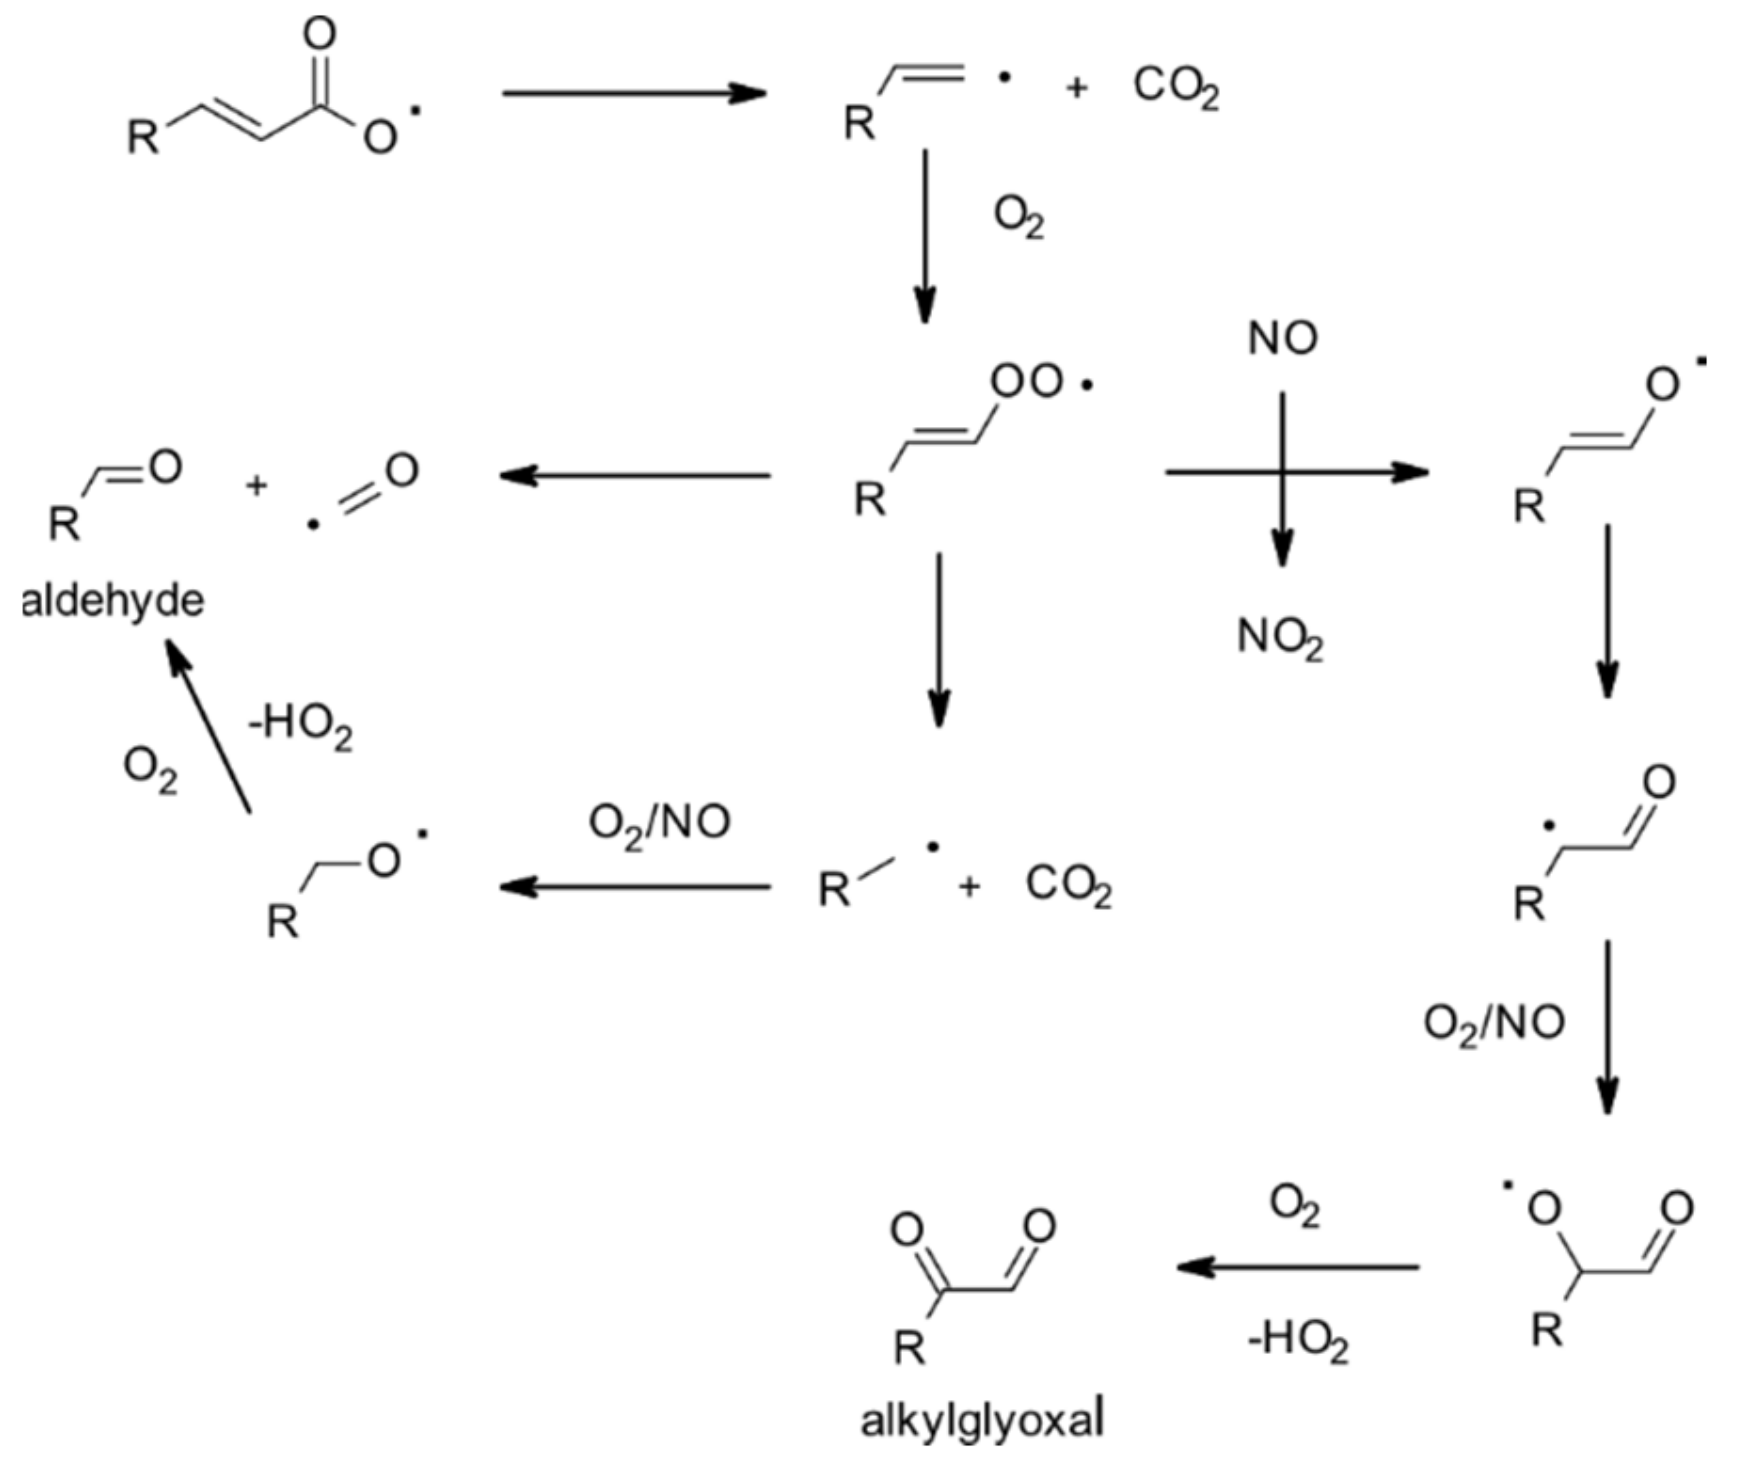
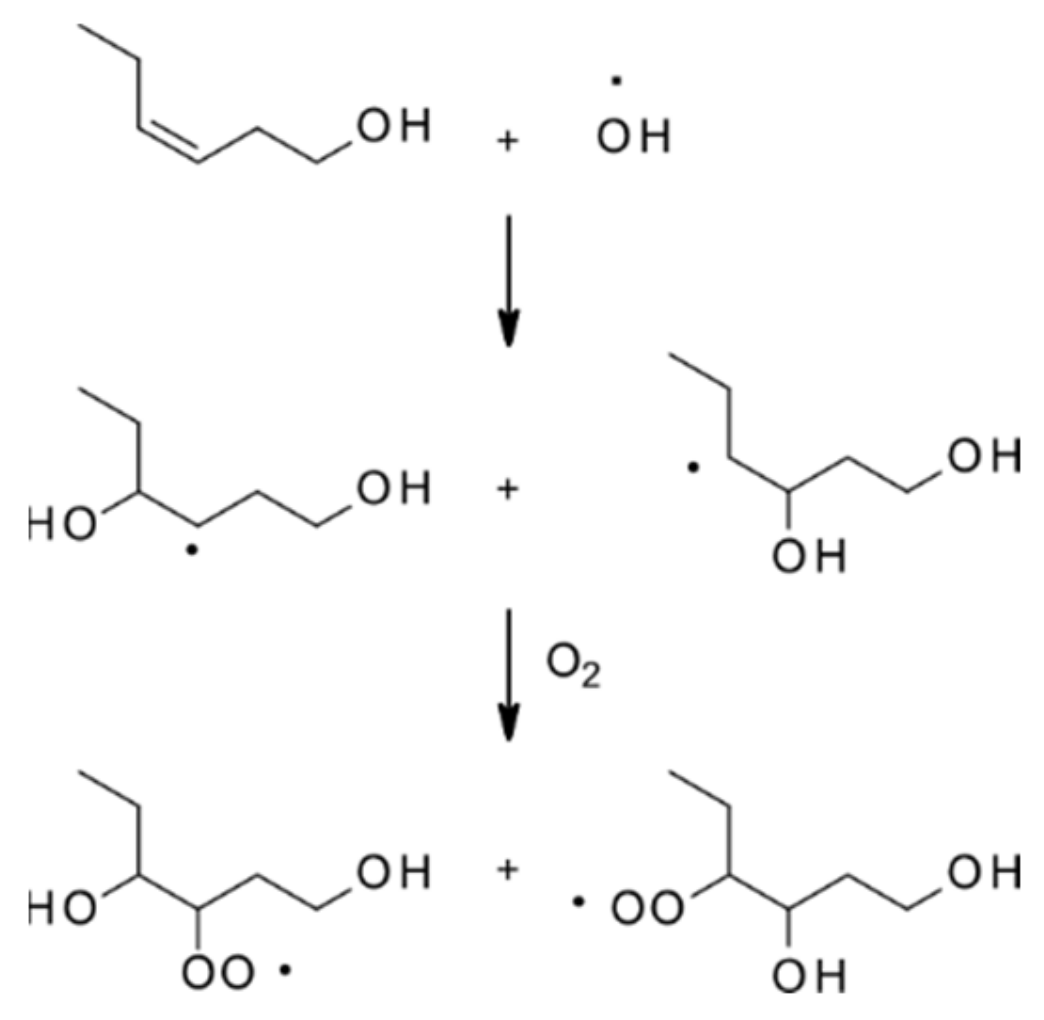
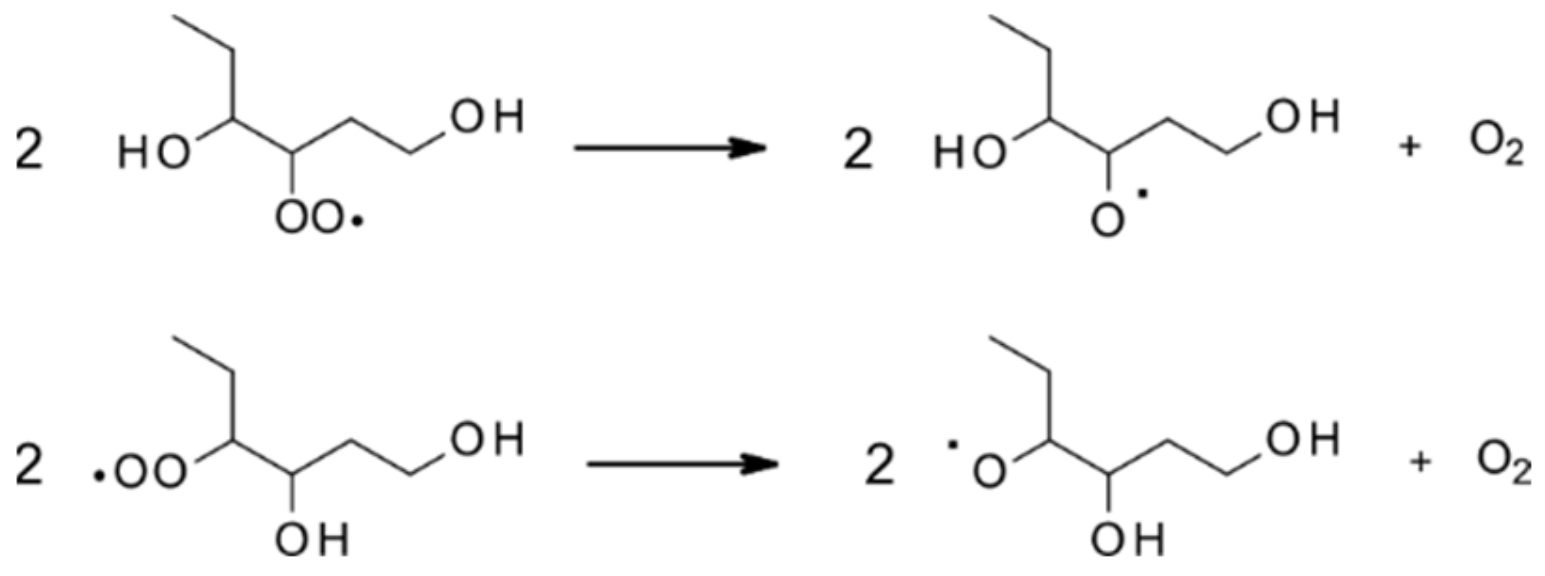
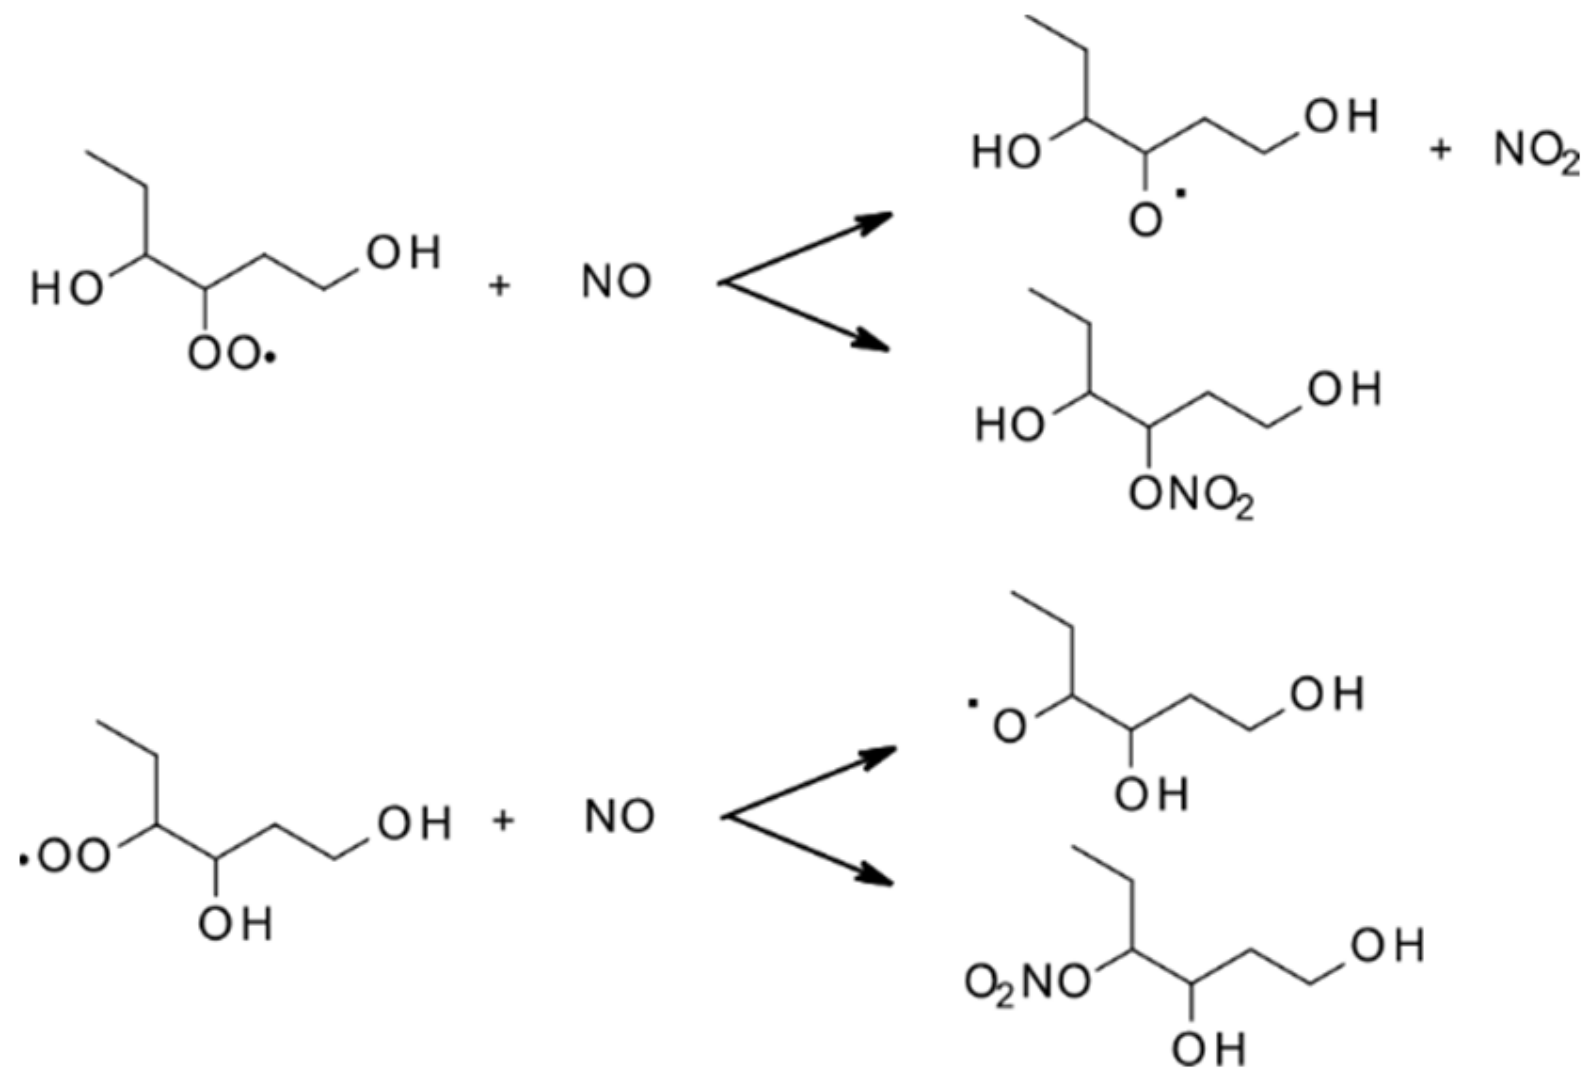
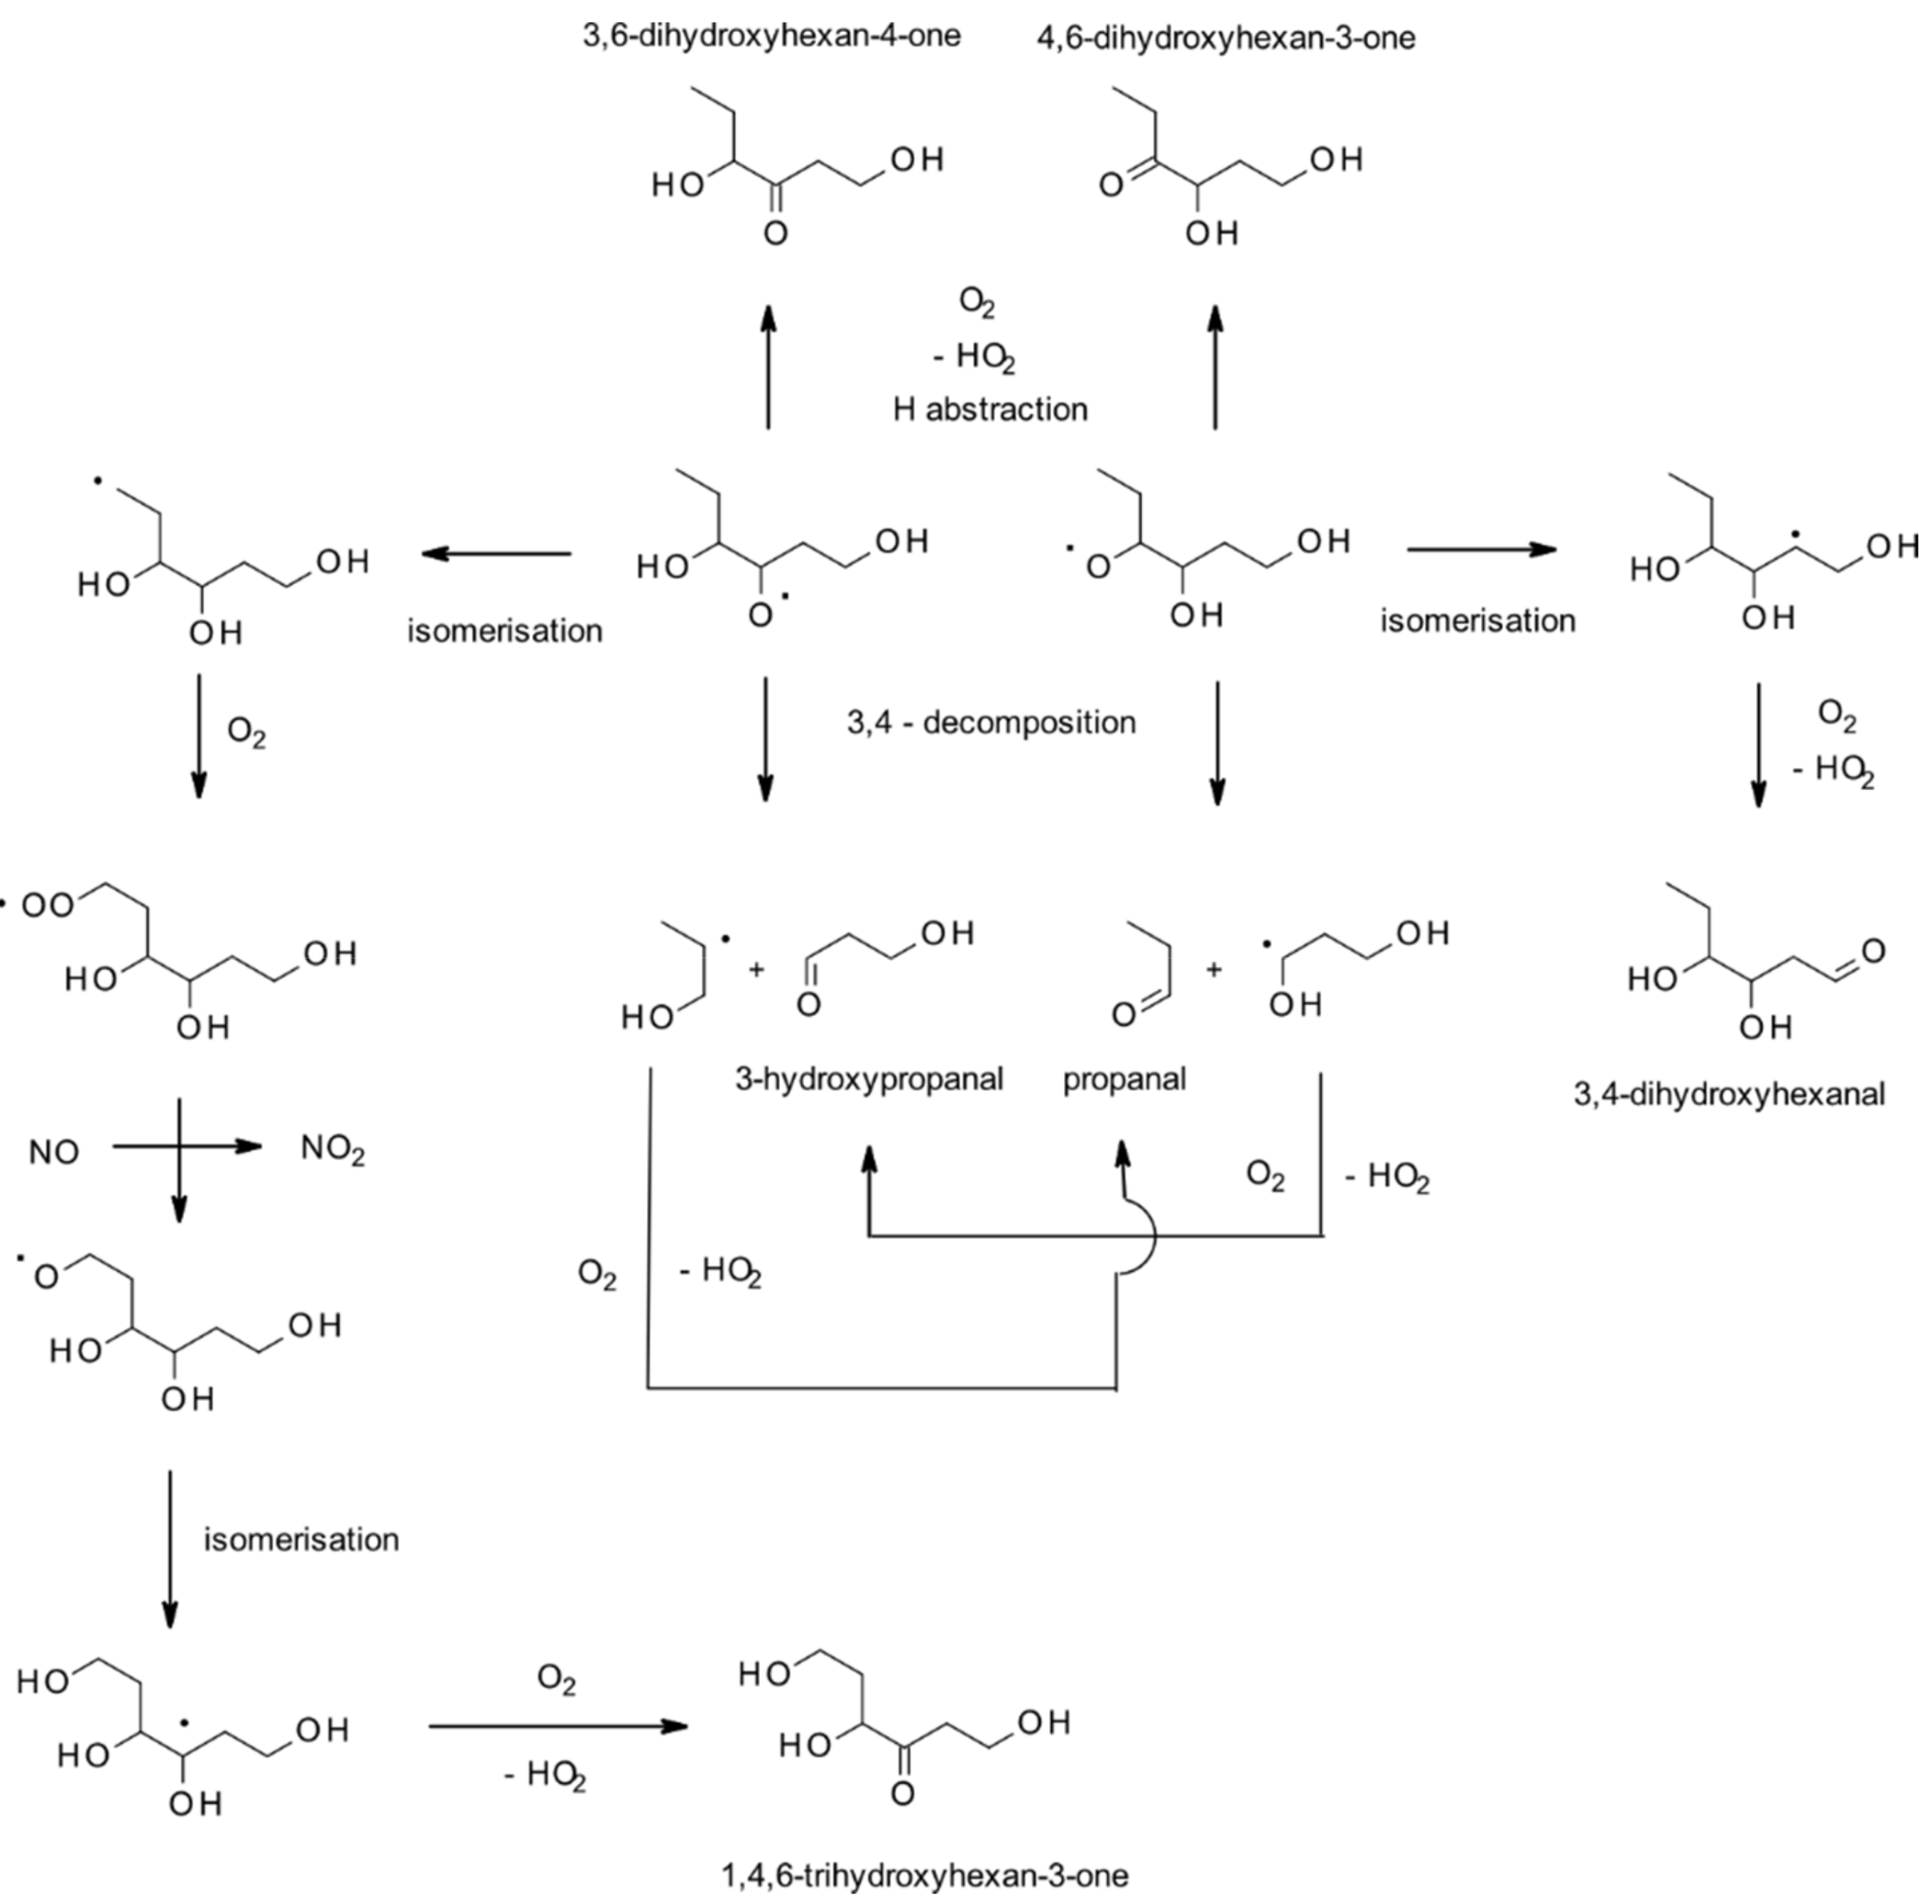
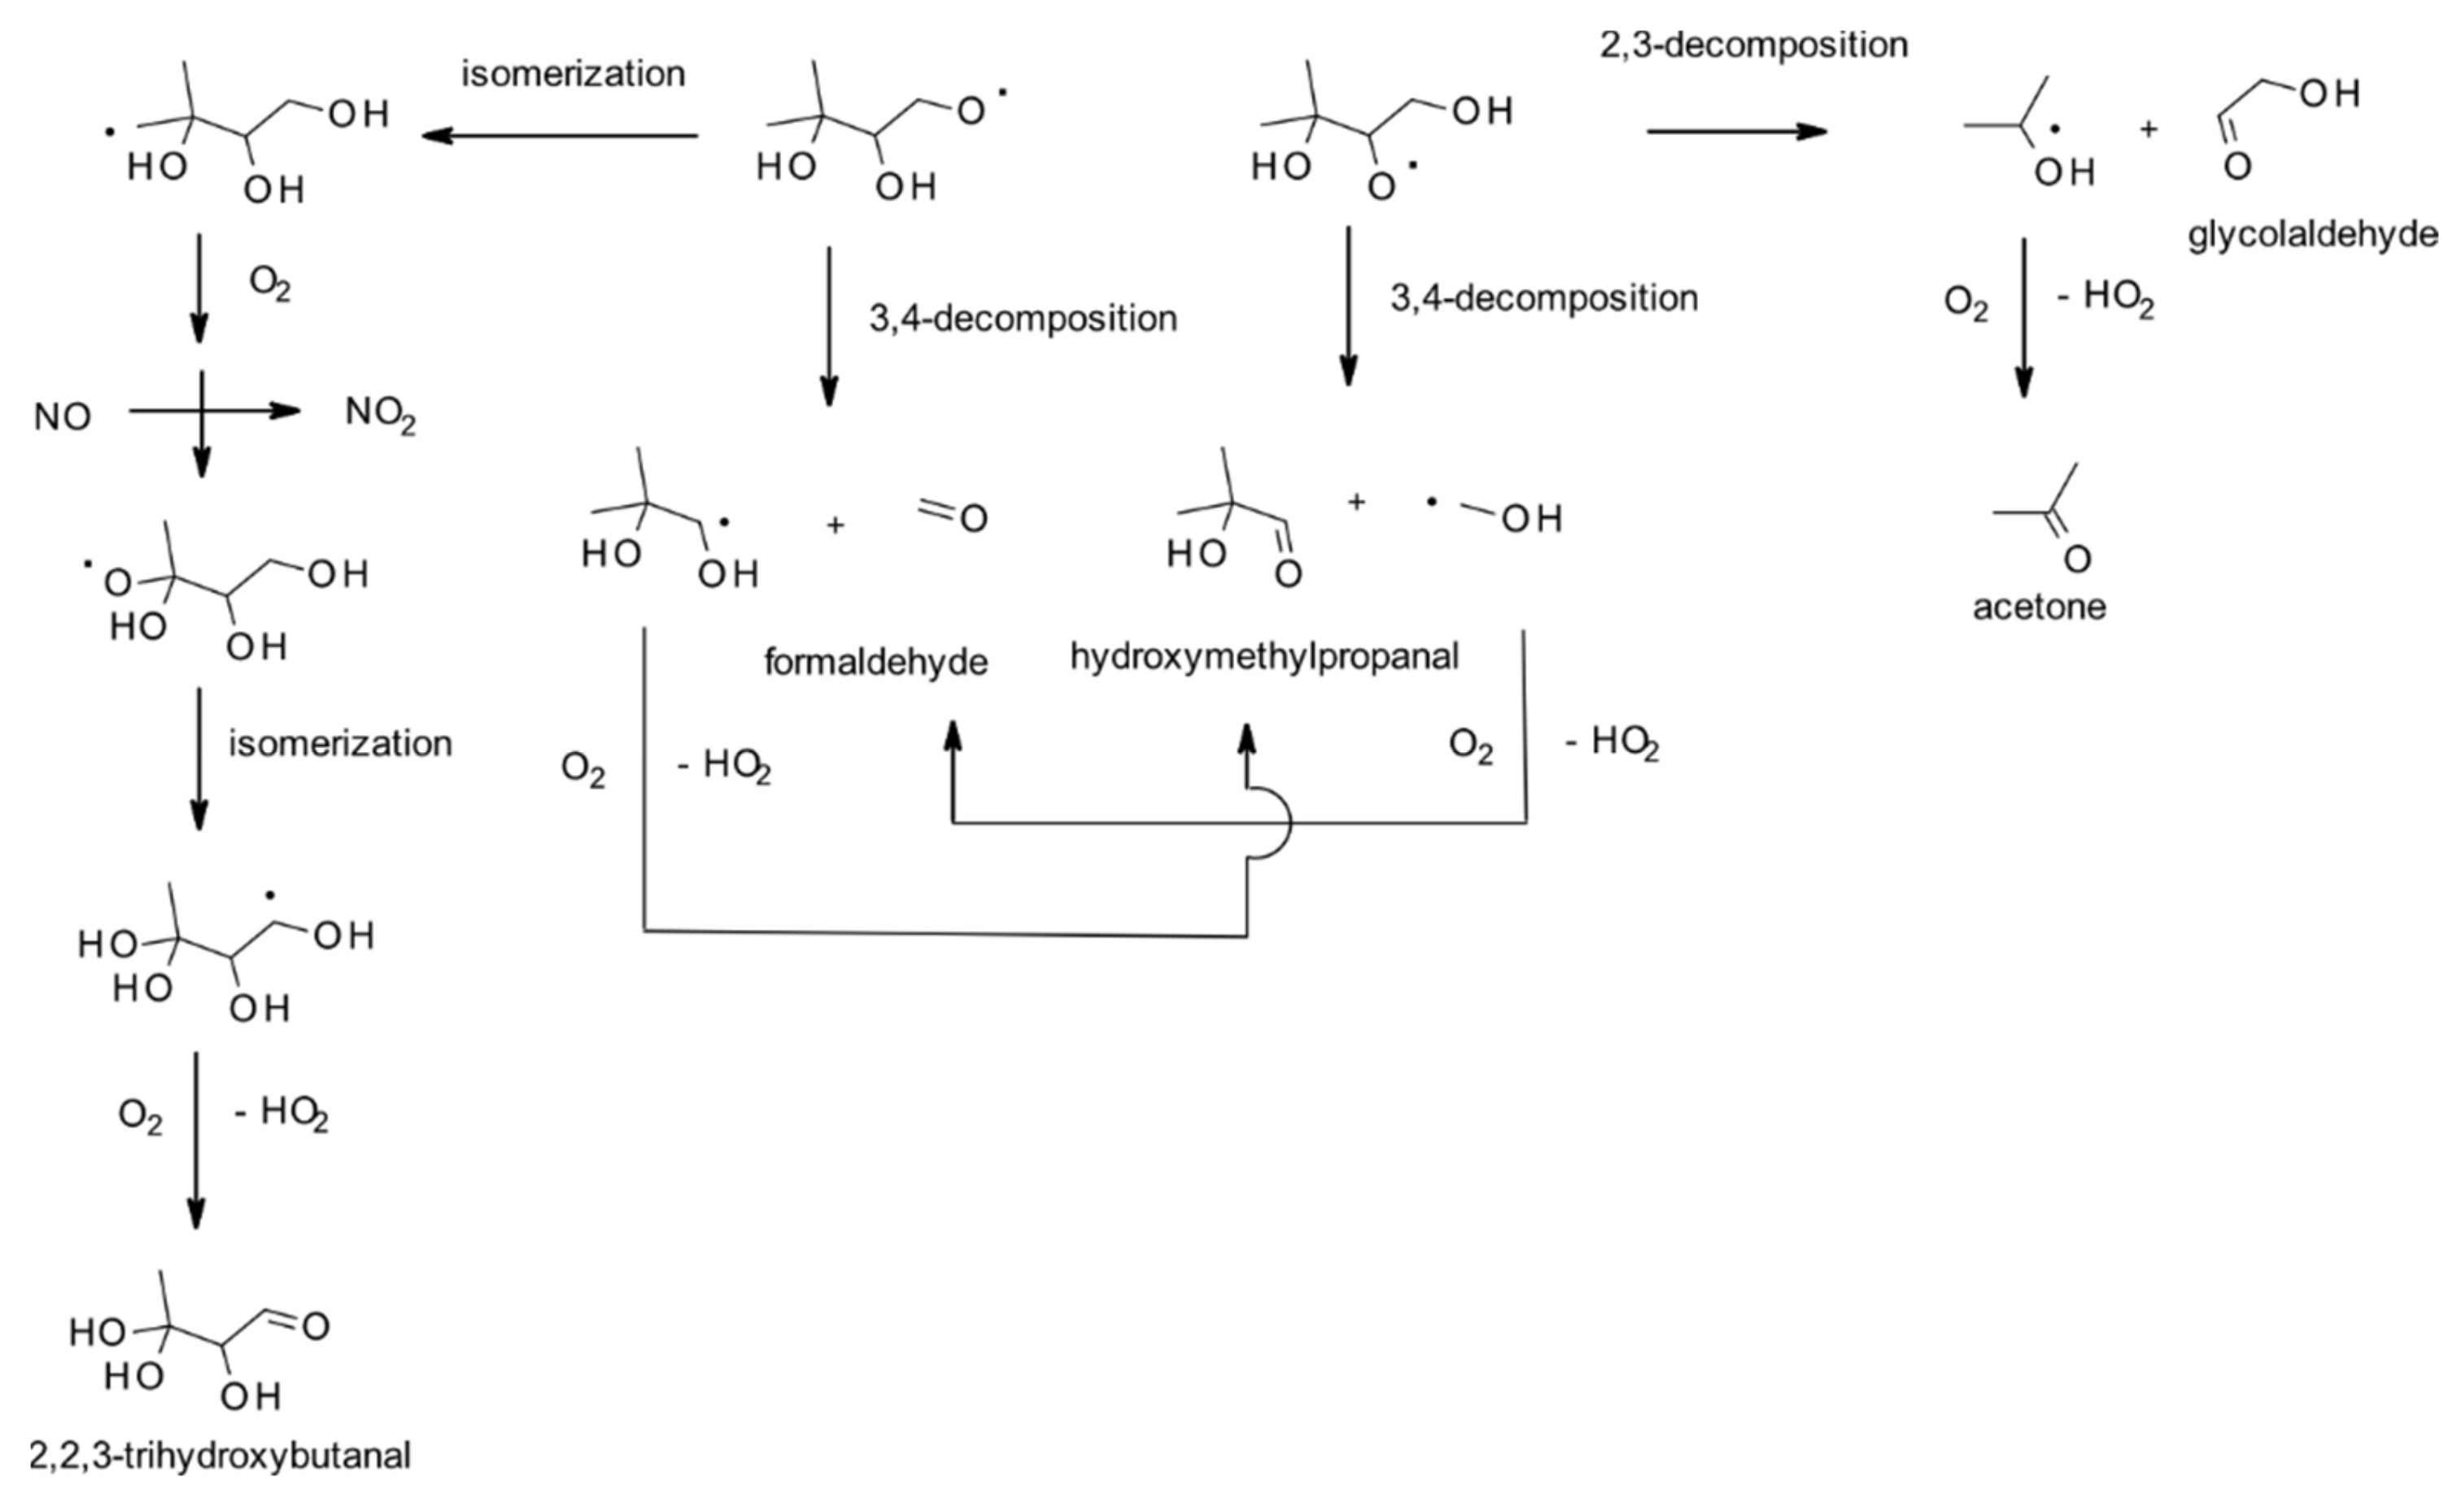
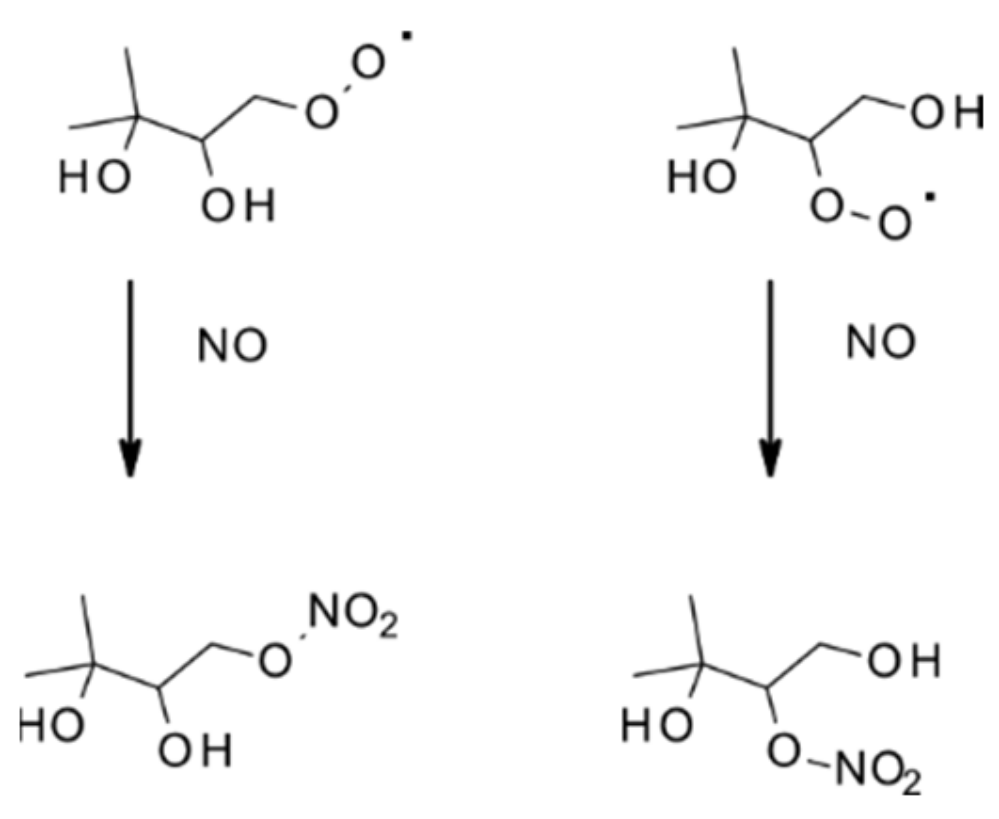
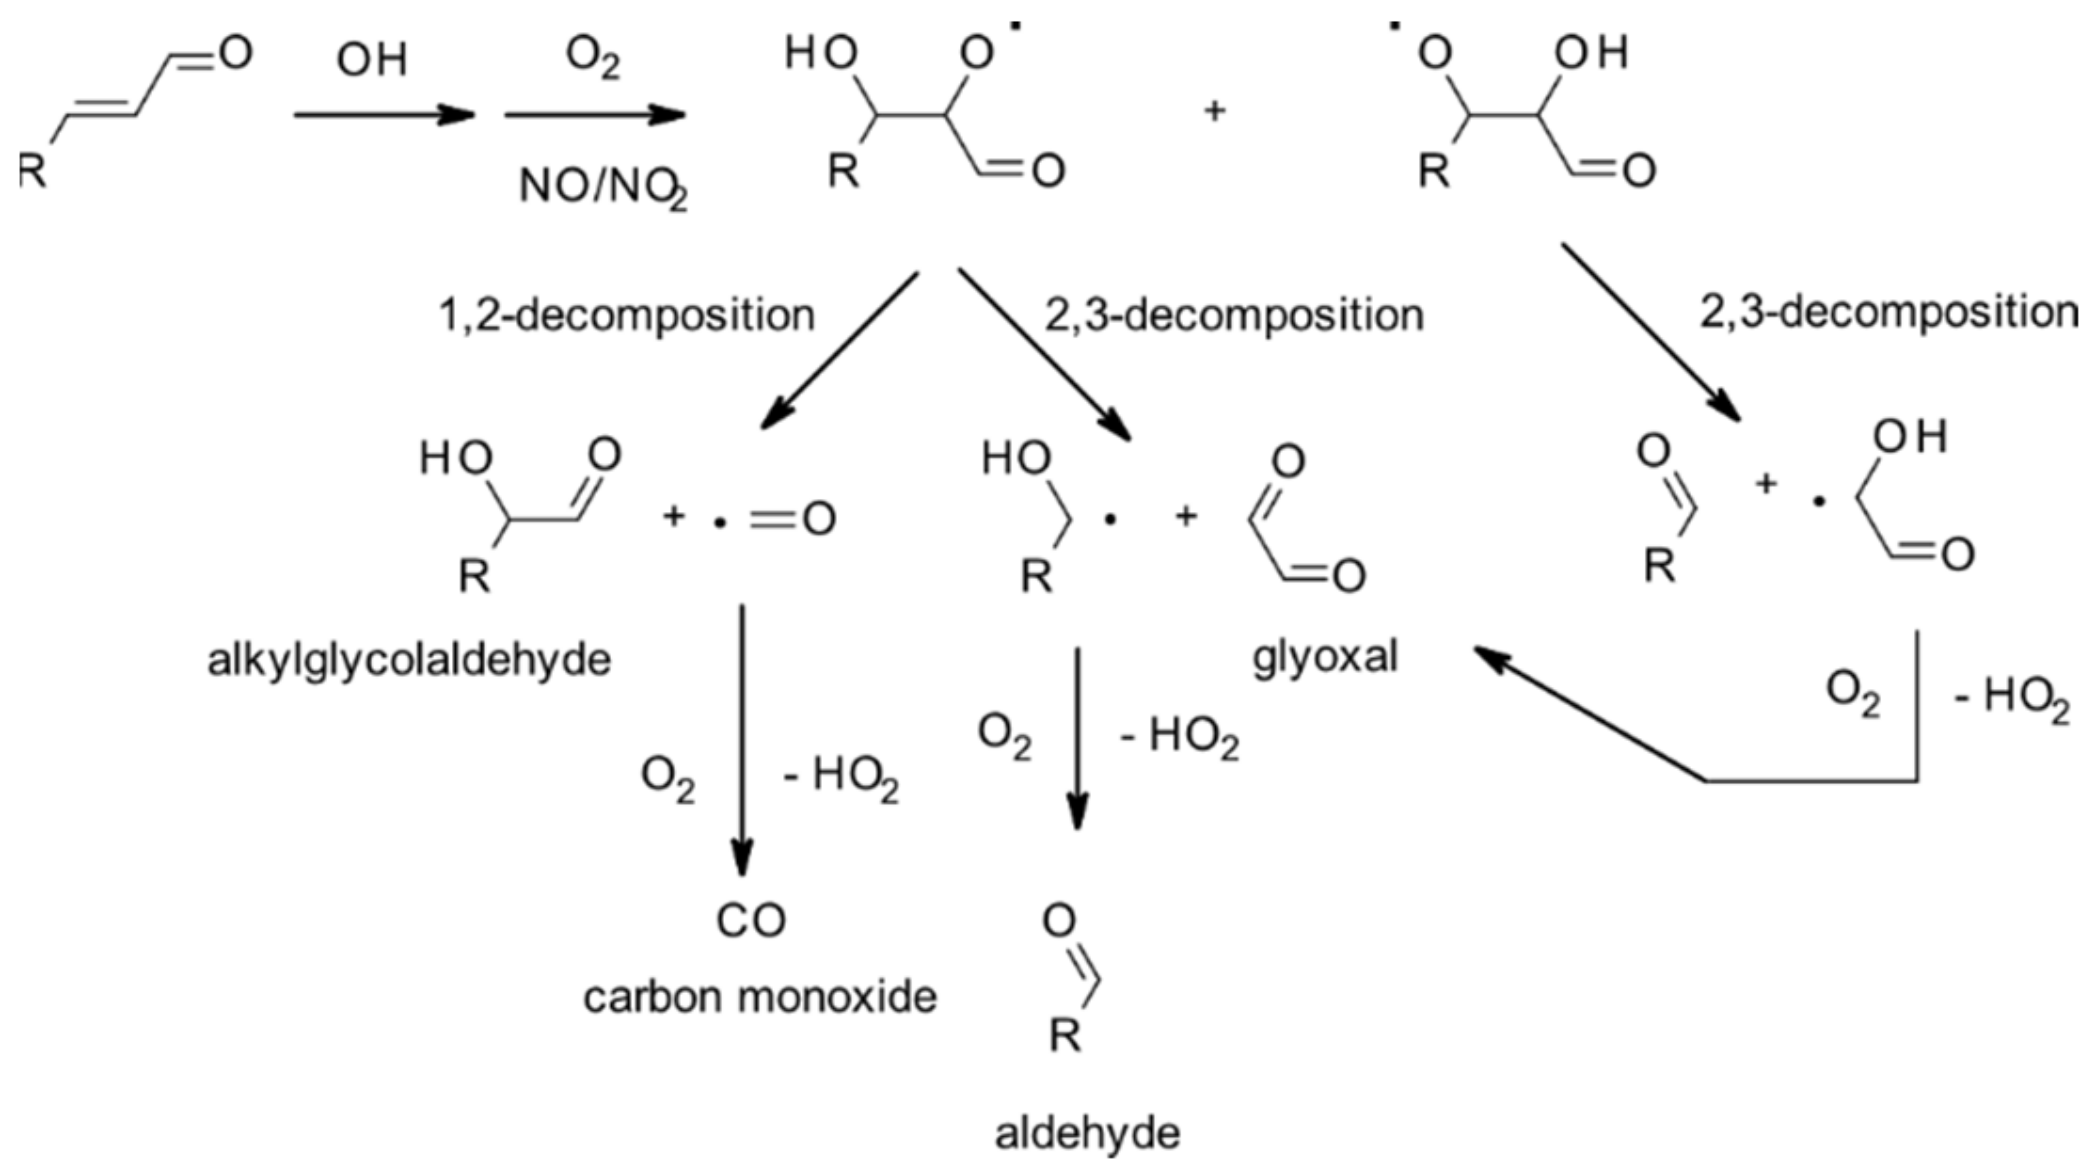
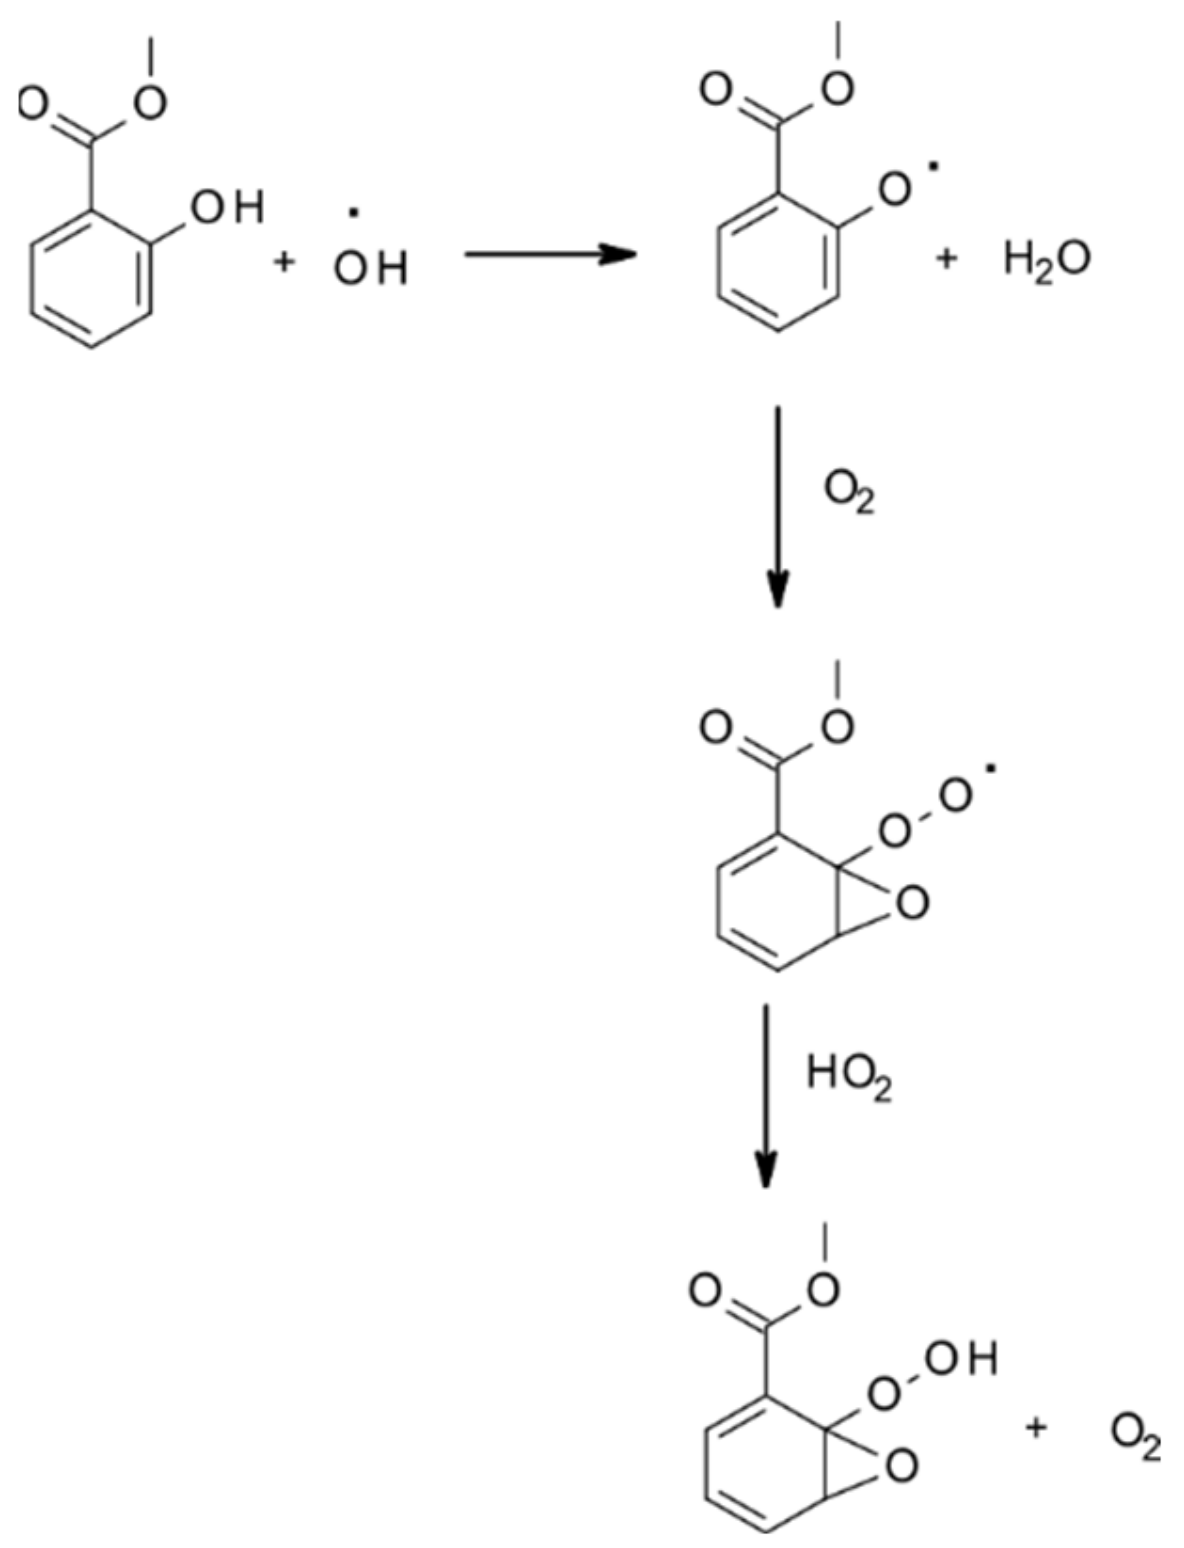
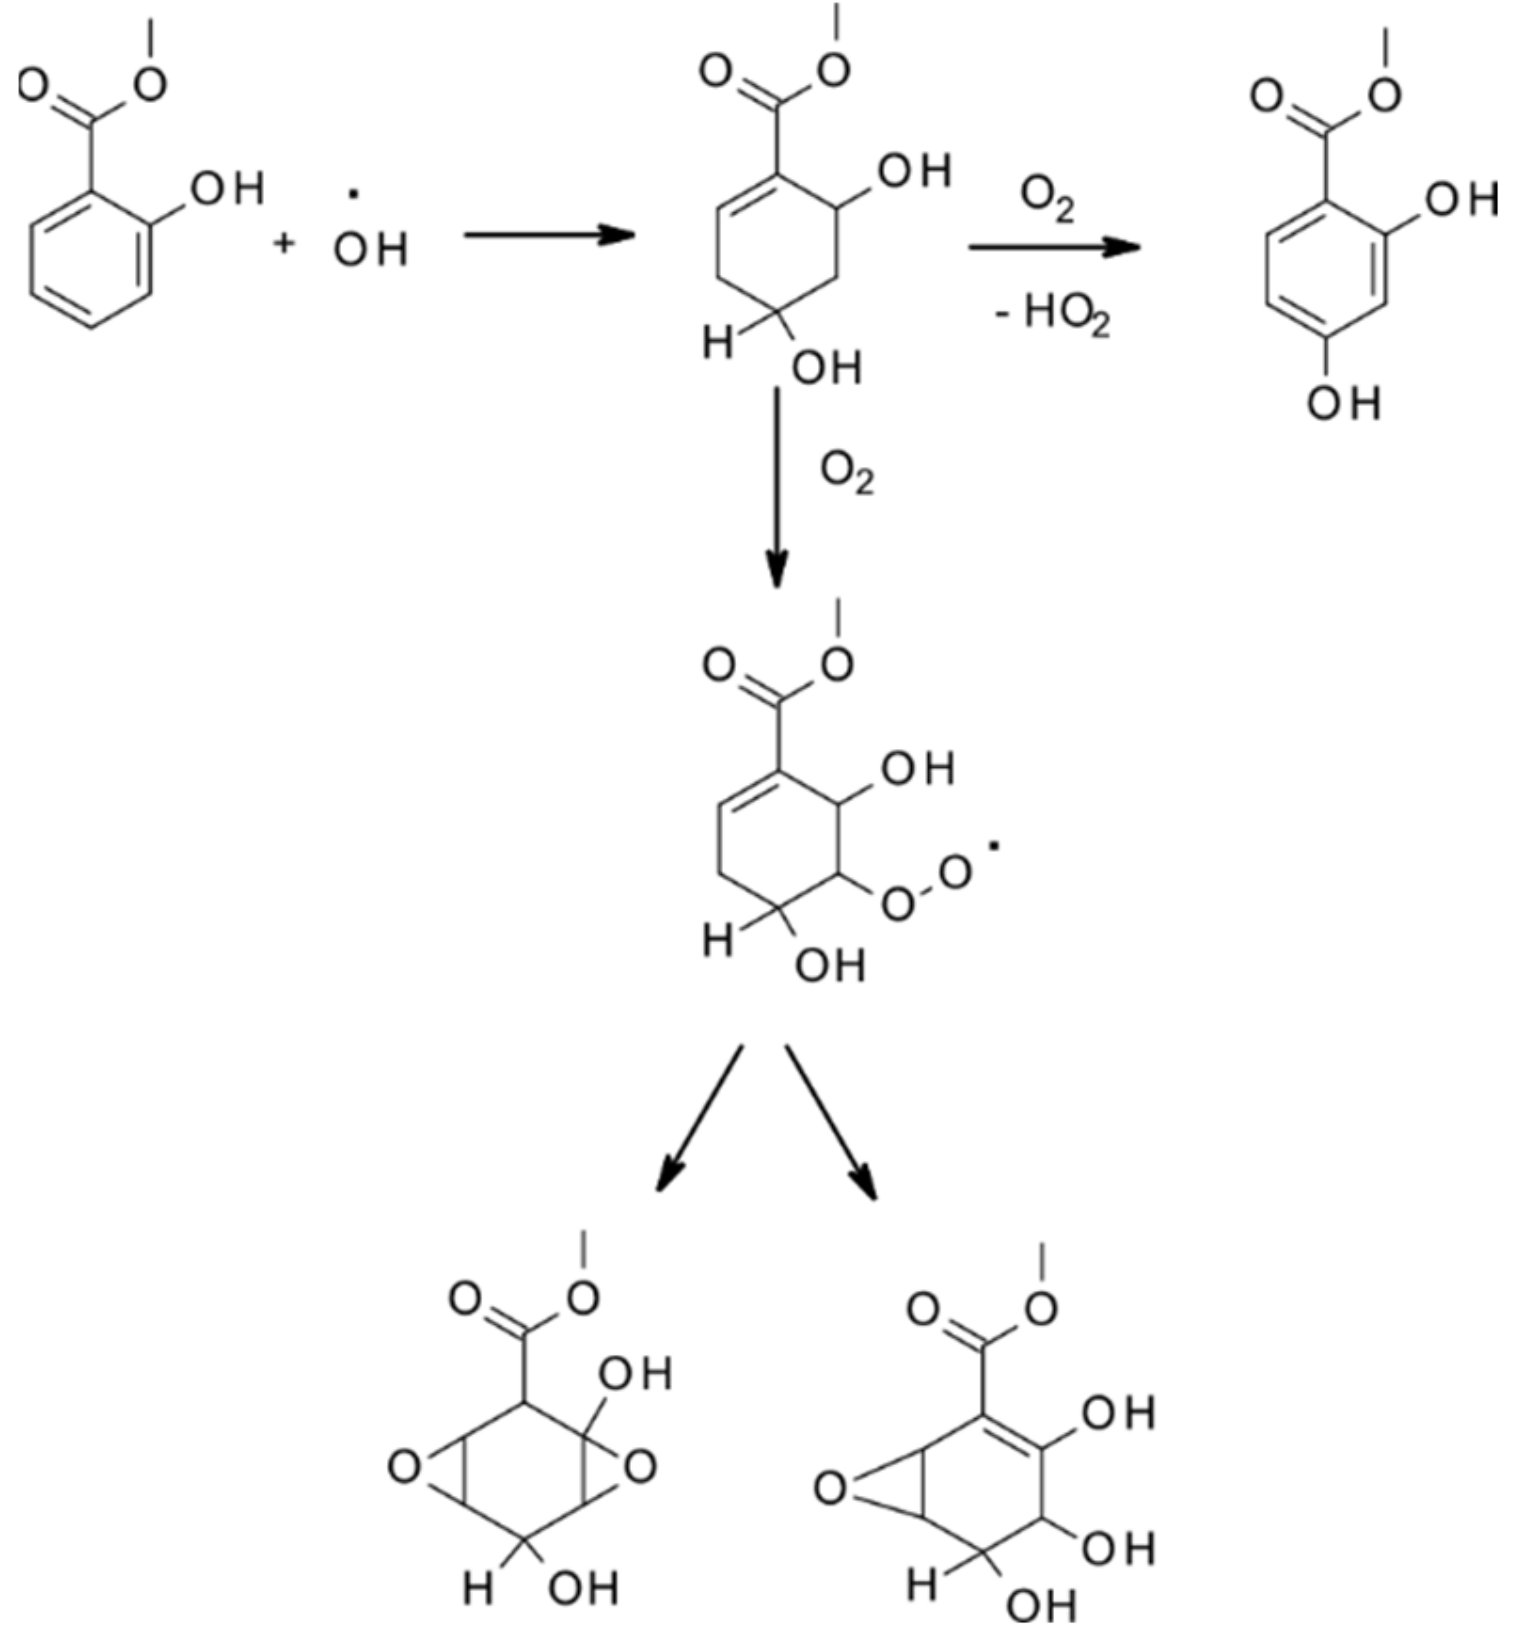
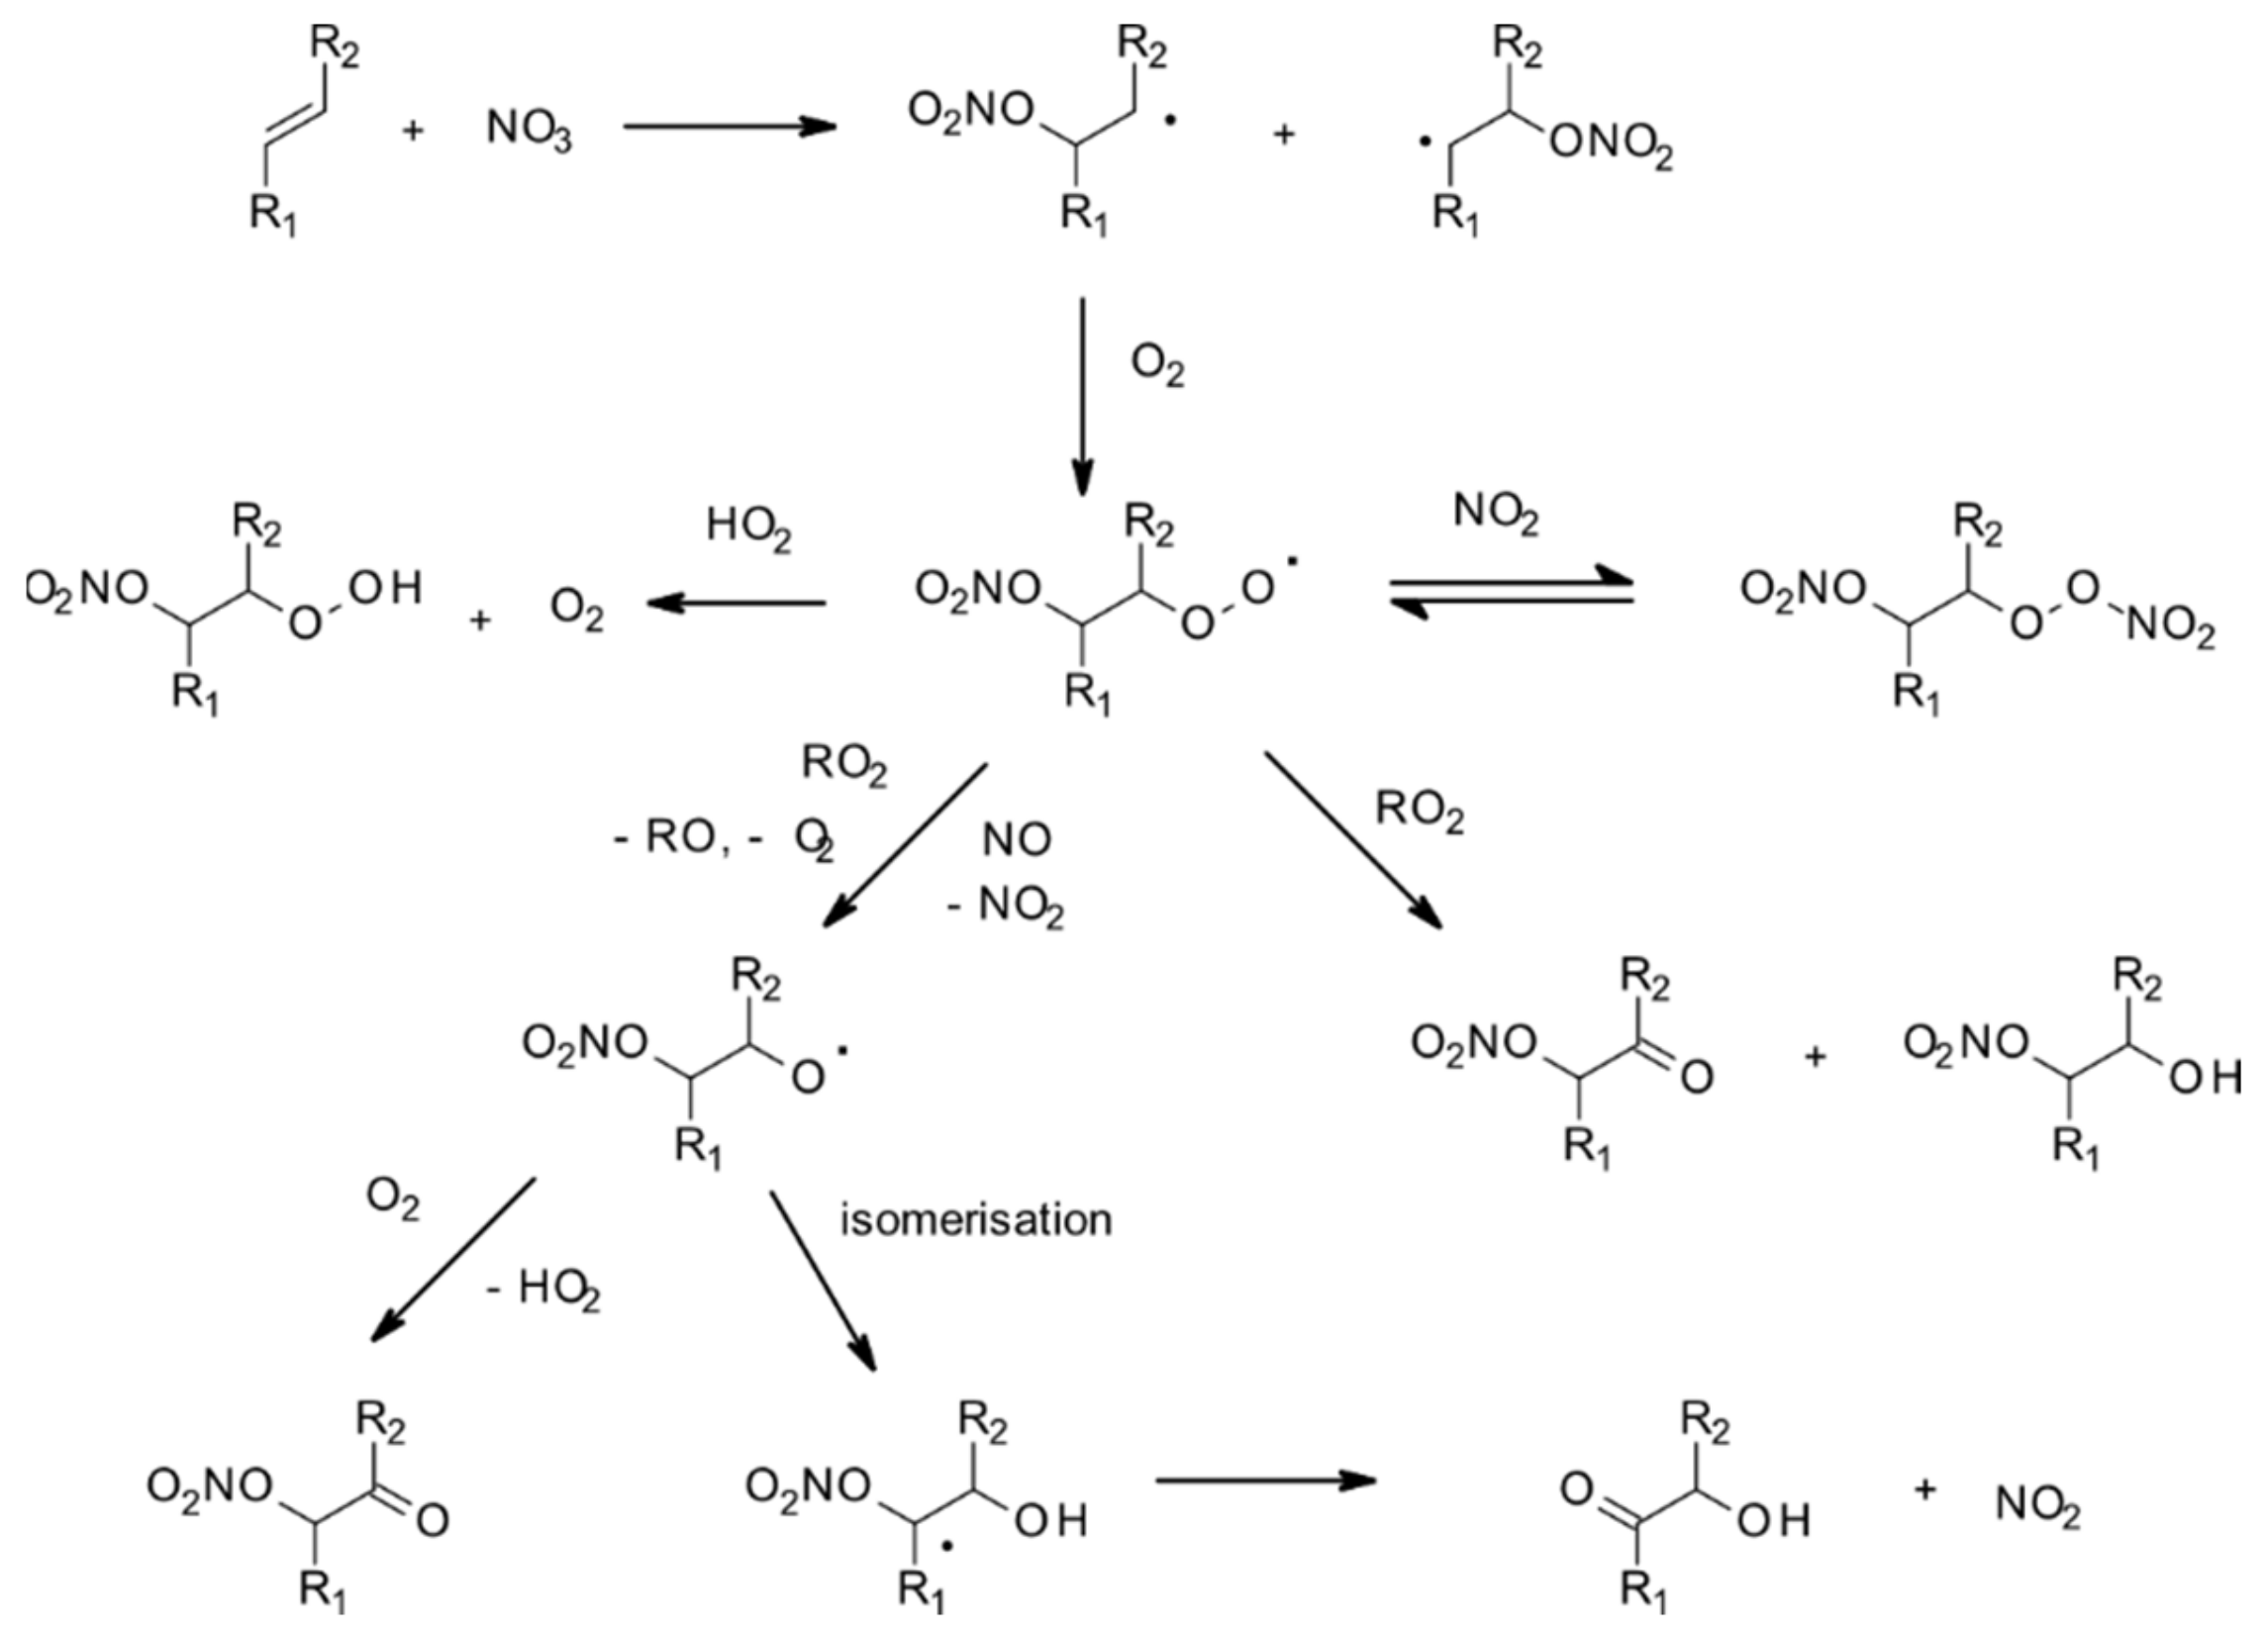
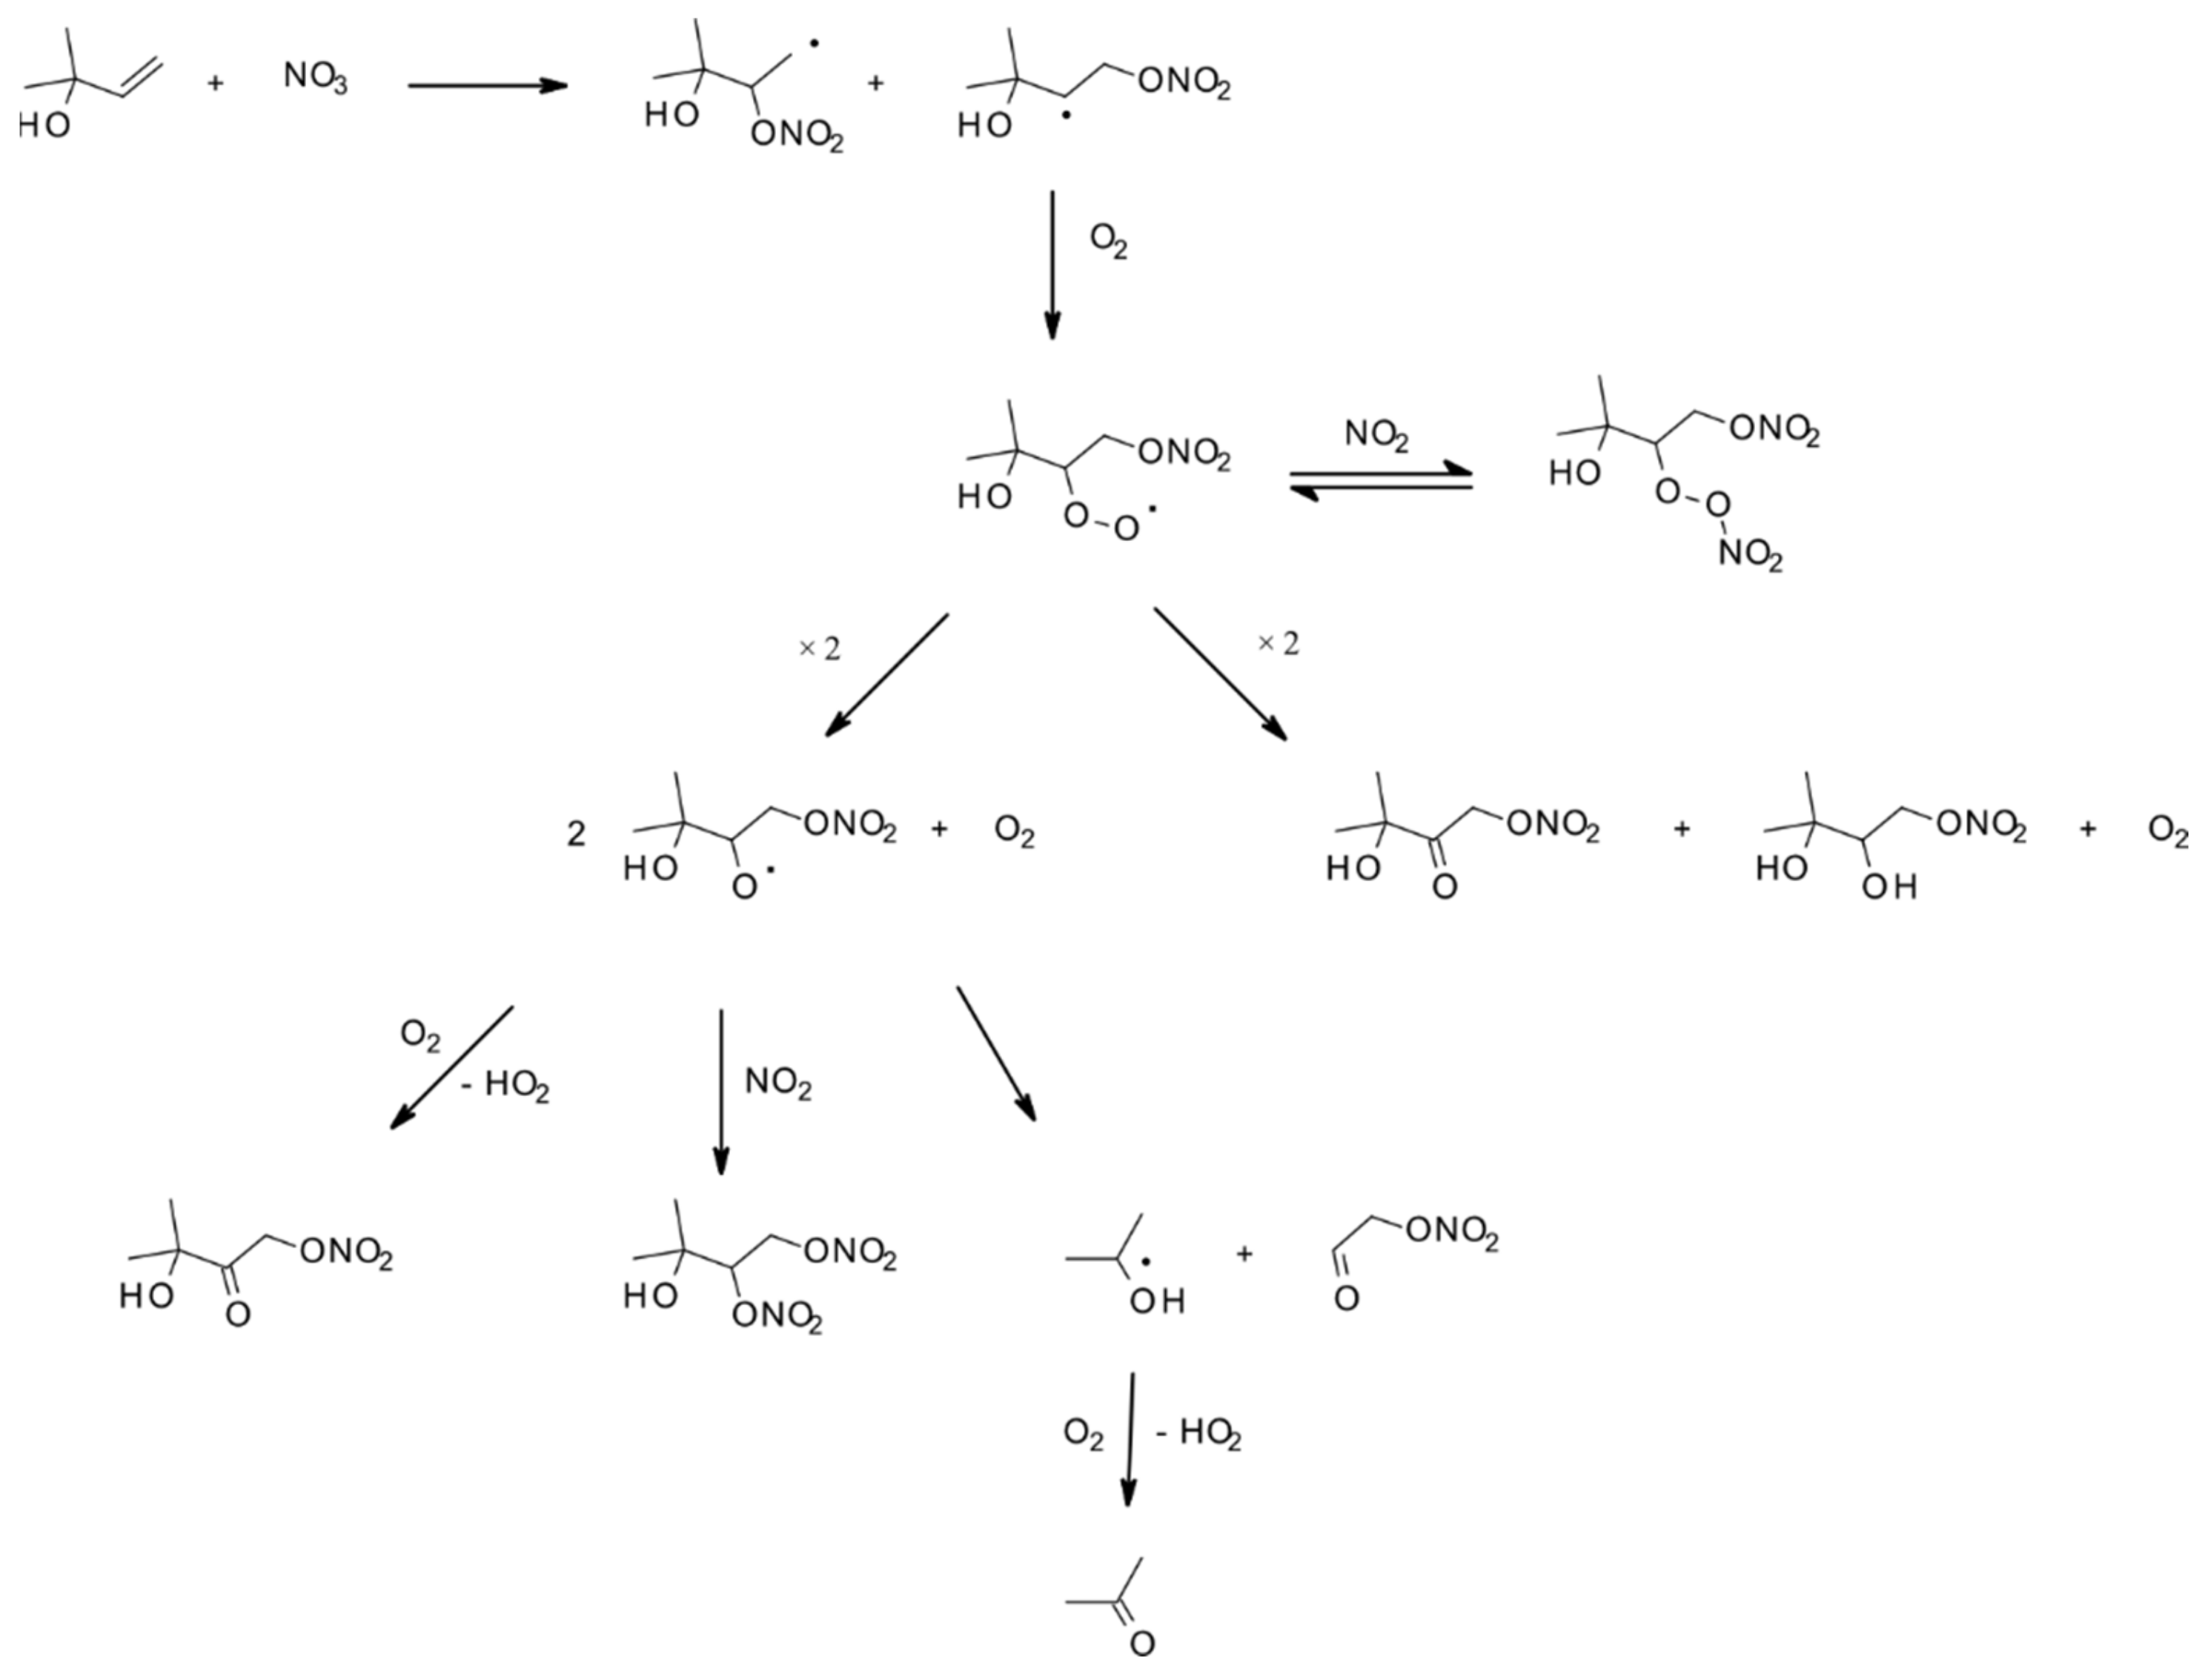
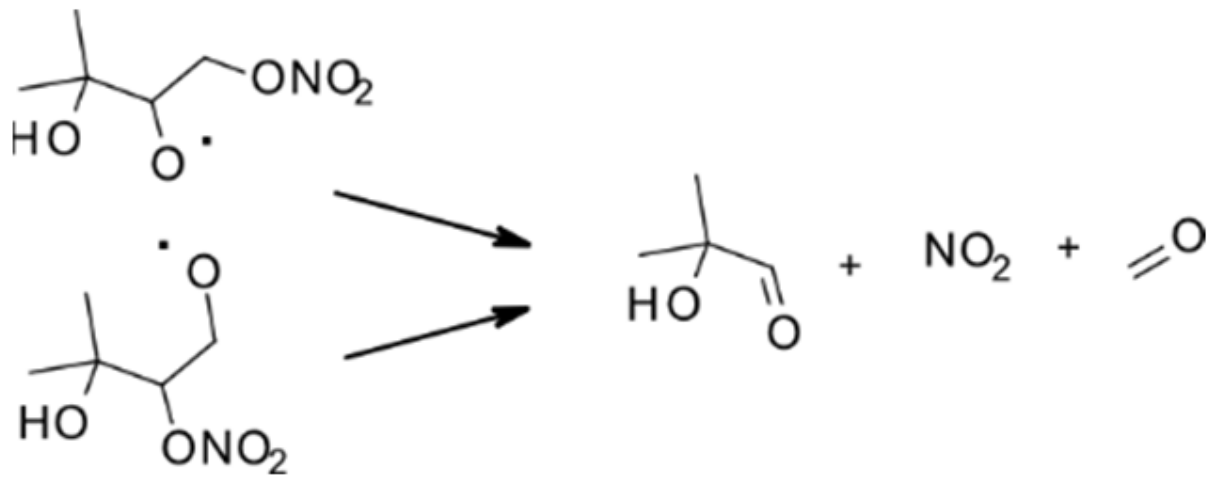
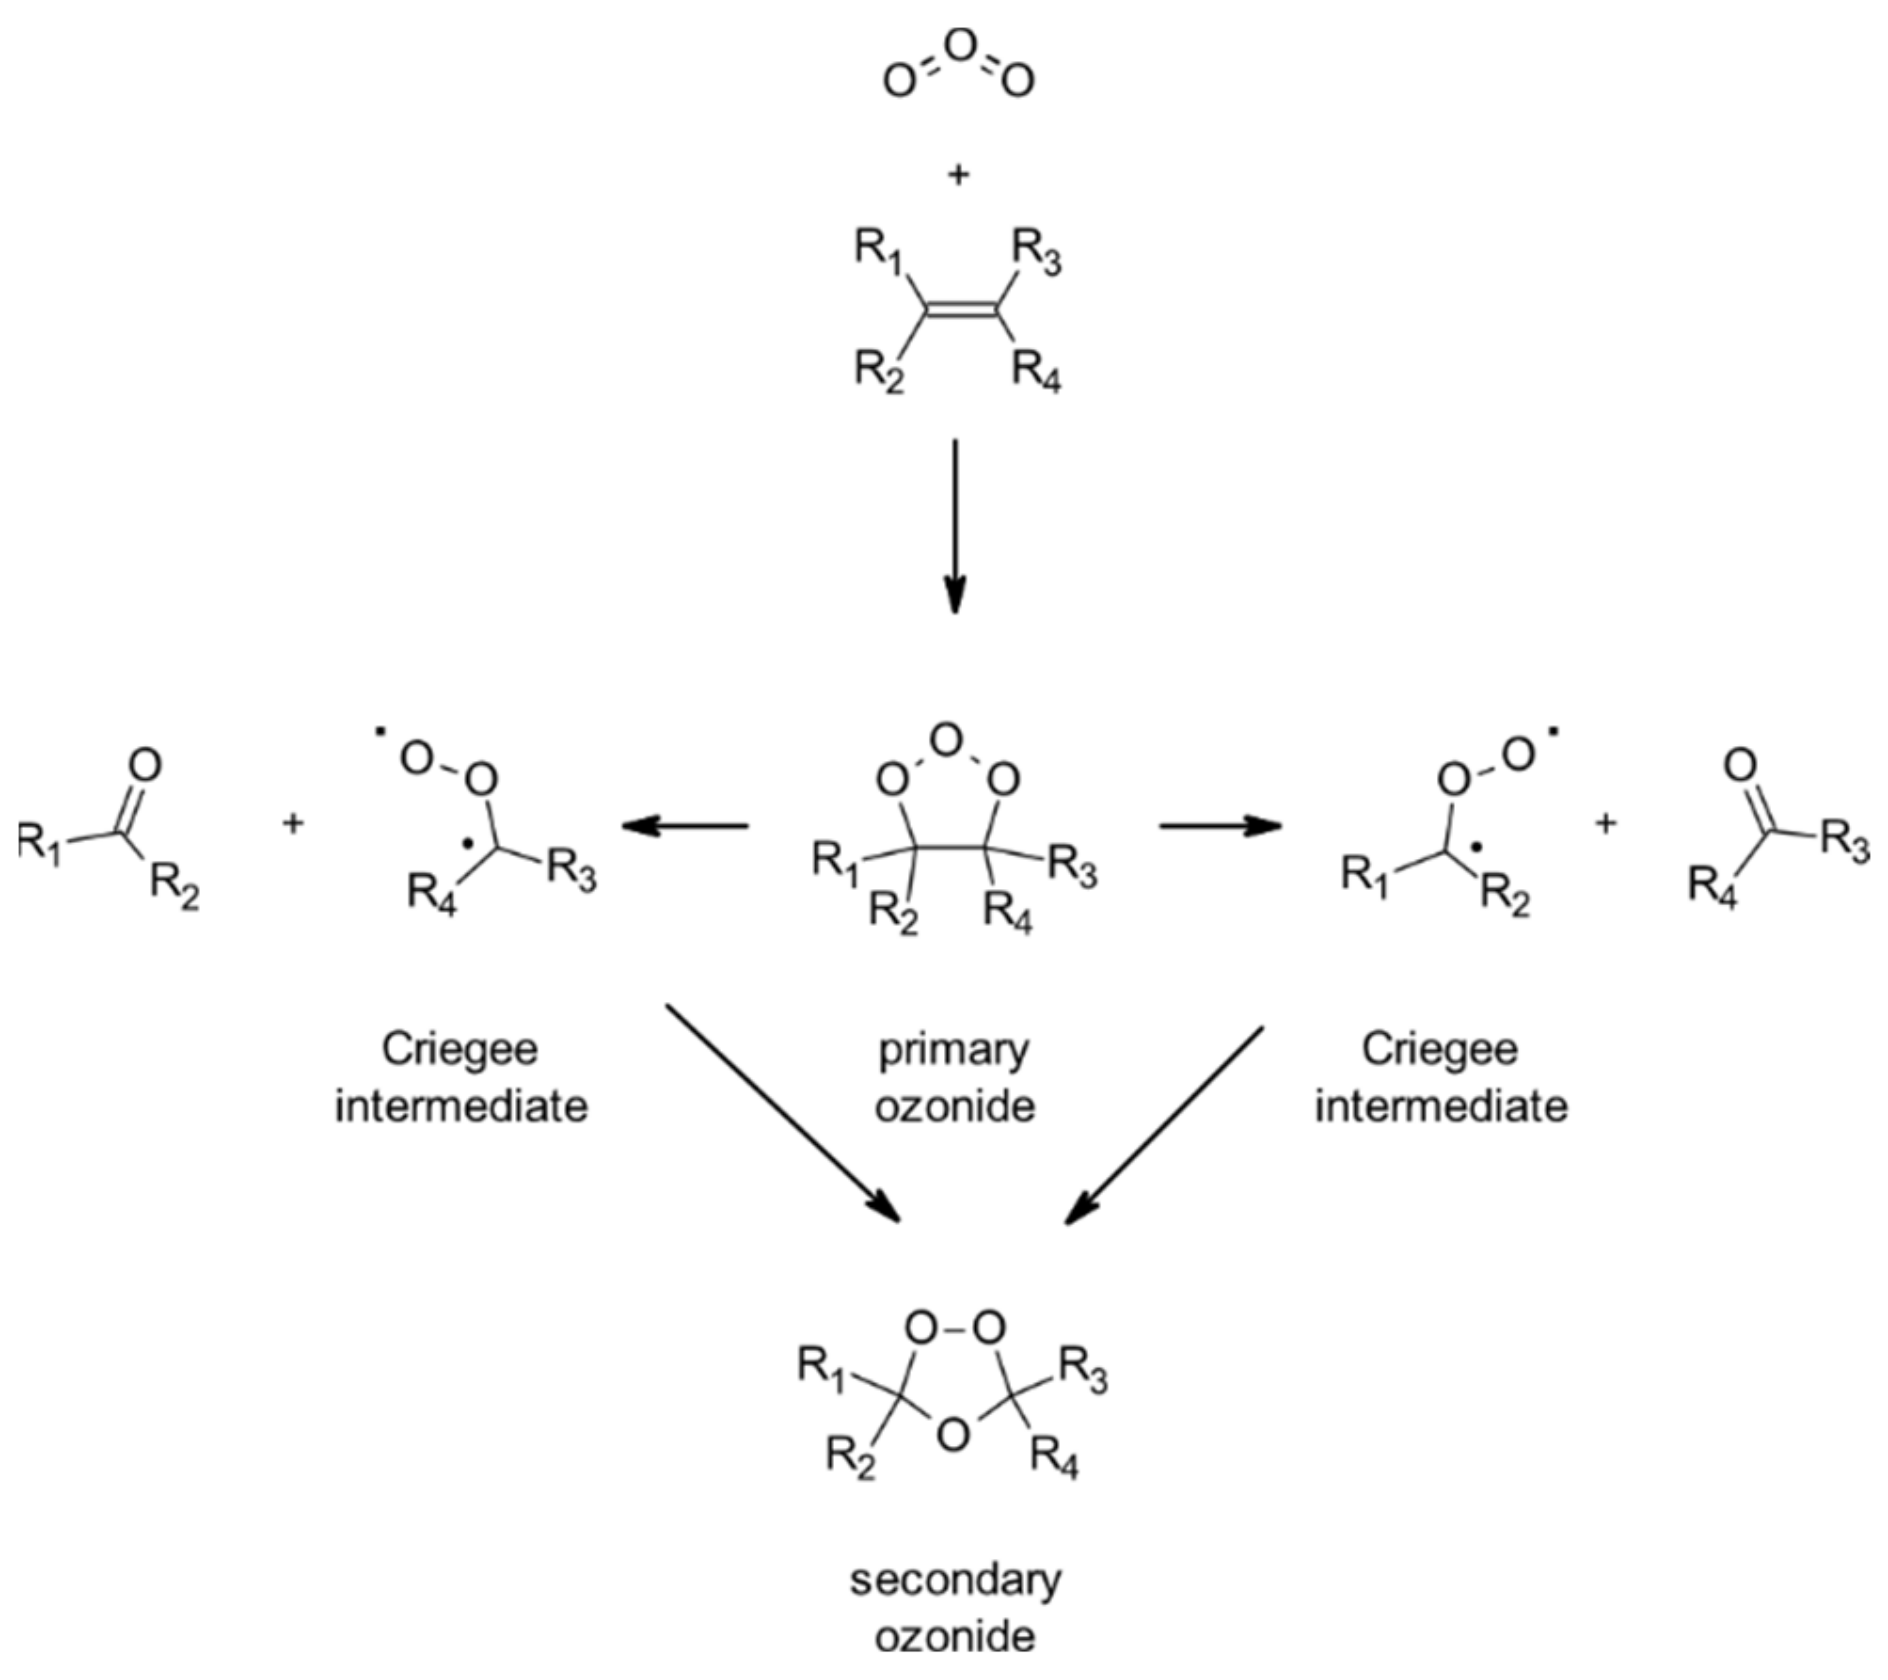
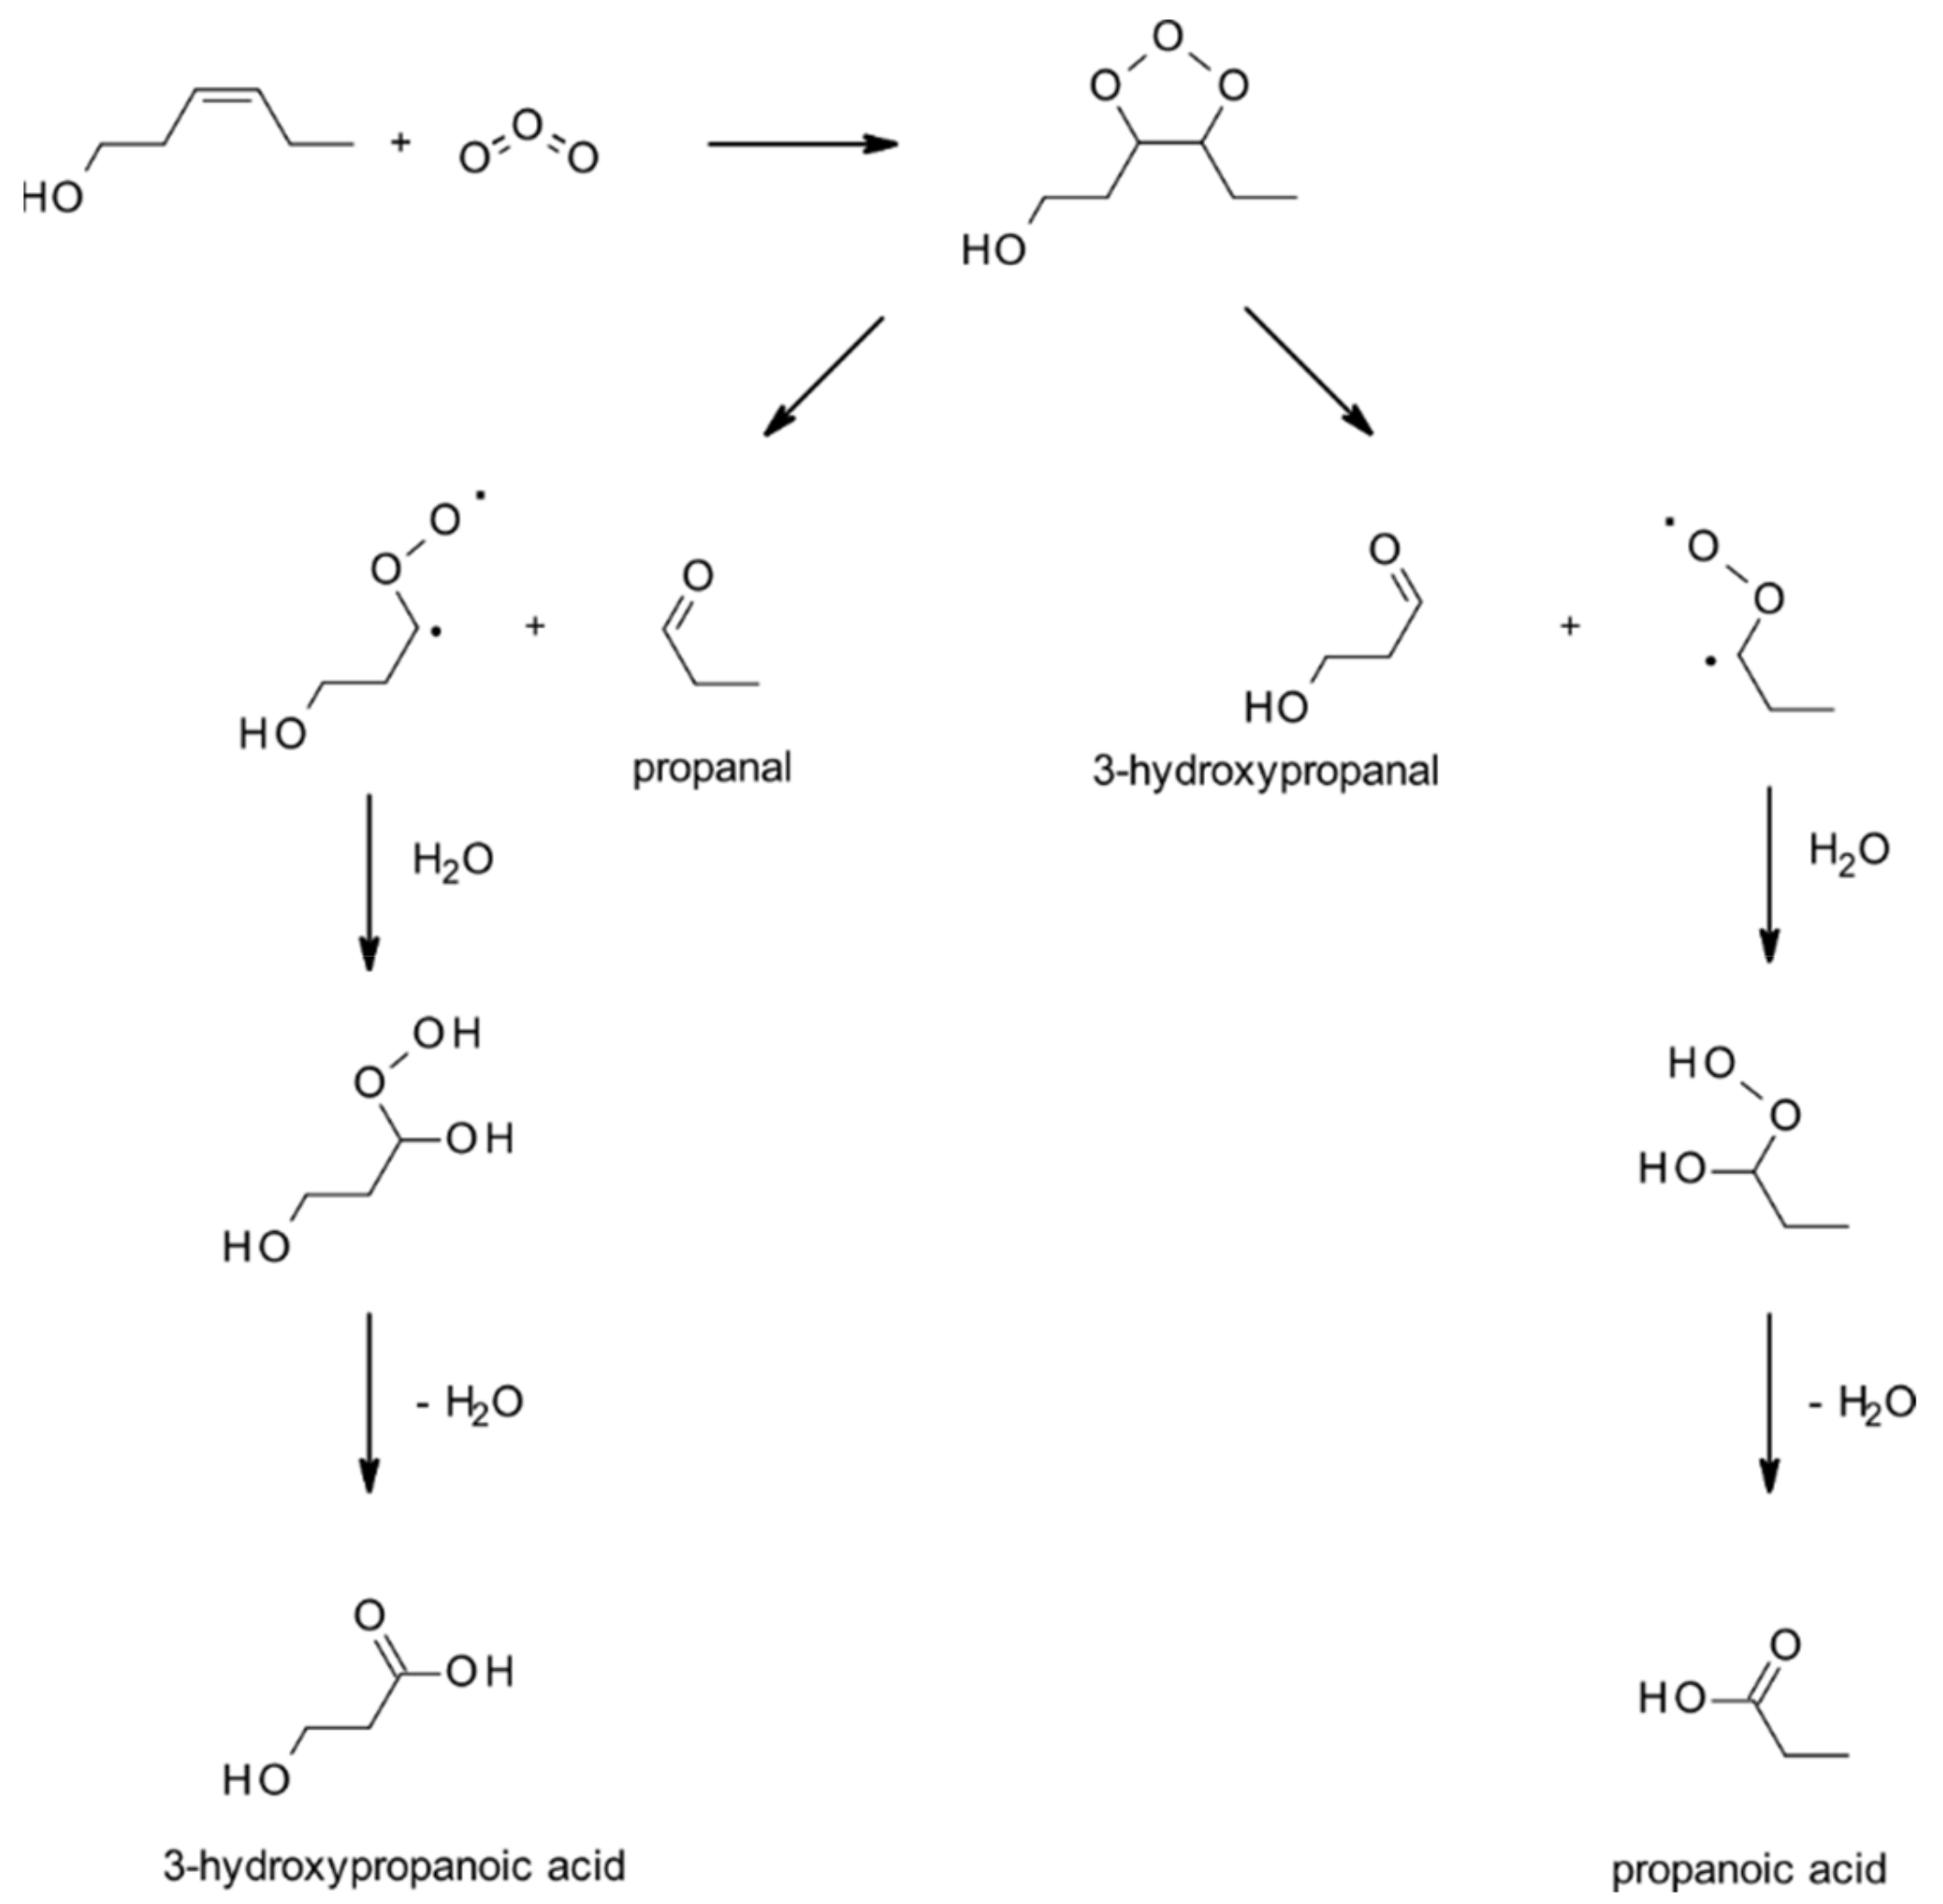
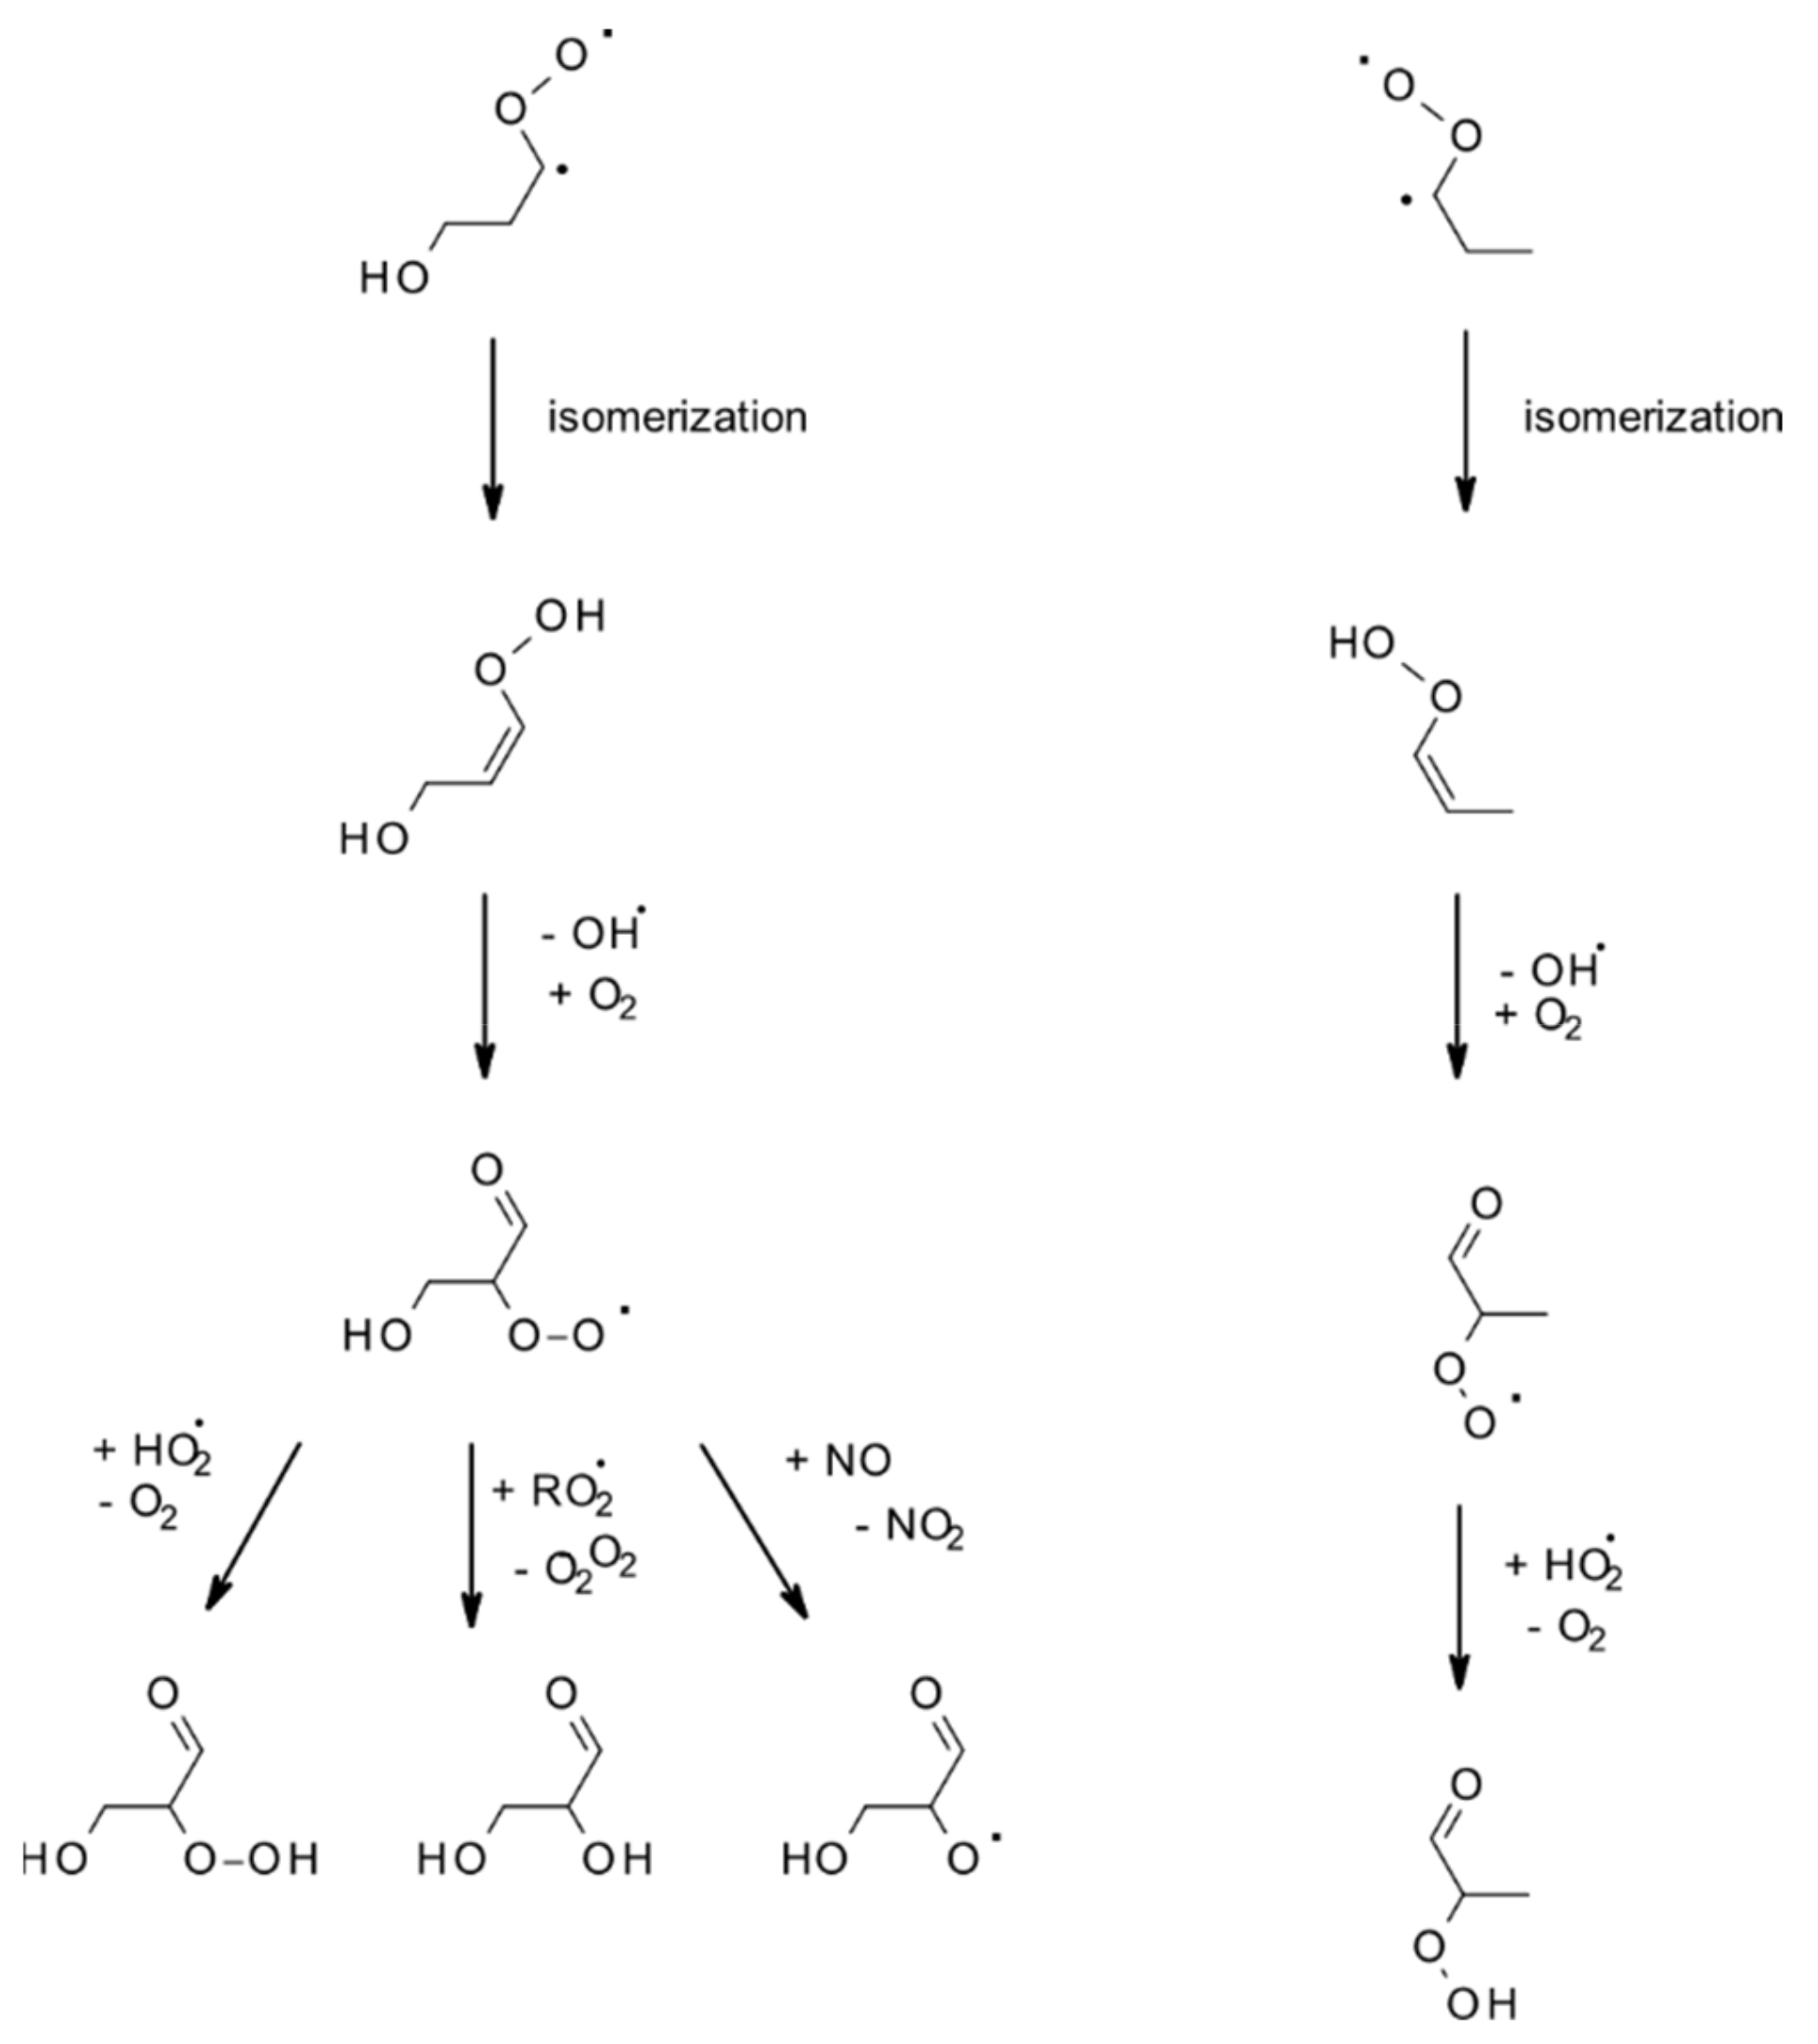
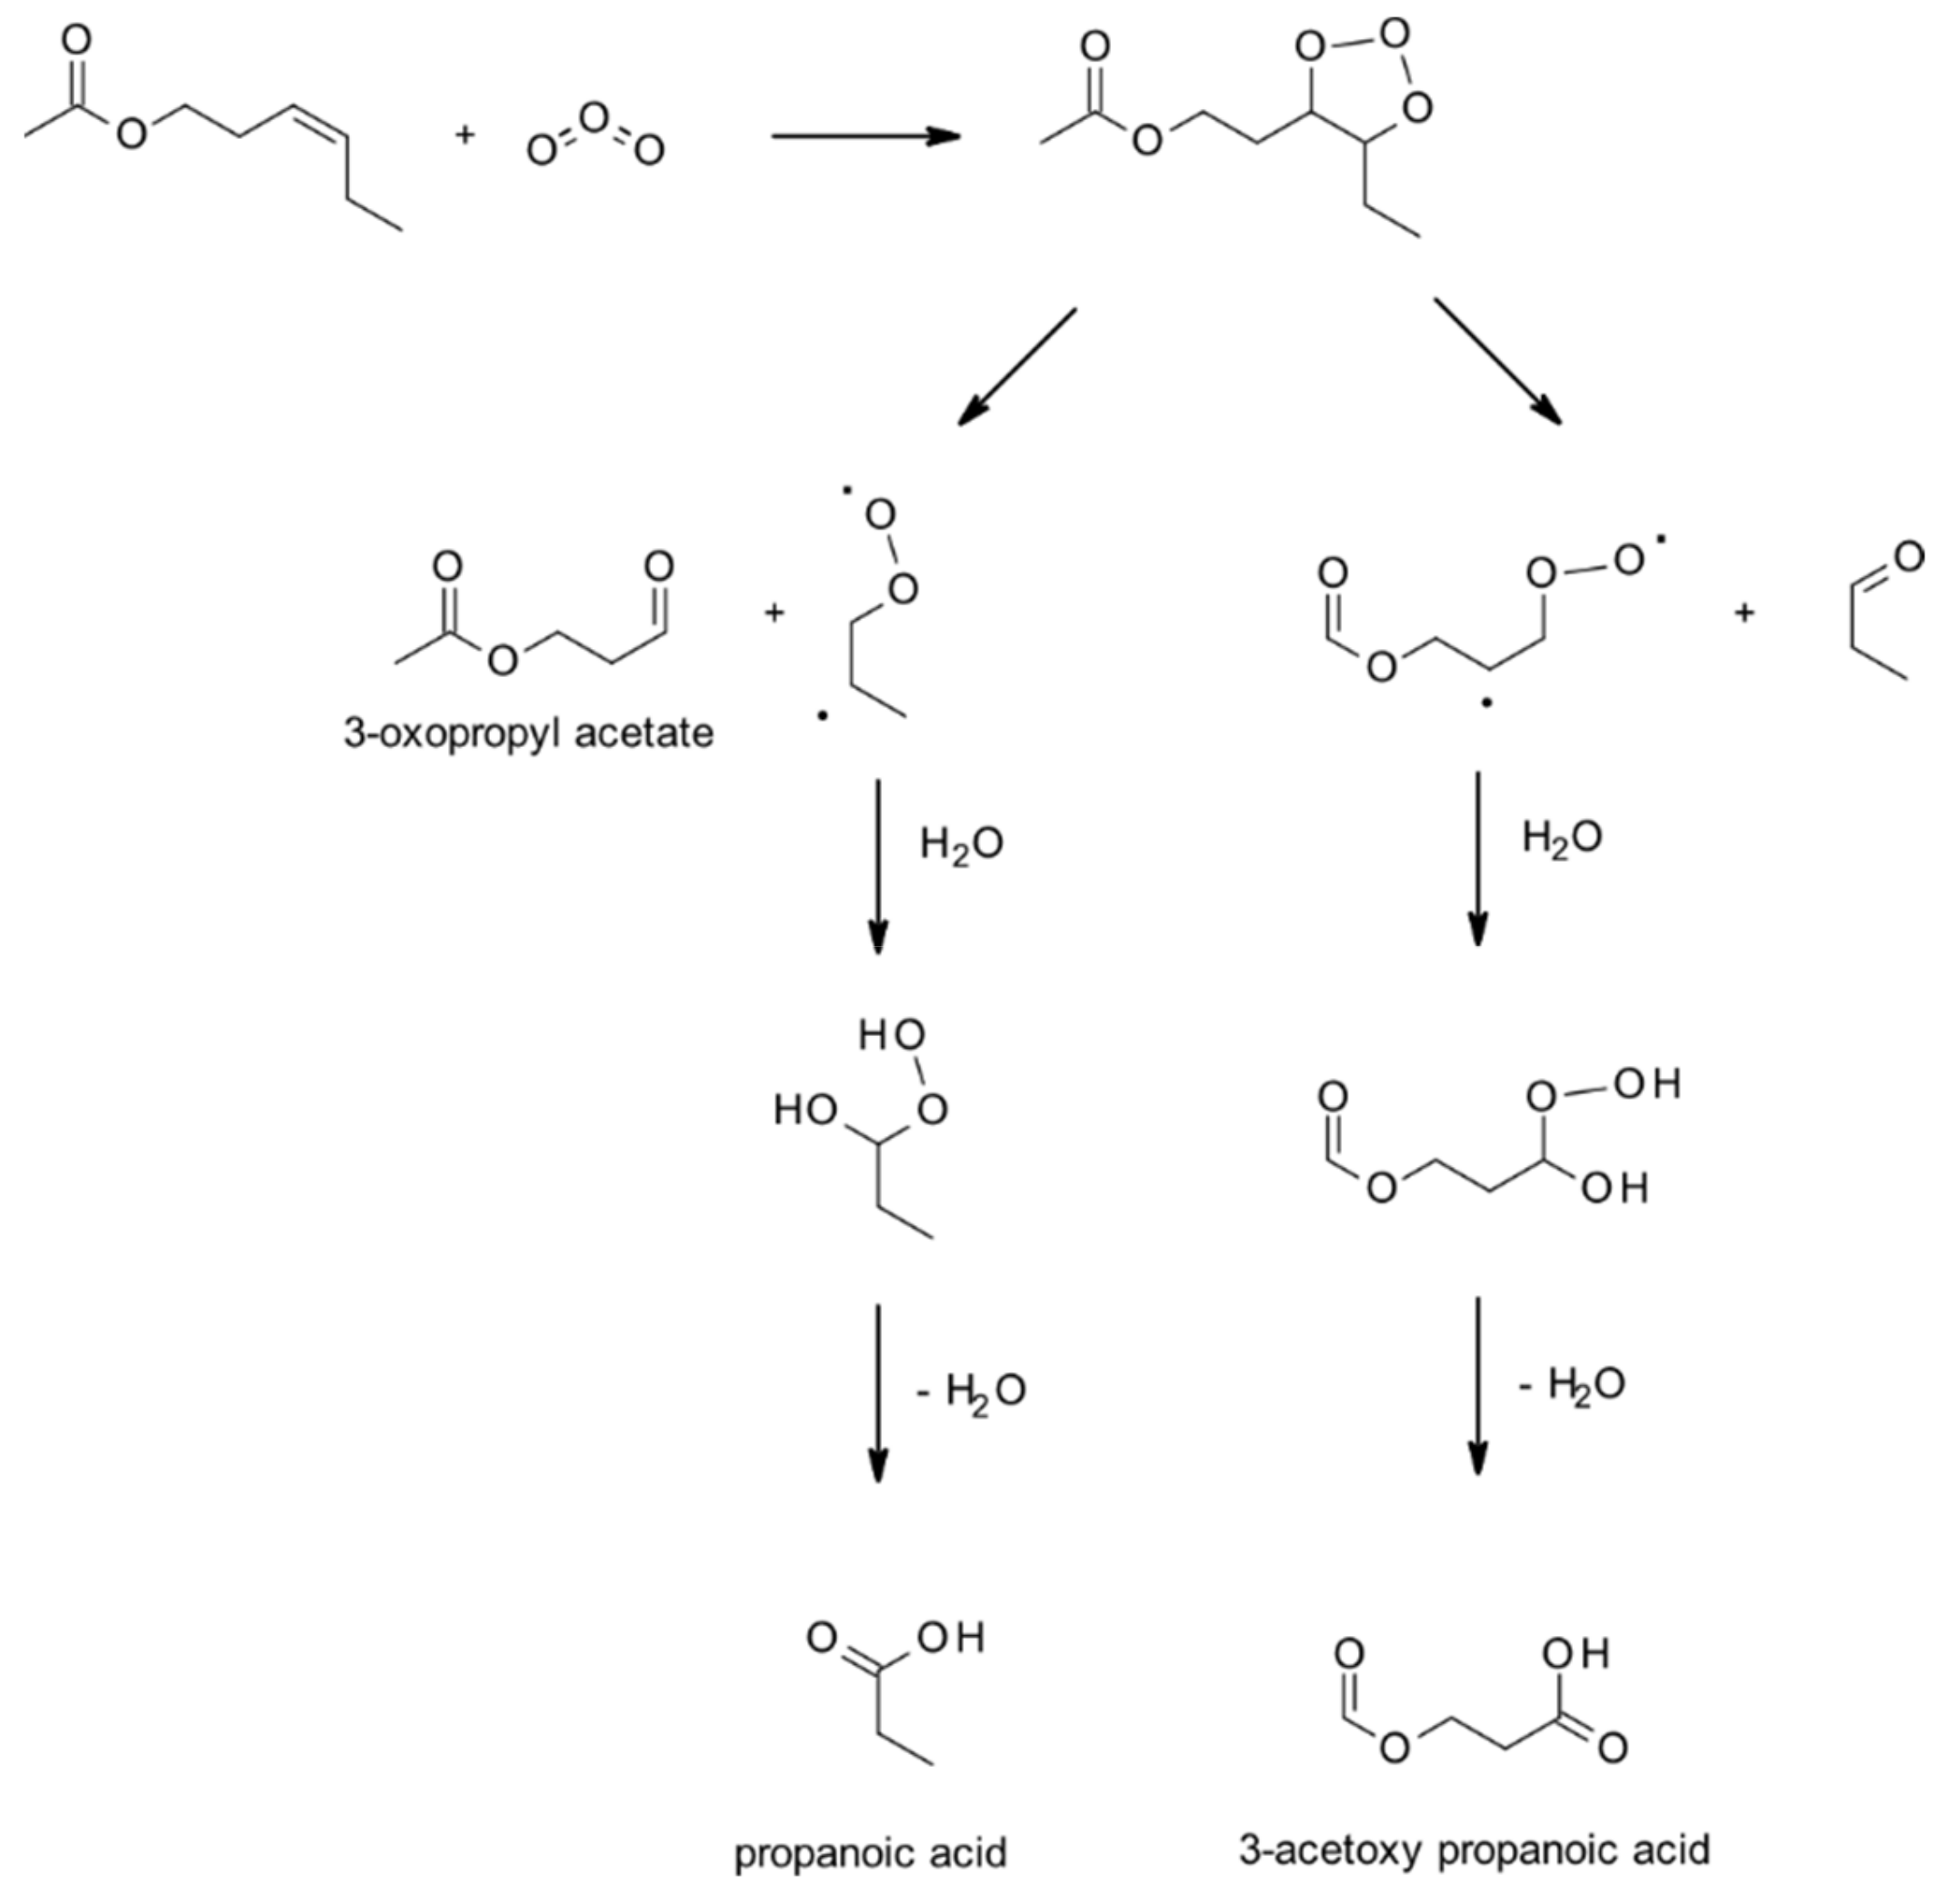
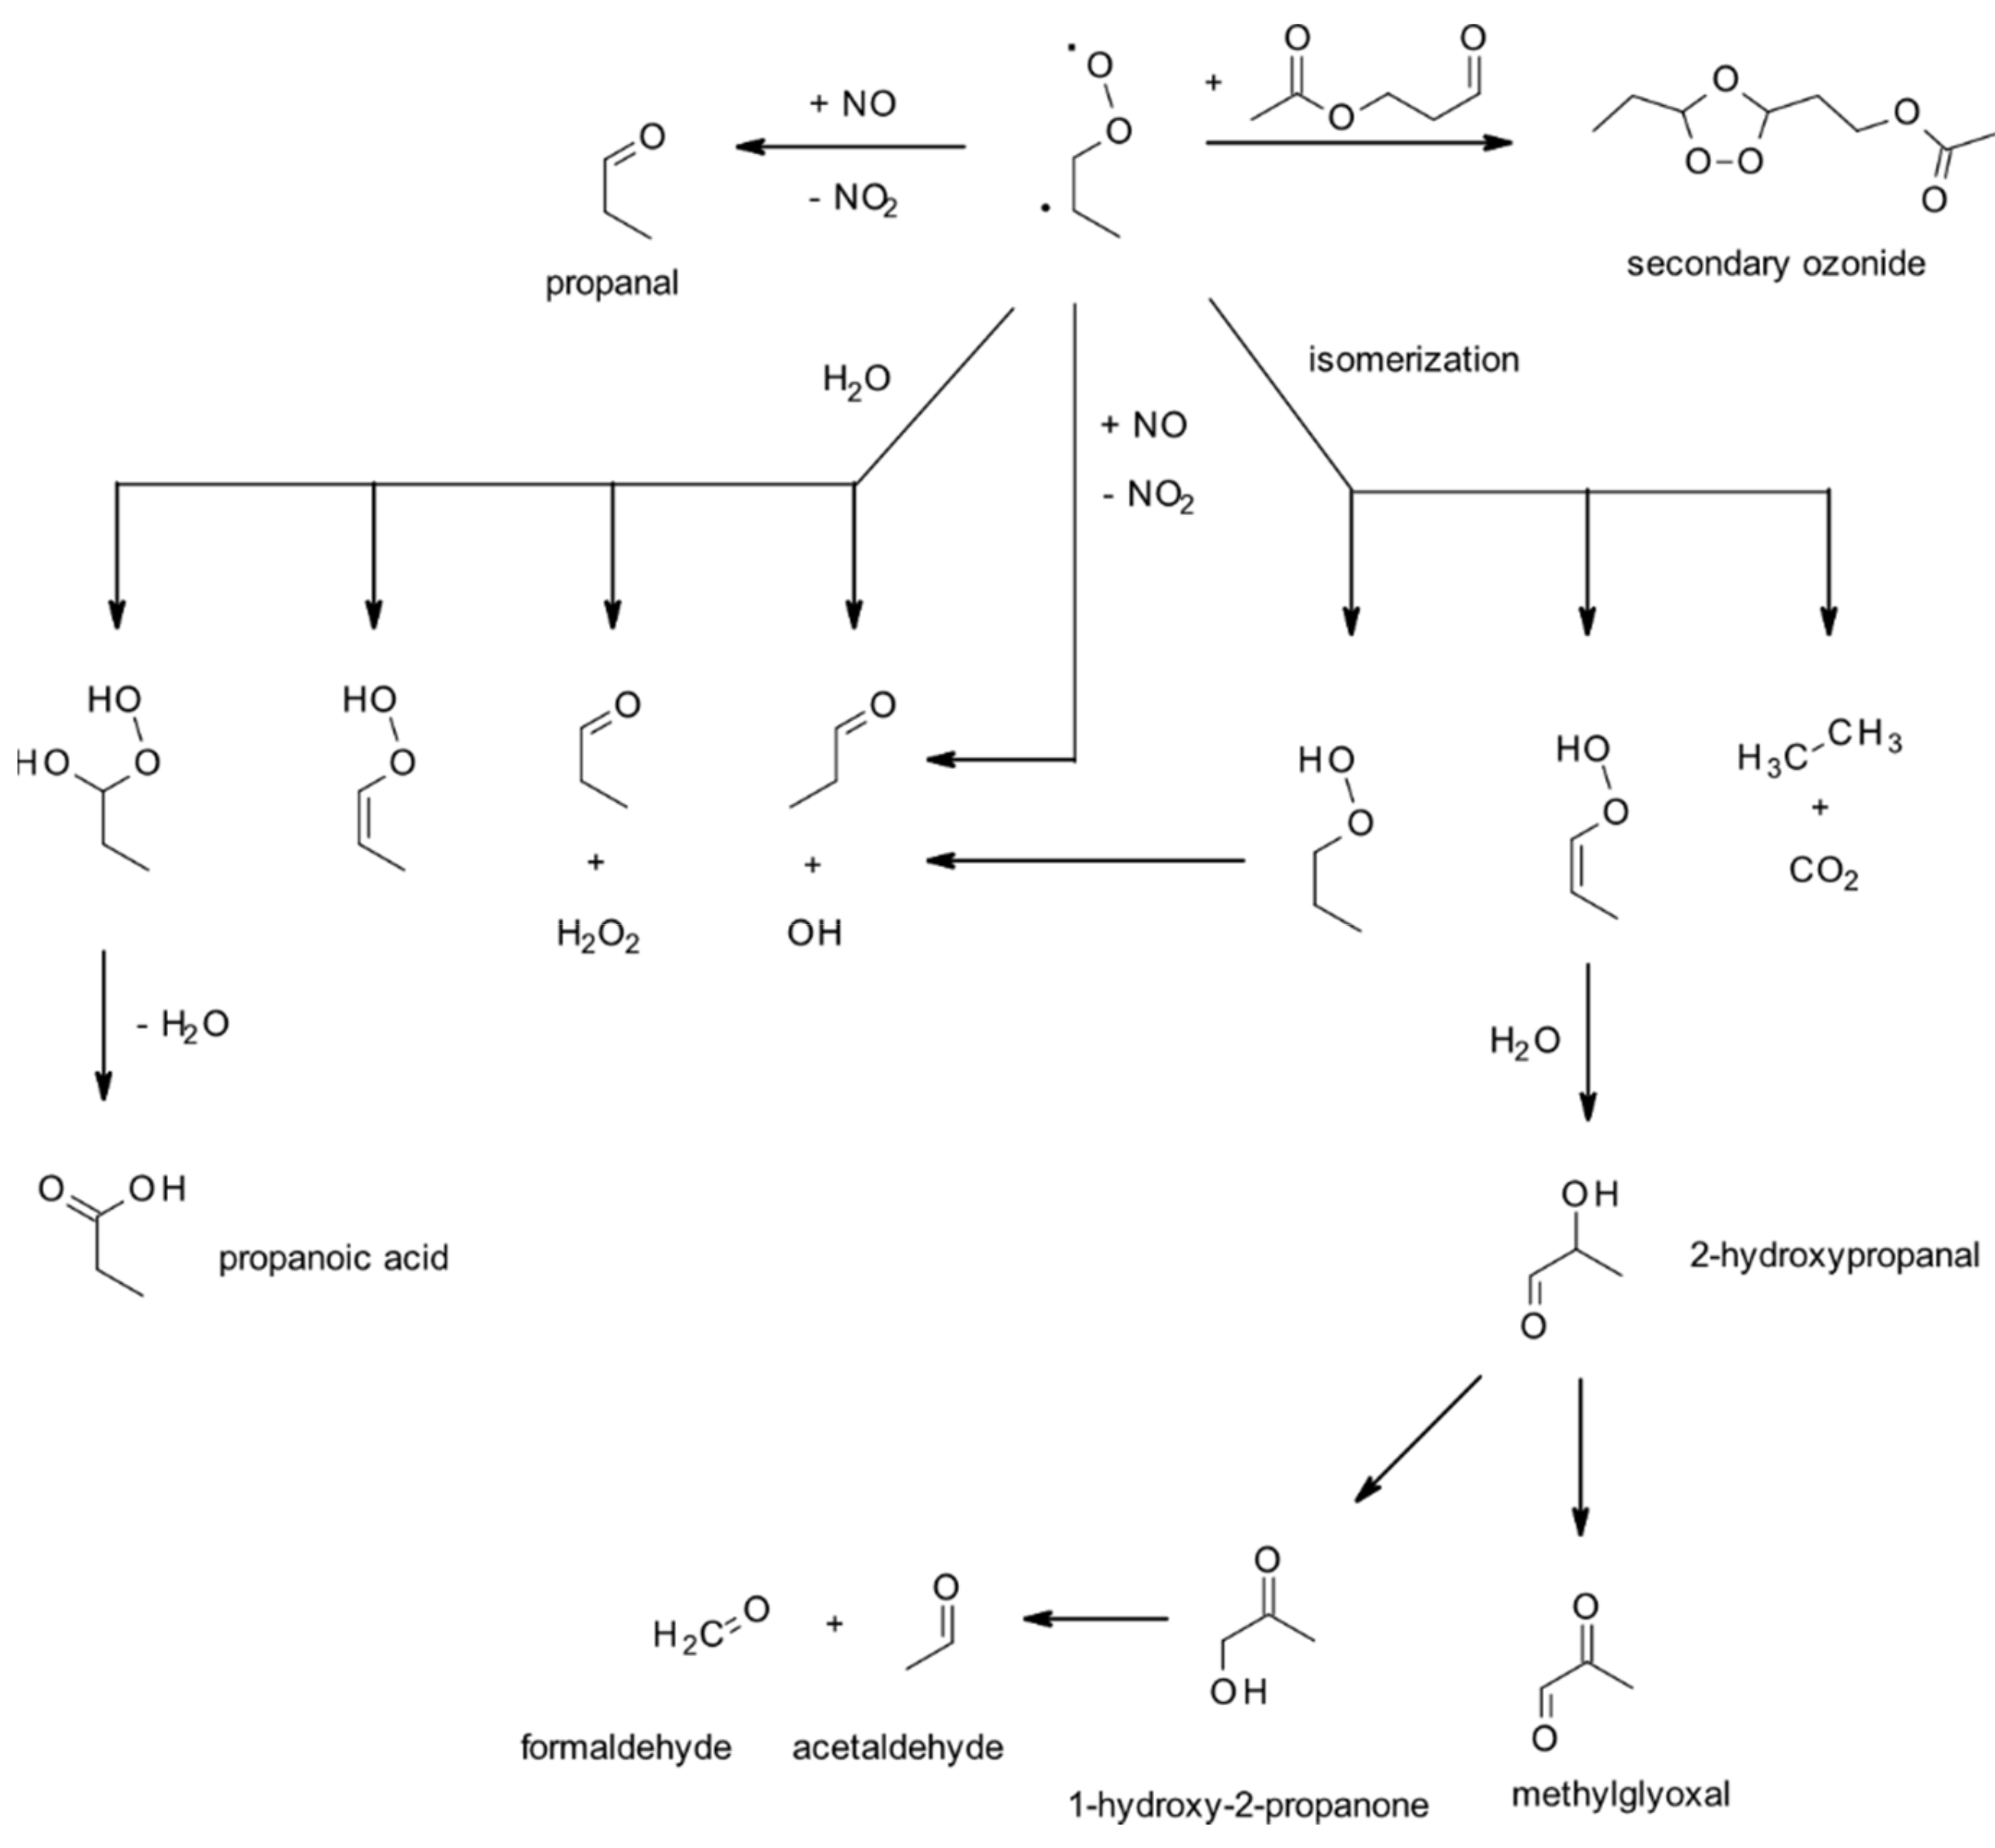
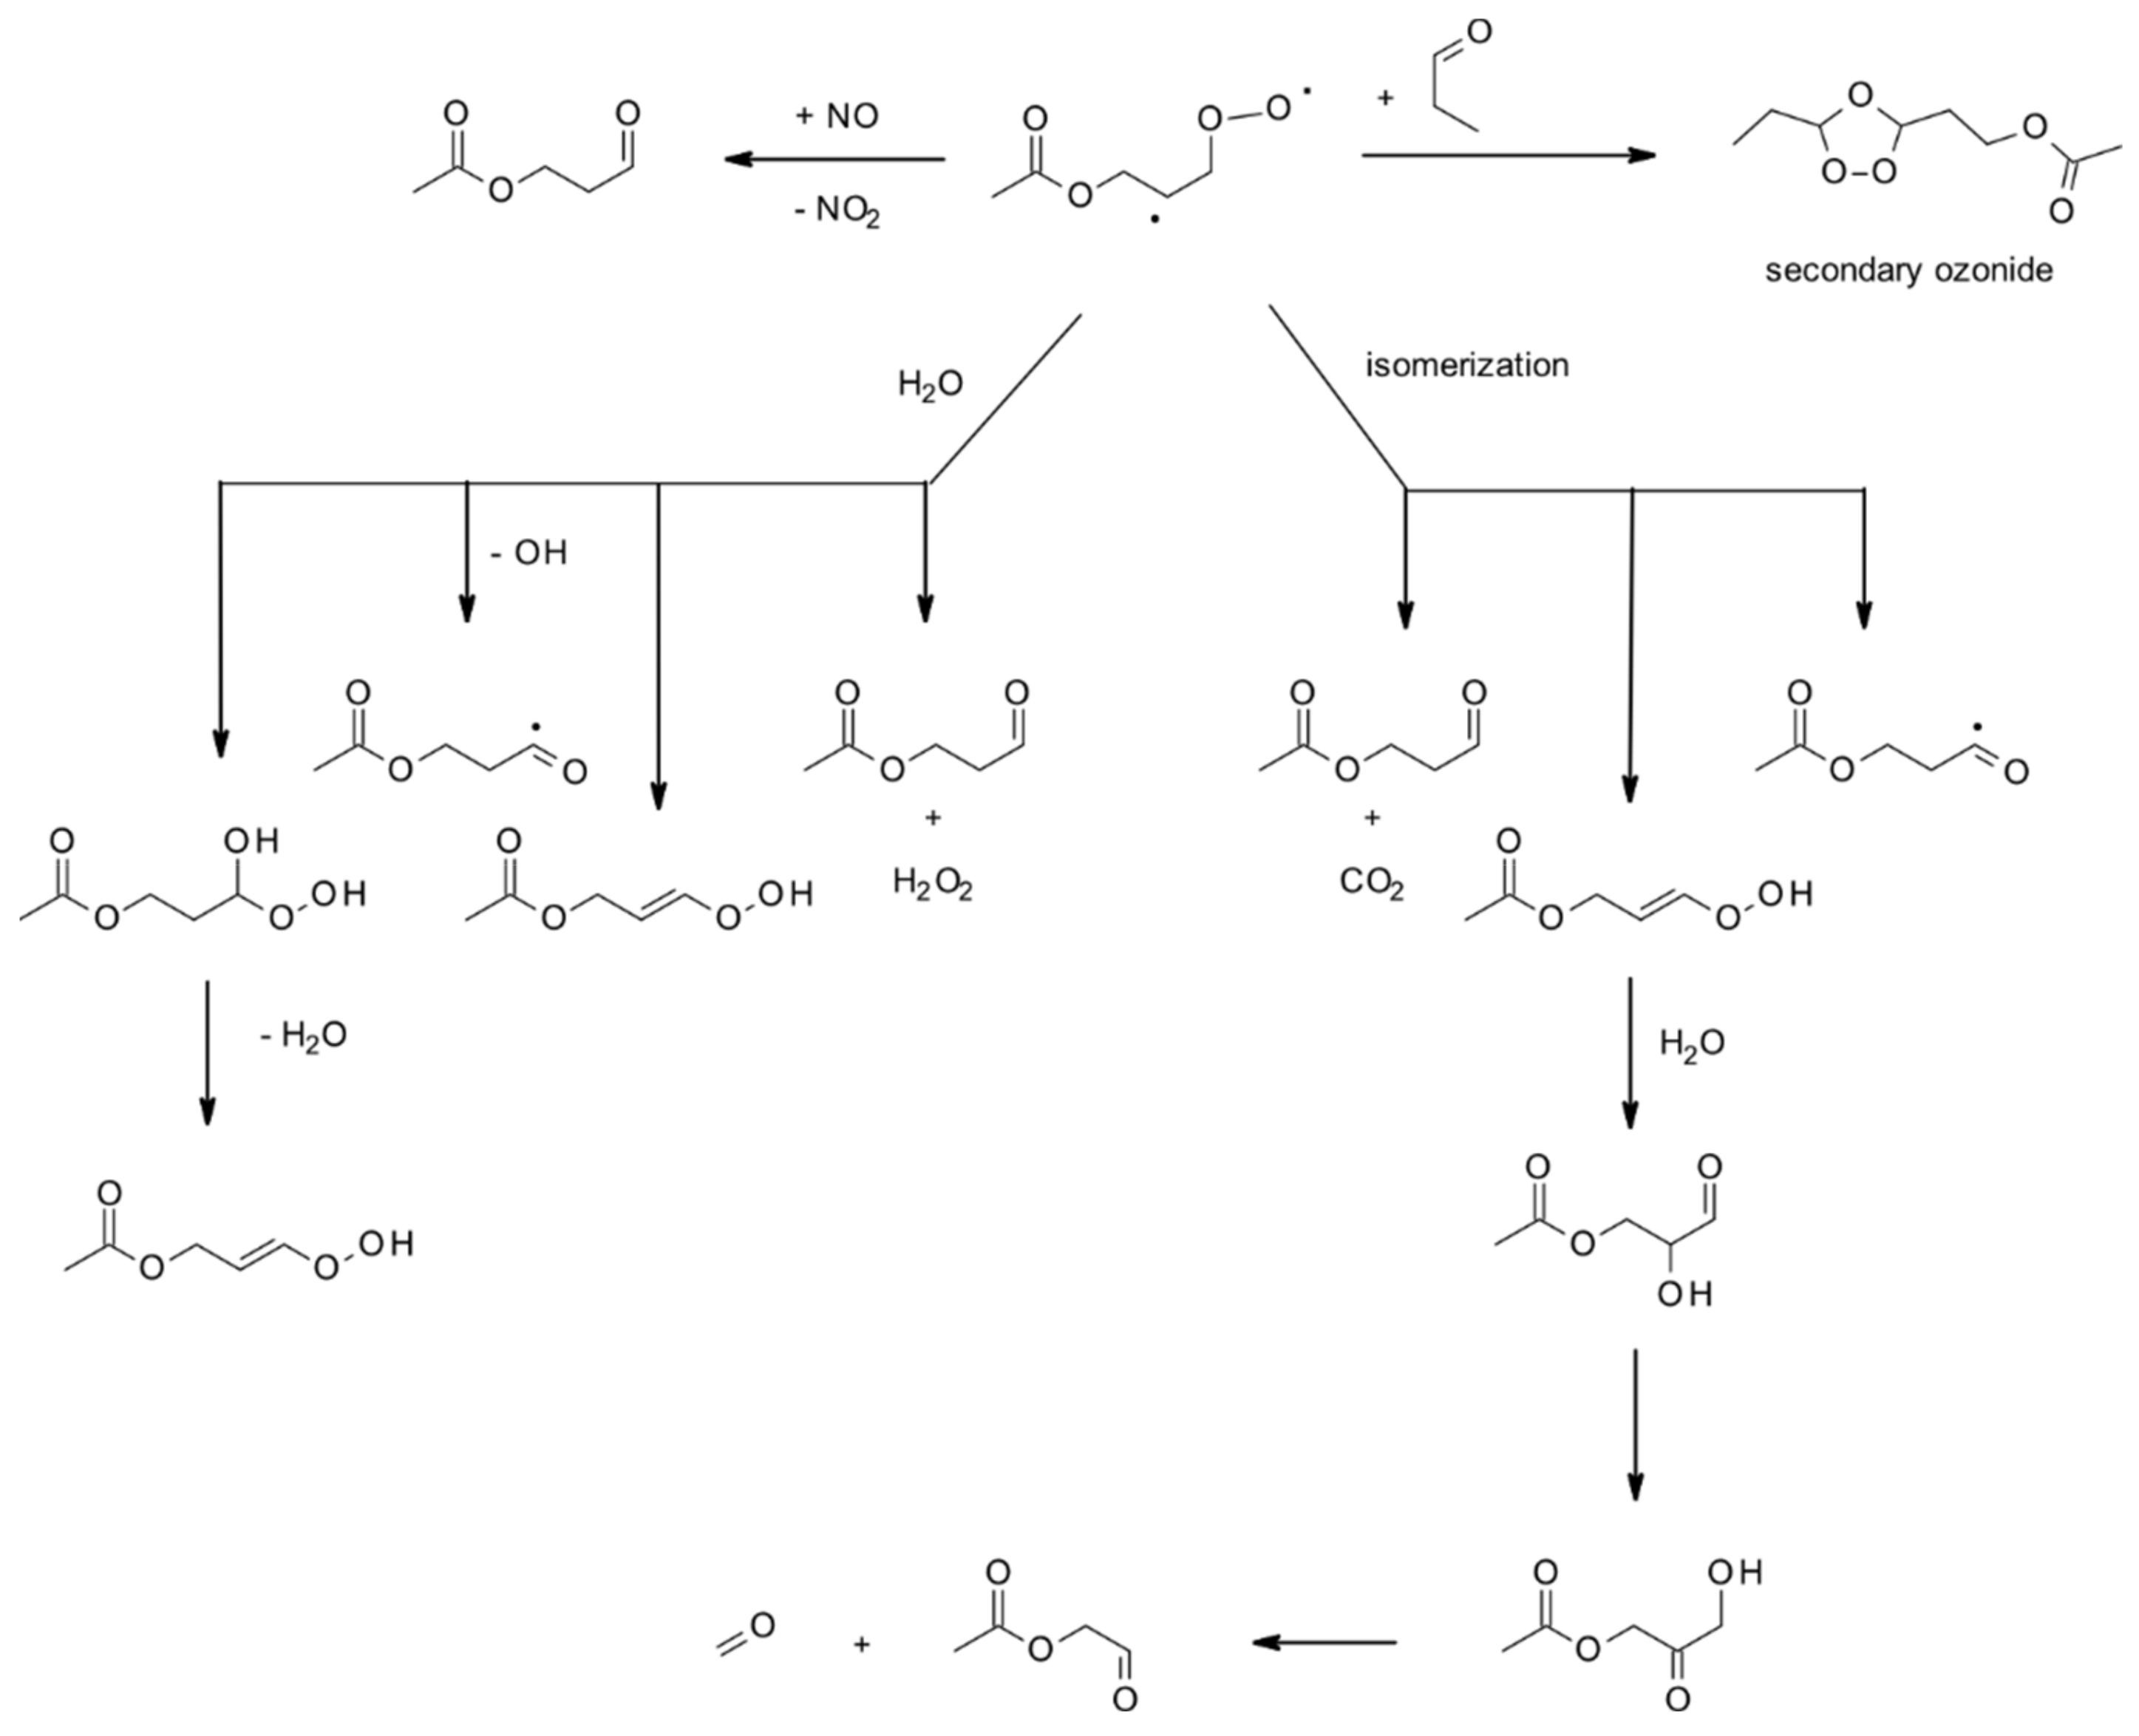
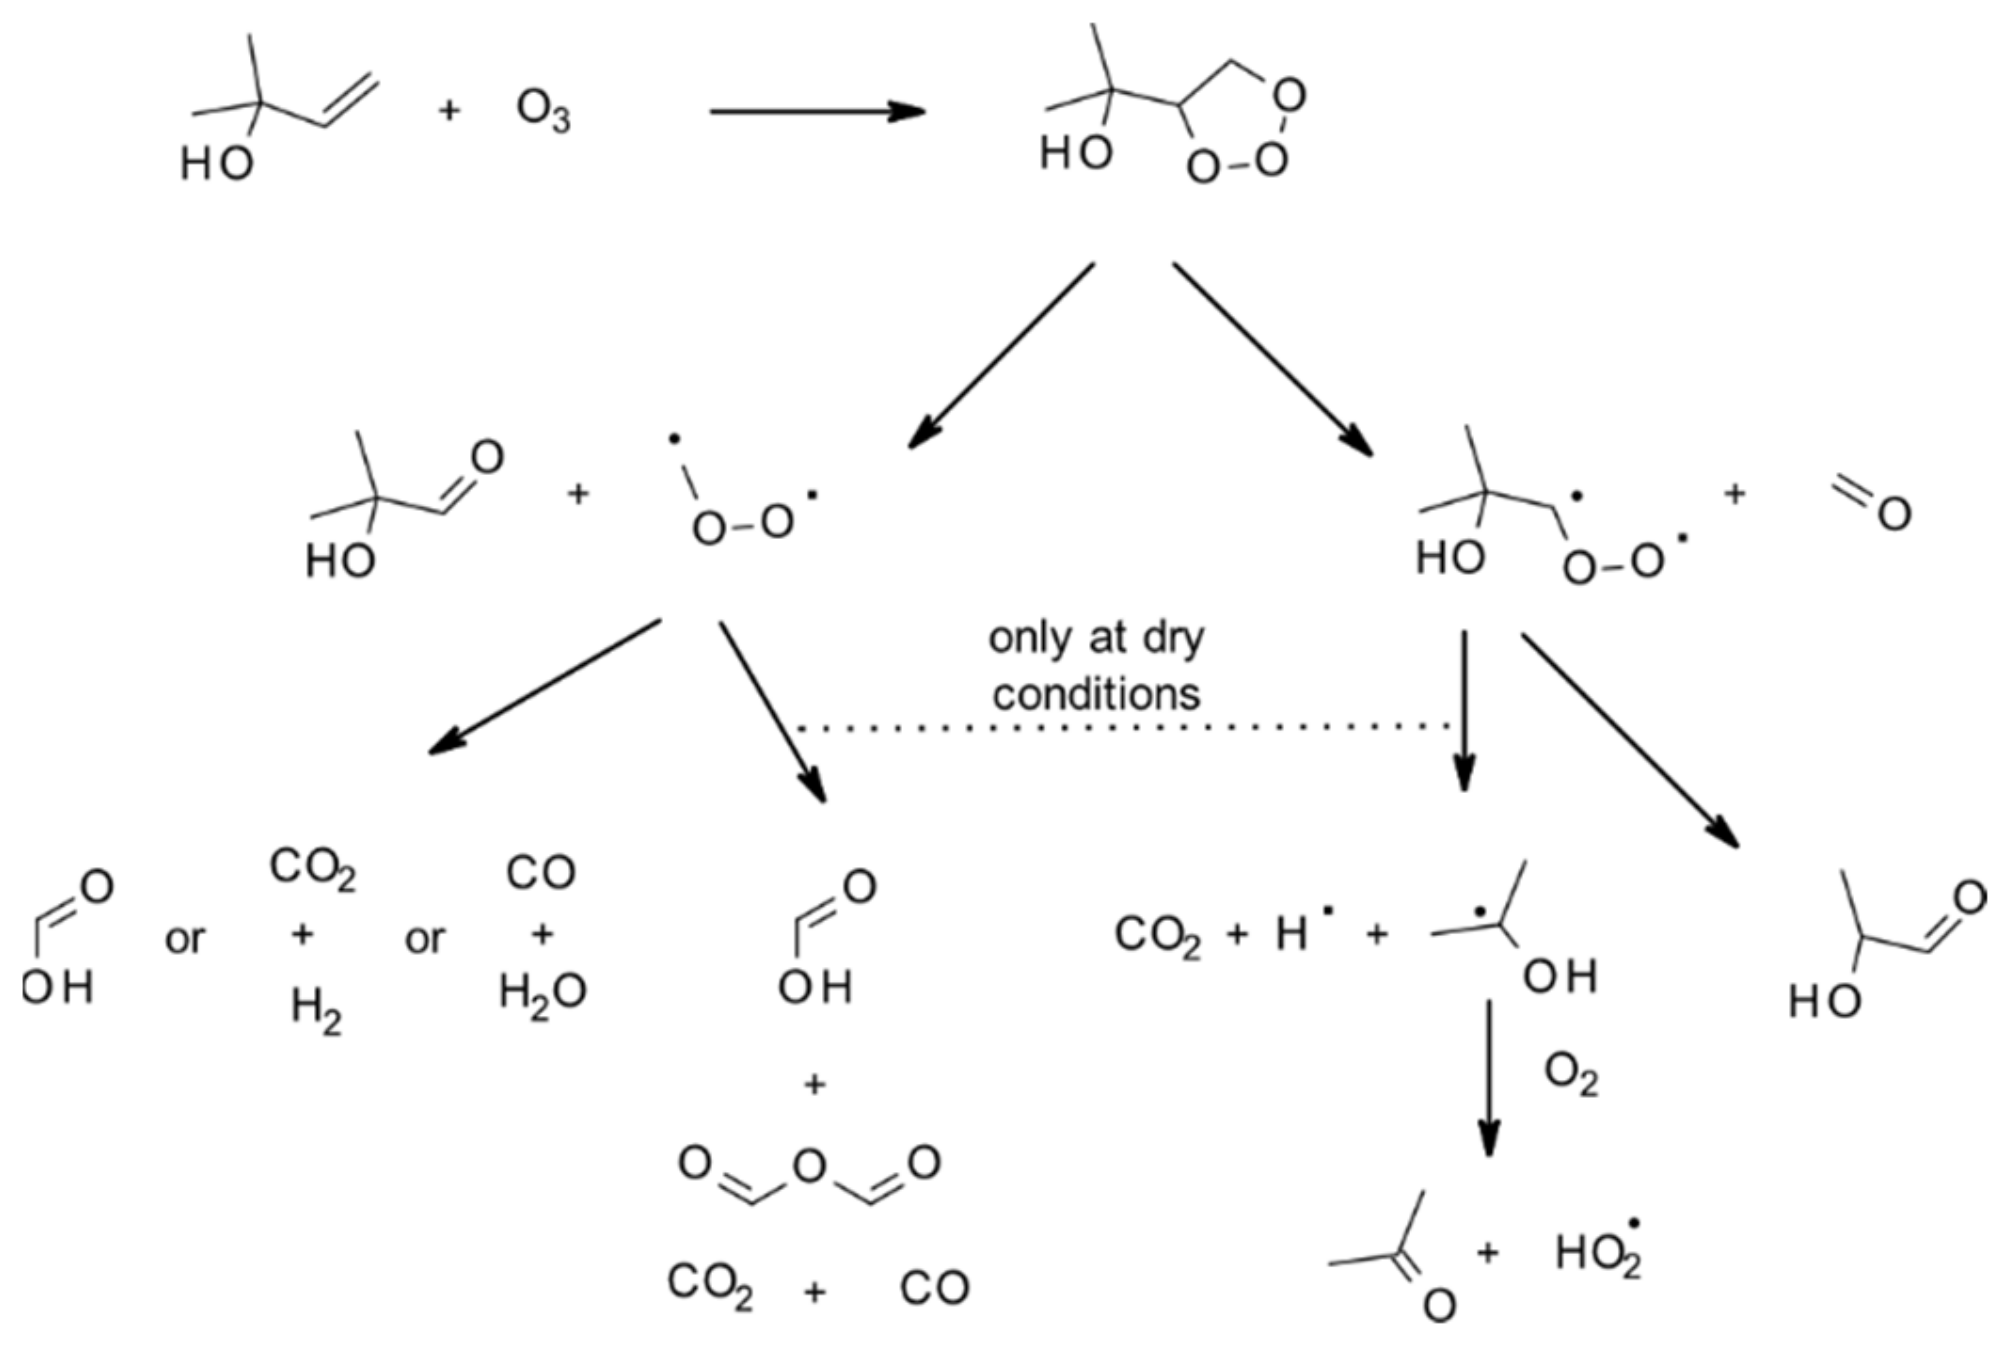
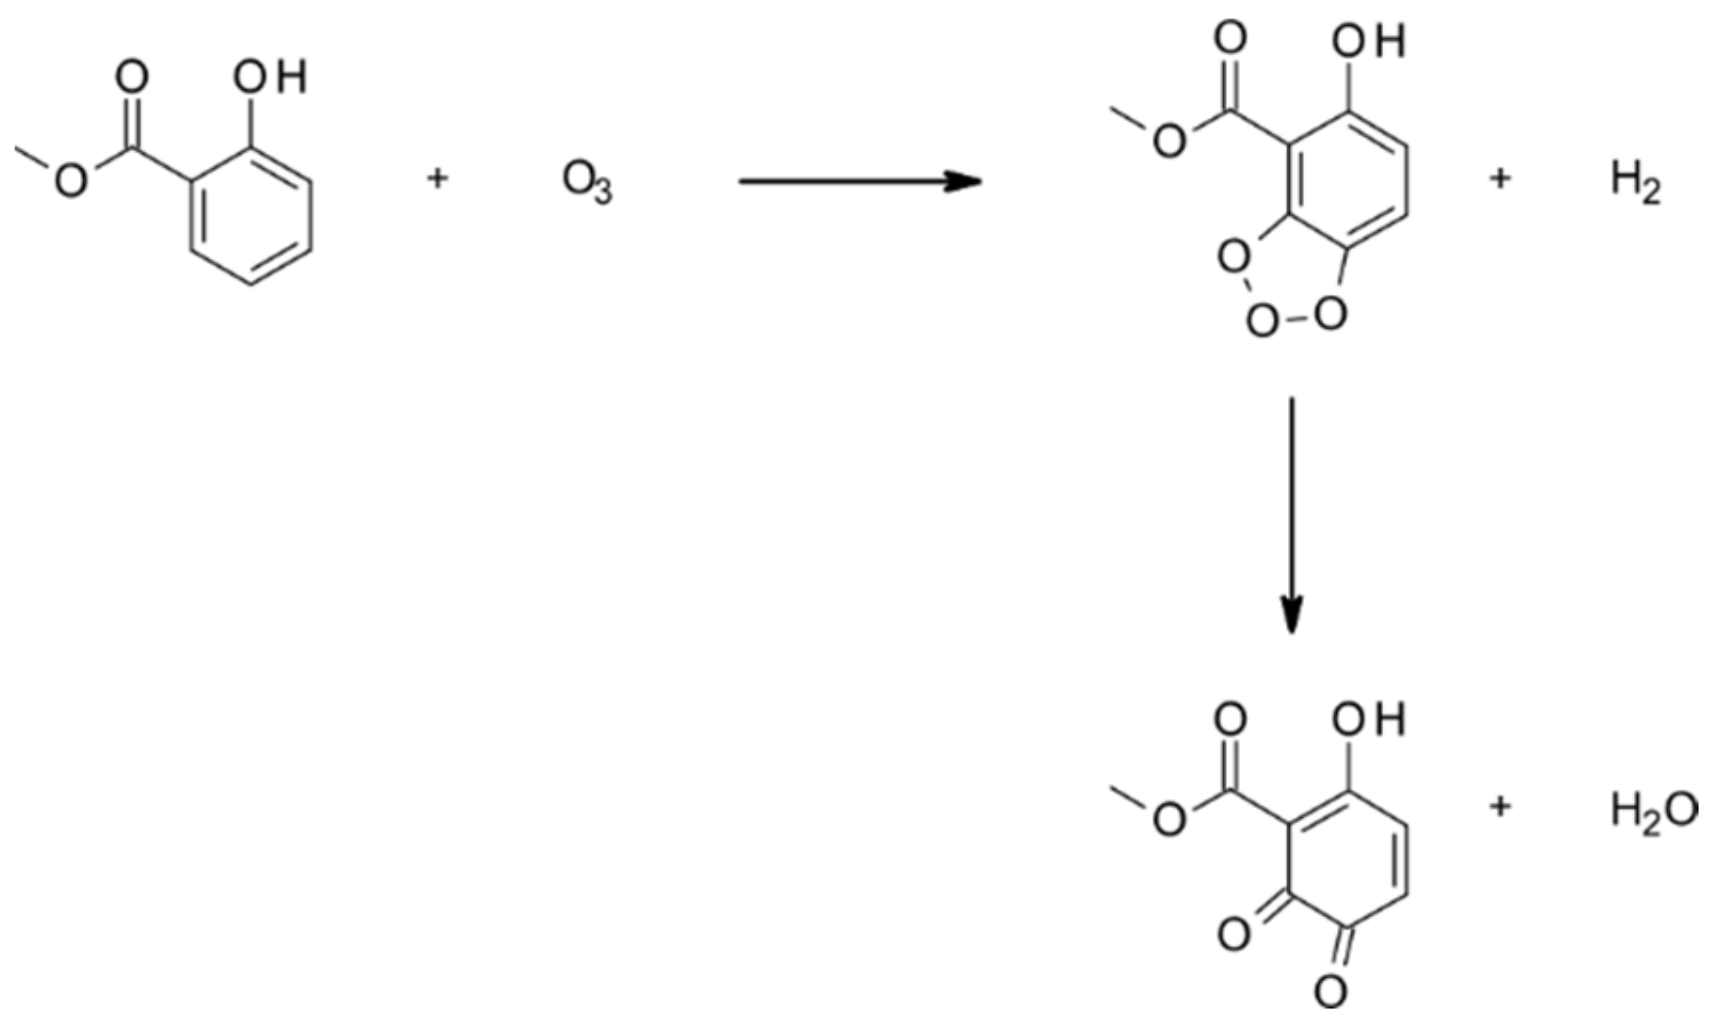
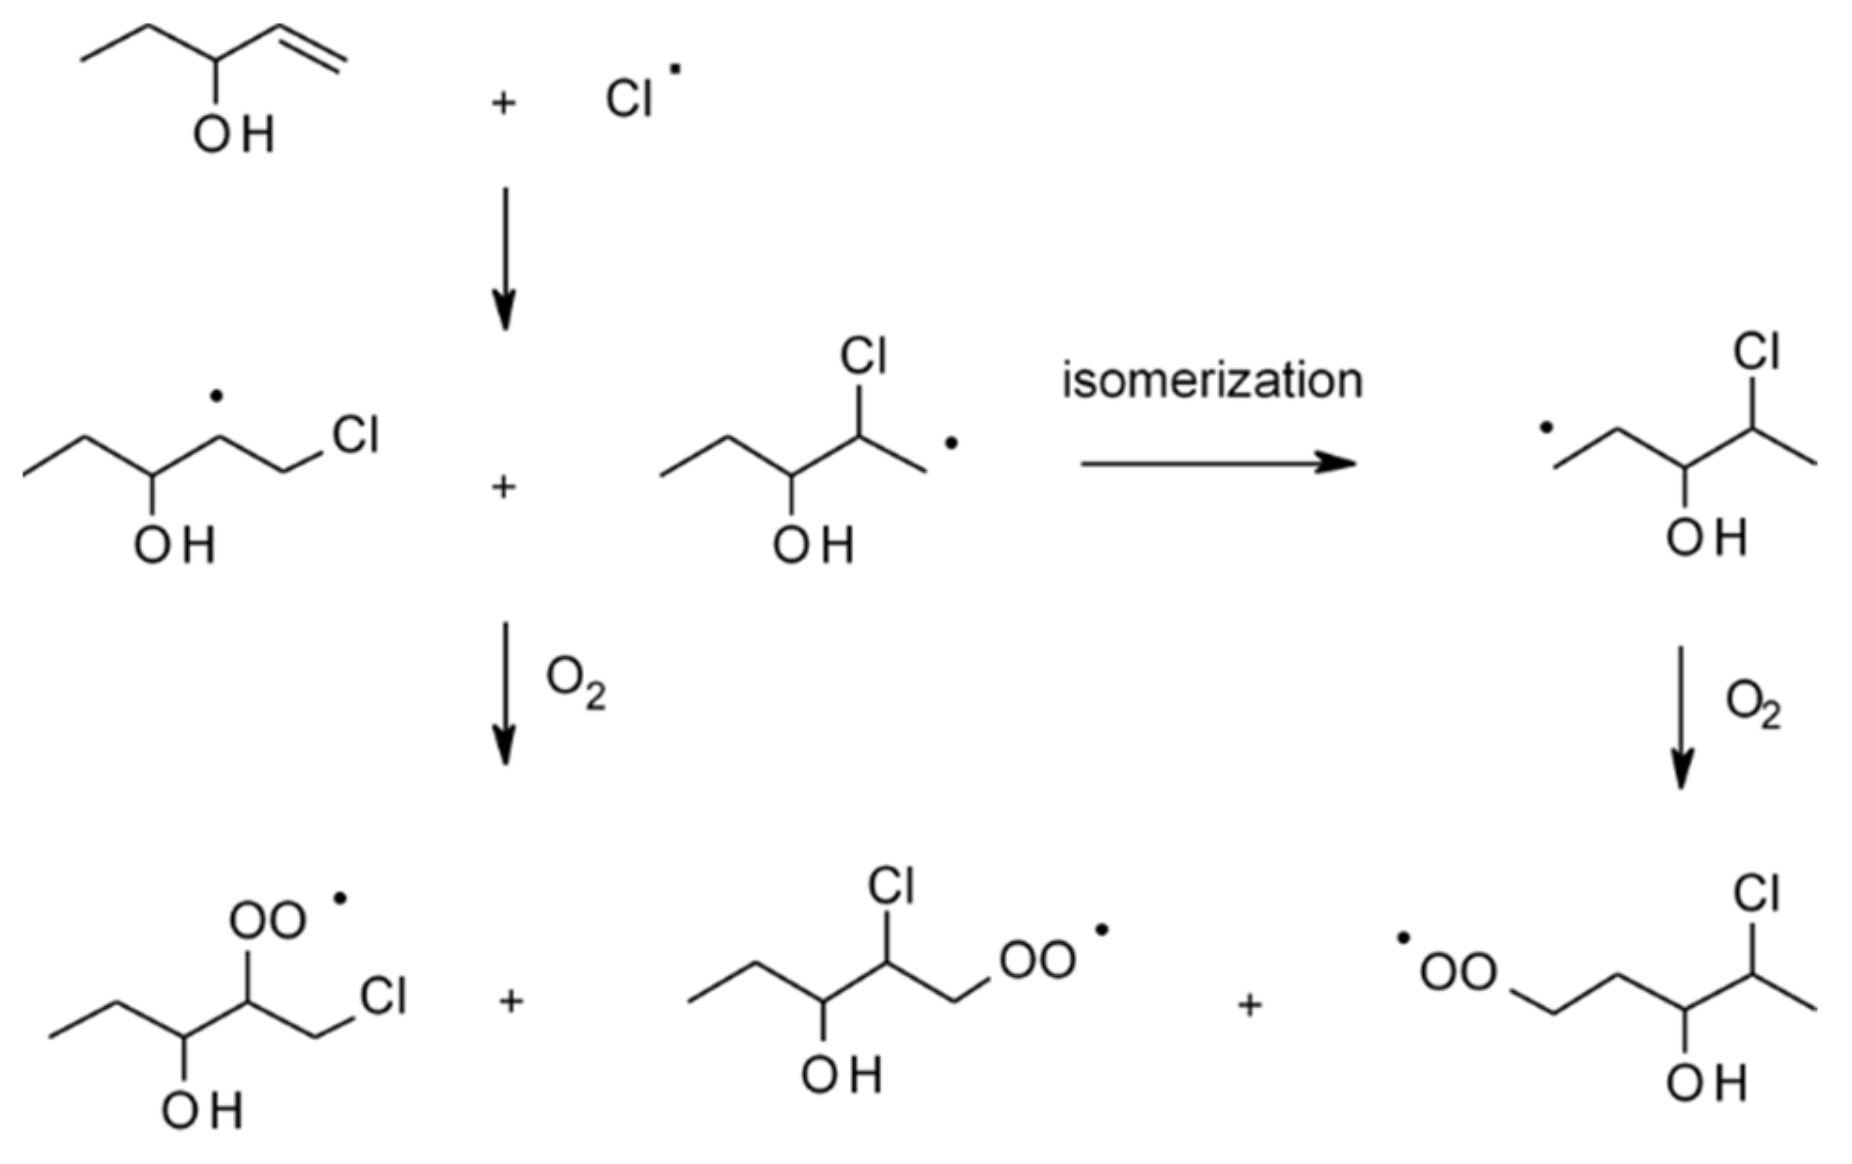
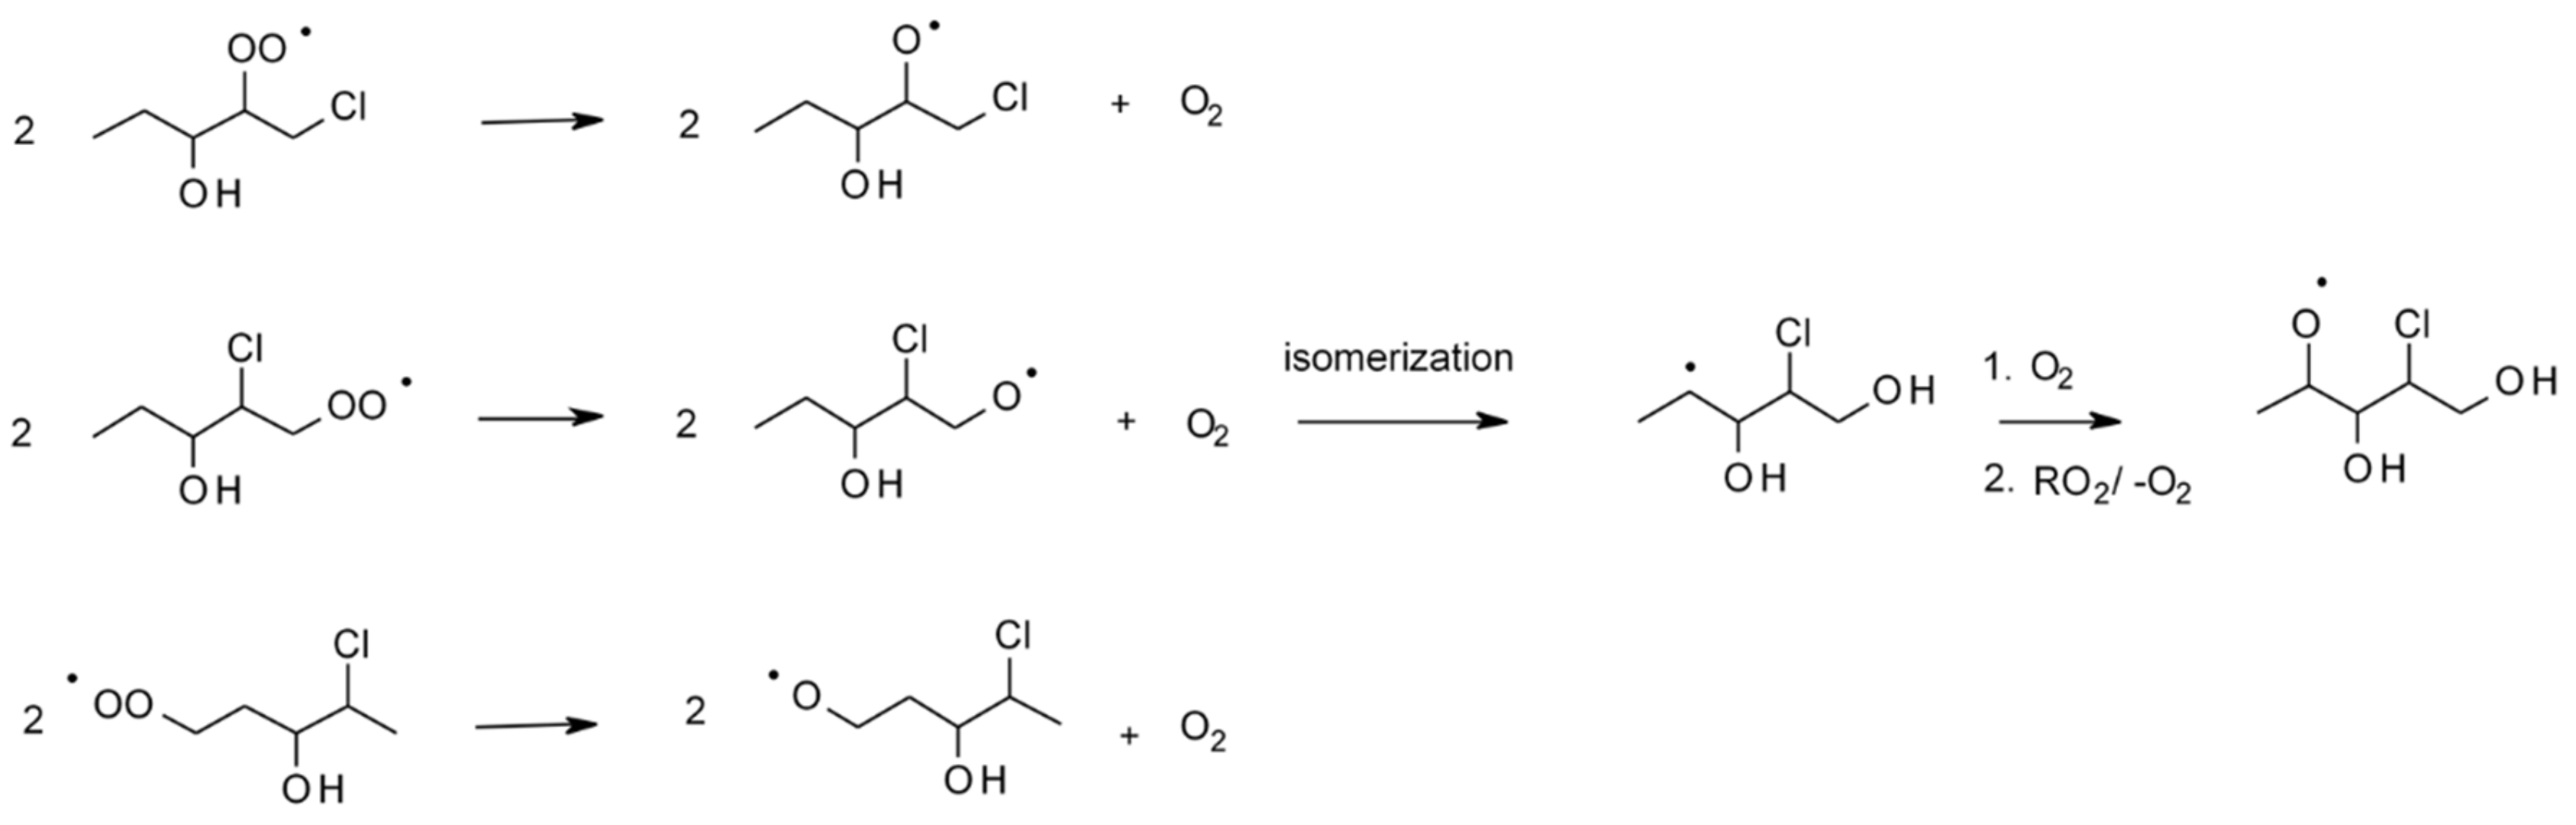
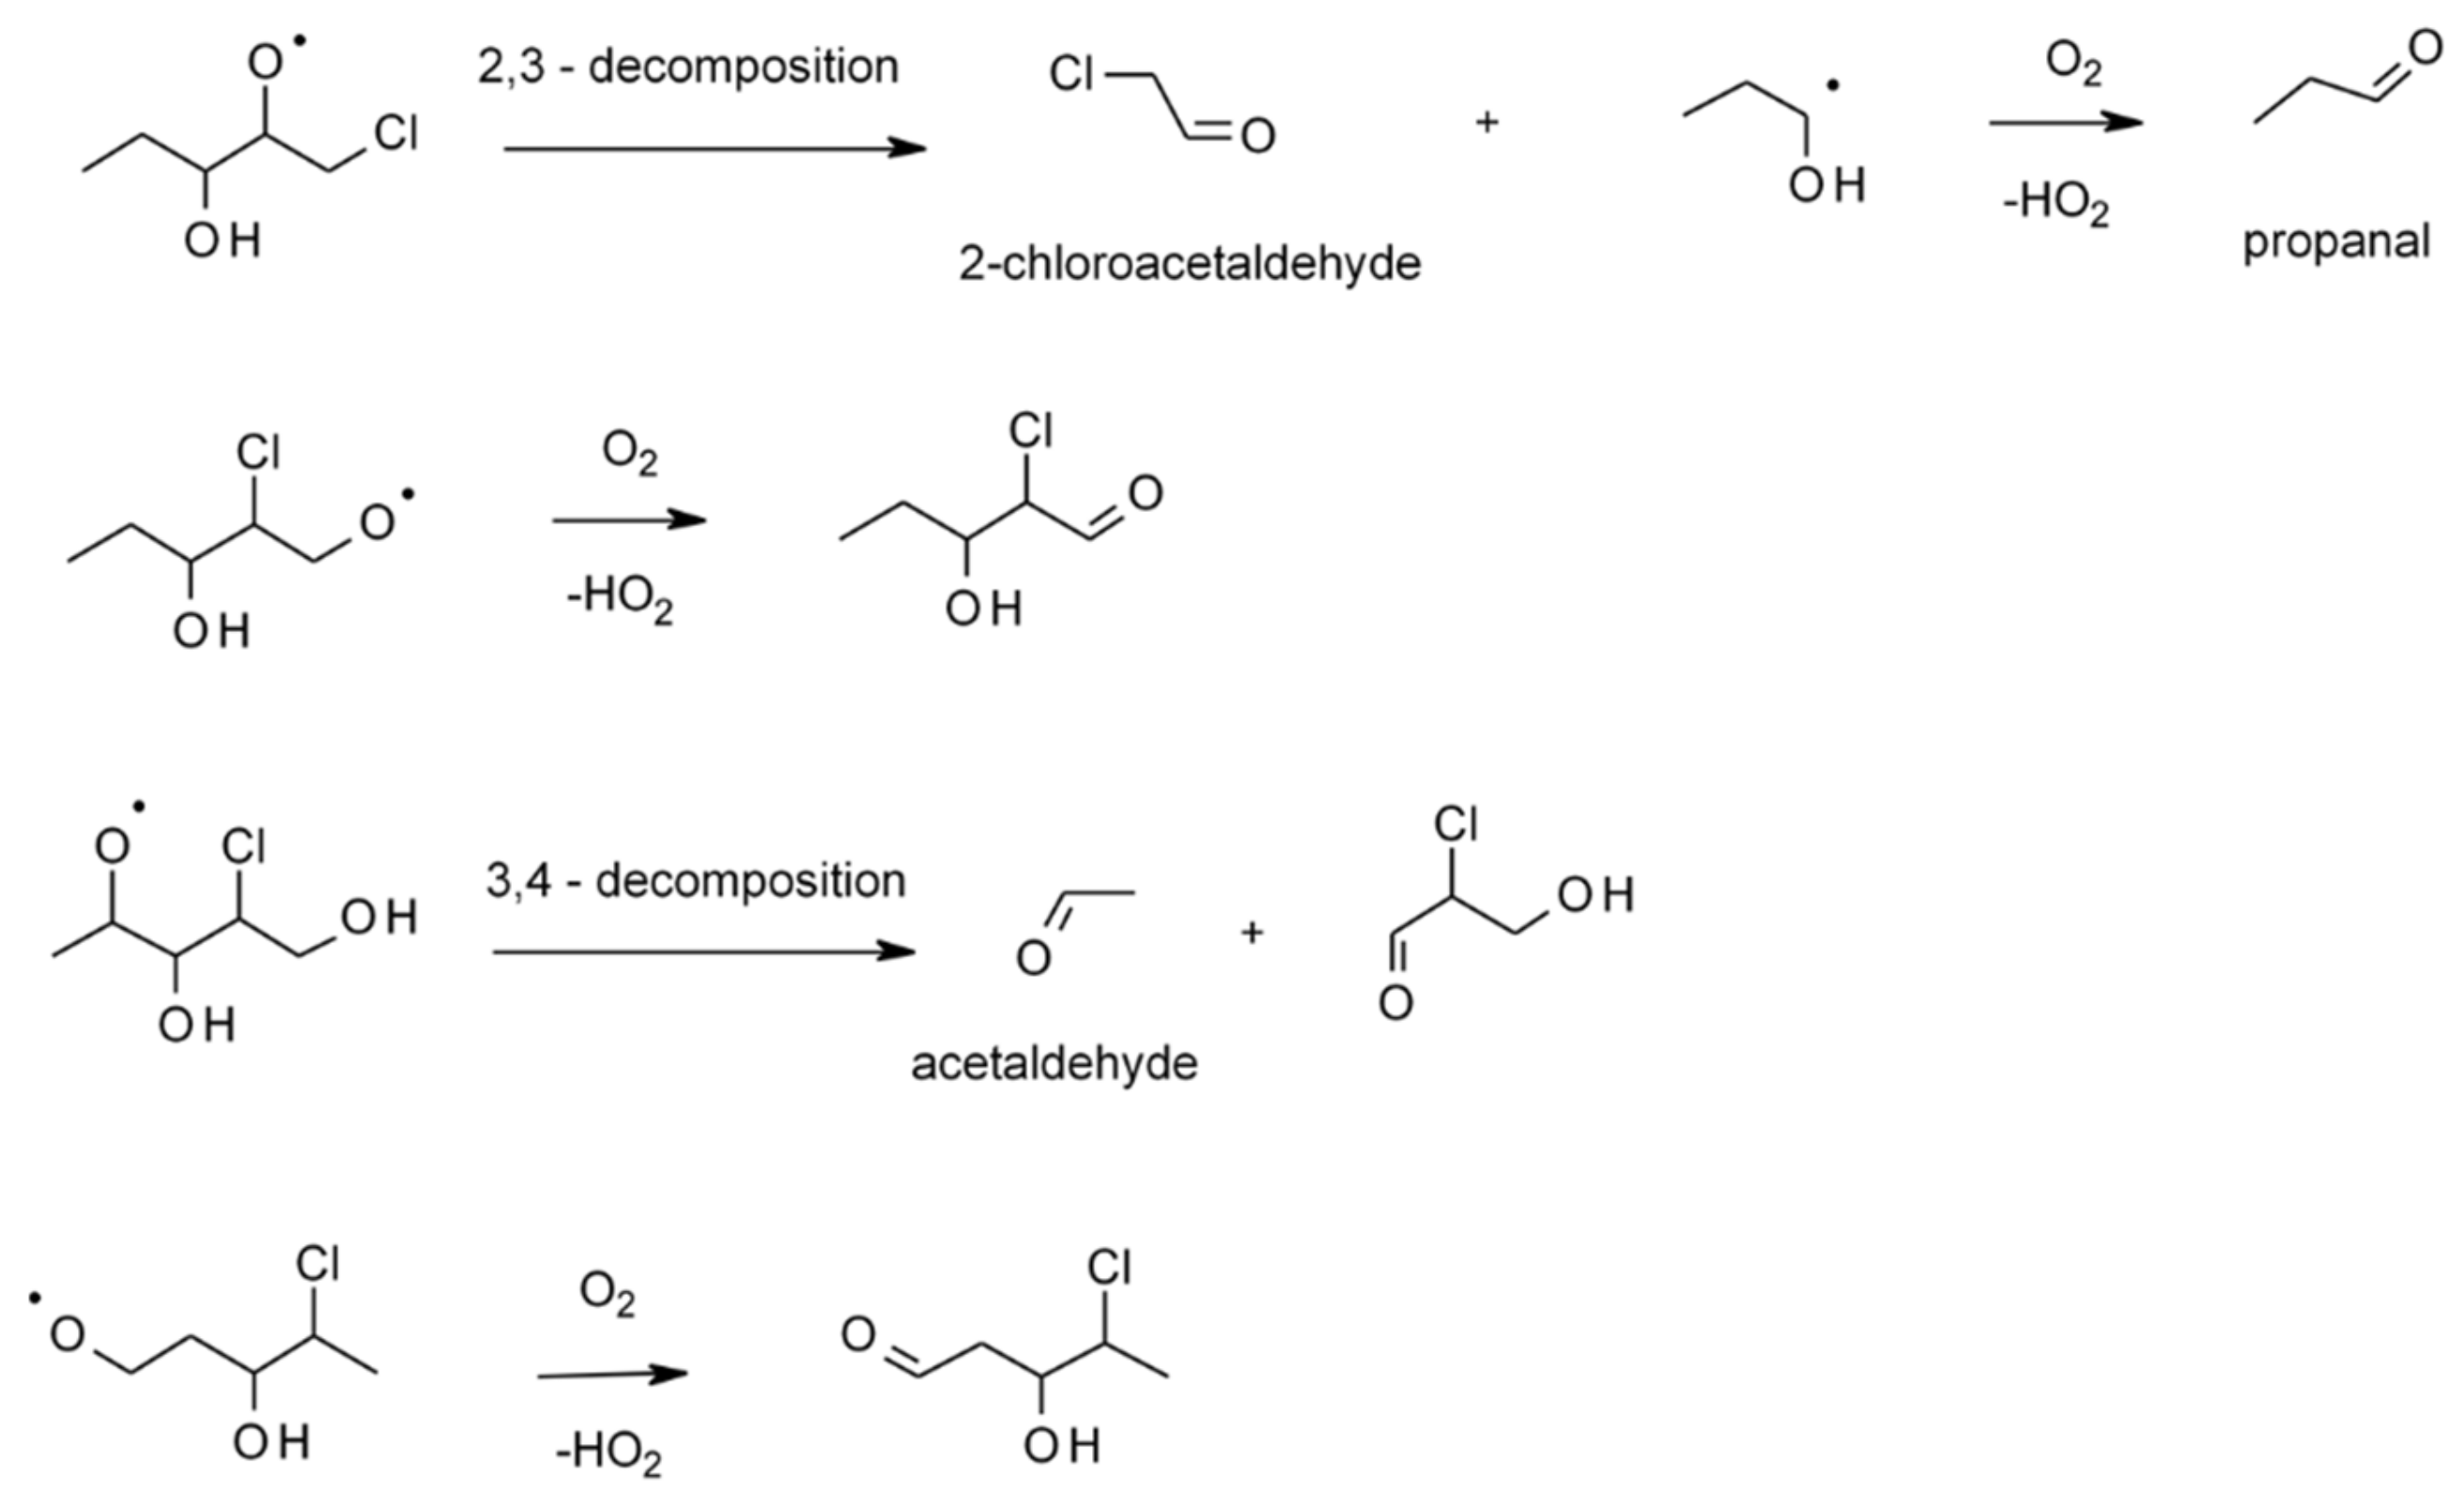
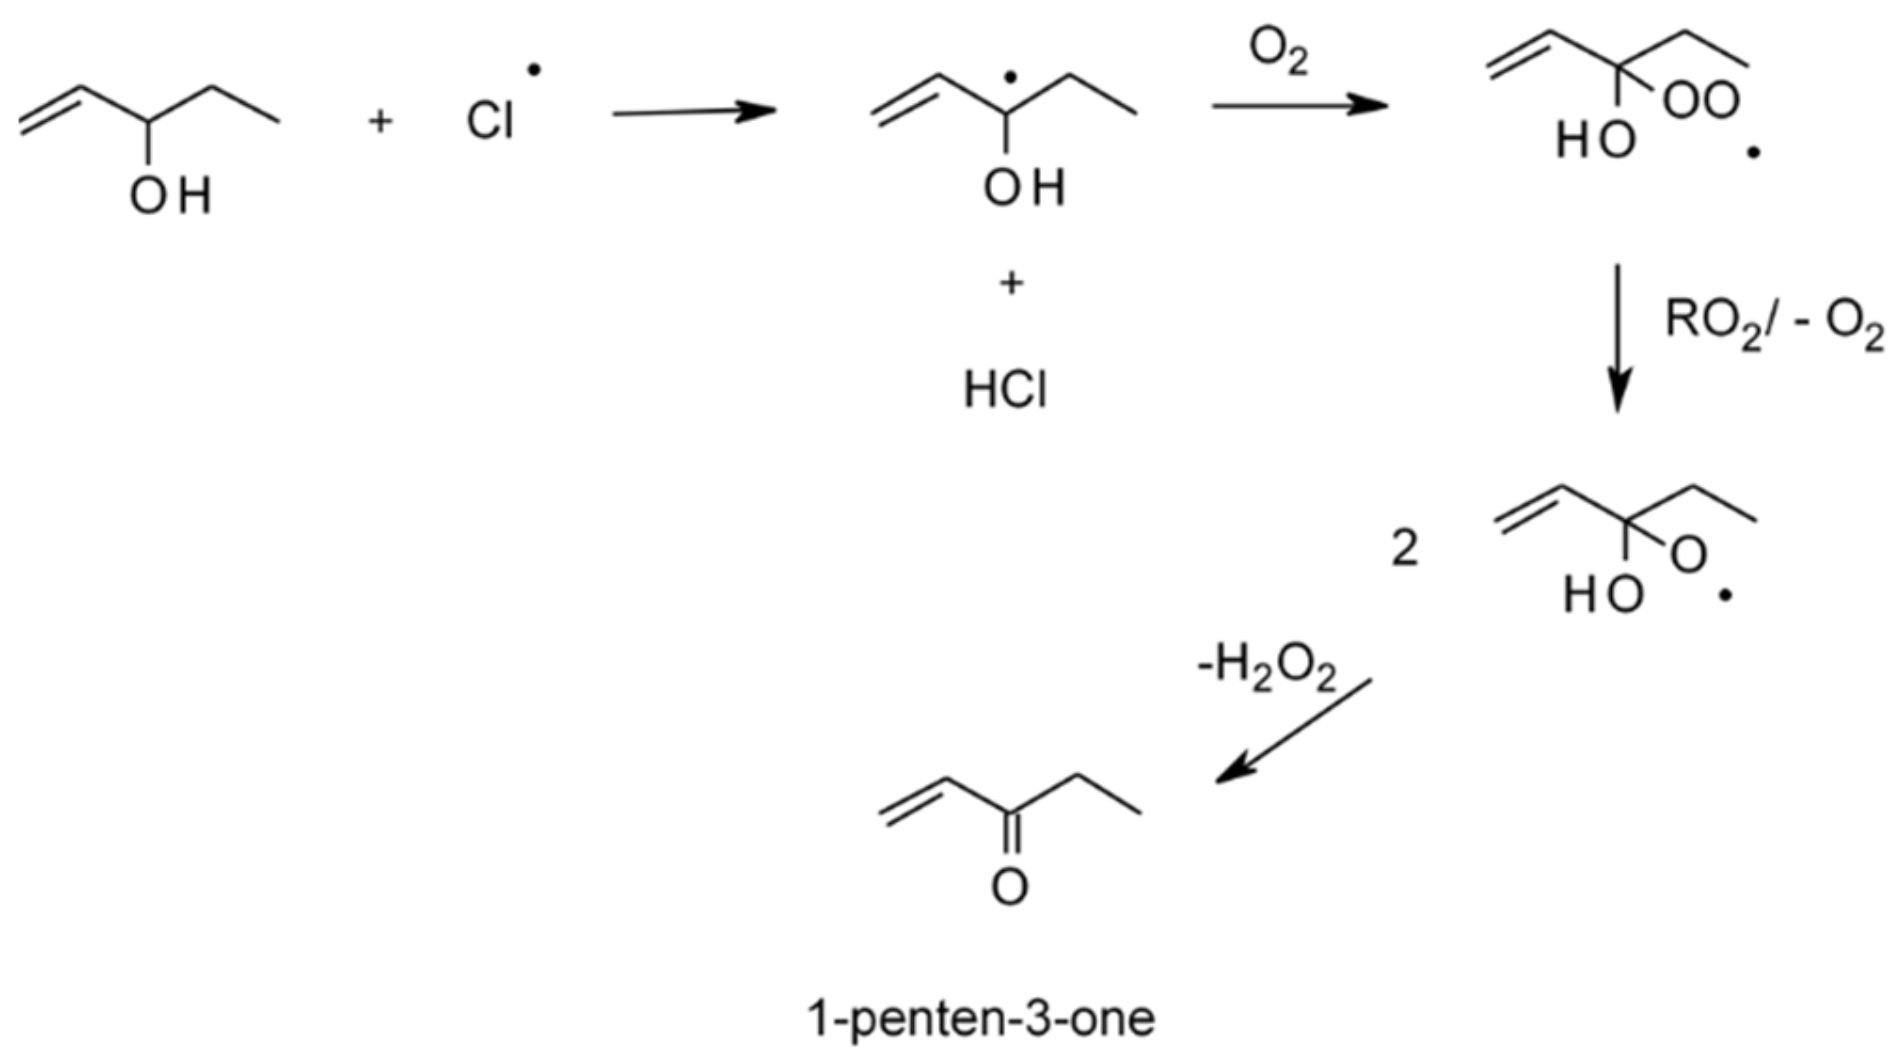
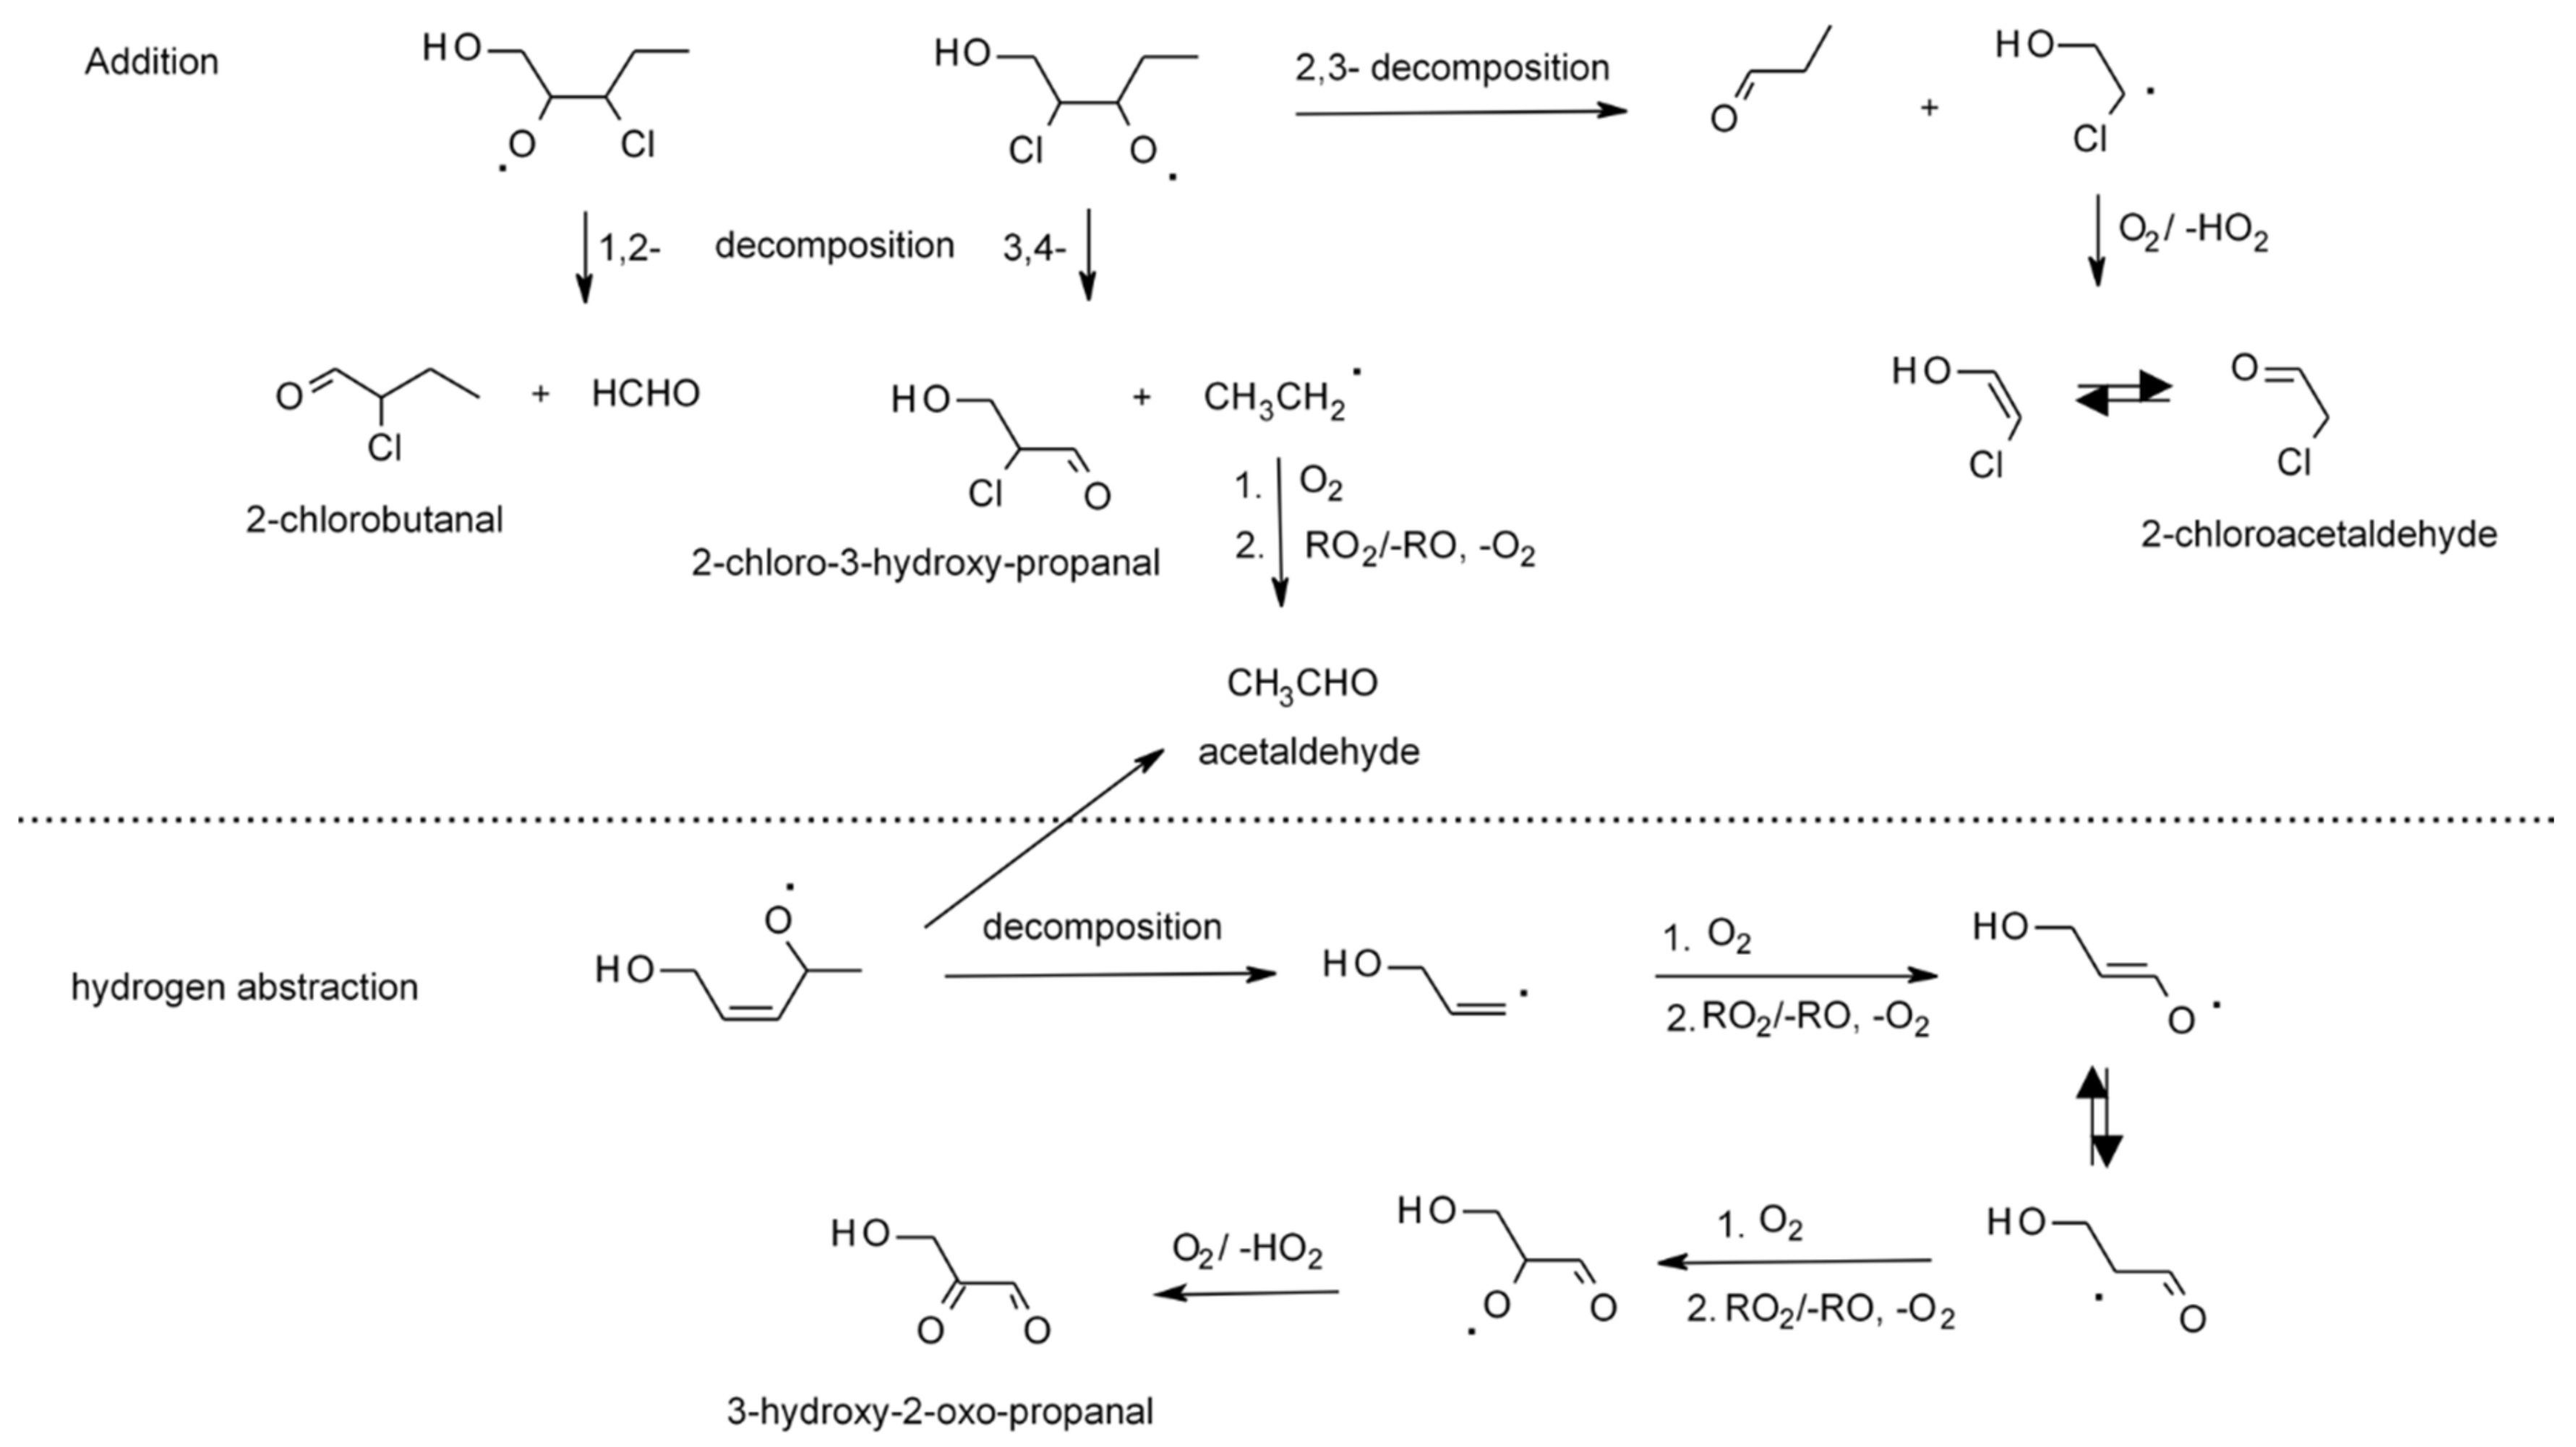
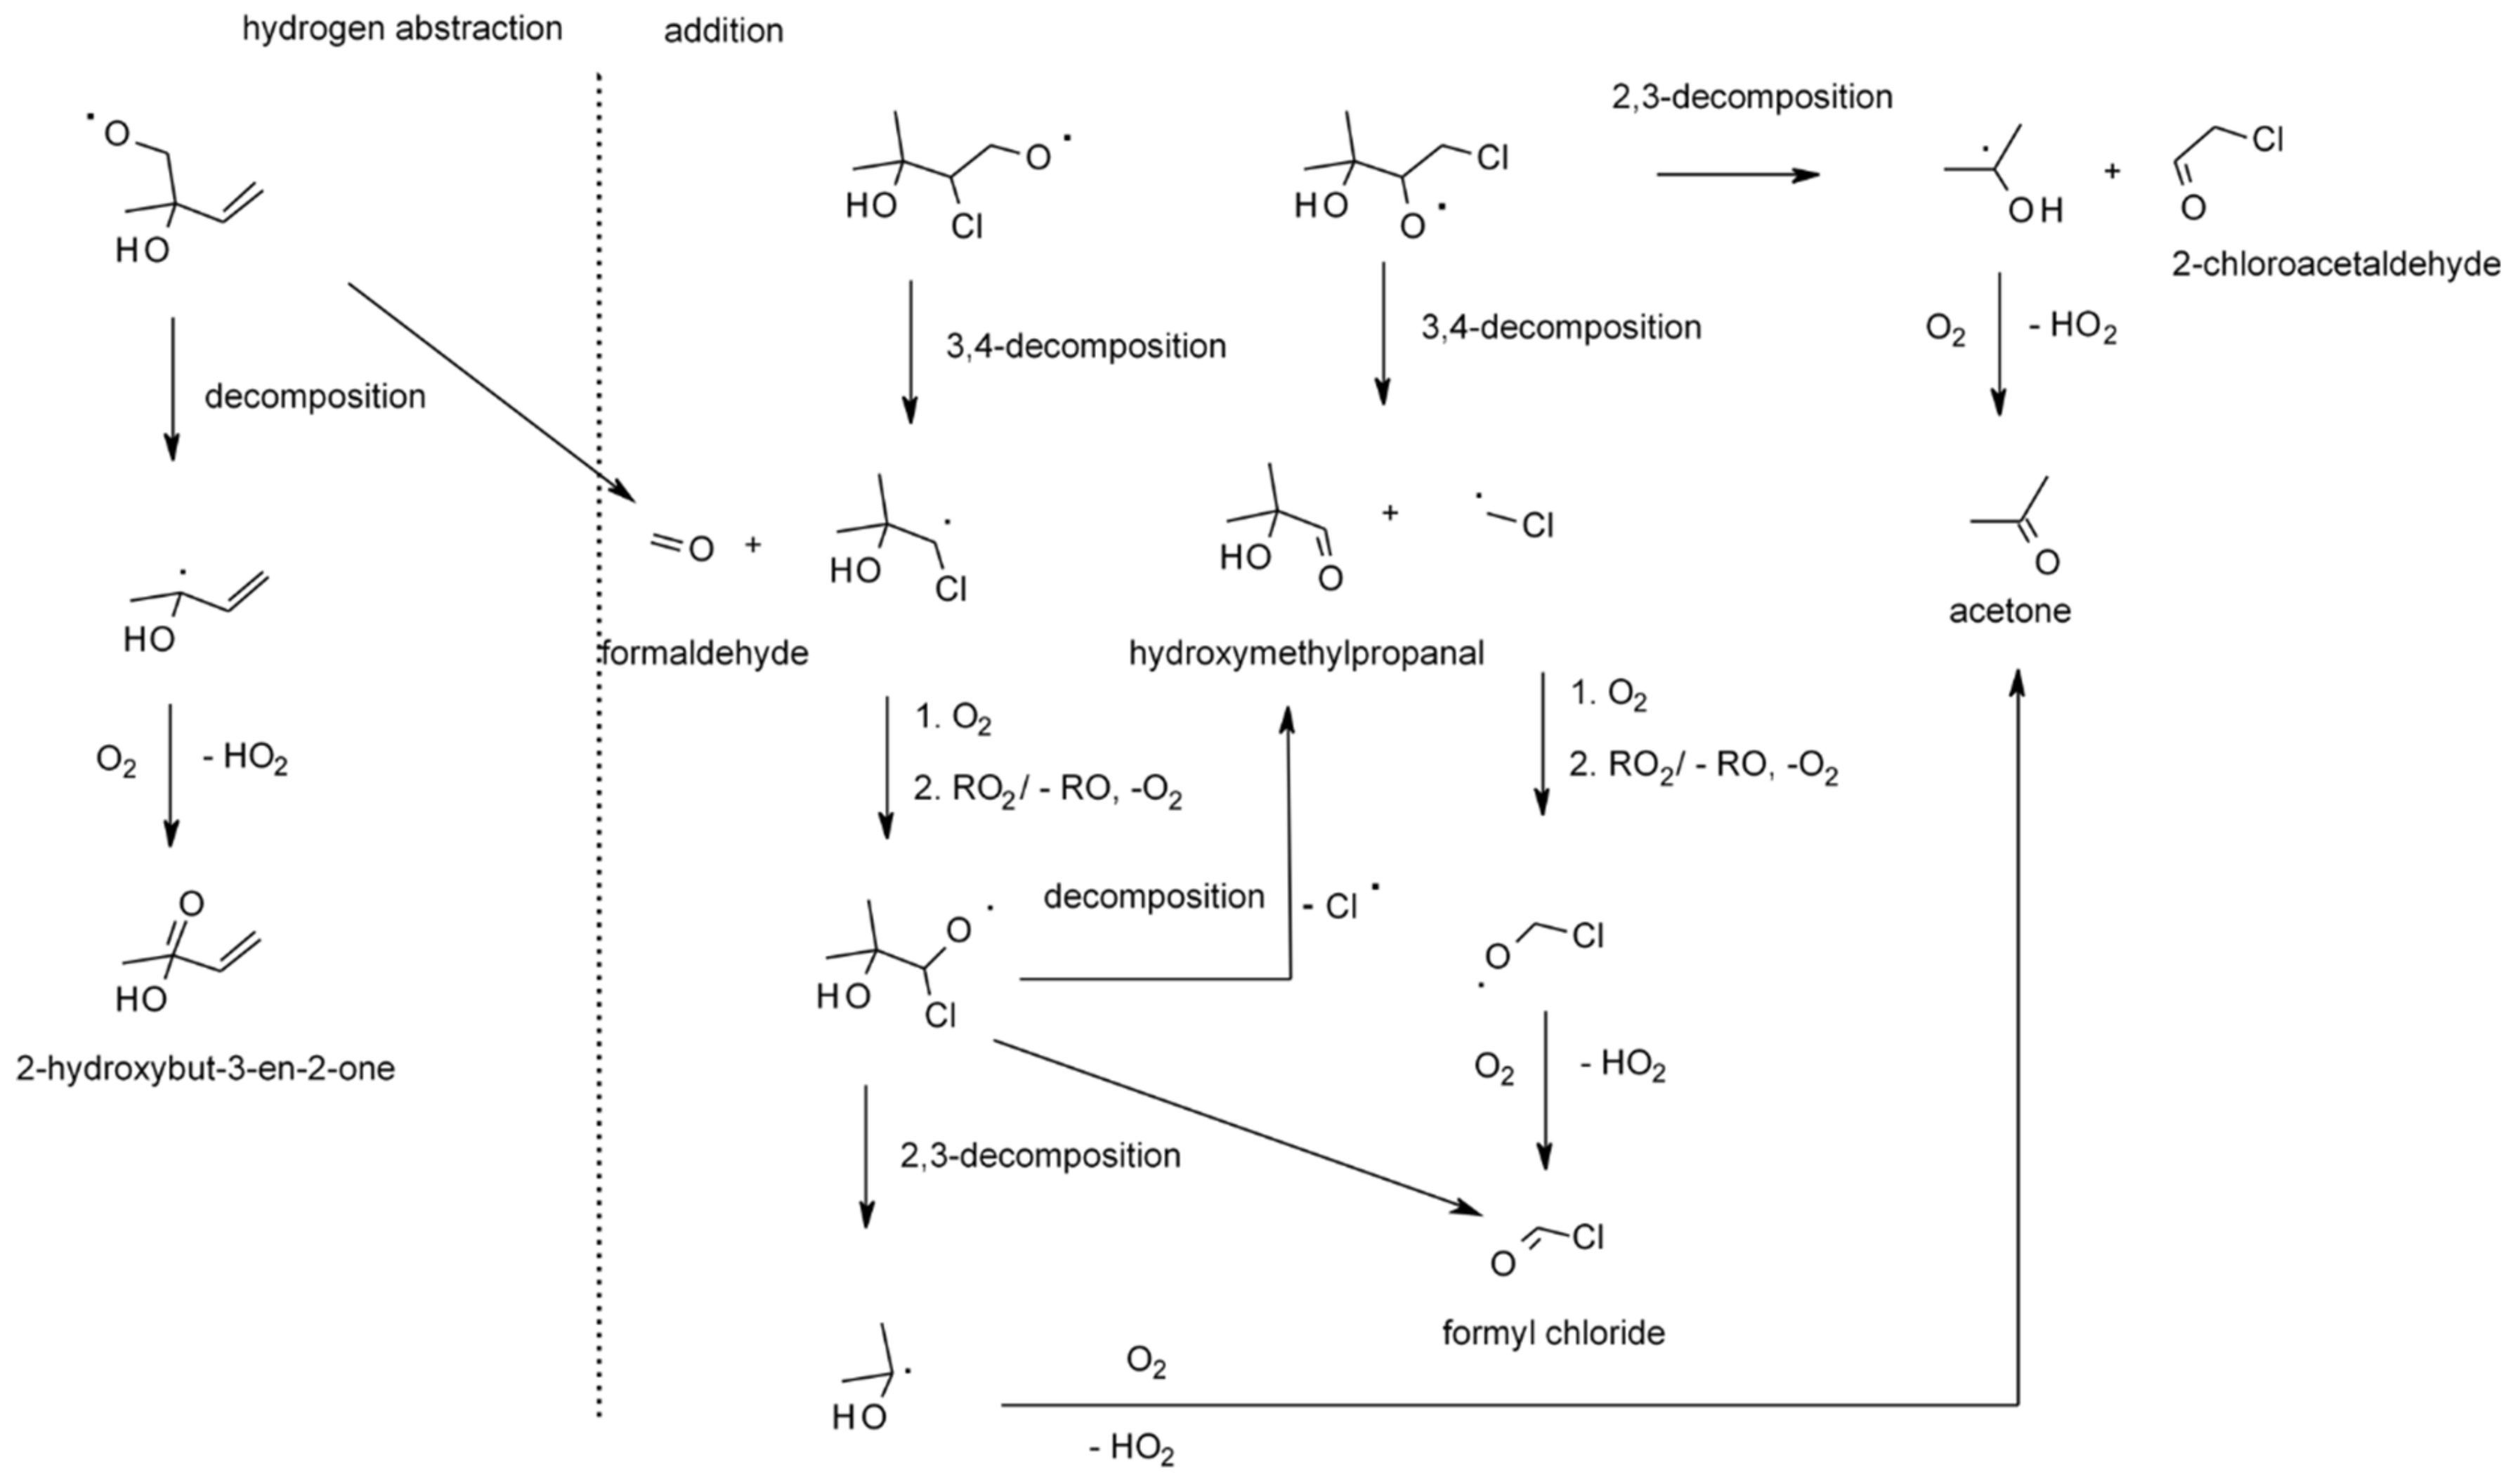
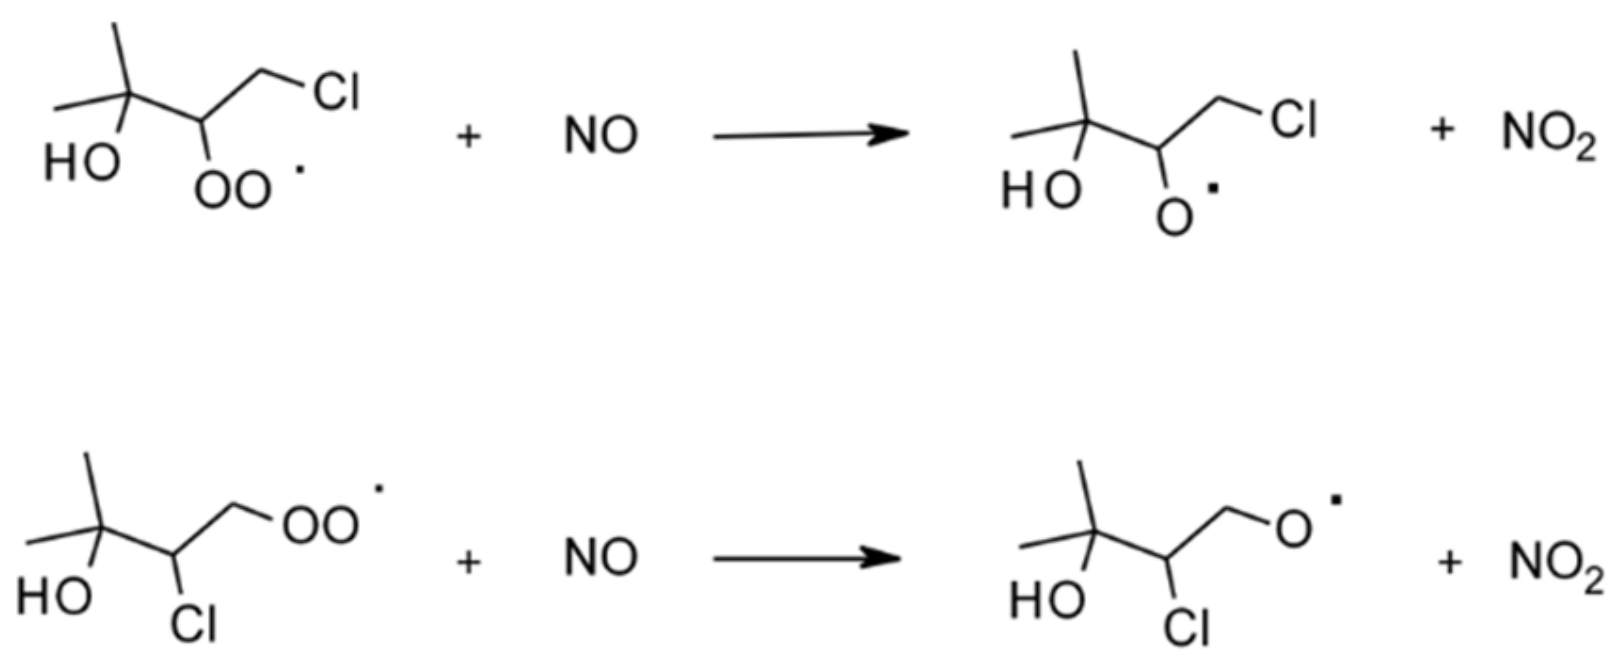
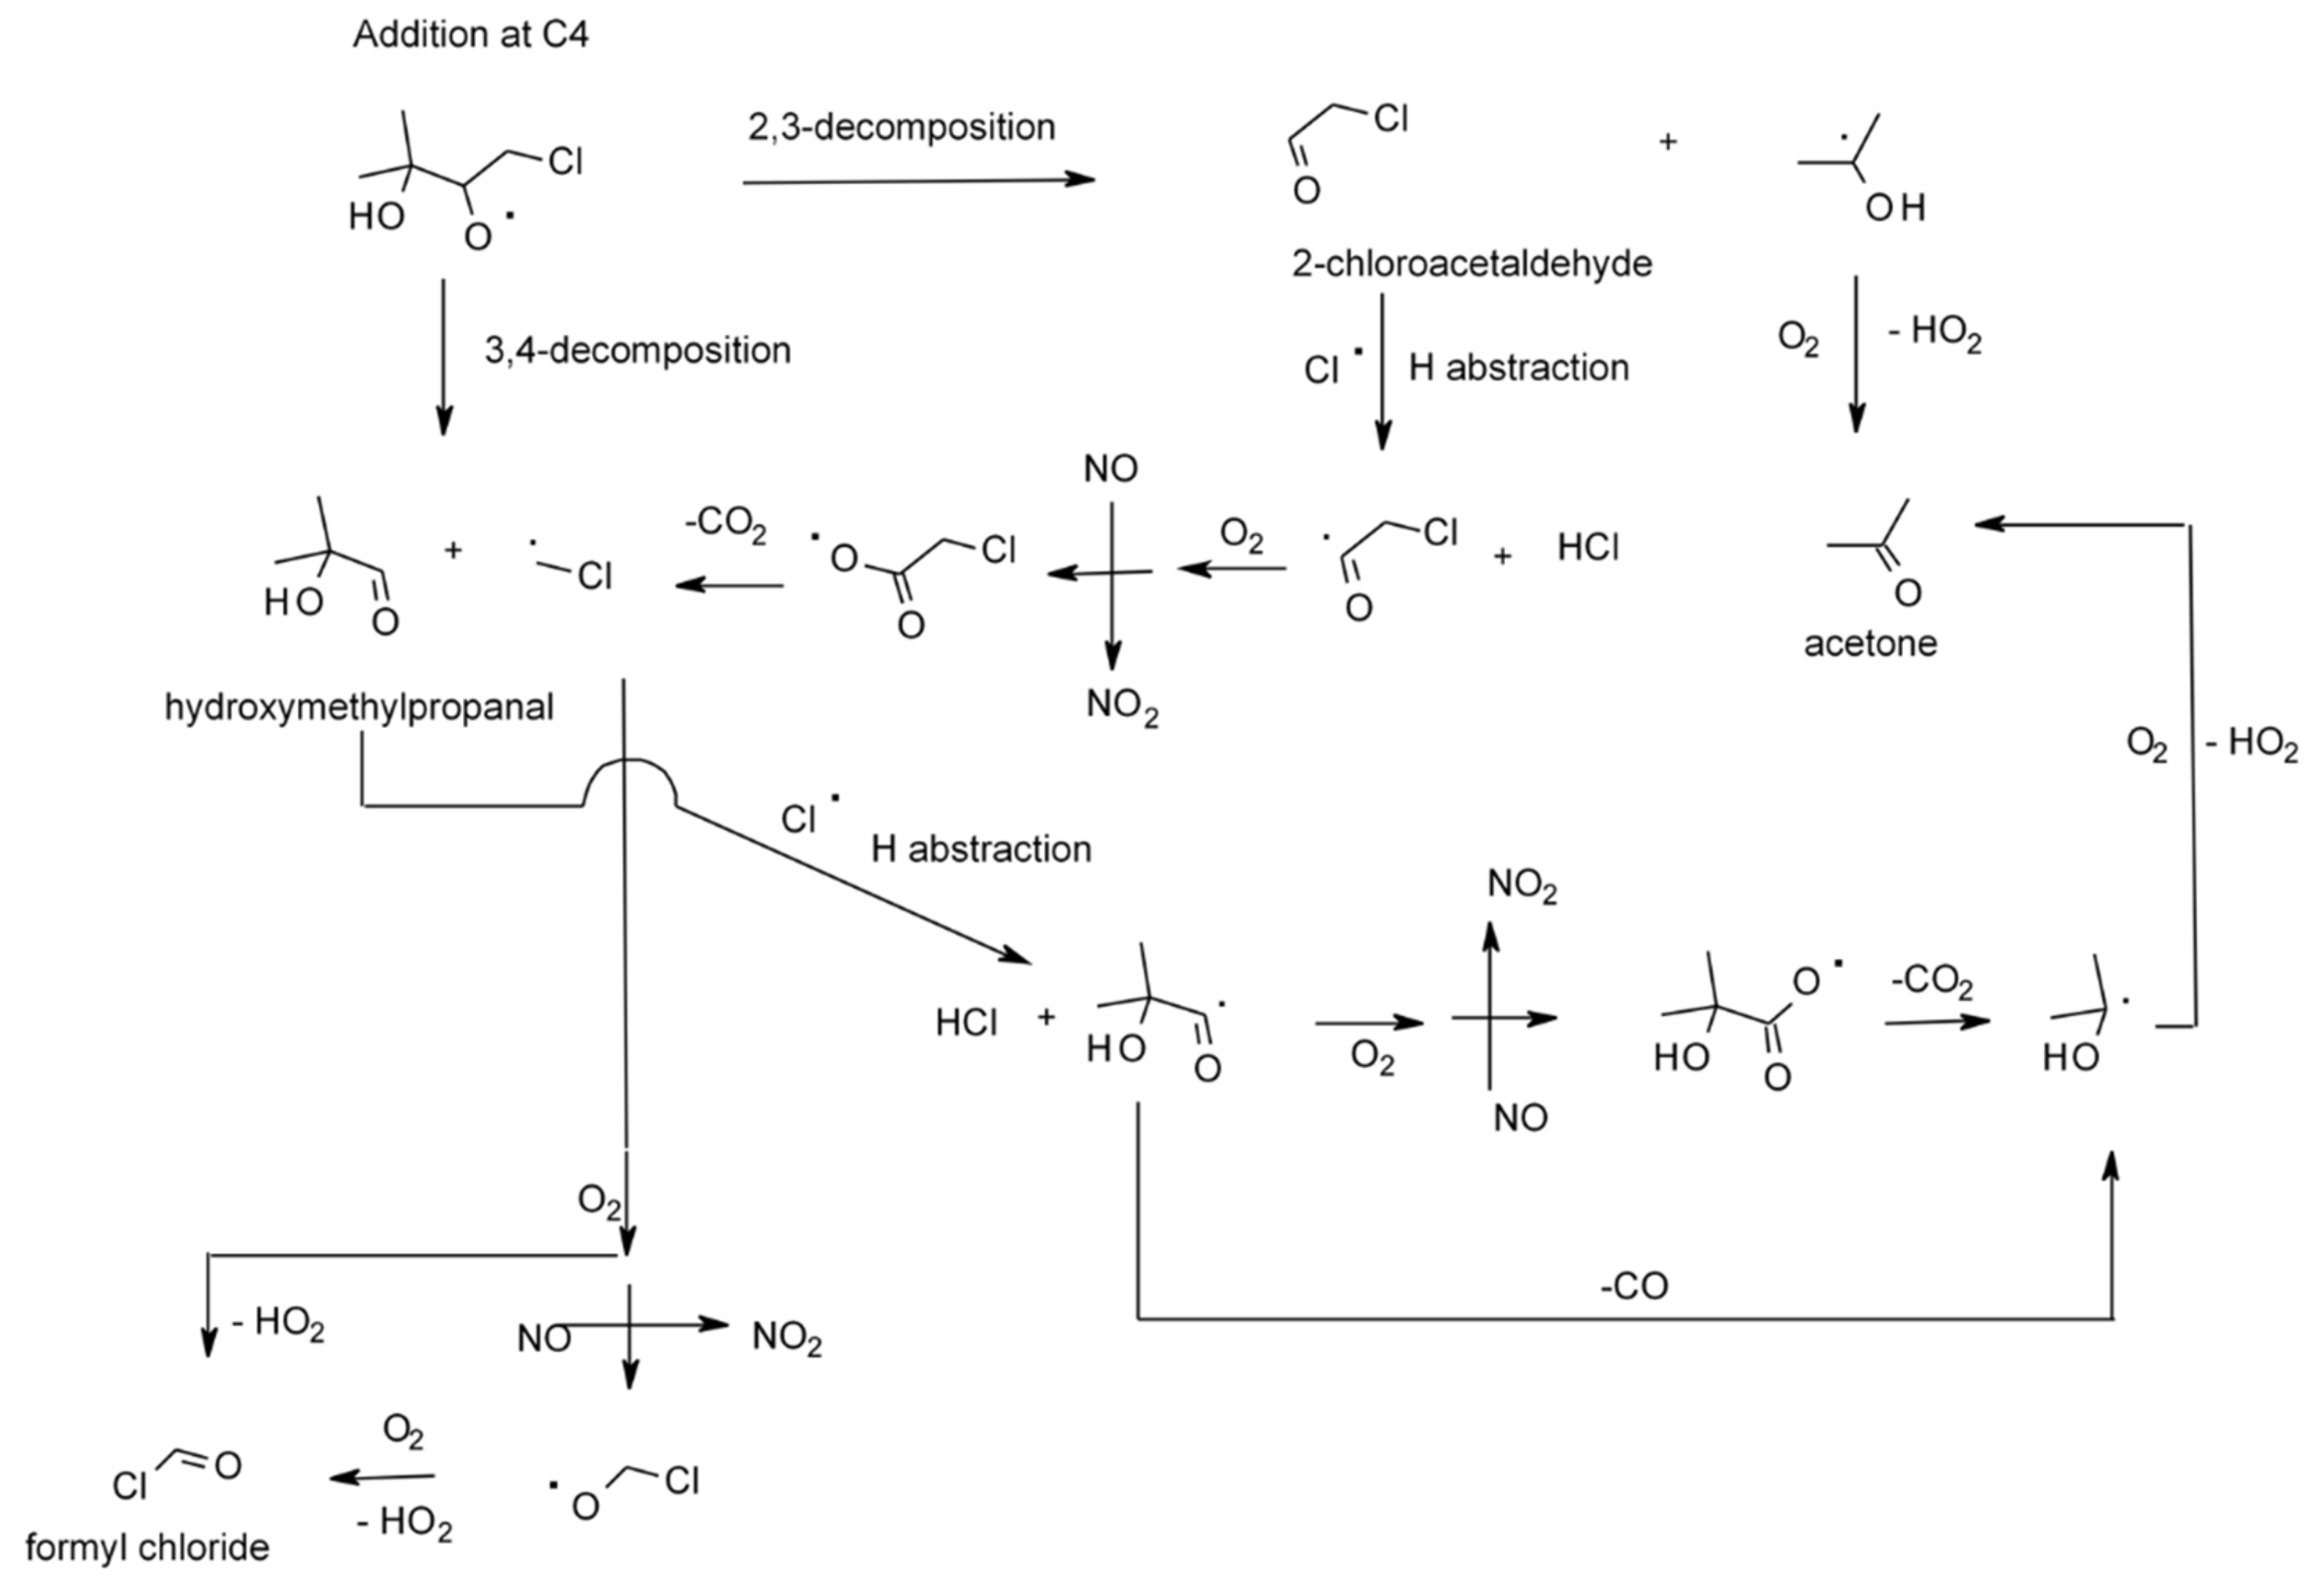
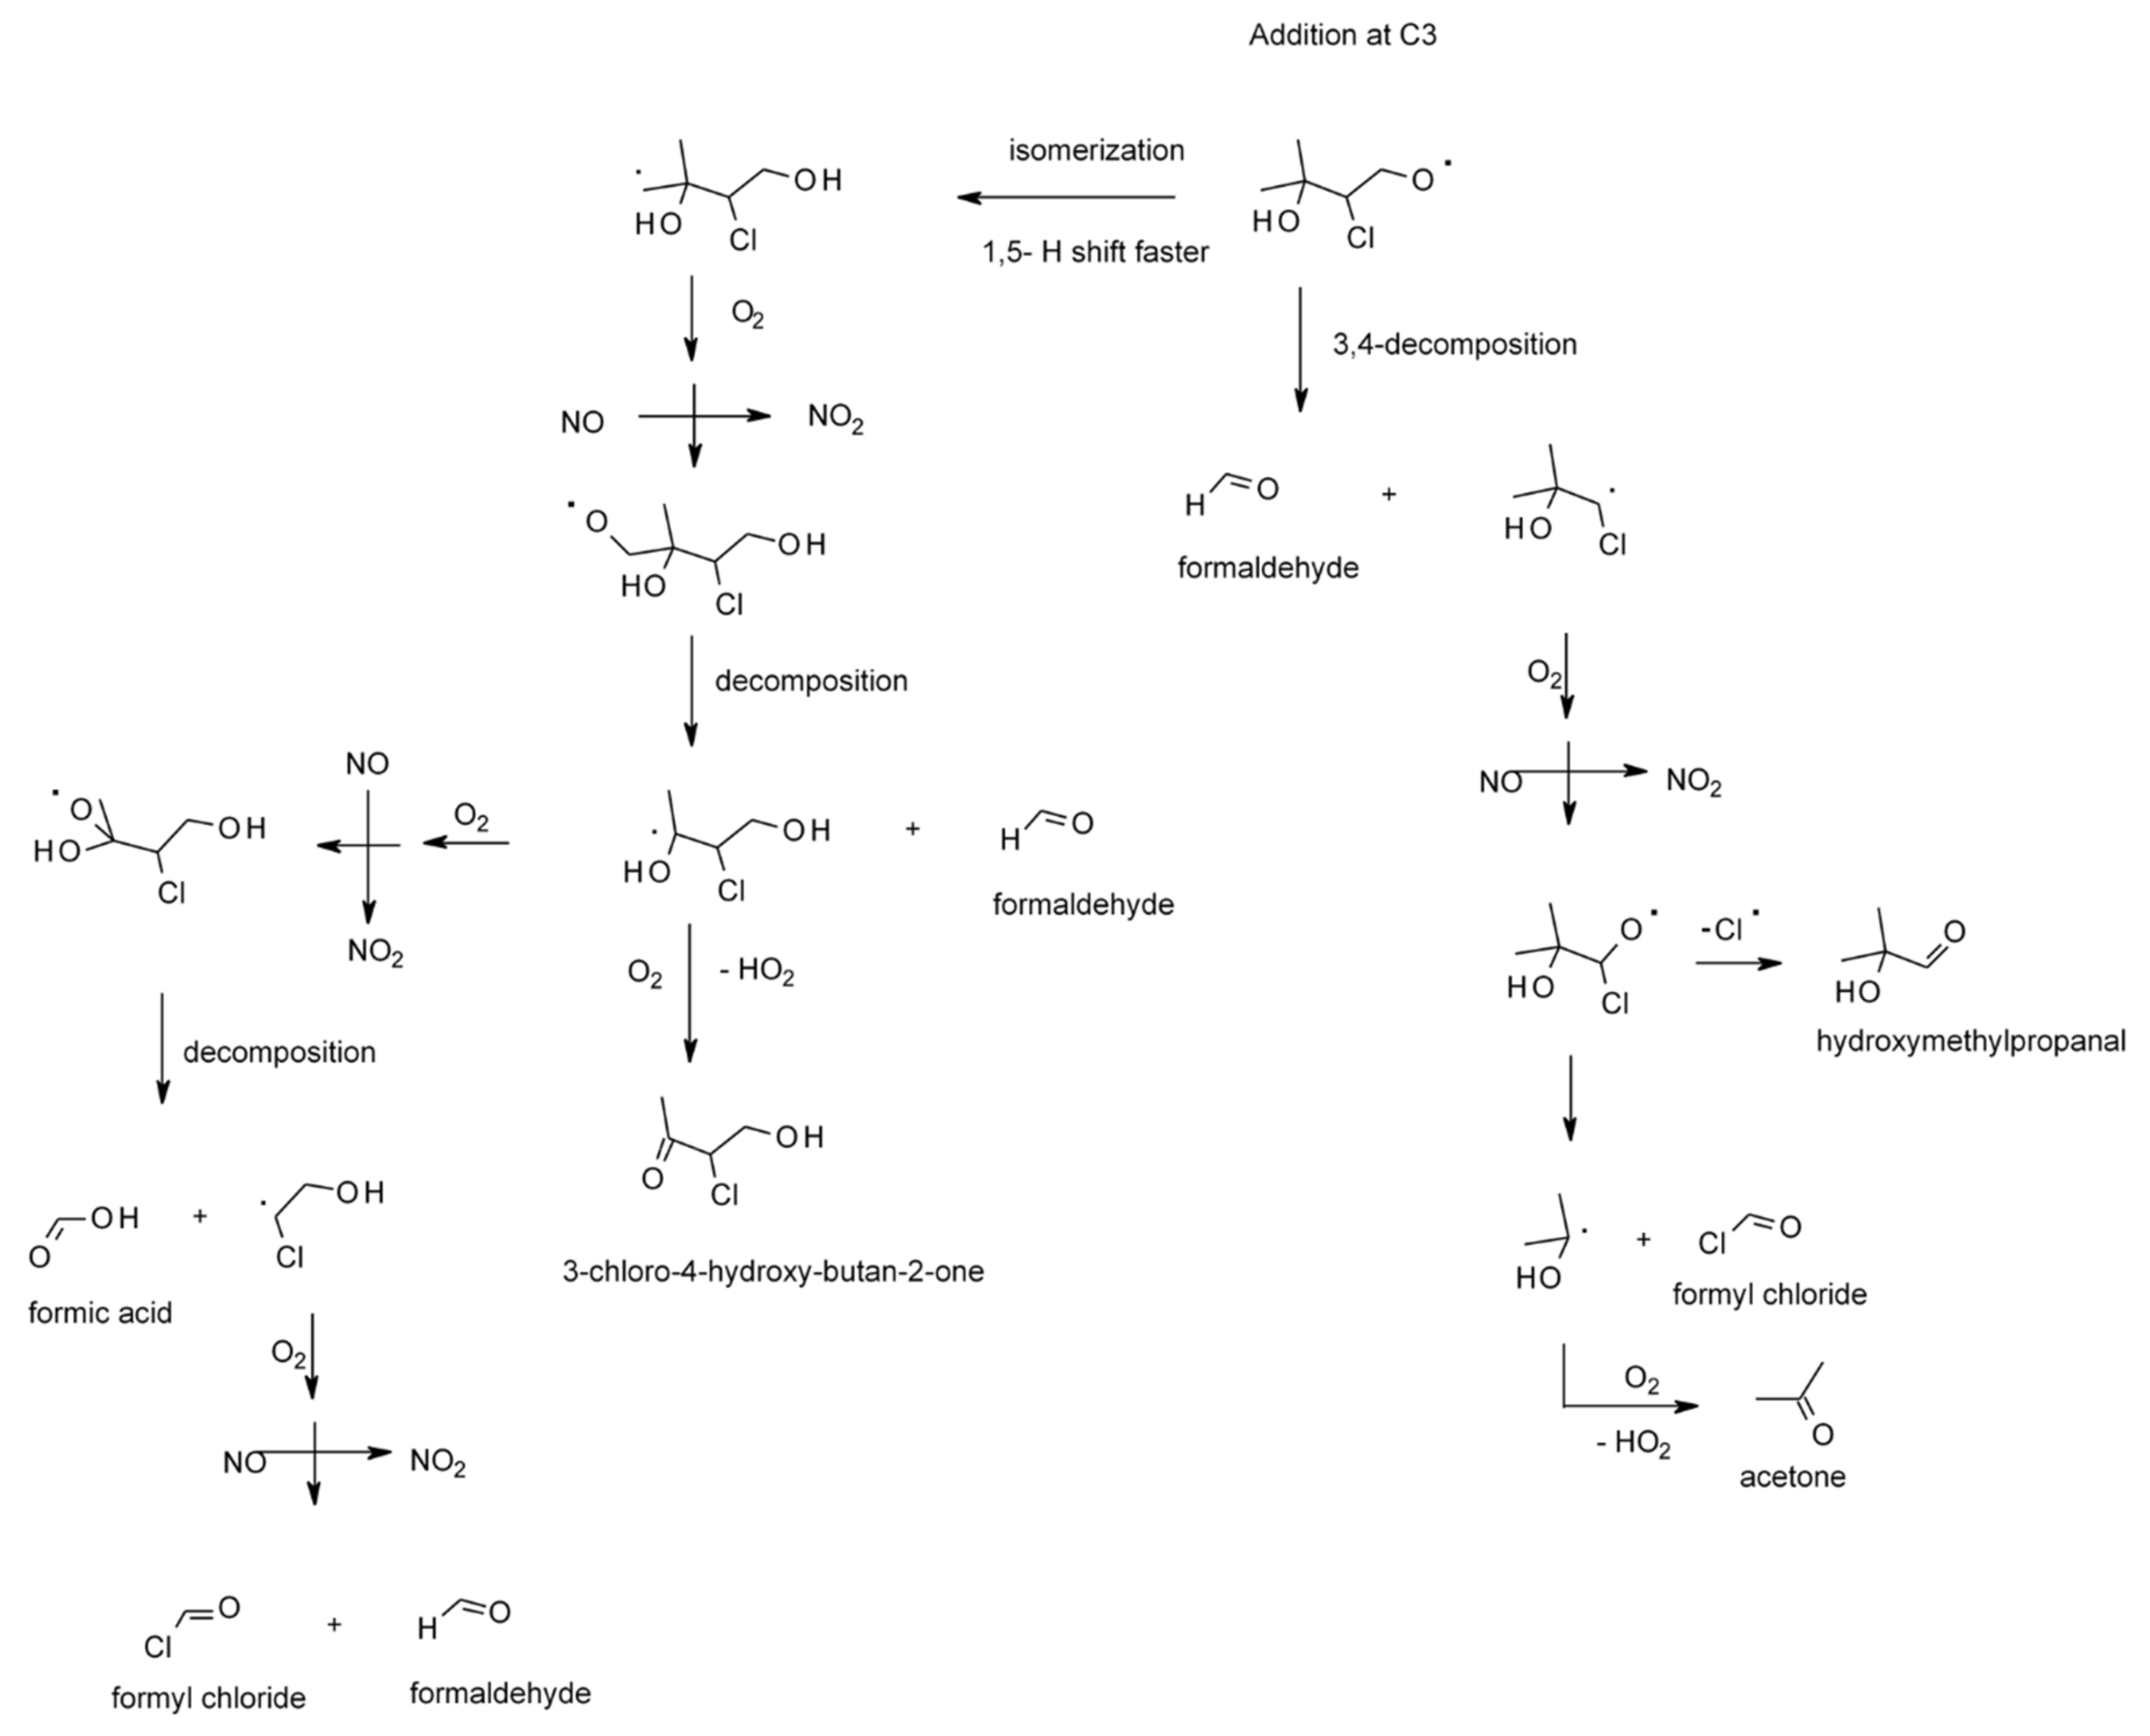
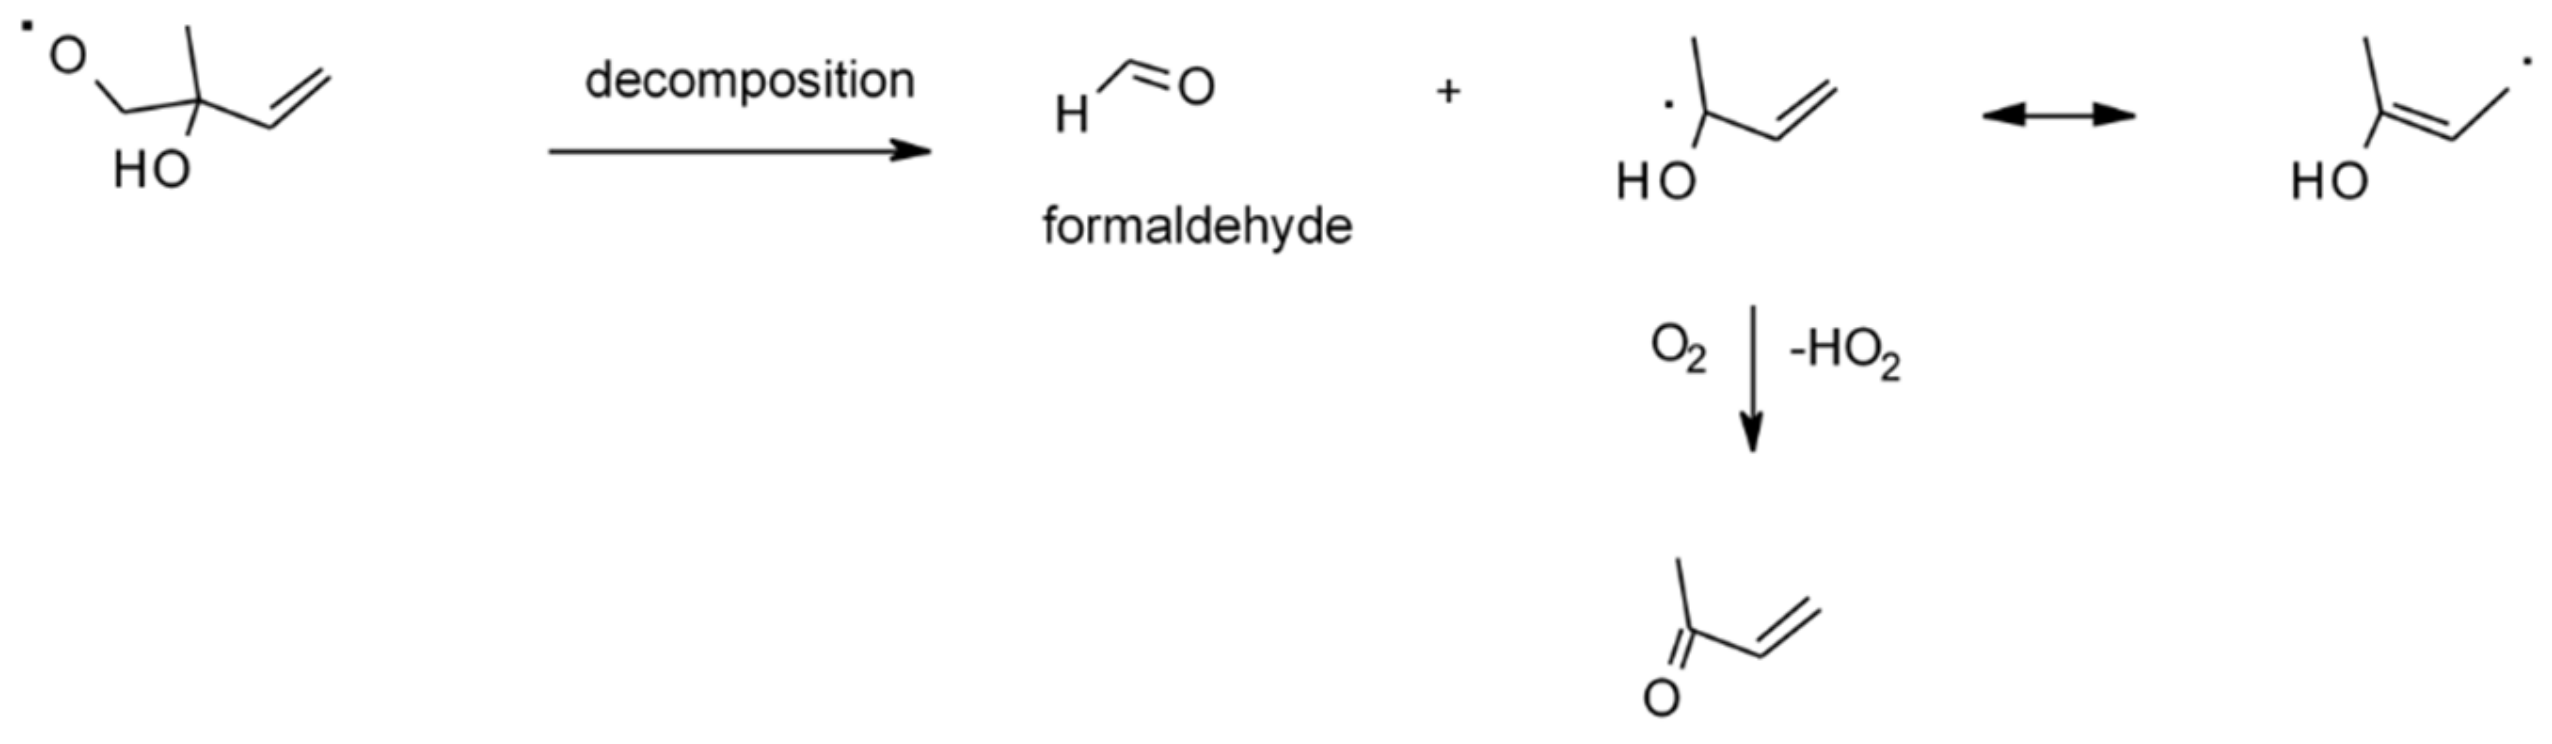
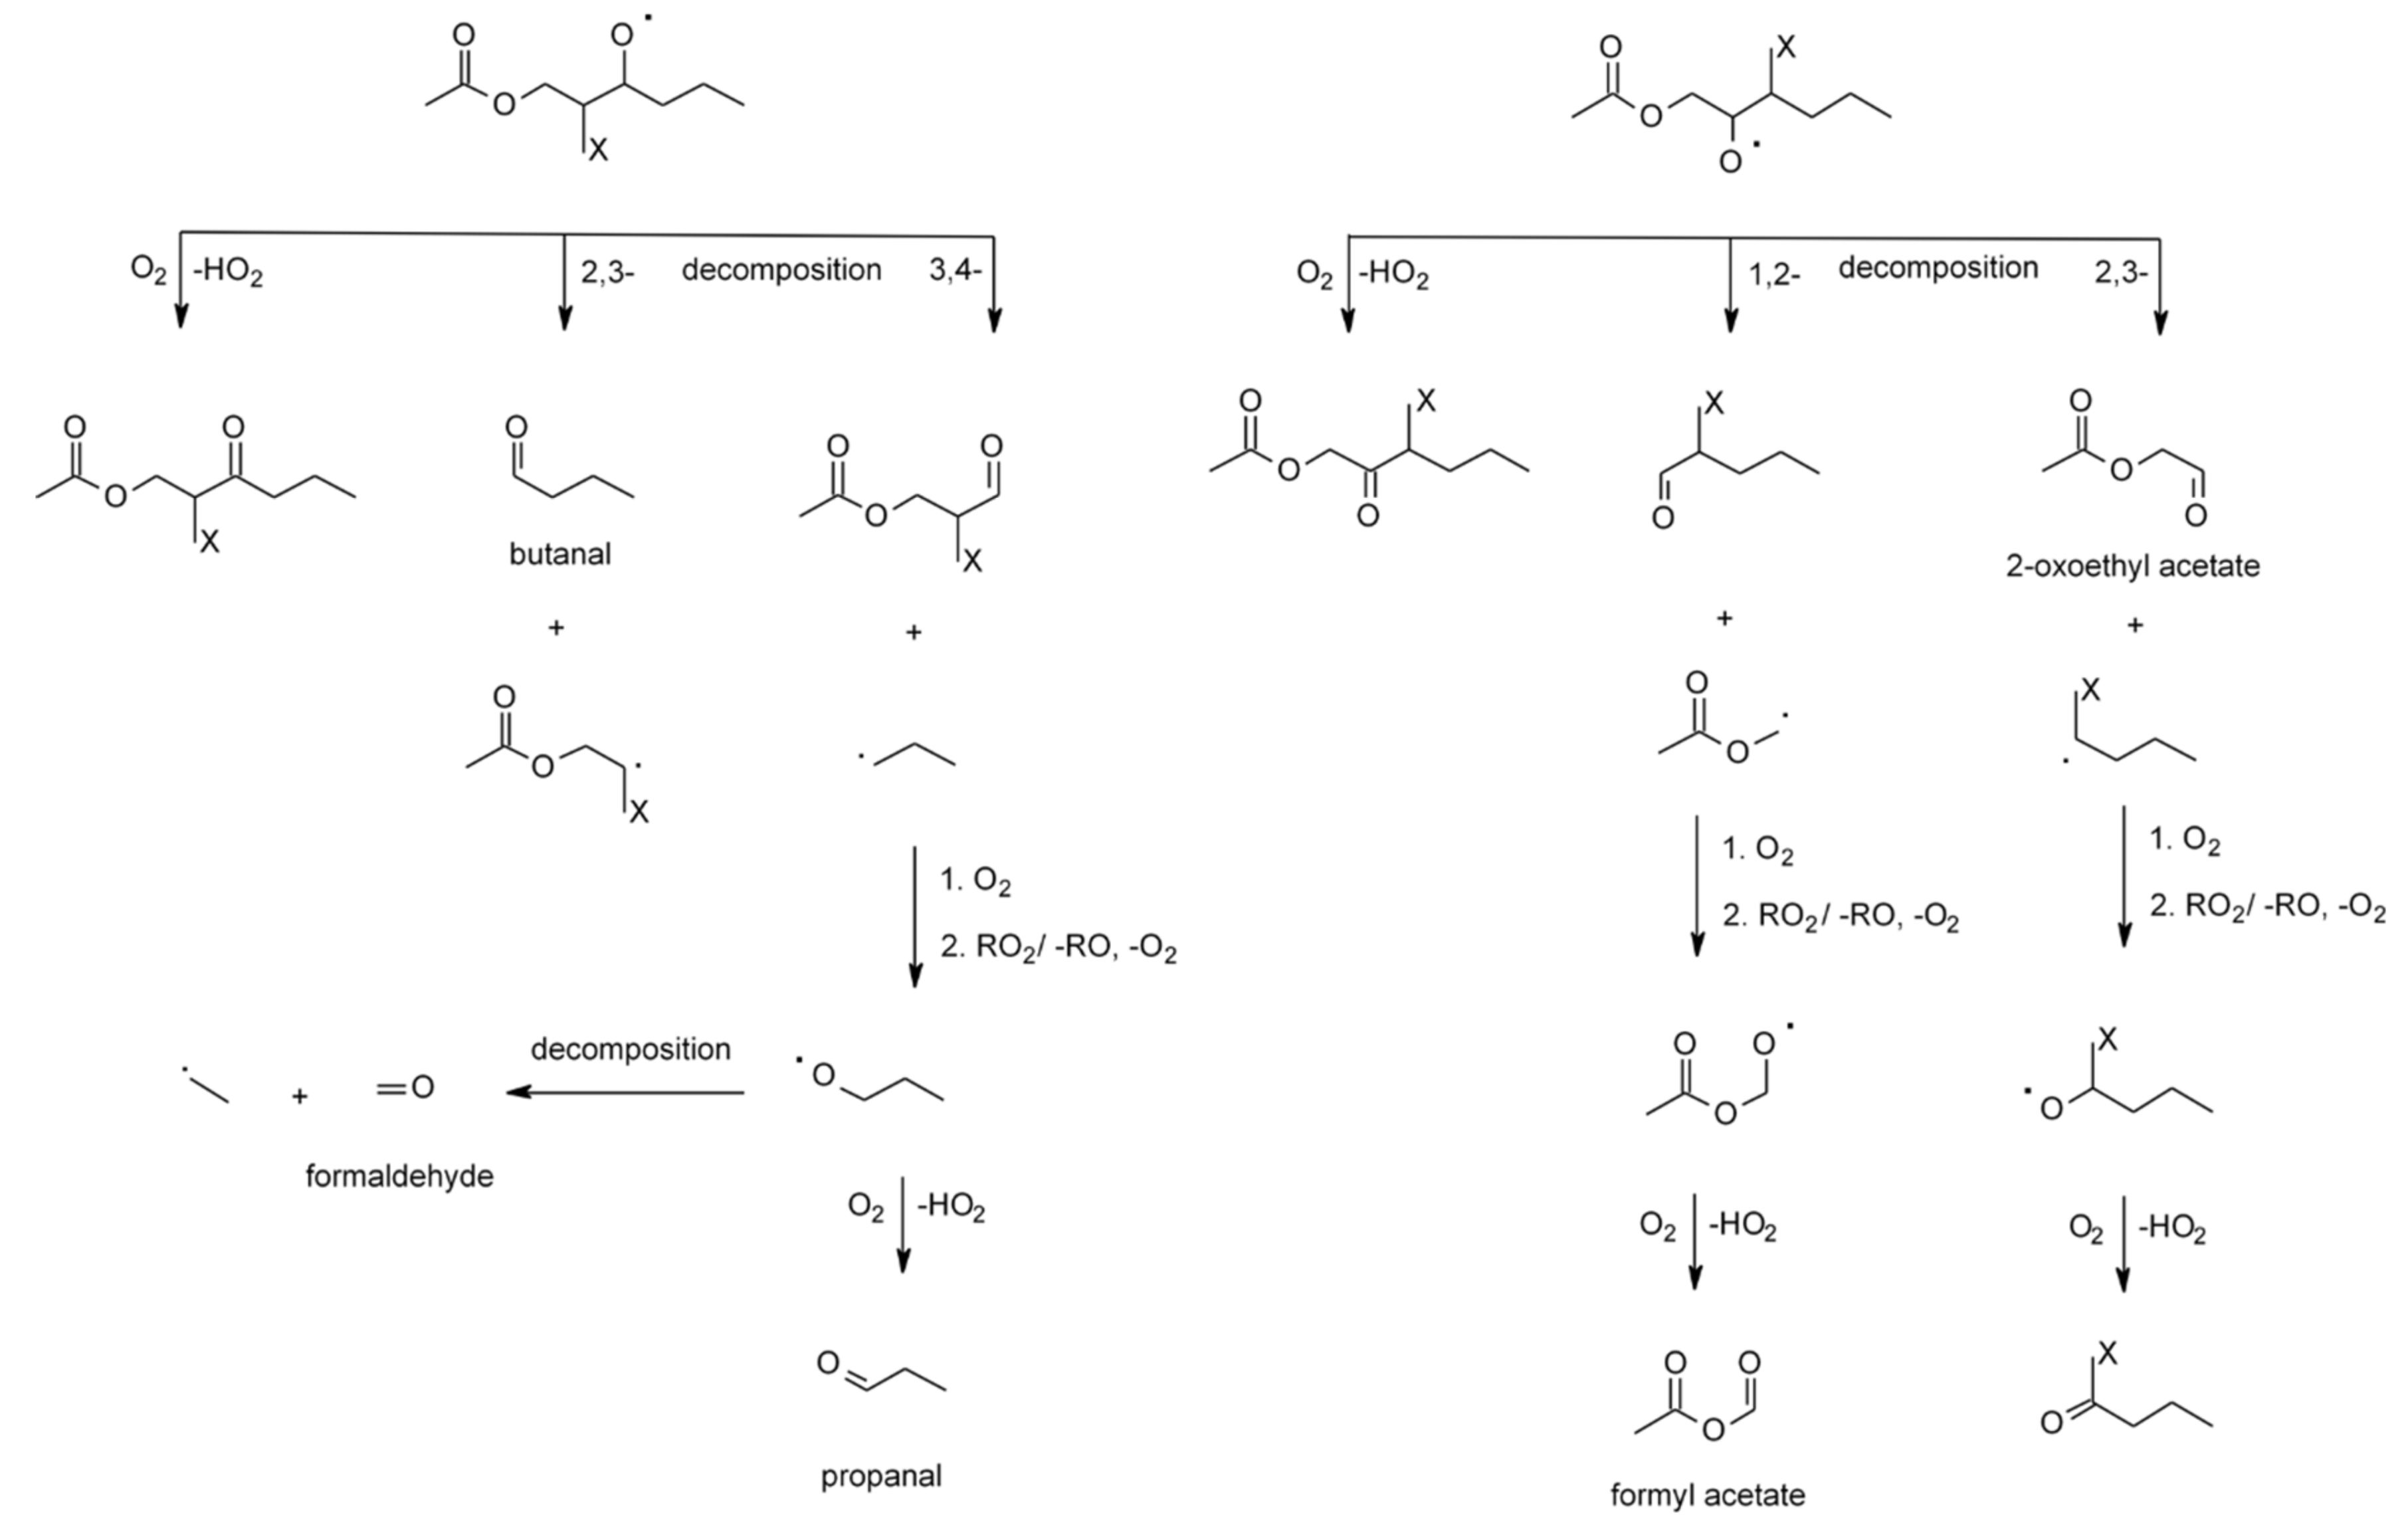
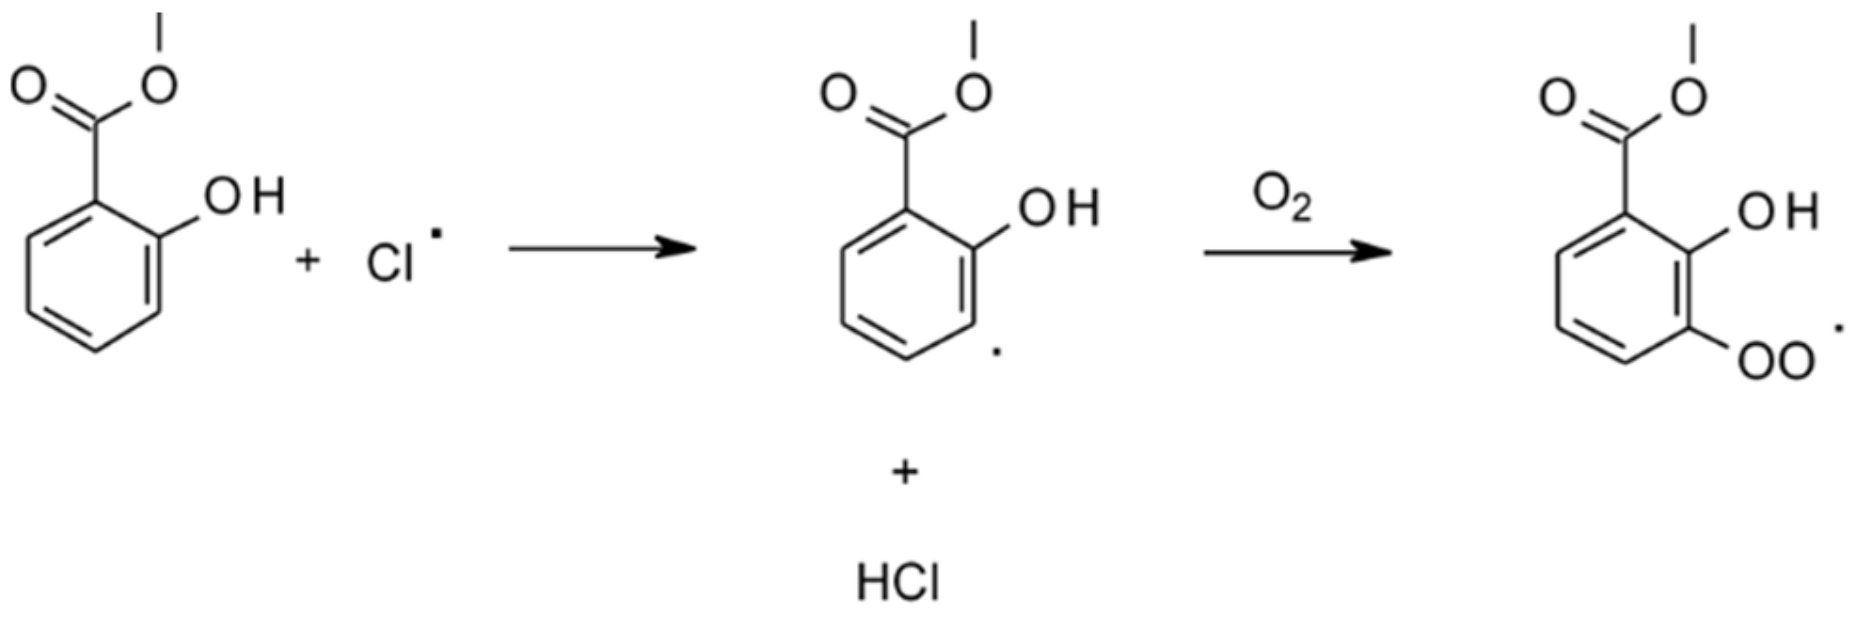
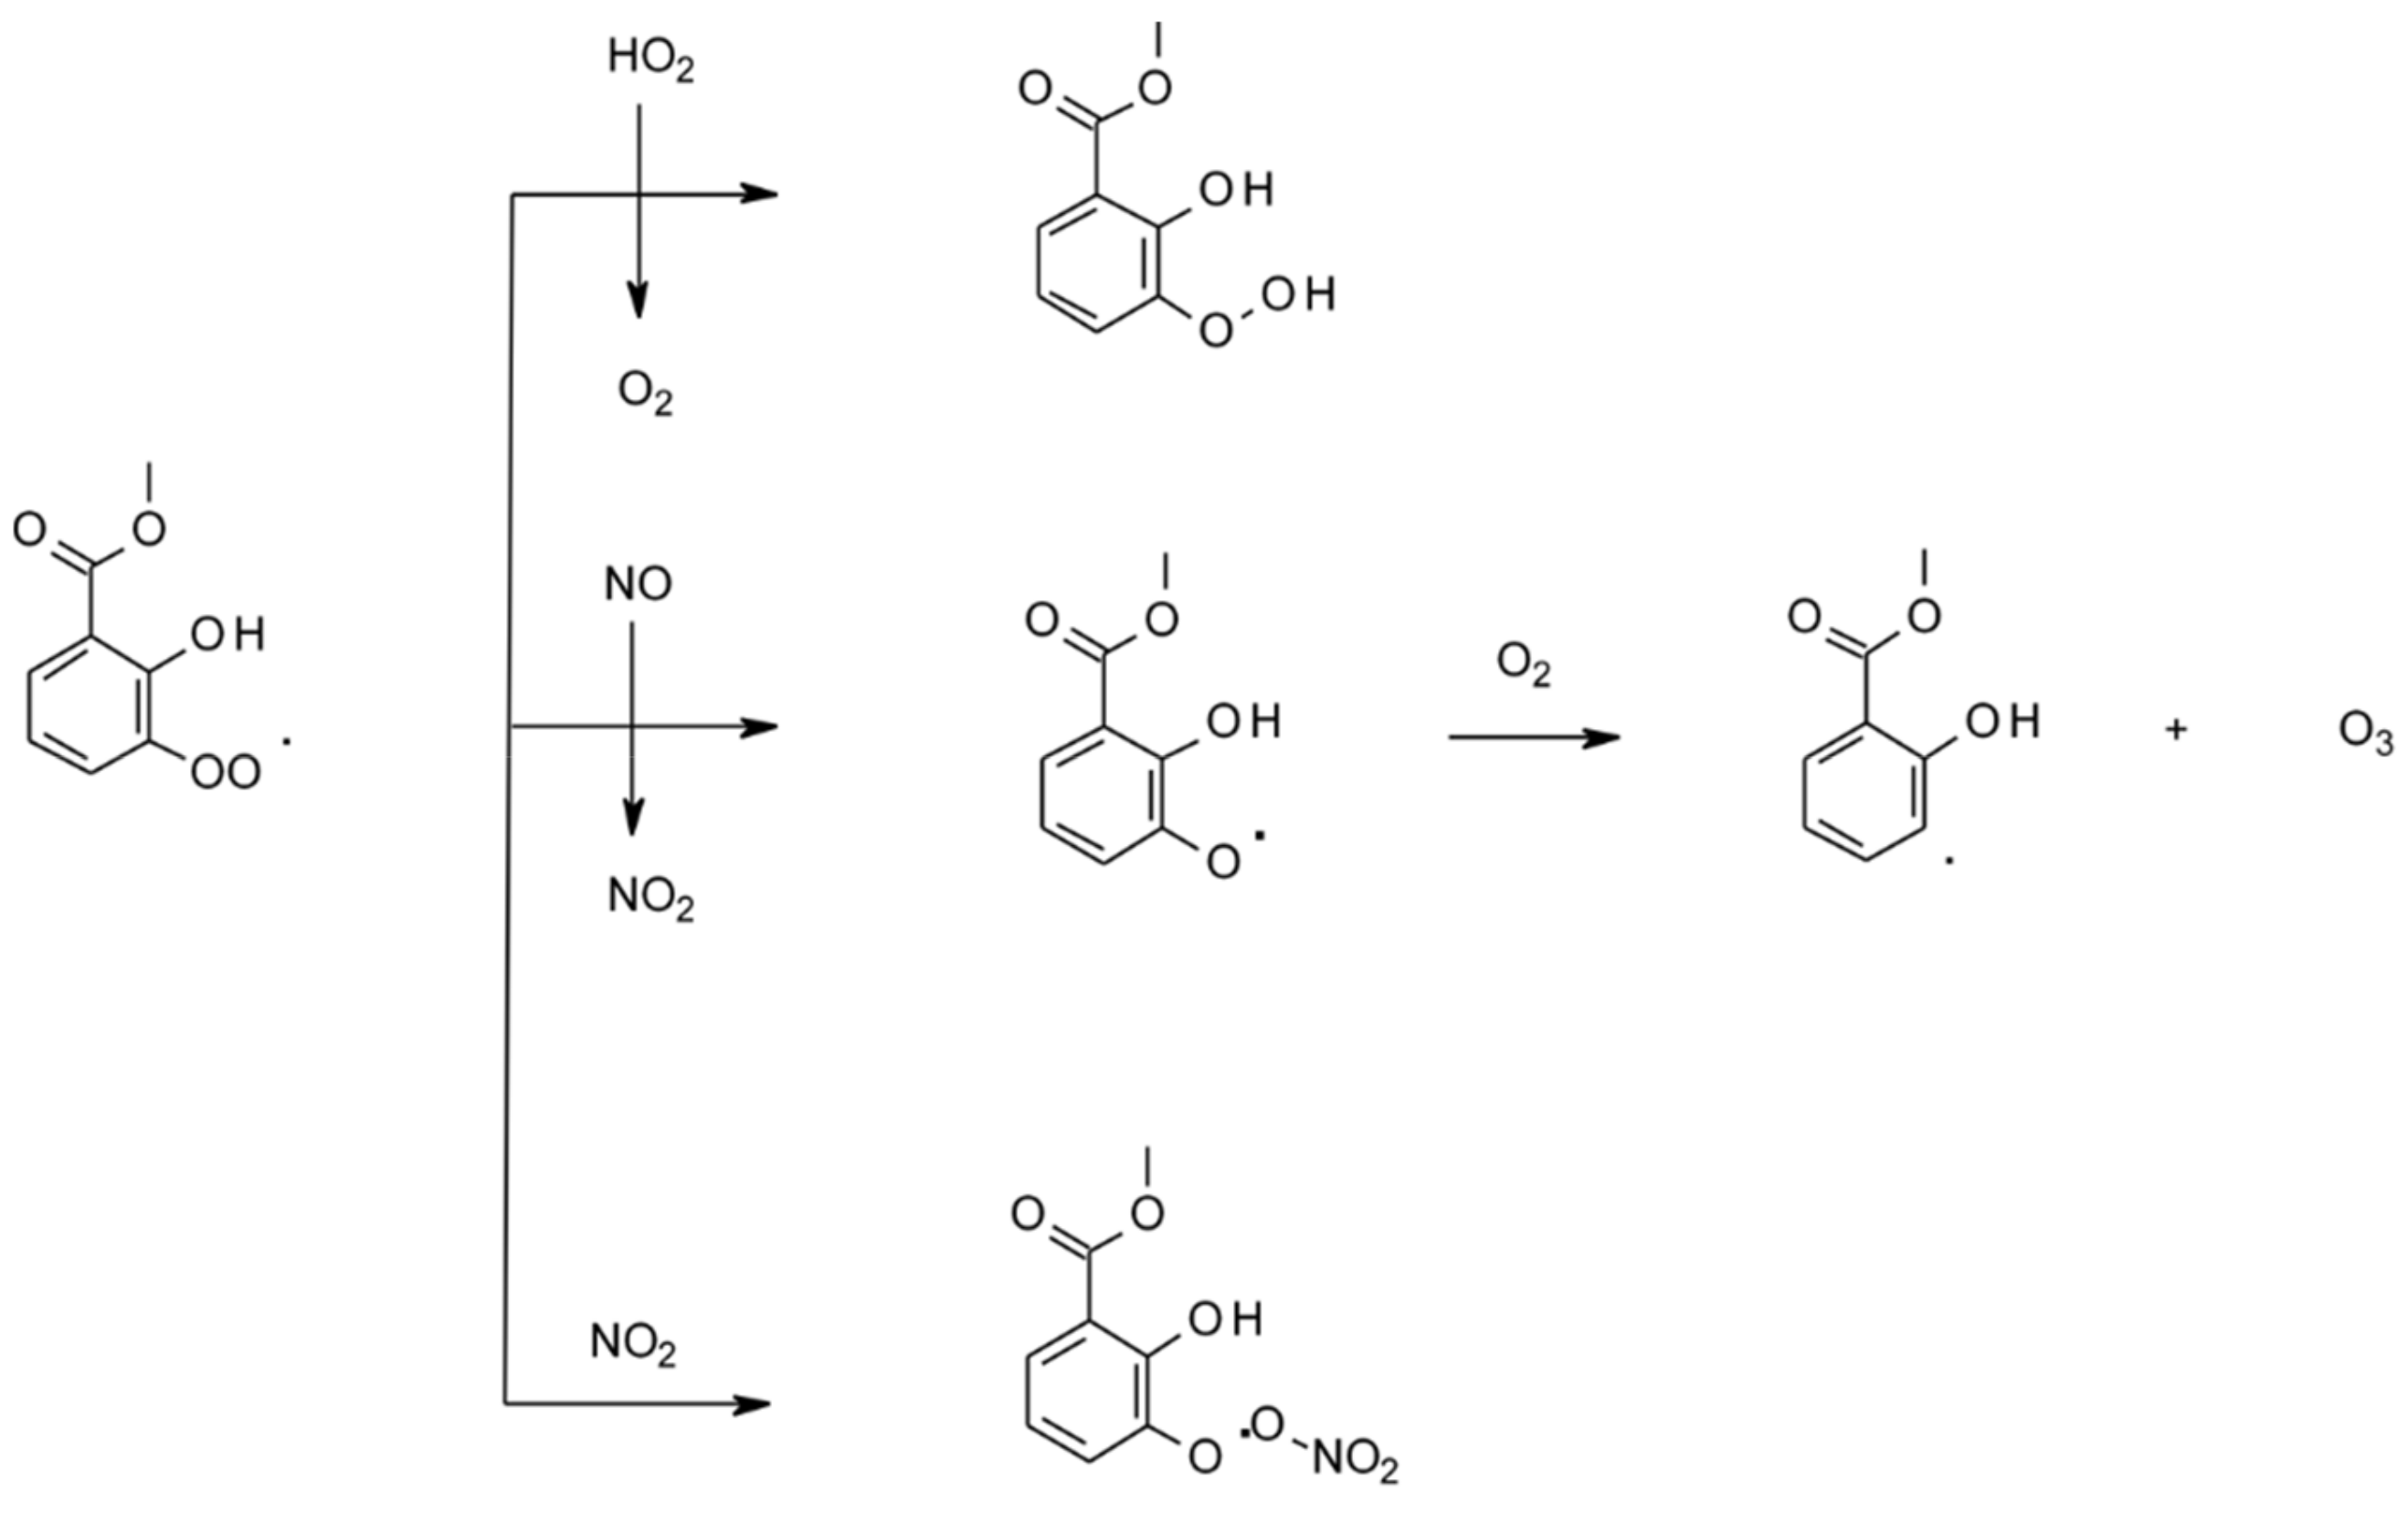
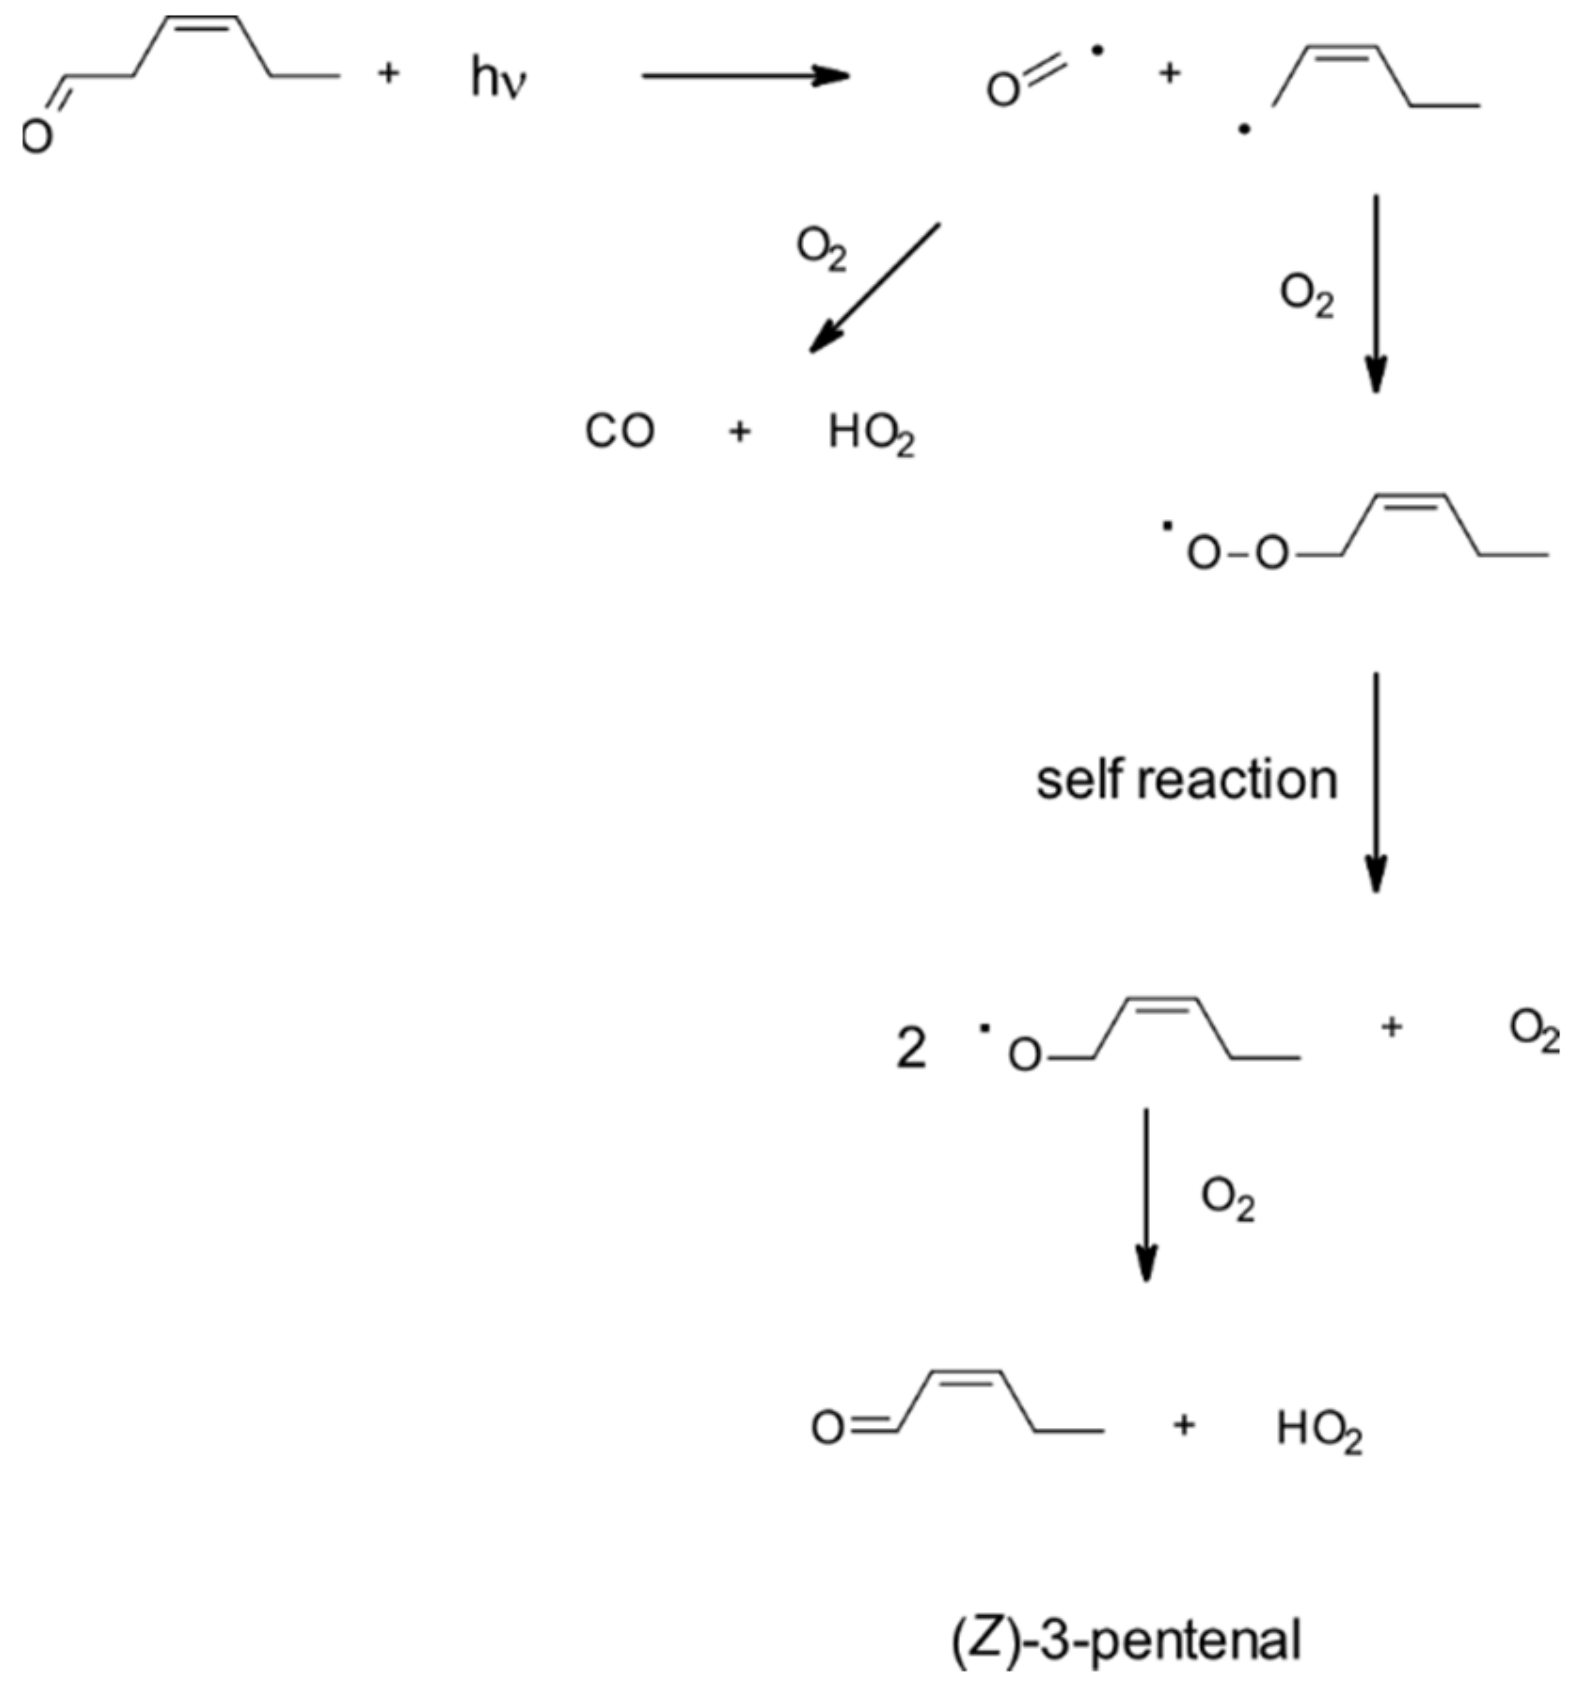
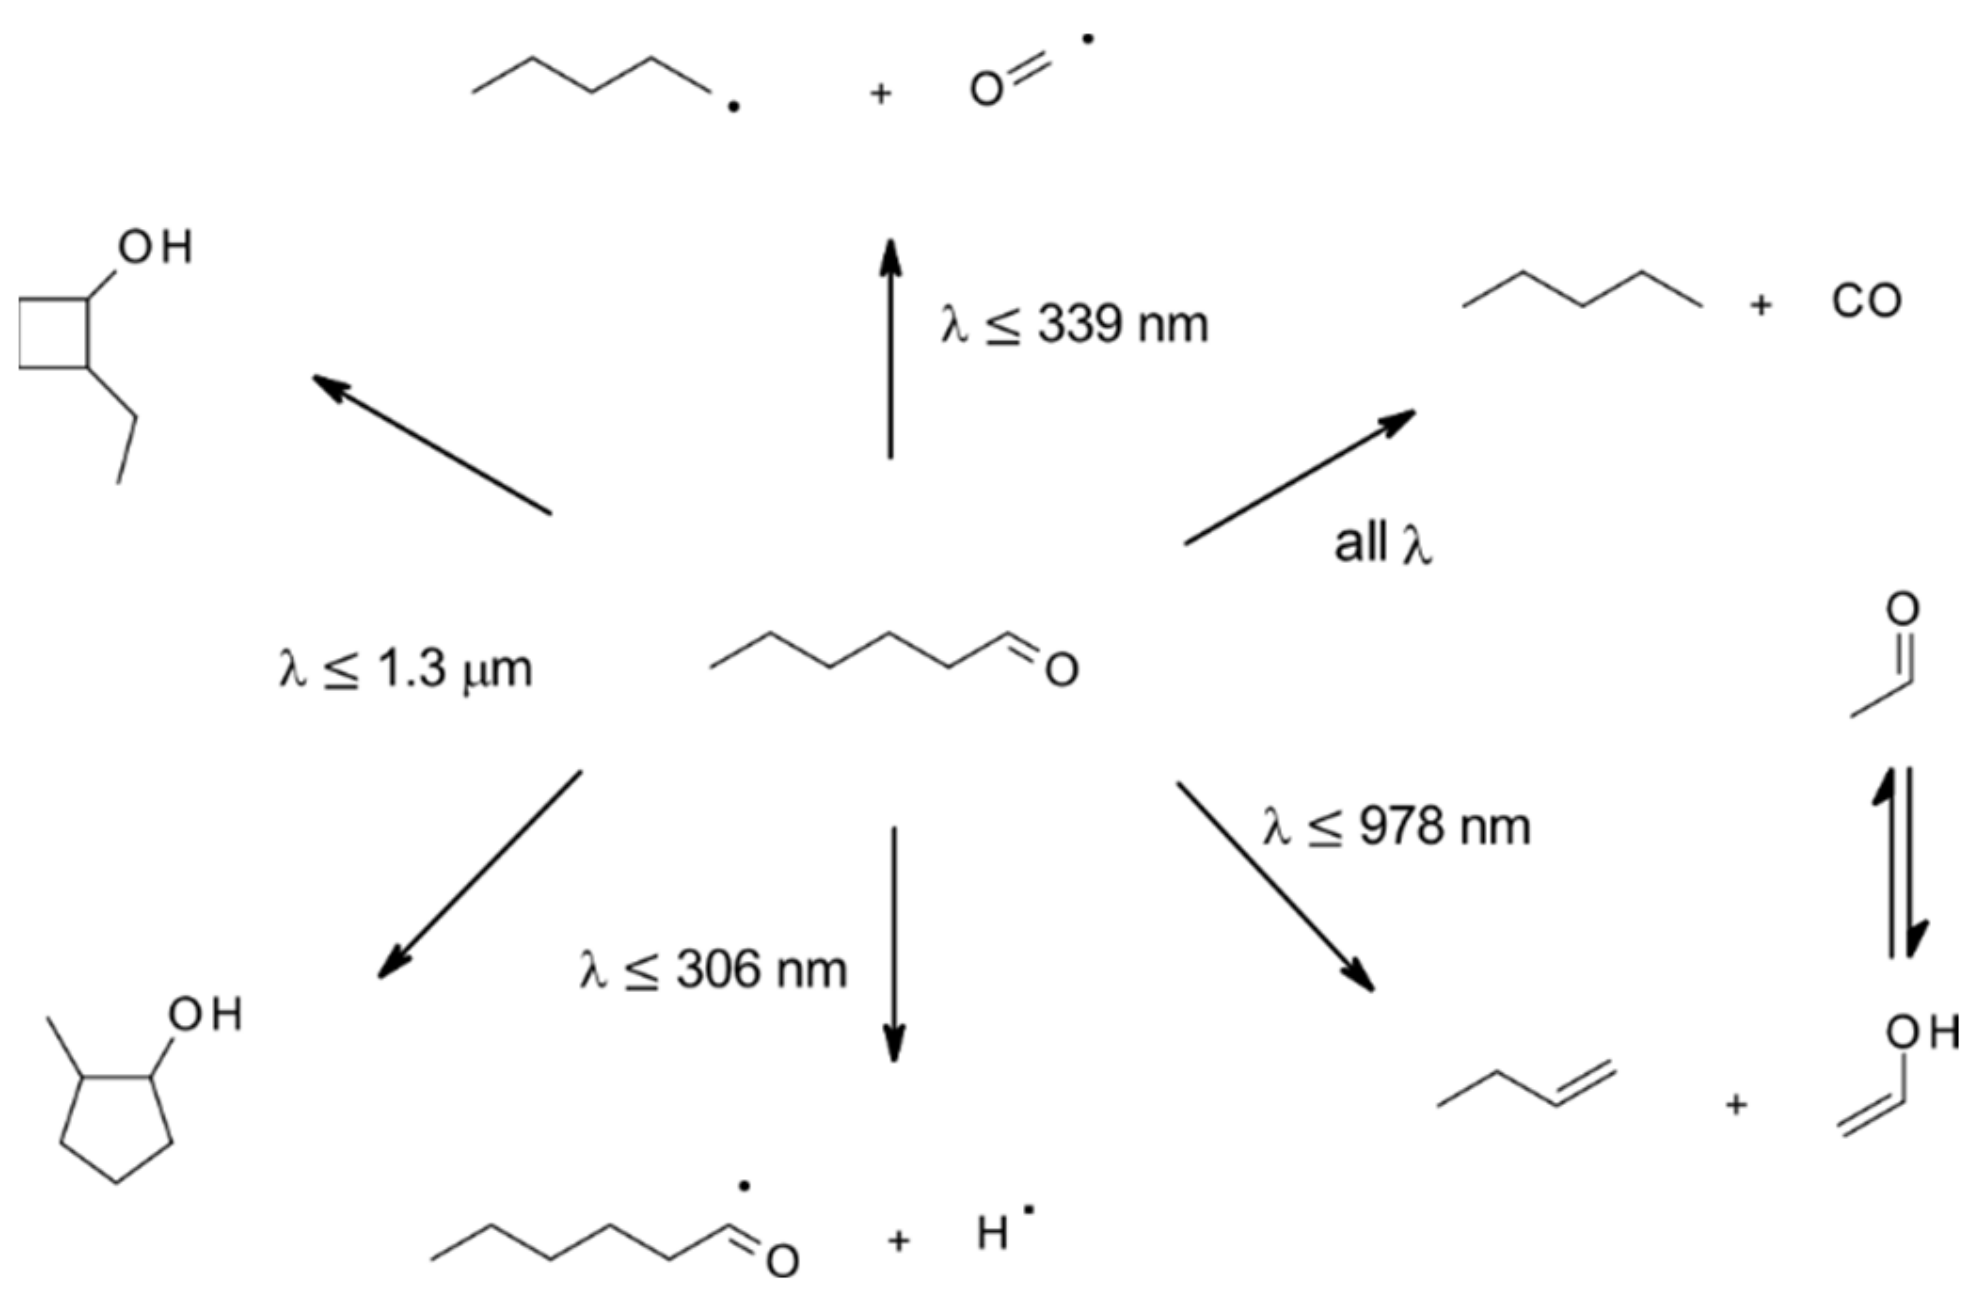
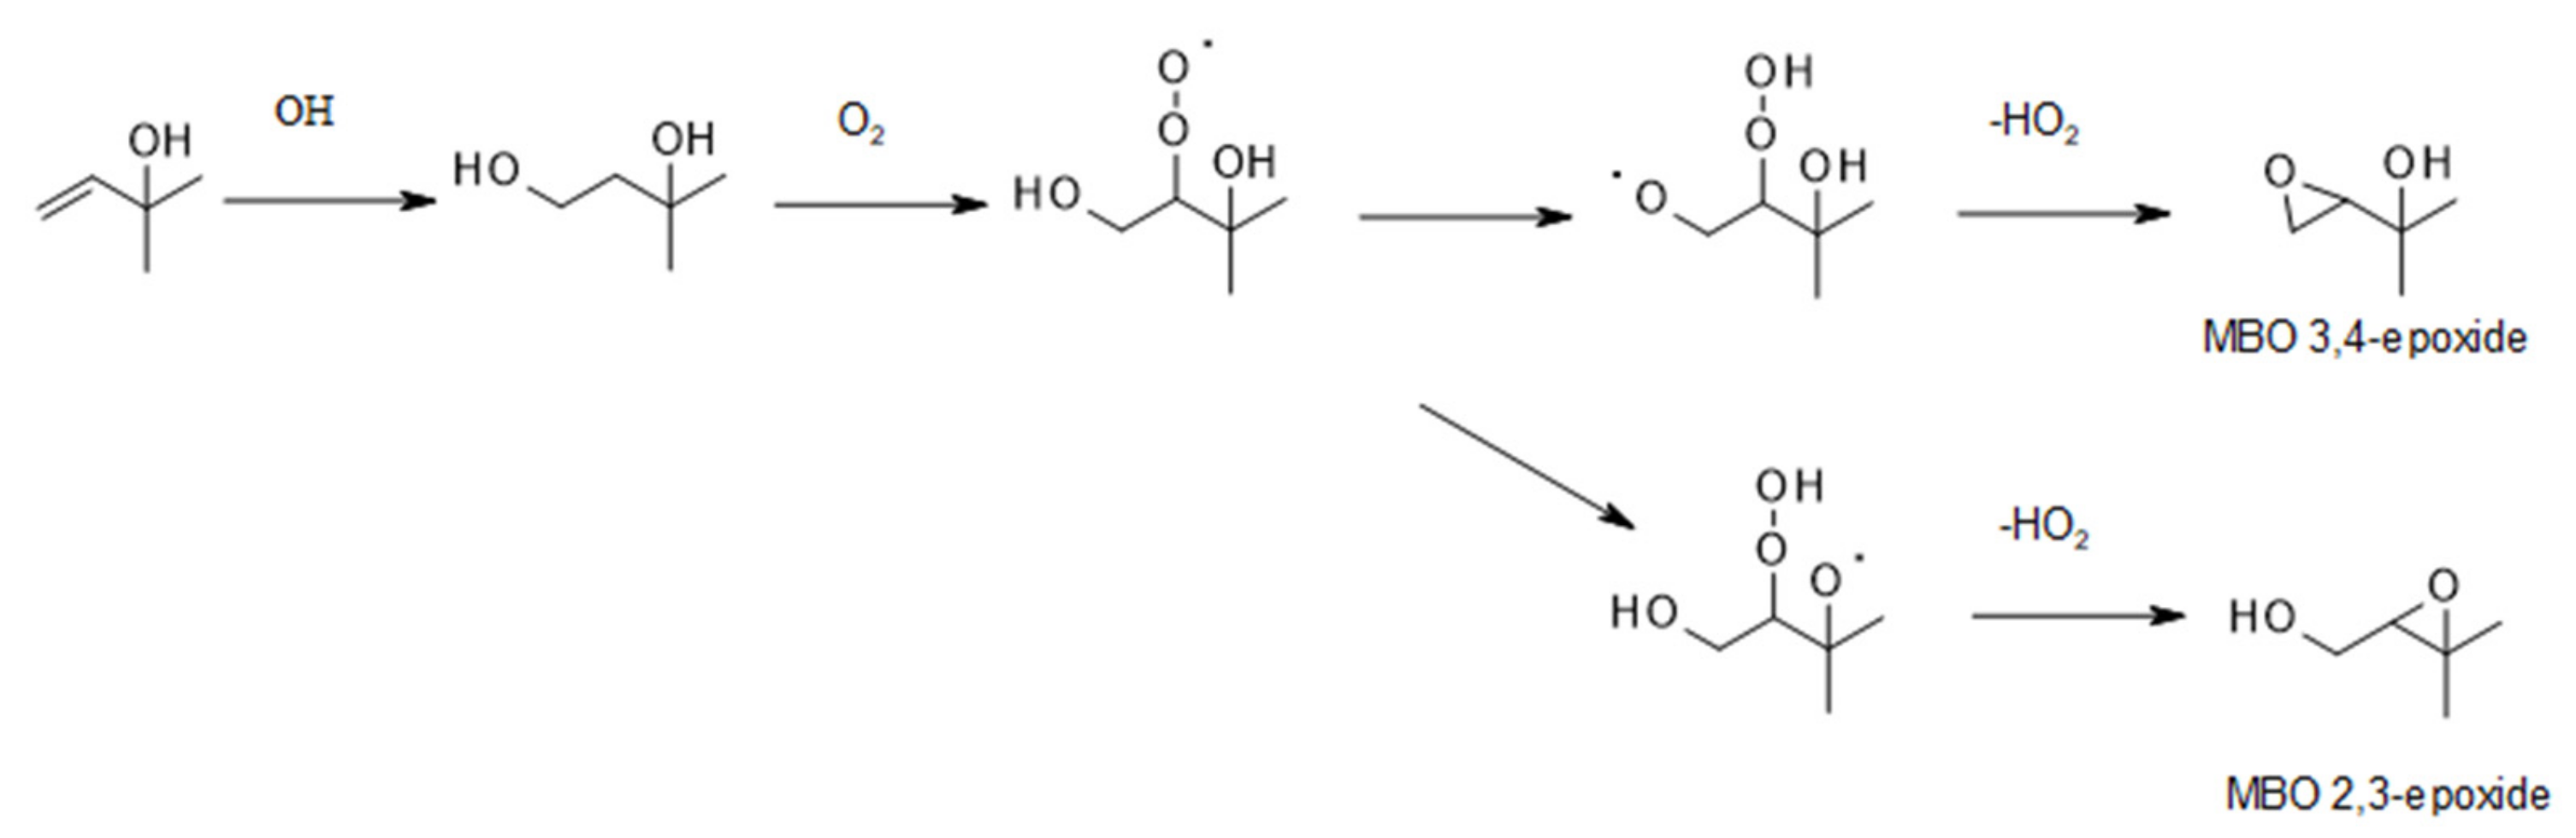
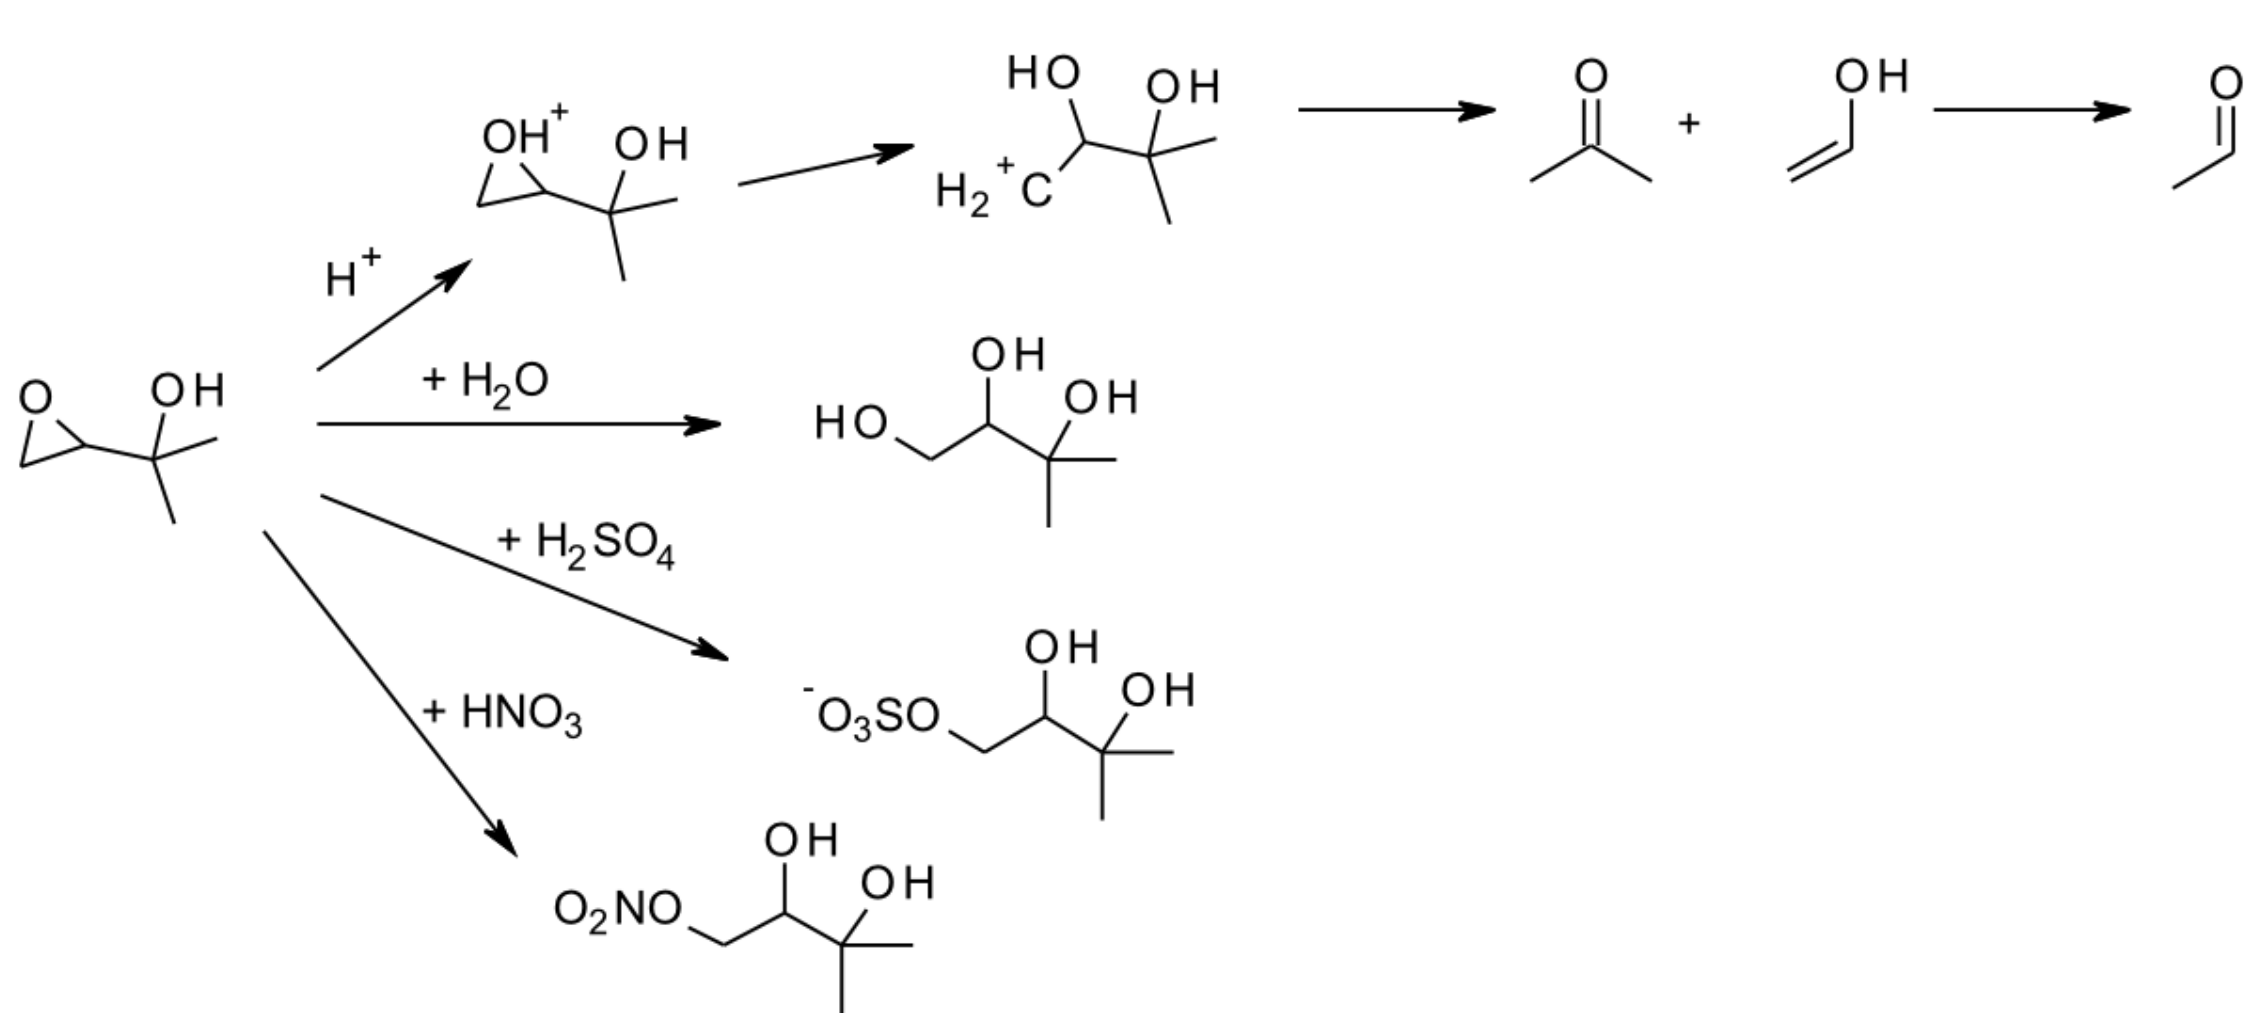
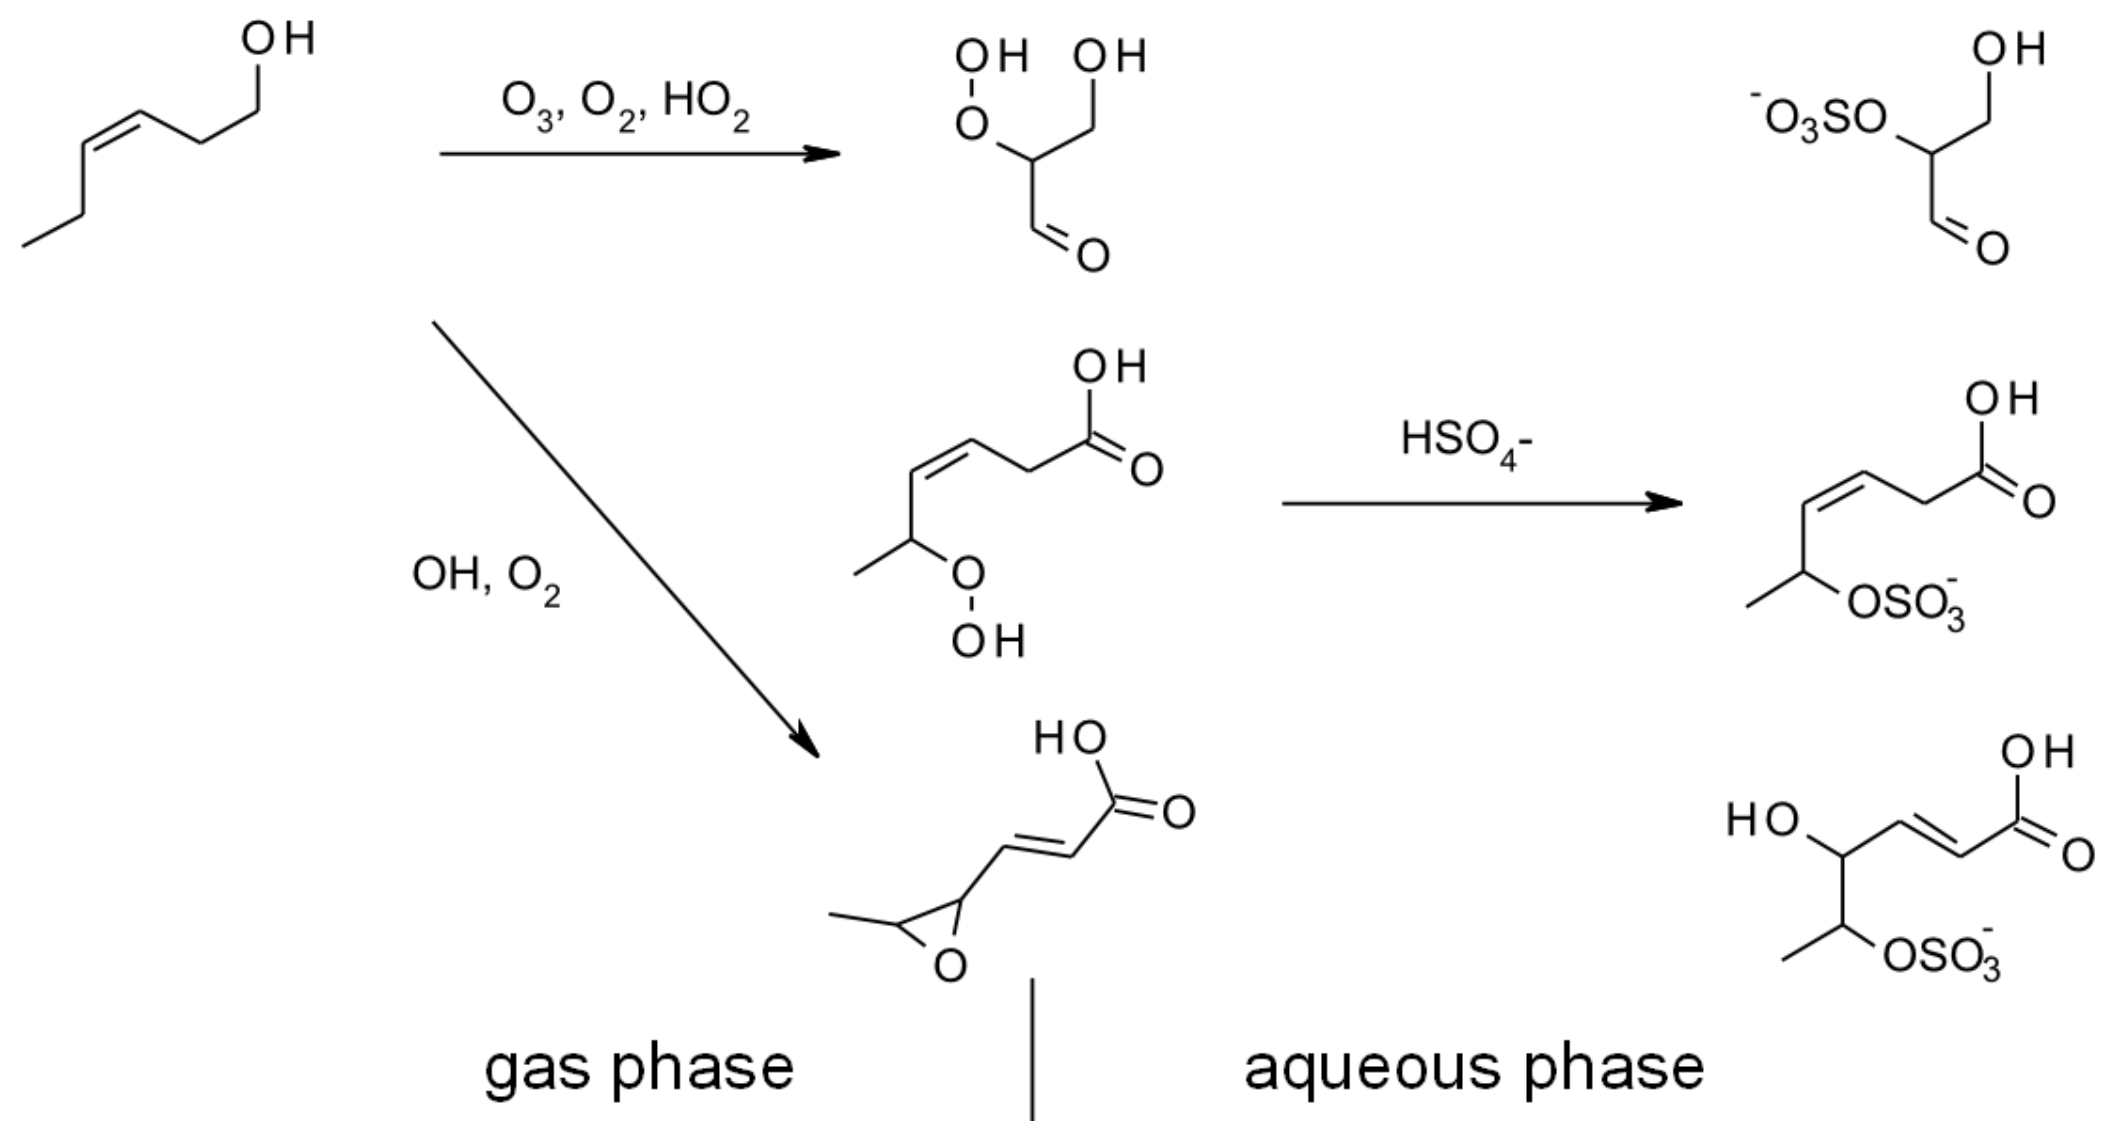
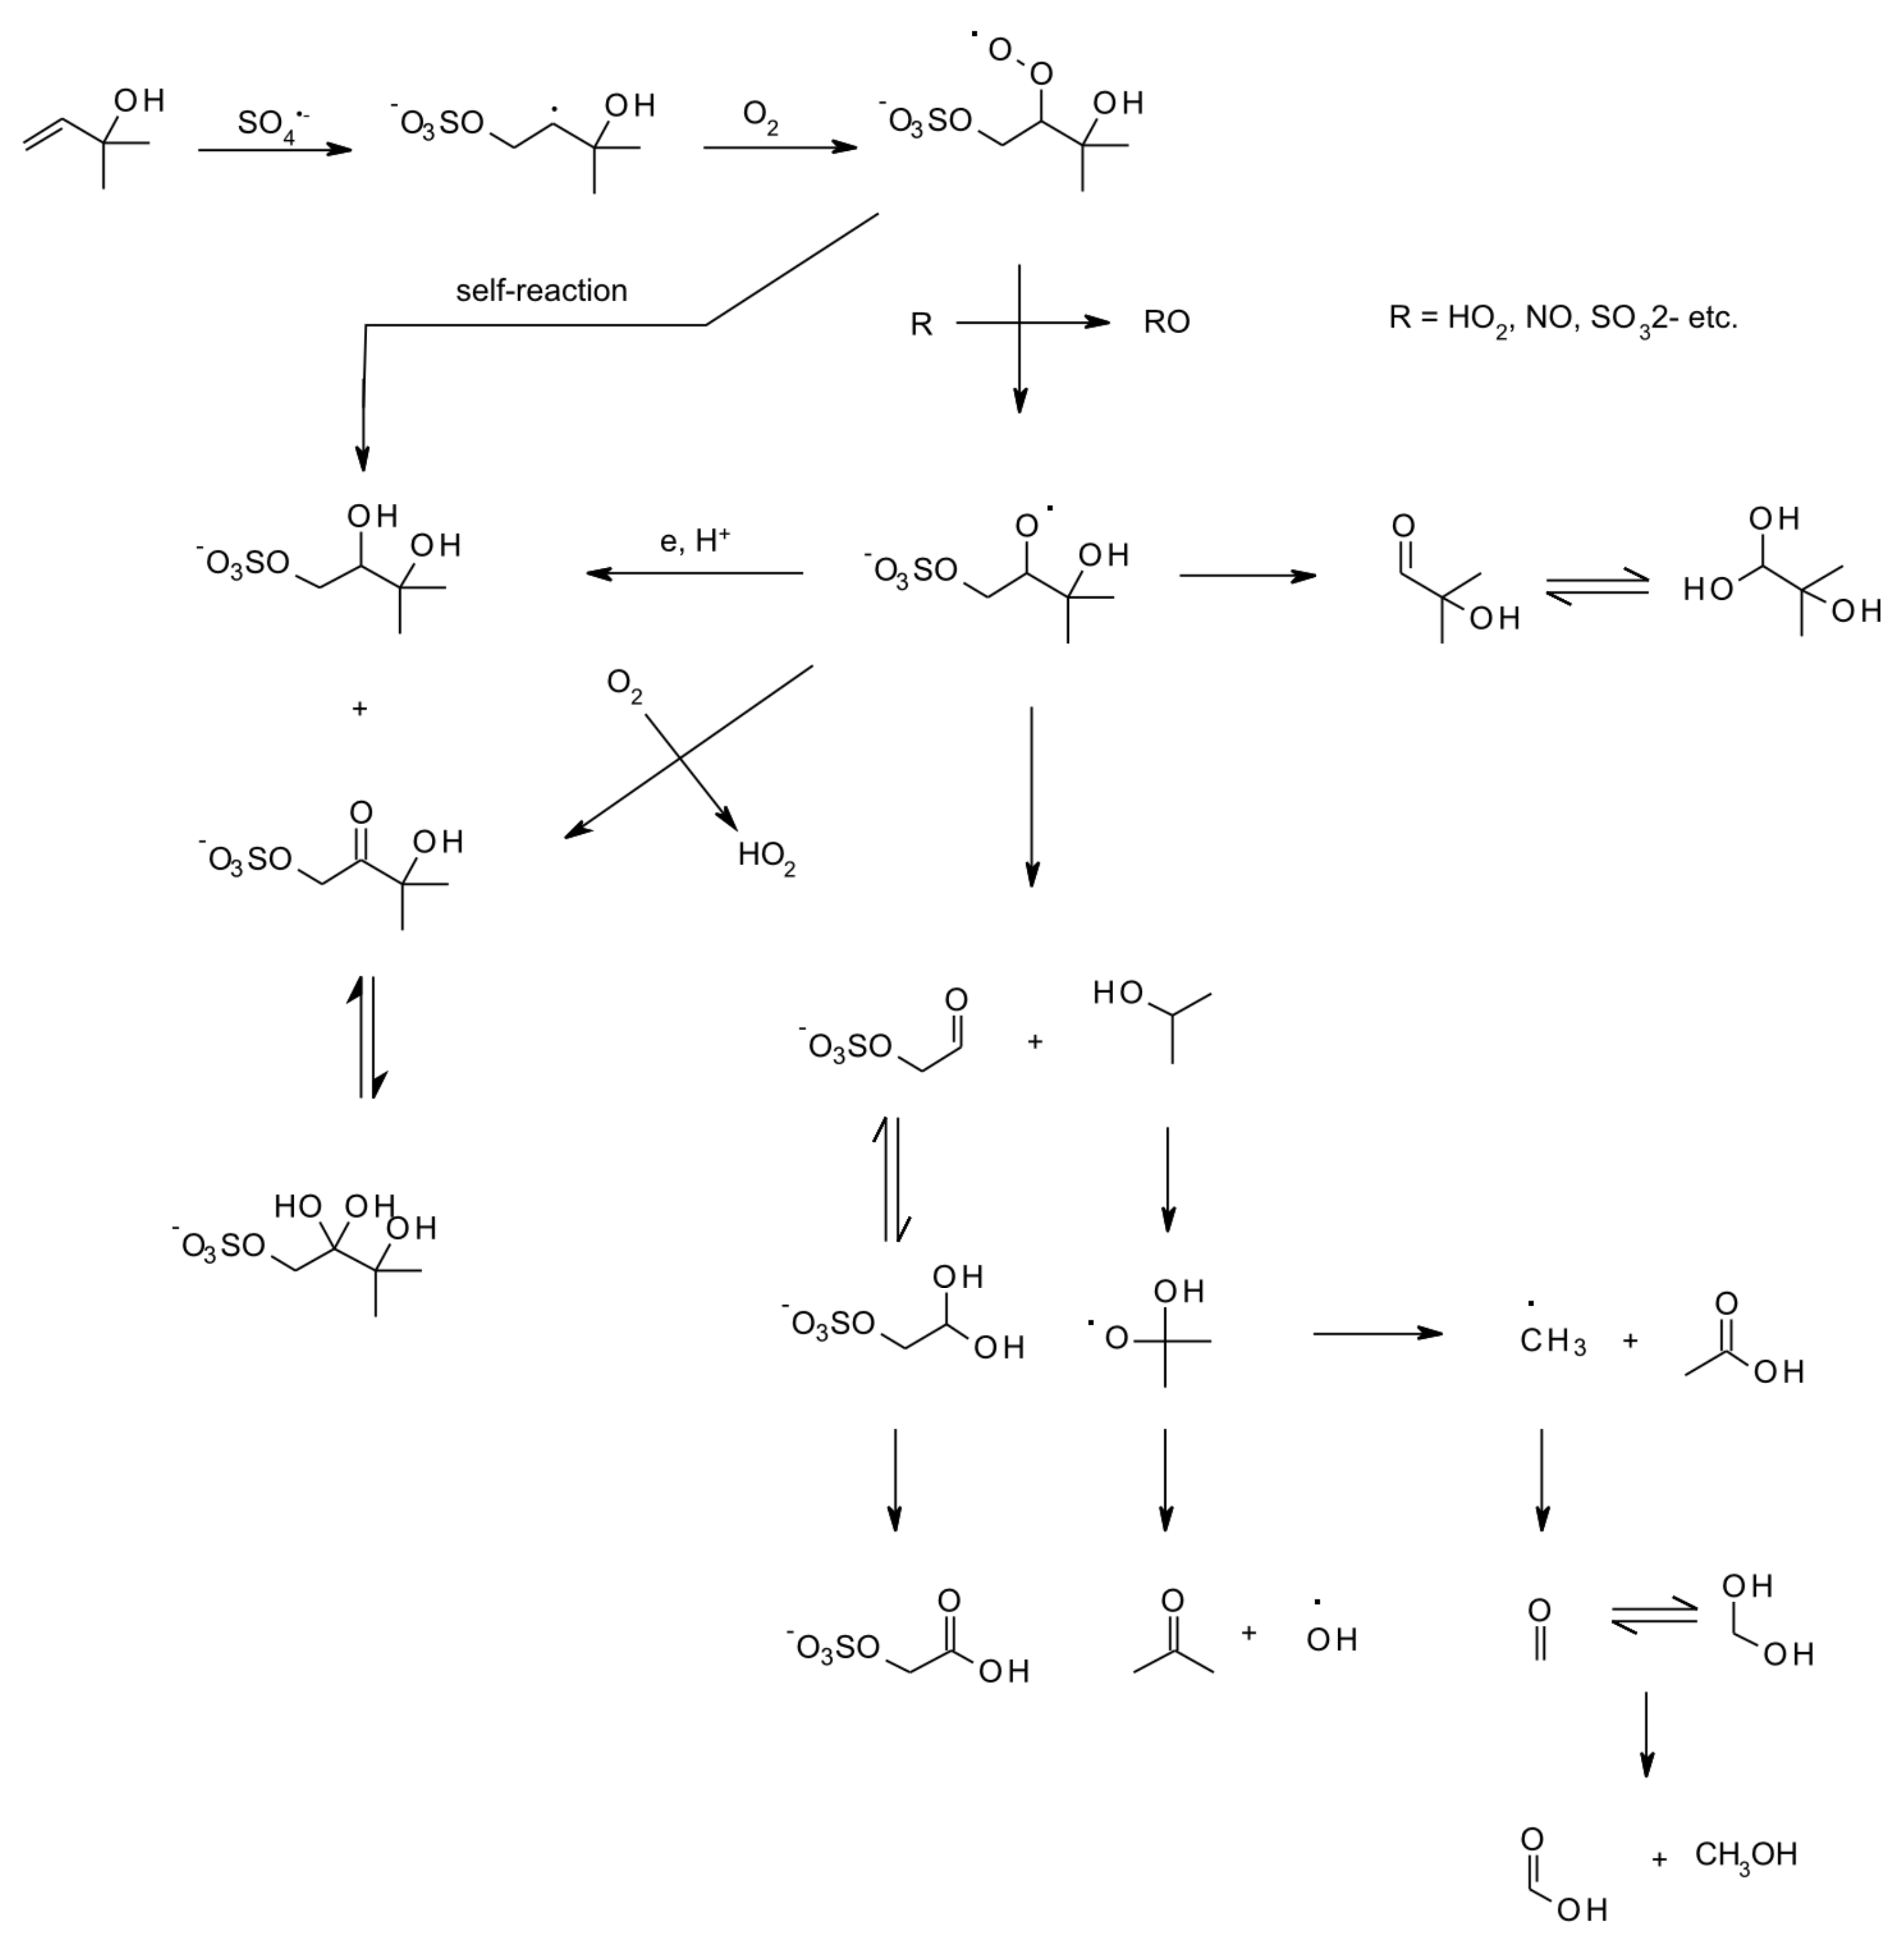
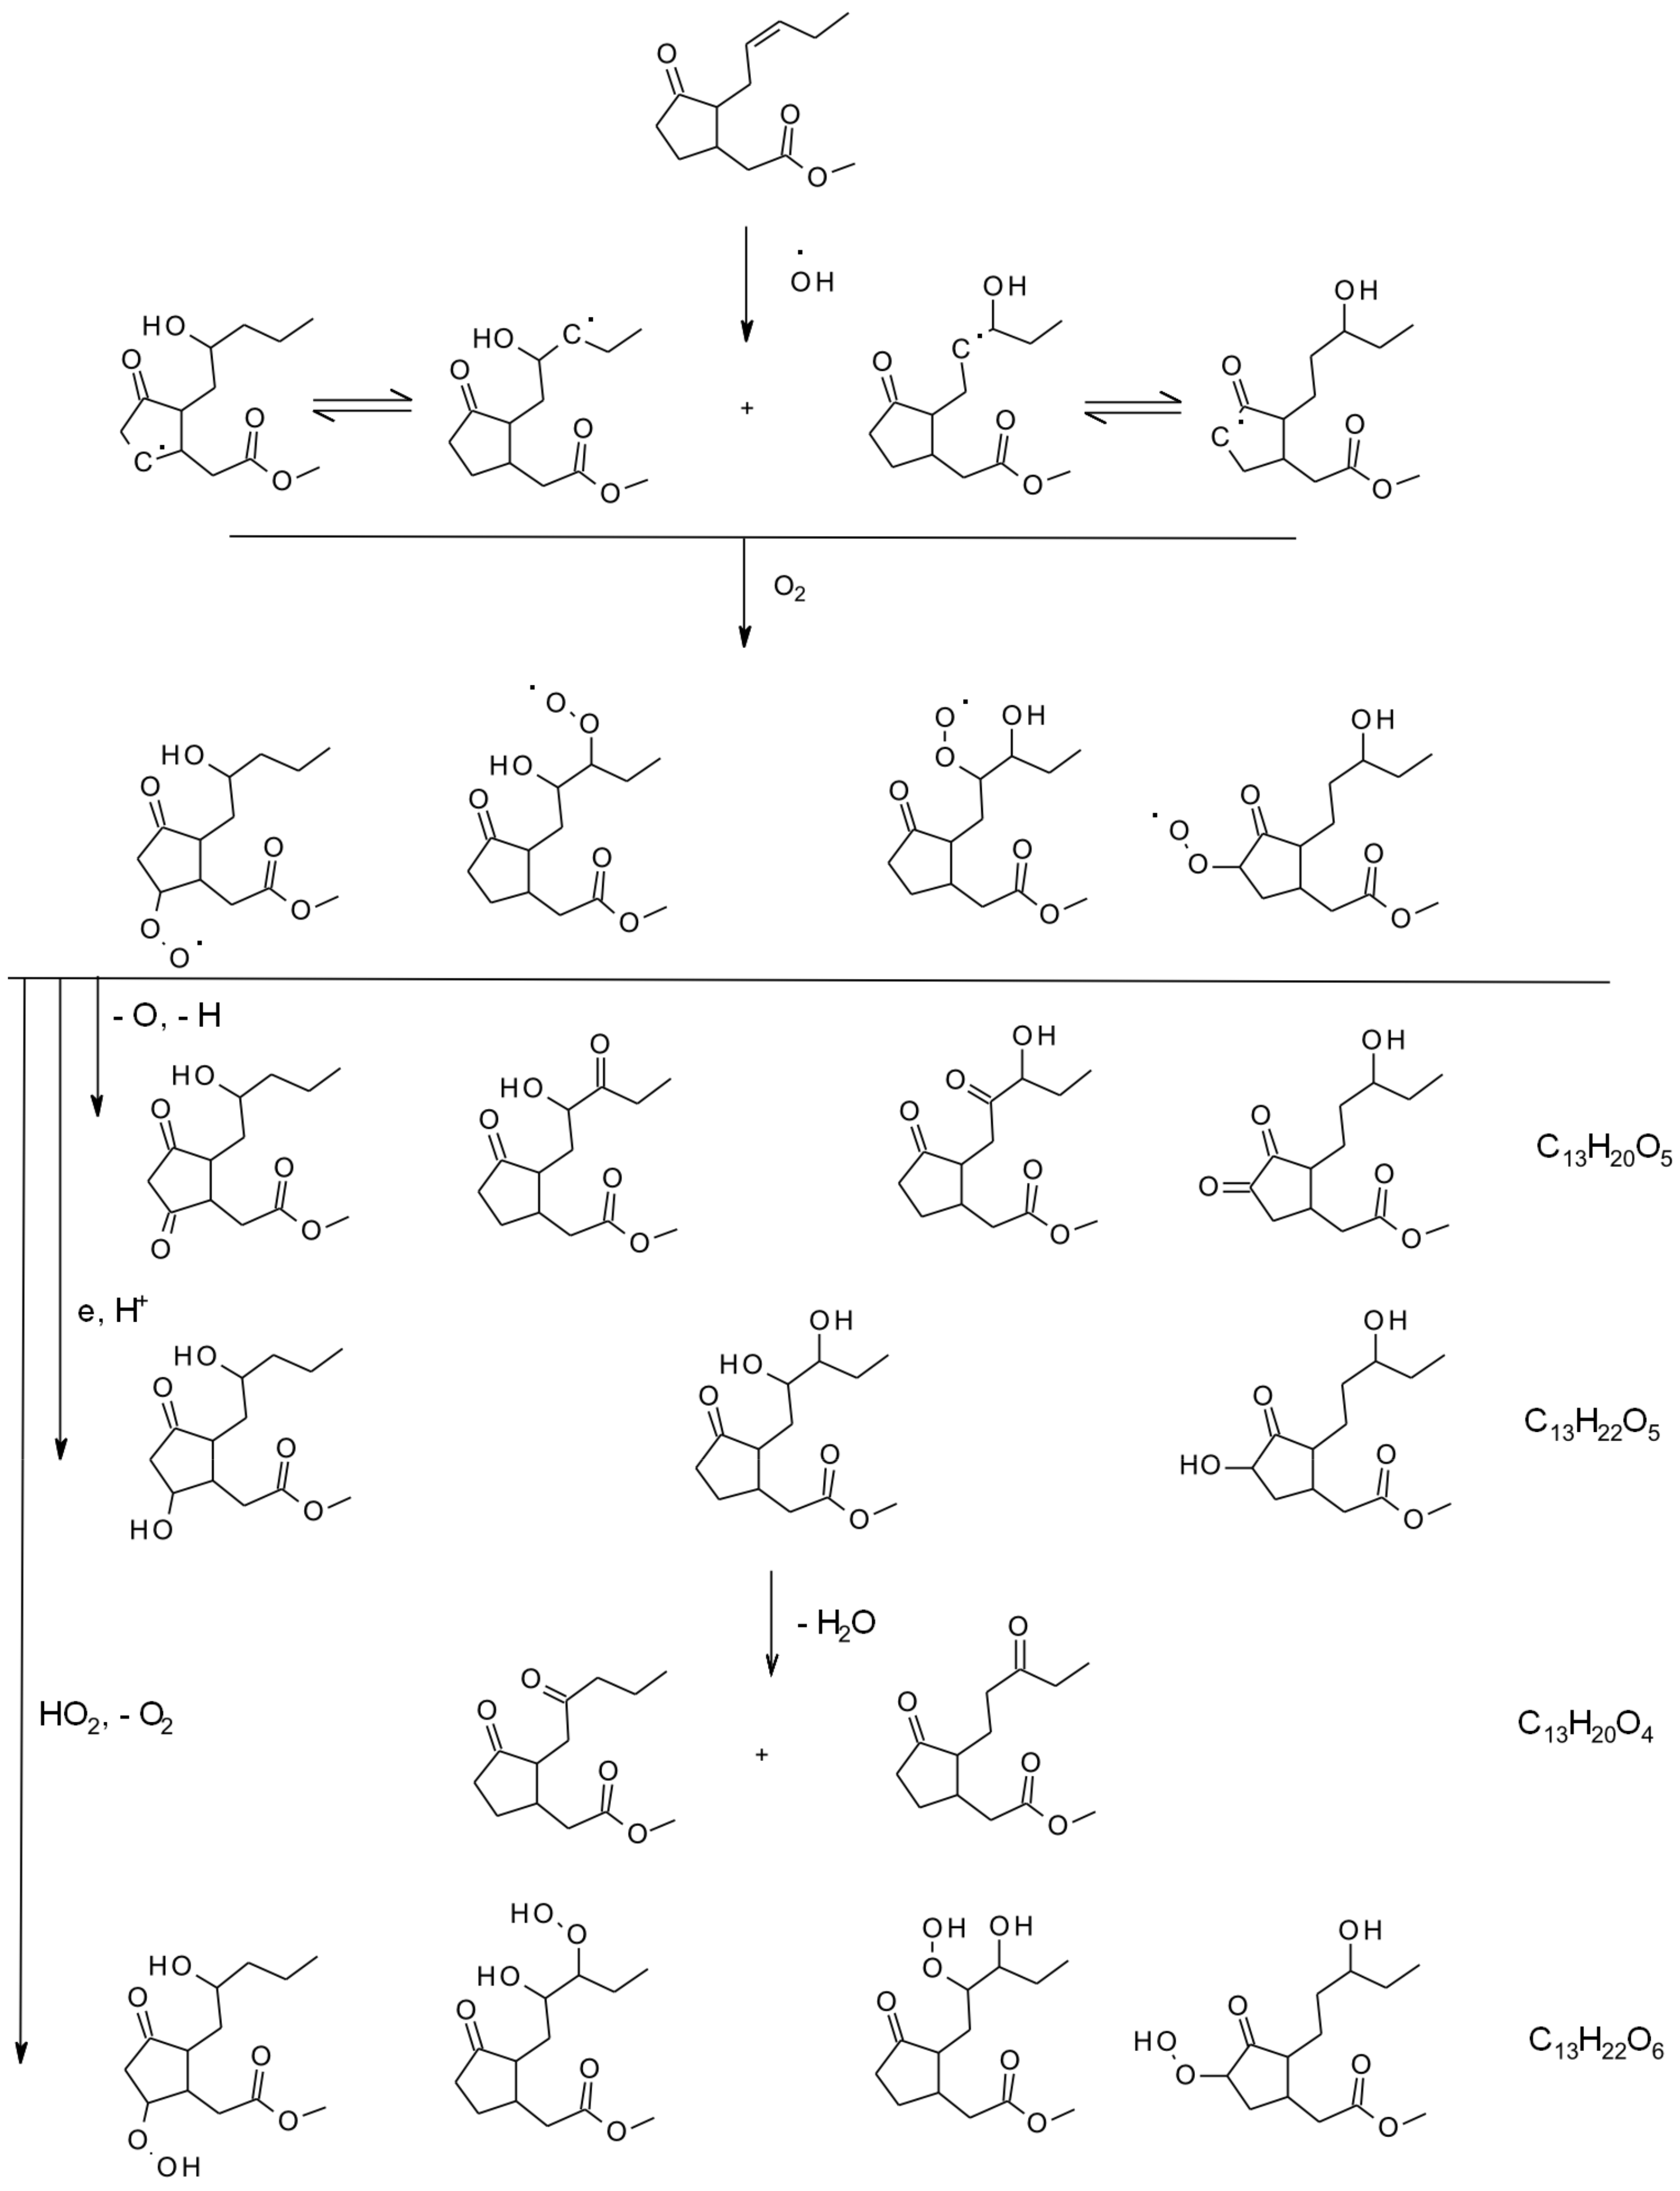
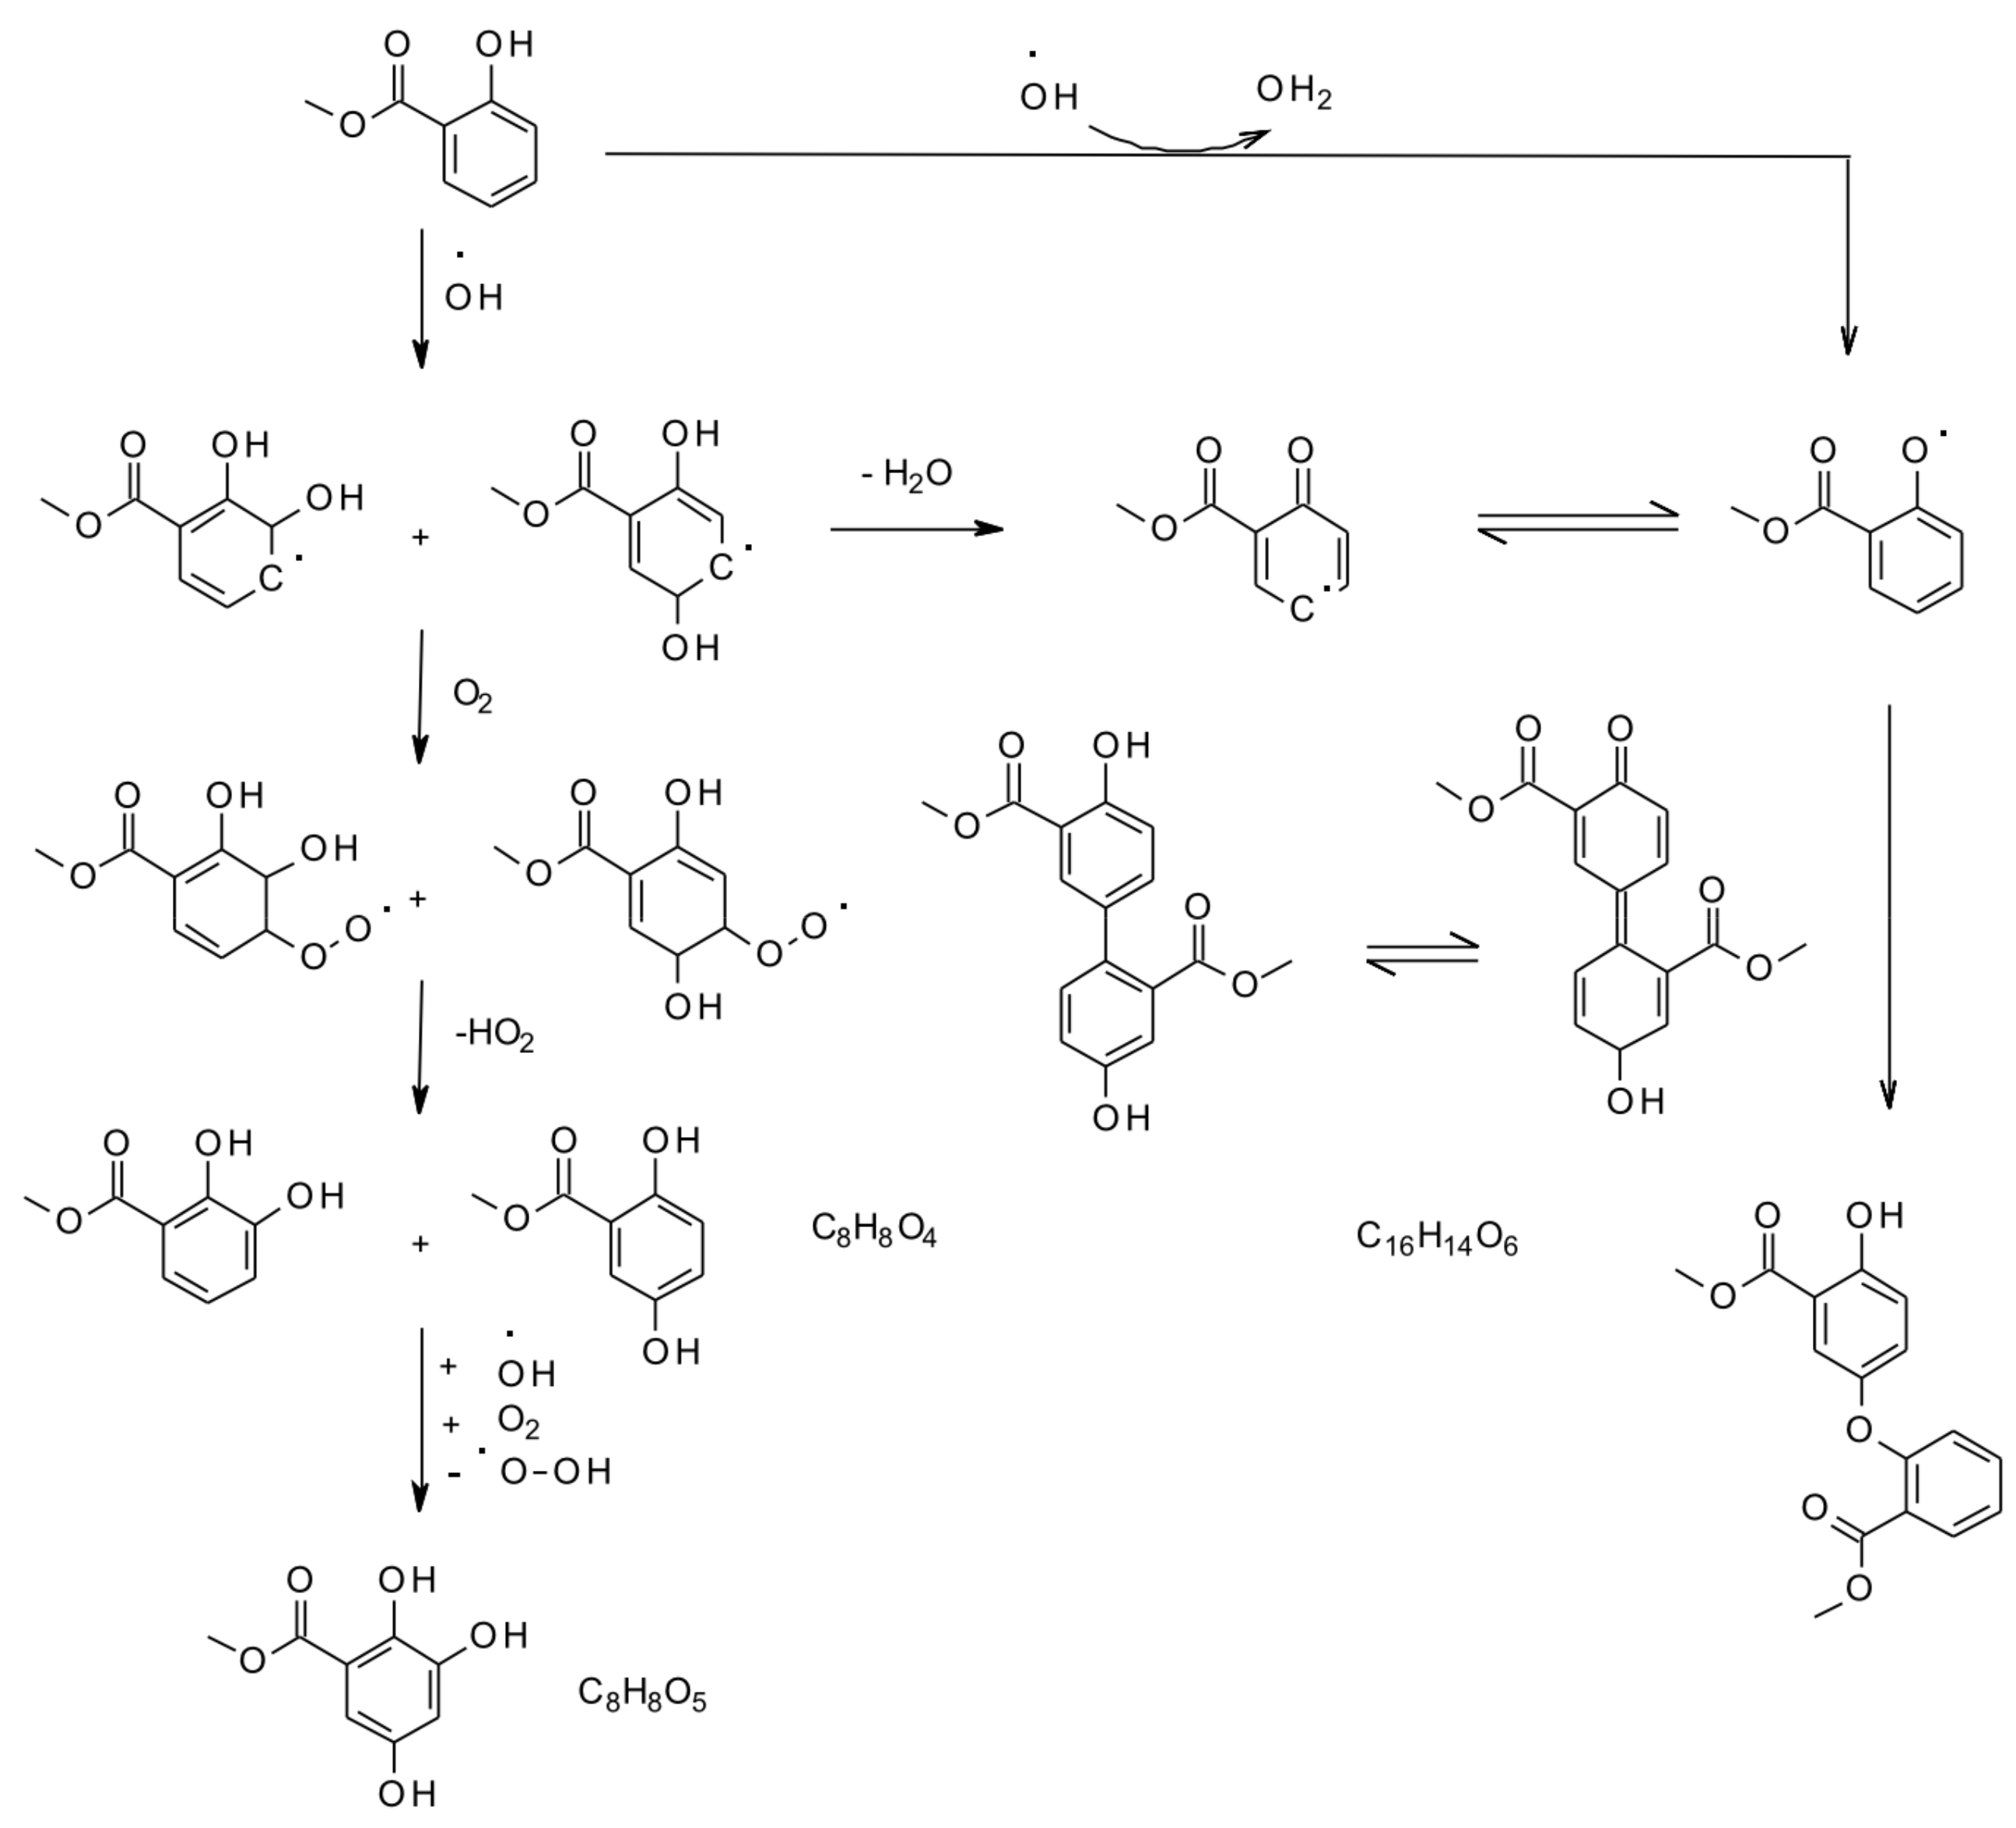
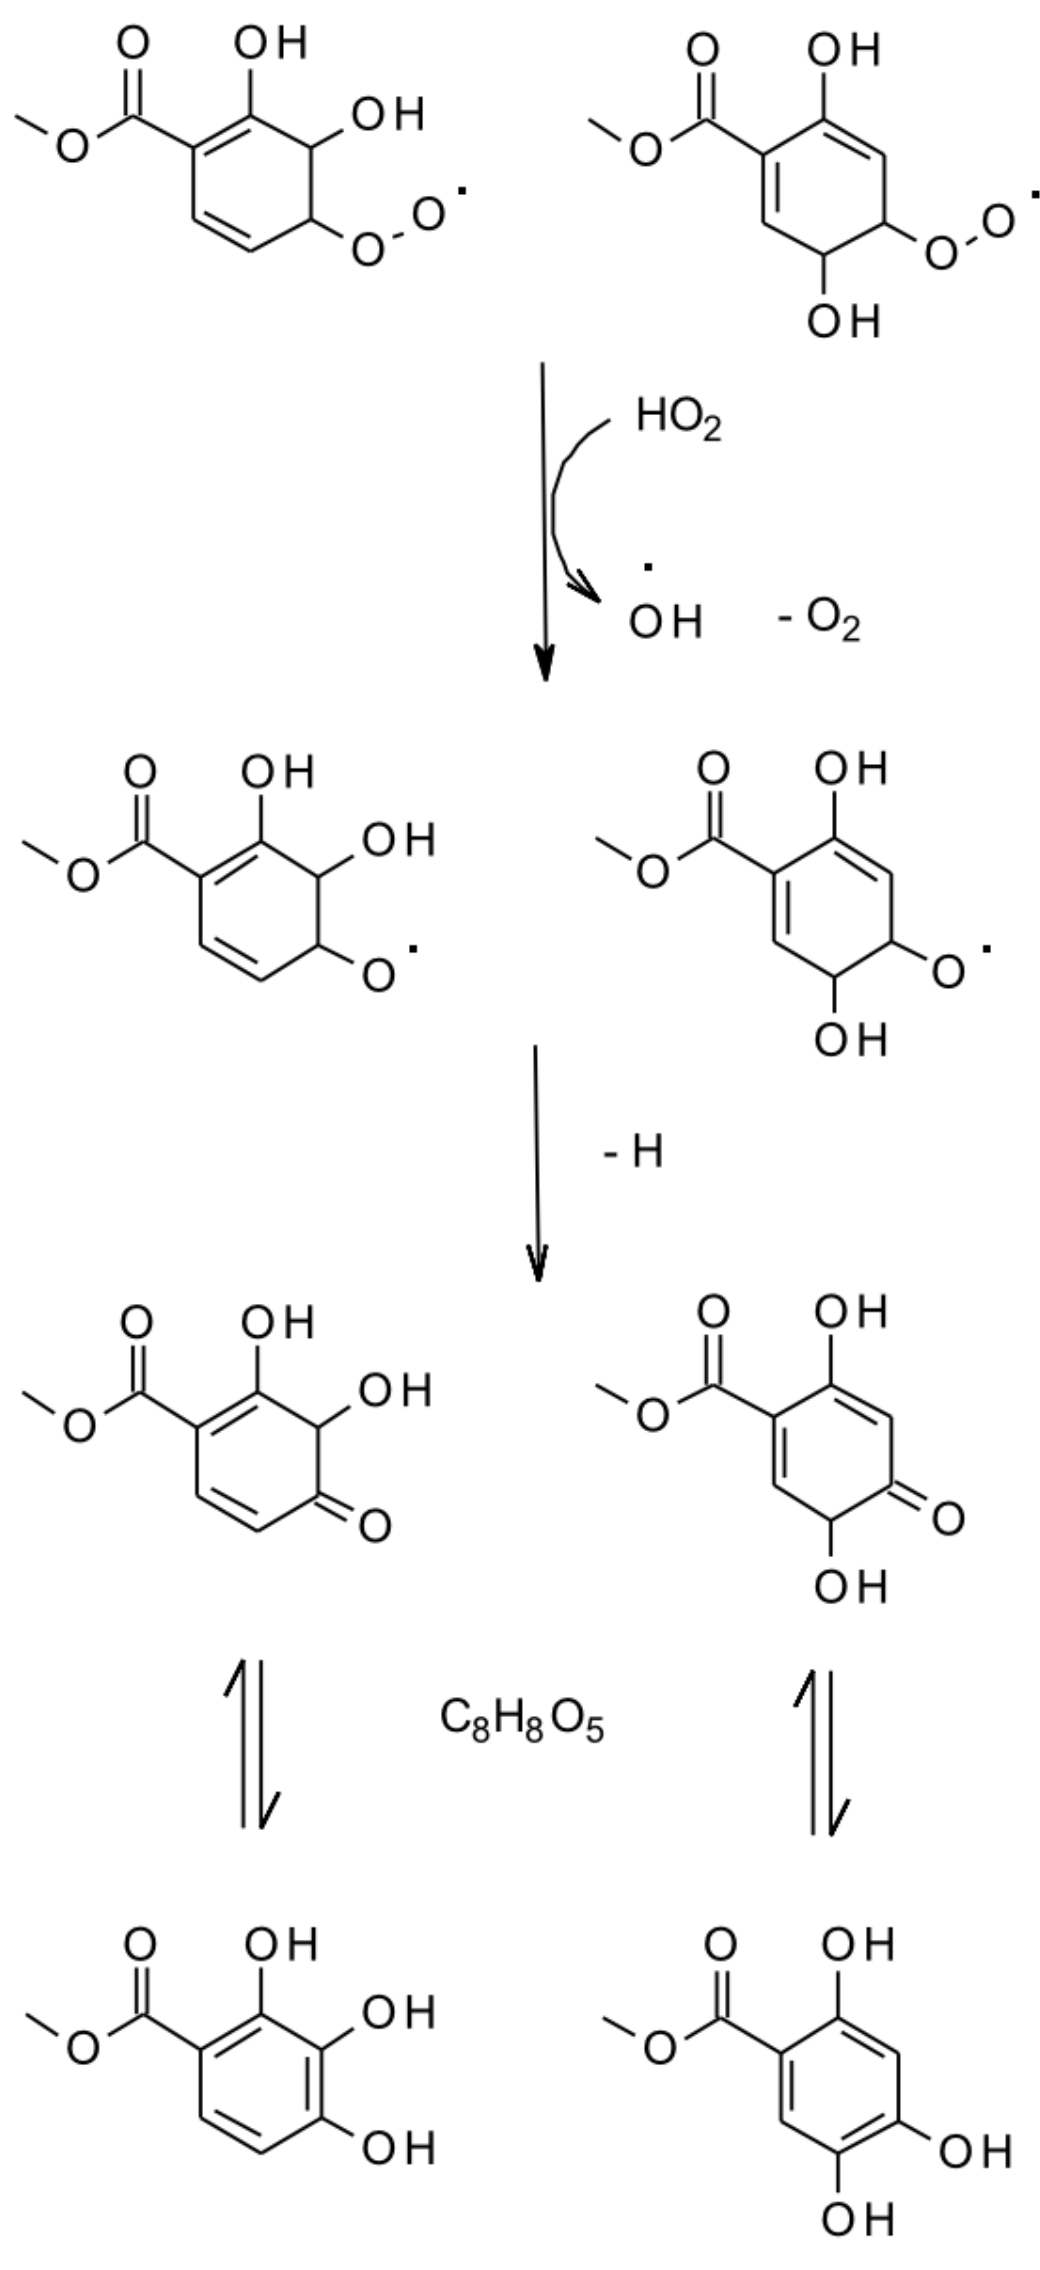
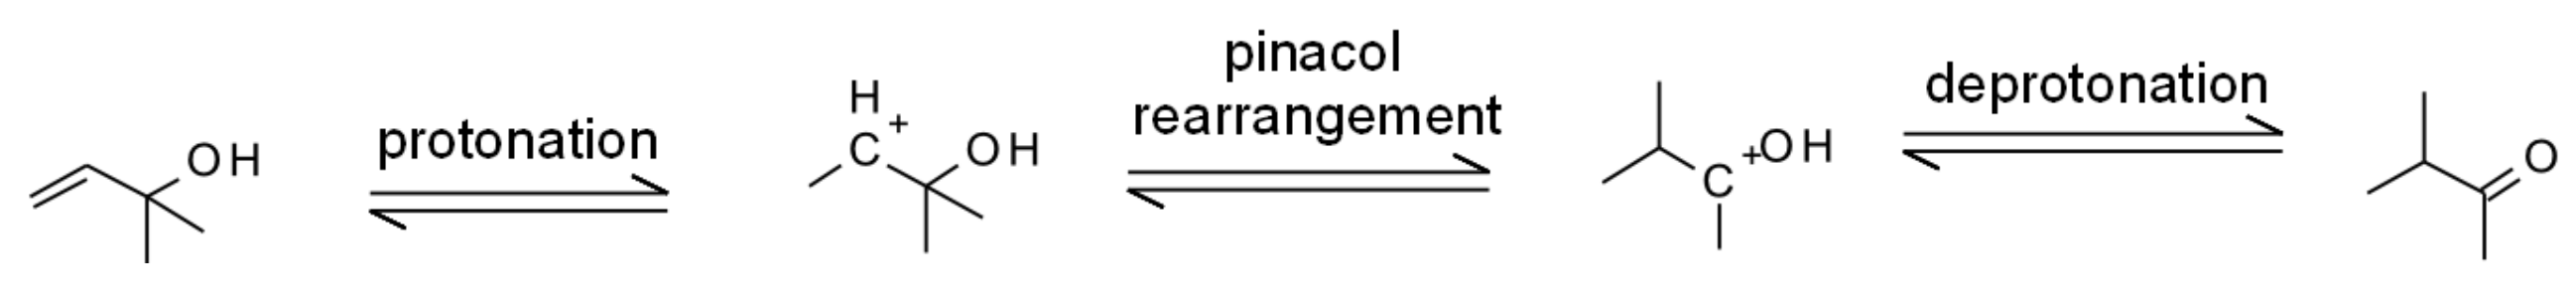
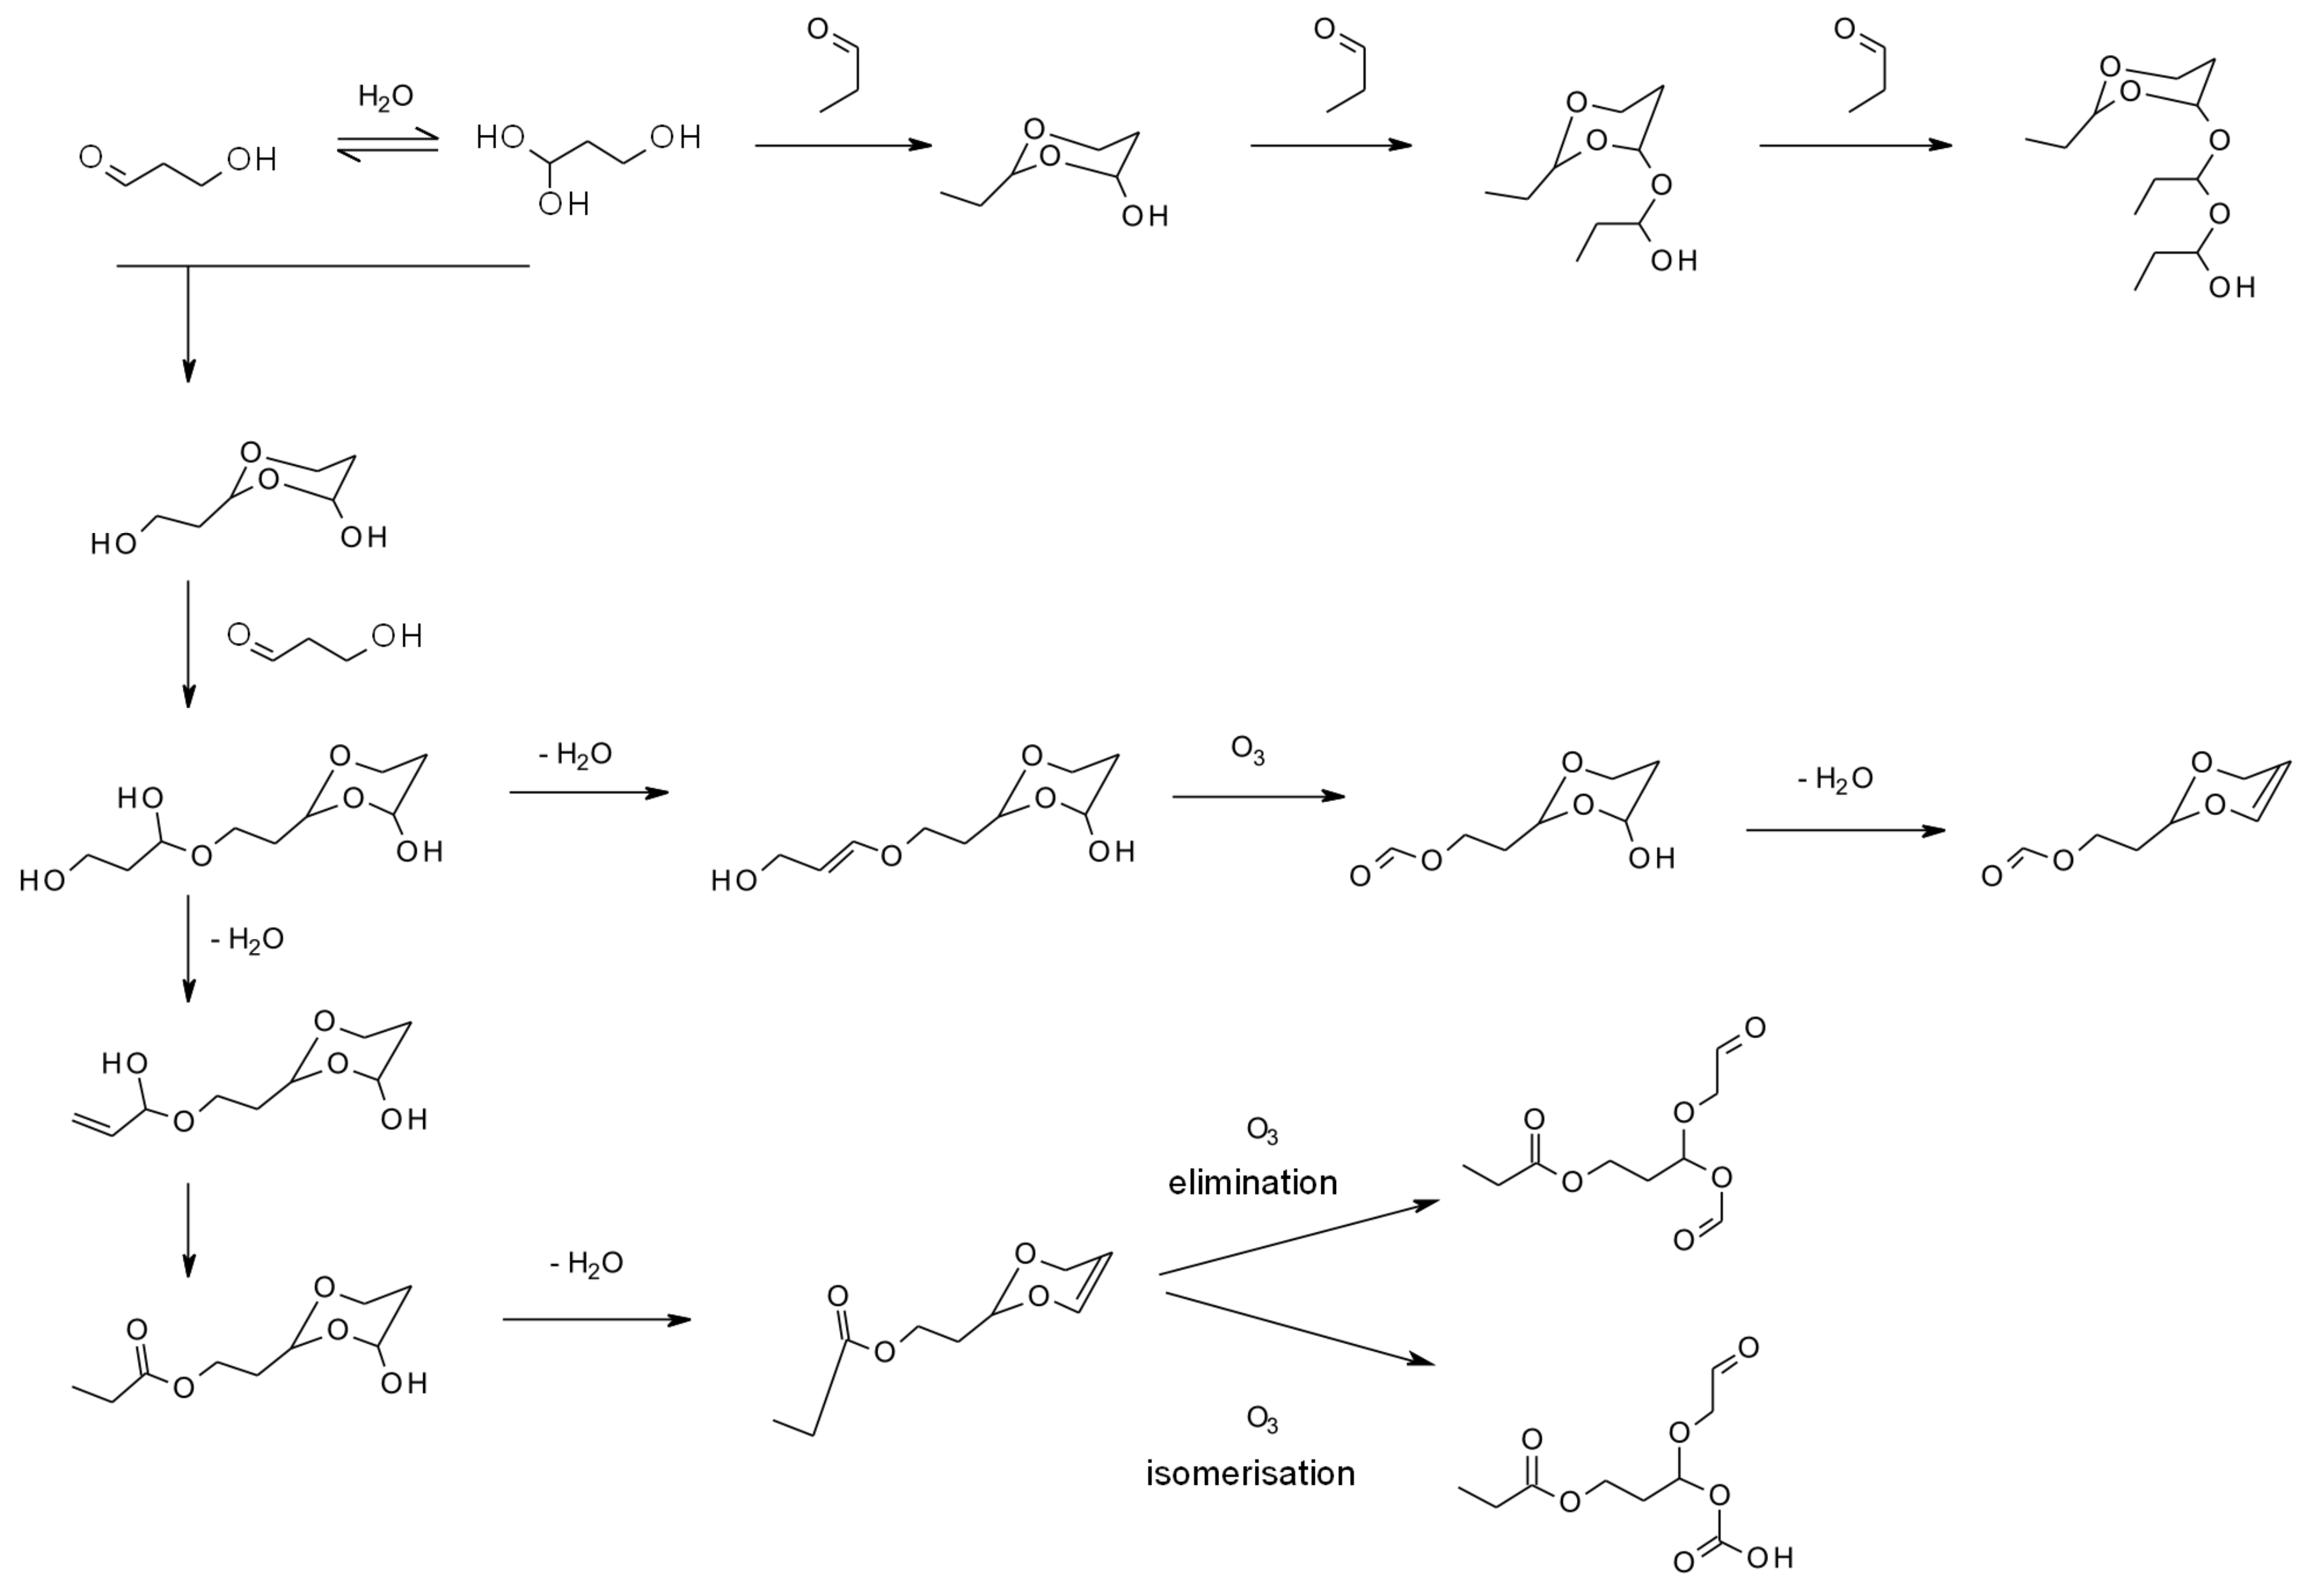
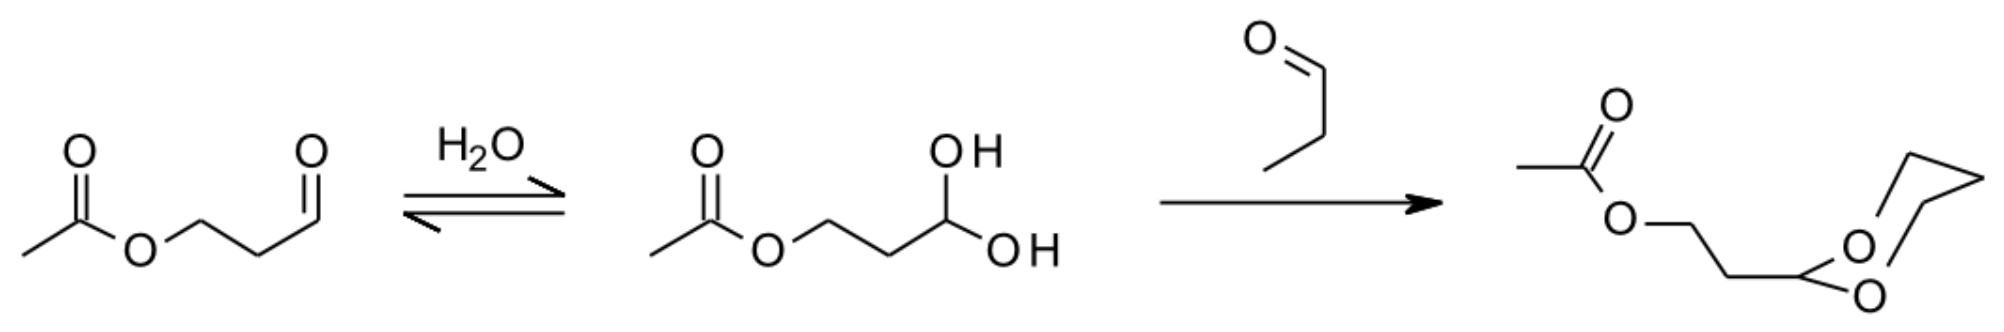
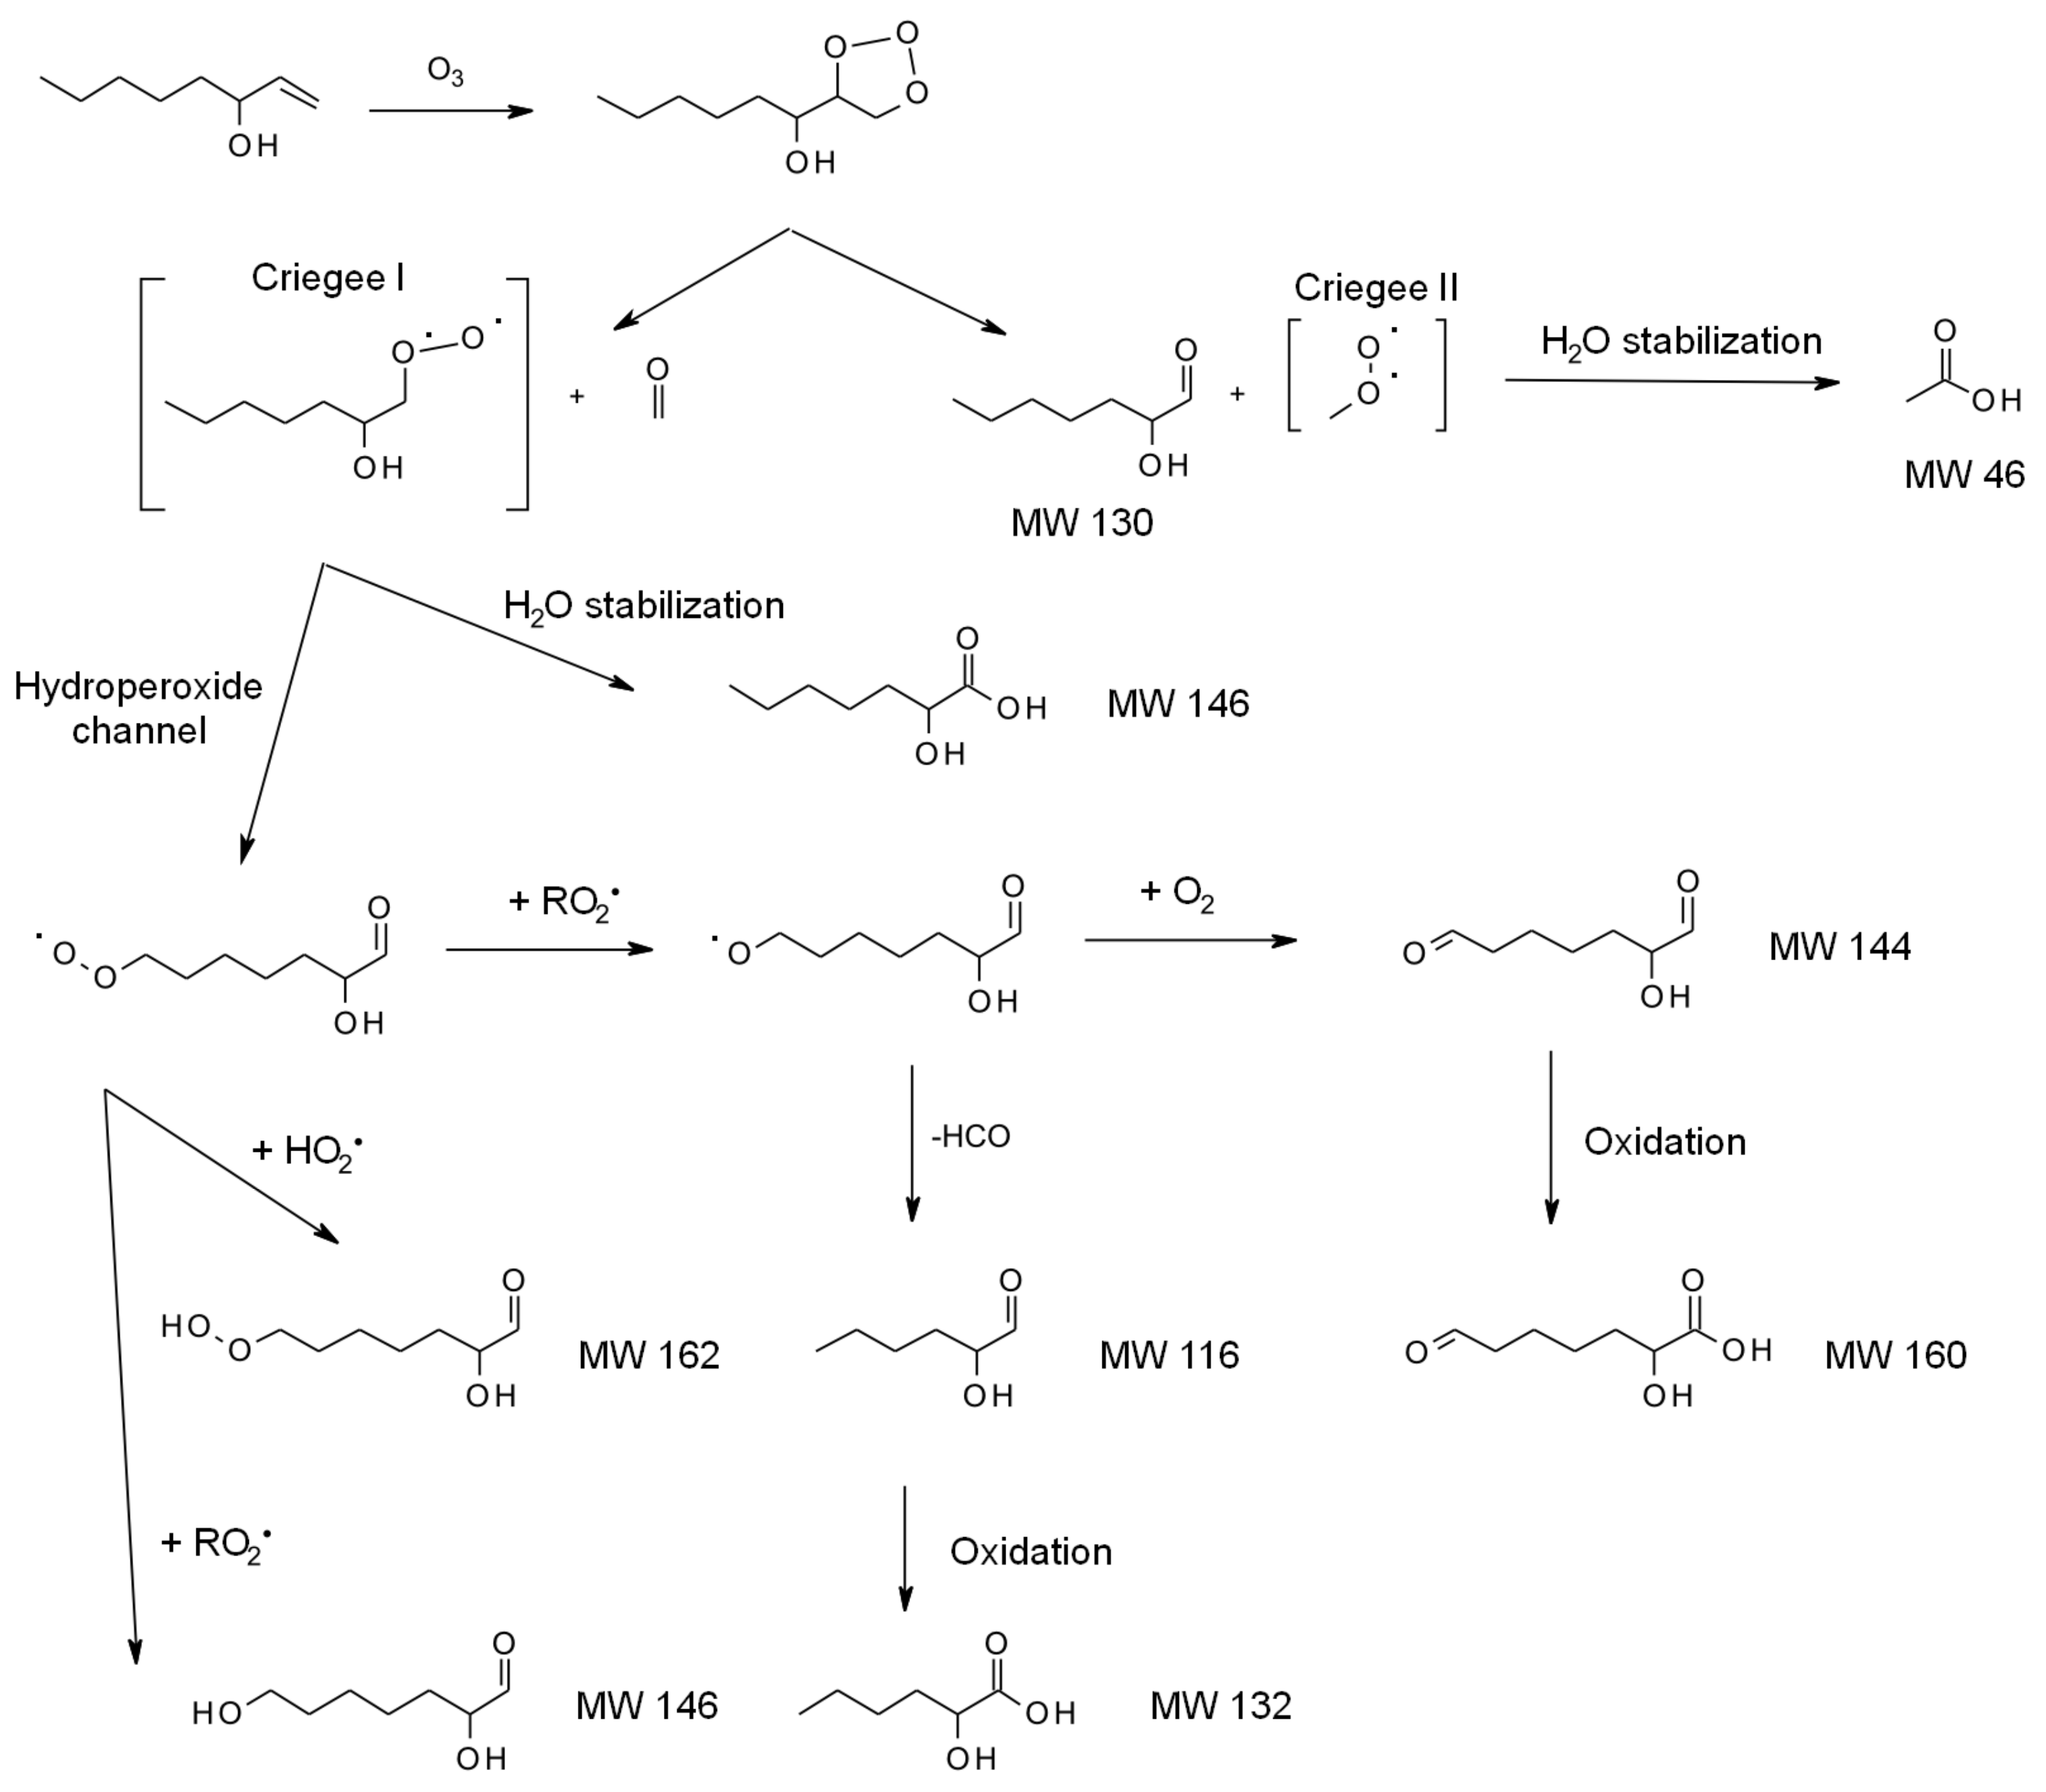


| Name | Chemical Formula | MW g mol−1 | Structure | References |
|---|---|---|---|---|
| pentan-1-ol | C5H12O | 88.15 |  | [9,26] |
| 1-penten-3-ol | C5H10O | 86.13 |  | [9,16,18,26,27,28,29,30] |
| (Z)-2-penten-1-ol | C5H10O | 86.13 |  | [26,29,30,31] |
| (E)-2-pentenol | C5H10O | 86.13 |  | [28] |
| (E)-2-pentenal | C5H8O | 84.12 |  | [28,30] |
| 1-penten-3-one | C5H8O | 84.12 |  | [9,16,27,28,29,30] |
| (Z)-2-pentenyl acetate | C7H12O2 | 128.17 |  | [31] |
| n-hexan-1-ol | C6H14O | 102.16 |  | [16,26,28,32,33] |
| (E)-2-hexen-1-ol | C6H12O | 100.16 |  | [26,28,32] |
| (Z)-2-hexen-1-ol | C6H12O | 100.16 |  | [18] |
| (E)-3-hexen-1-ol | C6H12O | 100.16 |  | [28,32] |
| (Z)-3-hexen-1-ol (leaf alcohol) | C6H12O | 100.16 |  | [9,10,12,13,16,18,26,28,31,32,34,35,36,37] |
| n-hexan-1-al | C6H12O | 100.16 |  | [3,18,26,28,30,32,33,34,36,38] |
| (Z)-3-hexen-1-al | C6H10O | 98.14 |  | [9,12,13,18,26,28,32,33,34,37,38,39] |
| (E)-2-hexen-1-al (leaf aldehyde) | C6H10O | 98.14 |  | [9,10,18,26,28,31,32,33,35,36,38] |
| (Z)-2-hexenal | C6H10O | 98.14 |  | [16,28] |
| (E)-3-hexenal | C6H10O | 98.14 |  | [28,32,37] |
| hexyl acetate | C8H16O2 | 144.21 |  | [33,37,40,41] |
| (Z)-2-hexenyl acetate | C8H14O2 | 142.20 |  | [18] |
| (E)-2-hexenyl acetate | C8H14O2 | 142.20 |  | [28,37] |
| (Z)-3-hexenyl acetate (leaf acetate) | C8H14O2 | 142.20 |  | [12,13,16,18,26,28,31,32,34,37] |
| (Z)-3-hexenyl-propionate | C9H16O2 | 156.22 |  | [28,30,42] |
| (Z)-3-hexenyl butanoate | C10H18O2 | 170.25 |  | [30,37,40,41,42,43] |
| (Z)-3-hexenyl isobutanoate (isobutyrate) | C10H18O2 | 170.25 |  | [30,40,42] |
| (E)-3-hexenyl butanoate | C10H18O2 | 170.25 |  | [41] |
| (E)-2-hexenyl butanoate | C10H18O2 | 170.25 |  | [37,42] |
| (Z)-3-hexenyl isopentanate | C11H20O2 | 184.27 |  | [40,42,44] |
| (Z)-3-hexenyl 2-methyl-2-butenoate | C11H18O2 | 182.26 |  | [40,42,44] |
| 3-hexenyl hexanoate b | C12H22O2 | 198.3 |  | [41] |
| 2-methy-3-buten-2-ol | C5H10O | 86.13 |  | [45,46,47] |
| 1-octen-3-ol | C8H16O | 128.21 |  | [18,28,48] |
| nonanal | C9H18O | 142.24 |  | [44] |
| jasmonic acid | C12H18O3 | 210.27 |  | [26,39,49] |
| methyl jasmonate | C13H20O3 | 224.30 |  | [26,49] |
| methyl salicylate | C8H8O3 | 152.15 |  | [7,30,40] |
| GLV | Emission or Emission Rate |
|---|---|
| pentan-1-ol | |
| 1-penten-3-ol |
|
| (E)-2-penten-1-ol |
|
| 3-pentanone |
|
| 1-hexanol |
|
| (E)-2-hexen-1-ol | |
| (Z)-3-hexen-1-ol |
|
| (Z)-3-hexenol + (E)-3-hexenol + (E)-2-hexenol |
|
| Hexanal |
|
| (Z)-2-hexenal |
|
| (E)-2-hexen-1-al |
|
| (Z)-3-hexen-1-al |
|
| (Z)-3-hexenal + (E)-2-hexenal |
|
| Hexyl acetate | |
| (Z)-3-hexenyl acetate |
|
| (E)-2-hexenyl acetate | |
| (Z)-3-Hexenyl acetate + (E)-2-hexenyl acetate |
|
| (Z)-3-hexenyl butanoate (butyrate) |
|
| (E)-3-hexenyl butanoate |
|
| (Z)-3-hexenyl 3-methylbutanoate (isovalerate) | |
| (Z)-3-hexenyl 2- methyl-2-butenoate (tiglate) |
|
| 3-hexenyl hexanoate c |
|
| (Z)-3-hexenyl isobutyrate |
|
| (Z)-3-hexenyl butyrate |
|
| (Z)-3-hexenyl isovalerate |
|
| (Z)-3-hexenyl isotiglate |
|
| hexenyl type |
|
| 1-octen-3-ol | |
| 2-methyl-3-buten-2-ol |
|
| Nonanal |
|
| Methyl salicylate |
|
| Hexenals |
|
| Pentenols and 2- methyl butanal |
|
| Pentenols and 3- methyl butanal |
|
| Hexanal and (E)-2-hexenol |
|
| Hexenols and hexanal | |
| Hexenyl acetates |
|
| Hexyl acetates |
| GLV | Concentrations and References |
|---|---|
| 1-penten-3-ol |
|
| (E)-2-penten-1-ol |
|
| (E)-2-pentenal |
|
| 1-penten-3-one |
|
| 1-hexanol | |
| (E)-2-hexen-1-ol |
|
| (Z)-3-hexen-1-ol |
|
| (E)-3-hexenol |
|
| Hexanal |
|
| (E)-2-hexenal | |
| (Z)-2-hexenal |
|
| (E)-3-hexenal |
|
| (Z)-3-hexenal |
|
| (E)-2-hexenyl acetate |
|
| (Z)-3-hexenyl acetate |
|
| (Z)-3-hexenyl propionate |
|
| 1-octen-3-ol |
|
| 2-methyl-3-buten-2-ol | |
| Methyl salicylate |
|
| GLV | Henry’s Constant | Octanol/Water Partition Coefficient | Octanol/Air Partition Coefficient | |||||
|---|---|---|---|---|---|---|---|---|
| H | T | I | Ref. | Log (KOW) | Ref. | Log (KOA) | Ref. | |
| M atm−1 | K | M | ||||||
| pentan-1-ol | 87.7 ± 8.9 | 298 | 0 | [120] c | 1.5 | [122] | 4.7 | [123] |
| 84.4 ± 7.0 46.1 ± 2.1 11.9 ± 0.3 3.8 ± 0.1 | 298 306 323 343 | [124] a | 1.34 | [125] | f 4.8 | [117] i | ||
| 71.9 ± 3.6 | 298 | [117] g | 1.3 | [117] h | 4.6 | [117] i | ||
| 1-penten-3-ol | 72.5 ± 40.6 | 298 | [117] g | 0.84 | [126] | 4.5 | [117] i | |
| 0.81 | [125] | |||||||
| 1.1 | [117] h | |||||||
| (Z/E)-2-penten-1-ol | 119.8 ± 34 | 298 | 0 | [117] g | 1.1 | [117] h | 4.4 | [117] i |
| (E)-2-pentenal | 17.3 ± 12.3 | 298 | [117] g | 1.1 | [117] h | 3.6 | [117] i | |
| 1-penten-3-one | 28.5 ± 23.2 | 298 | [117] g | 0.9 | [117] h | 3.8 | [117] i | |
| (Z)-2-pentenyl acetate | 2.8 ± 0.8 | 298 | [117] g | 2.1 | [117] h | 3.8 | [117] i | |
| n-hexan-1-ol | 61.8 ± 16.3 | 298 | 0 | [120] c | 1.84 | [125] | 5.2 | [123] |
| 59.6 ± 2.8 32.7 ± 1.1 8.0 ± 0.3 2.53 ± 0.01 | 298 306 323 343 | [124] a | 2.03 | [122] | 5.0 | [117] i | ||
| 55.5 ± 3.5 | 298 | [117] g | 1.8 | [117] h | ||||
| n-hexan-1-al | 3.2 ± 0.4 | 295 | 0 | [127] | 1.78 | [122] | 4.4 | [123] |
| 5 ± 1 | 298 | [128] | 1.8 | [117] h | f 3.8, 3.9 | [117] i | ||
| 5.2 ± 0.5 4.4 ± 0.4 3.4 ± 0.3 3.6 ± 0.2 3.2 ± 0.1 | freshwater 25% seawater 50% seawater 75% seawater 100% seawater | [129] | ||||||
| 4.5 ± 1.0 | 0 | [120] c | ||||||
| 3.9 ± 1.0 | [117] g | |||||||
| hexyl acetate | 1.5 ± 0.2 | 298 | 0 | [127] | 2.59 | [126] | 4.6 | [123] |
| 1.4 ± 0.2 | [117] g | 2.8 | [117] h | 4.5 f, 4.4 | [117] i | |||
| hexenol b | 25 | 298 | 0 | [33] | ||||
| (E/Z)-2-hexen-1-ol | 94.4 ± 35.2 | [117] g | 1.6 | [117] h | 4.8 | [117] i | ||
| (Z)-3-hexen-1-ol | 113 ± 7.1 140 ± 18 132 ± 11 83.4 ± 8.3 62.7 ± 3.0 | 298 303 308 | 0 0.01 1 0 0 | [130] | 1.6 | [117] h | 4.8 | [117] i |
| 129.9 ± 65.6 | 298 | [117] g | ||||||
| (E)-2-hexenal | 14.5 ± 1.7 | 298 | 0 | [127] | 1.6 | [117] h | 4.3 f, 4.0 | [117] i |
| 20 | [128,131] | |||||||
| 13.6 ± 7.3 | [117] g | |||||||
| (Z)-3-hexenal | 6 | [33] | 1.6 | [117] h | 3.7 | [117] i | ||
| 4.1 ± 1.9 | [117] g | |||||||
| hexenyl acetate b | 1 | [33] | ||||||
| (E/Z)-2-hexenyl acetate | 1.8 ± 0.7 | [117] g | 2.6 | [117] h | 4.2 | [117] i | ||
| (Z)-3-hexenyl acetate | 3.1 ± 0.4 | 298 | 0 | [127] | 2.6 | [117] h | 4.2 | [117] i |
| 3.62 ± 0.22 3.29 ± 1.1 2.32 ± 0.17 3.21 ± 0.17 2.56 ± 0.19 | 298 303 308 | 0 0.01 1 0 0 | [130] | |||||
| 3.3 ± 2.4 | 298 | [117] g | ||||||
| (E)-3-hexenyl acetate | 3.3 ± 0.4 | 298 | 0 | [127] | ||||
| 3.3 ± 2.4 | [117] g | |||||||
|
(Z)-3-hexenyl-
propionate | 2.4 ± 1.6 | [117] g | 3.1 | [117] h | 4.6 | [117] i | ||
| (E/Z)-3-hexenyl butyrate | 1.8 ± 1.1 | [117] g | 3.6 | [117] h | 4.9 | [117] i | ||
| (Z)-3-hexenyl isobutyrate | 1.3 ± 0.6 | [117] g | 3.5 | [117] h | 4.9 | [117] i | ||
| (E)-2-hexenyl butanoate | 1.2 ± 0.3 | [117] g | 3.6 | [117] h | 4.9 | [117] i | ||
| (Z)-3-hexenyl 3-methylbutanoate | 1.1 ± 0.6 | [117] g | 4.0 | [117] h | 5.2 | [117] i | ||
| (Z)-3-hexenyl 2-methyl-2-butenoate | 1.8 ± 0.6 | [117] g | 3.9 | [117] h | 5.4 | [117] i | ||
| 3-hexenyl hexanoate | 1.0 ± 0.5 | [117] g | 4.6 | [117] h | 5.7 | [117] i | ||
| 2-methyl-3-buten-2-ol | 73 ± 3 38 ± 7 48 ± 26 | 296 ± 2 | 0 40% wt H2SO4 55% wt H2SO4 | [132] | 1.1 | [117] h | 4.2 f, 4.5 | [117] i |
| 48 a 52.9 ± 5.1 | 298 | 0 0 | [119] | |||||
| 38.7 ± 2.2 21.8 ± 4.4 40.2 ± 5.4 31.7 ± 2.2 | 303 308 | 0.01 1 0 0 | [130] | |||||
| 65 ± 3.5 | 303 | 0 | [128,133] | |||||
| 62 ± 0.8 | 303 | 22.7 mM KNO3 + 7.42 mM CaSO4 | [133] | |||||
| 59.8 ± 58.6 d | [117] g | |||||||
| 1-octen-3-ol | 13.2 | >378 K | 0 | [120,134] | 2.6 | [117] h | 5.6 | [117] i |
| 44.5 ± 1.7 | [117] g | |||||||
| nonanal | 1.3 ± 0.2 | 298 | 0 | [120] c | 3.3 | [117] h | f 4.8, 5.0 | [117] i |
| 1.2 ± 0.1 0.51 ± 0.03 0.38 ± 0.03 | 298 | Freshwater 50% seawater 100% seawater | [129] | |||||
| 1.6 ± 0.4 | [117] g | |||||||
| Jasmonic acid e | 2.5 | [117] h | 9.7 | [117] i | ||||
| methyl jasmonate e | 5081 ± 1003 | 298 | 0 | [106] | 2.8 | [117] h | 7.5 | [117] i |
| 8091 ± 1121 5454 ± 520 3869 ± 261 6716 ± 1272 4837 ± 272 | 298 298 298 303 308 | 0 0.01 1 0 | [130] | |||||
| methyl salicylate e | 33.5 ± 4.0 | 298 | 0 | [106] | 2.6 | [117] h | 5.0 f, 6.3 | [117] i |
| 37.9 ± 2.1 26.7 ± 3.4 20.1 ± 1.6 16.4 ± 0.9 10.0 ± 4.2 | 298 298 298 303 308 | 0.01 1 0 | [130] | |||||
| GLV | Solubility | Vapor Pressure | ||
|---|---|---|---|---|
| mmol dm−3 | Ref. | Atm | Ref. | |
| 1-pentanol | 245.5 | [136] | 2.9 × 10⁻³ | [137] |
| 307 | [138] | 3.7 × 10⁻³ | [138] | |
| 257 | [126] | 3.49 × 10⁻³ | [117] b | |
| 236.98 | [117] a | |||
| 1-penten-3-ol | 1047.1 | [126] | 1.20 × 10⁻² | [117] b |
| 1035.1 | [125] | |||
| 525.48 | [117] a | |||
| (Z/E)-2-penten-1-ol | 530.83 | [117] a | 3.46 × 10⁻³ | [117] b |
| (E)-2-pentenal | 178.08 | [117] a | 2.43 × 10⁻² | [117] b |
| 1-penten-3-one | 260.34 | [117] a | 5.03 × 10⁻² | [117] b |
| (Z)-2-pentenyl acetate | 11.23 | [117] a | 4.14 × 10⁻³ | [117] b |
| n-hexan-1-ol | 57.5 | [136] | 1.22 × 10⁻³ | [139] |
| 61.3 | [125] | 1.16 × 10⁻³ | [117] b | |
| 67.39 | [117] a | |||
| n-hexanal | 56.3 c | [117] b | 1.49 × 10⁻² | [139] |
| 49.9 | [140] | 1.39 × 10⁻² | [140] | |
| 35.21 | [117] a | 1.26 × 10⁻² | [117] b | |
| hexyl acetate | 3.5 | [141] | 1.74 × 10⁻³ | [142] |
| 8.9 | [126] | 1.91 × 10⁻³ | [117] b | |
| 2.14 | [117] a | |||
| hexenol f | 159.74 | [117] a | ||
| (E/Z)-2-hexen-1-ol | 159.74 | [117] a | 1.20 × 10⁻³ | [117] b |
| (Z)-3-hexen-1-ol | 162 ± 6 | [130] | 1.23 × 10⁻³ | [117] b |
| 159.74 | [117] | |||
| (E)-2-hexenal | 53.61 | [117] a | 6.21 × 10⁻³ | [117] b |
| (Z)-3-hexenal | 53.61 | [117] a | 1.97 × 10⁻² | [117] b |
| (E/Z)-2-hexenyl acetate | 3.38 | [117] a | 2.61 × 10⁻³ | [117] b |
| (Z)-3-hexenyl acetate | 3.12 ± 0.17 | [130] | 1.50 × 10⁻³ | [117] b |
| 3.38 | [117] a | |||
| (E)-3-hexenyl acetate | 3.38 | [117] a | 1.50 × 10⁻³ | [117] b |
| (Z)-3-hexenyl-propionate | 1.02 | [117] a | 5.50 × 10⁻⁴ | [117] b |
| (E/Z)-3-hexenyl butyrate | 0.31 | [117] a | 2.05 × 10⁻⁴ | [117] b |
| (Z)-3-hexenyl isobutyrate | 0.35 | [117] a | 3.71 × 10⁻⁴ | [117] b |
| (E)-2-hexenyl butanoate | 0.31 | [117] a | 2.05 × 10⁻⁴ | [117] b |
| (Z)-3-hexenyl 3-methylbutanoate | 0.11 | [117] a | 1.39 × 10⁻⁴ | [117] b |
|
(Z)-3-hexenyl 2-methyl-2-
butenoate | 0.13 | [117] a | 7.53 × 10⁻⁵ | [117] b |
| 3-hexenyl hexanoate | 0.03 | [117] a | 3.04 × 10⁻⁵ | [117] b |
| 2-methyl-3-buten-2-ol | 1959 ± 36 | [130] | 3.08 × 10⁻² | [117] b |
| 565.89 | [117] a | |||
| 1-octen-3-ol | 14.32 | [117] a | 3.13 × 10⁻⁴ | [117] b |
| nonanal | 0.7 | [140] | 4.87 × 10⁻⁴ | [139] |
| 0.93 | [117] a | 5.13 × 10⁻⁴ | [140] | |
| 7.42 × 10⁻⁴ | [117] b | |||
| Jasmonic acid | 3.53 | [117] a | 2.41 × 10⁻⁸ d 1.79 × 10⁻⁷ e | [117] b |
| methyl jasmonate | 4.52 ± 0.09 | [130] | 4.43 × 10⁻⁷ d 1.24 × 10⁻⁶ e | [117] b |
| 0.64 | [117] a | |||
| methyl salicylate | 5.11 ± 0.06 | [130] | 7.03 × 10⁻⁵ | [117] b |
| 4.6 c | [141] | |||
| 12.32 | [117] a | |||
| Reactant | kOH addition | kH abstraction | ktotal | H-Abstraction Branching Ratio | ktotal Deviation from Experimental Values % |
|---|---|---|---|---|---|
| (E)-2-hexen-1-ol | 4.97 × 10⁻¹¹ | 9.76 × 10⁻¹² | 5.95 × 10⁻¹¹ | 0.16 | 26.4 |
| (Z)-2-hexen-1-ol | 5.34 × 10⁻¹¹ | 2.19 × 10⁻¹¹ | 7.53 × 10⁻¹¹ | 0.29 | 11.7 |
| (E)-3-hexen-1-ol | 2.45 × 10⁻¹¹ | 3.50 × 10⁻¹¹ | 5.95 × 10⁻¹¹ | 0.59 | 34.6 |
| (Z)-3-hexen-1-ol | 1.17 × 10⁻¹⁰ | 3.07 × 10⁻¹¹ | 1.48 × 10⁻¹⁰ | 0.21 | −46.5 |
| (E)-4-hexen-1-ol | 4.74 × 10⁻¹¹ | 1.30 × 10⁻¹¹ | 6.04 × 10⁻¹¹ | 0.22 | 15.4 |
| (Z)-4-hexen-1-ol | 1.10 × 10⁻¹⁰ | 2.73 × 10⁻¹¹ | 1.37 × 10⁻¹⁰ | 0.20 | 82.6 |
| GLV | Product | Yield, % Molar | Expt TabLe 10 | Ref. |
|---|---|---|---|---|
| 1-penten-3-ol, (Z)-2-penten-1-ol | 2-pentenyl nitrate | observed | I a | [192] |
| Ethyl vinyl nitrate | observed | |||
| 2-penten-1-ol | observed | I b | ||
| (E)-2-hexenal | PAN analogue | 100 ± 2.5 | II | [193] |
| CO | 6.4 ± 4.2 | |||
| Formic acid | observed | |||
| MBO | Acetone | 63 | III | [191] |
| 68.7 ± 7.1 | IV | [182] | ||
| 1-nitroxyacetaldehyde | 67 | III | [191] | |
| Formaldehyde | 4 | III | [191] | |
| Organic nitrates | 12.5–13.5 | IV | [182] | |
| Hydroxy-aldehyde nitrates, peroxynitrates, carbonyl nitrates, nitroxyalcohols, dinitrates | observed |
| Expt | Photoreactor | Detection | T | p | NO3 Source | Ref. | ||
|---|---|---|---|---|---|---|---|---|
| Type | Vol. dm3 | Material | K | atm | ||||
| I a | Chamber | 80 | Teflon | GC-MS | 298 | 1 | N2O5 | [192] |
| I b | NO2 | |||||||
| II | Reactor | 977 | Pyrex | LP FTIR, UV | 294 | 1 | N2O5 | [193] |
| III | Reactor | 153 | Glass | LP FTIR | 297 | 1 | N2O5 | [191] |
| IV | Chamber | 480 | Teflon | LP FTIR | 295 | 0.97 | N2O5 | [182] |
| GLV | Product | Yield, Molar | Expt Table 12 | Ref. |
|---|---|---|---|---|
| 1-penten-3-ol | Formaldehyde | 0.49 ± 0.02 | I | [201] |
| 0.34 ± 0.04 | IX | [199,200] | ||
| 2-hydroxybutanal | 0.46 ± 0.03 | I | [201] | |
| 0.30 ± 0.05 a | IX | [199,200] | ||
| Propanal | 0.15 ± 0.02 | I | [201] | |
| 0.12 ± 0.01 | IX | [199,200] | ||
| (Z)-2-penten-1-ol | Propanal | 0.39 ± 0.03 | I | [201] |
| 0.493 ± 0.075 | V | [183] | ||
| 0.51 ± 0.02 | IX | [199,200] | ||
| 3-hydroxypropanal | 0.33 + 0.33/−0.16 | V | [183] | |
| Glycolaldehyde | 0.43 ± 0.04 | I | [201] | |
| 2-hydroxyacetaldehyde b | 0.53 ± 0.04 | IX | [199,200] | |
| Formaldehyde | 0.07 ± 0.02 | IX | [199,200] | |
| Acetaldehyde | 0.08 ± 0.01 | IX | [199,200] | |
| methylglyoxal | 0.04 ± 0.01 | IX | [199,200] | |
| 1-penten-3-one | Formaldehyde | 0.37 ± 0.02 | I | [201] |
| 2-oxobutanal | 0.49 ± 0.03 | I | [201] | |
| SOA | 0.13–0.17 | I | [201] | |
| (Z)-3-hexen-1-ol | Propanal | Observed | II | [92] |
| 0.43 ± 0.02 | VIII | [202] | ||
| 0.59 | IX | [199,200] | ||
| Propanoic acid | Observed | II | [92] | |
| 2-propenal | Observed | II | ||
| Acetaldehyde | Observed | II | ||
| Ethane | 0.069 ± 0.005 | VIII | [202] | |
| OH | 0.26 | VI | [174] | |
| 0.28 ± 0.06 | VIII | [202] | ||
| (E)-2-hexenal | OH | 0.62 | VI | [174] |
| Butanal | 0.53 | IX | [199,200] | |
| 0.527 ± 0.055 | IX | [203] | ||
| Glyoxal | 0.56 | [199,200] | ||
| 0.559 ± 0.037 | IX | [203] | ||
| 2-oxobutanal c | 0.074 ± 0.006 | |||
| acetaldehyde | 0.109 ± 0.020 | |||
| Propanal | 0.067 ± 0.008 | |||
| cyclohexanone | 0.032 ± 0.003 | |||
| (Z)-3-hexenal | Propanal | 0.35 ± 0.01 | VIII | [202] |
| Ethane | 0.079 ± 0.004 | |||
| OH | 0.32 ± 0.07 | |||
| (Z)-3-hexenyl acetate | Propanal | Observed | II | [92] |
| 0.76 ± 0.04 | ||||
| Propanoic acid | Observed | II | [92] | |
| 2-propenal | Observed | II | ||
| Acetic acid | Observed | II | ||
| OH | 0.16 | VI | [174] | |
| acetaldehyde | 0.05 ± 0.01 | IX | [199,200] | |
| methylglyoxal | 0.05 ± 0.01 | |||
| Acetone | 0.04 ± 0.01 | |||
| glyoxal | 0.003 ± 0.001 | |||
| (E)-2-hexenyl acetate | butanal | 0.47 | IX | [199,200] |
| 0.473 ± 0.023 | IX | [203] | ||
| 1-oxyethyl acetate | 0.58 | IX | [199,200] | |
| 0.583 ± 0.141 c | IX | [203] | ||
| Glyoxal | 0.209 ± 0.004 | |||
| Propanal | 0.102 ± 0.002 | |||
| 2-oxobutanal c | 0.091 ± 0.007 | |||
| Acetaldehyde | 0.039 ± 0.003 | |||
| Cyclohexanone | 0.090 ± 0.004 | |||
| 3-metyl-2-buten-3-ol | Acetone | 0.083 ± 0.050 | III | [182] |
| Observed | IV | [178] | ||
| 0.67 ± 0.05 | VII a | [177] | ||
| 0.23 ± 0.06 | IX | [199,200] | ||
| Formaldehyde | 0.467 ± 0.055 | III | [182] | |
| 0.29 ± 0.03 | IV | [178] | ||
| 0.44 ± 0.05 | VII a | [177] | ||
| 0.55 ± 0.03 | VII b | [177] | ||
| 0.36 ± 0.09 | IX | [199,200] | ||
| Formic acid | Observed | III | [182] | |
| 0.14 ± 0.04 | VII a | [177] | ||
| Formic anhydride | 0.16 ± 0.07 | |||
| 2-hydroxy-2-methylpropanal | 0.30 ± 0.060.47 (FTIR) | IV | [178] | |
| 0.43 ± 0.12 | VII a | [177] | ||
| 0.84 ± 0.08 | VII b | [177] | ||
| 0.30 ± 0.02 | IX | [199,200] | ||
| Acetaldehyde | 0.01 ± 0.01 | |||
| CO | 0.343 ± 0.024 | III | [182] | |
| CO2 | 0.232 ± 0.015 | III | ||
| OH | 0.19 | IV | [178] |
| Expt | Photoreactor | Detection | Temp. | p | Additions | Ref. | ||
|---|---|---|---|---|---|---|---|---|
| Type | Vol. dm3 | Material | K | atm | ||||
| I | CRAC LISA | 3910 977 | FEP Pyrex | LP FTIR | 293 b 295 c | 1 | CO a | [201] |
| II | Chamber | 775 | Teflon | GC-MS | 296 | 1 | [92] | |
| III | Chamber | 480 | Teflon | LP FTIR | 295 | 0.97 | [182] | |
| IV | Chamber | 7000–8000, 5800 | Teflon | API-MS/MS, GC-FID, GC-MS, GC-FTIR, LP_FTIR | 298 | 0.97 | [178] | |
| V | Chamber | 6500–7900 | Teflon | GC-FID, GC-MS | 298 | Cyclohexane a | [183] | |
| VI | Chamber | 6700, 7900 | Teflon | GC-FID | 296 | 0.97 | Cyclohexane a (E)-2-butene d | [174] |
| VII a | LISA CRAC | 980 3910 | Pyrex FEP | LP-FTIR GC-MS | 298 e | 1 | CO a | [177] |
| VII b | CRAC | 3910 | FEP | LP-FTIR GC-MS | 298 f | 1 | CO a | [177] |
| VIII | Chamber | 6000 | LP FTIR | 298 | 1 | 1,3,5-trimethyl benzene a | [202] | |
| IX | Chamber | 3700–3900 | Teflon | LC-UV | 282–296 | 1 | Cyclohexane a | [199,200] |
| GLV | Product | Yield % | Expt Table 14 | Ref. |
|---|---|---|---|---|
| 1-penten-3-ol | Chloroacetaldehyde Propanal Acetaldehyde 1-penten-3-one | 33 ± 1 39 ± 1 8 ± 3 <2 | I | [205] |
| (Z)-2-penten-1-ol | 2-chlorobutanal Propanal Acetaldehyde (Z)-2-pentenal | 19 ± 1 27 ± 1 18 ± 2 36 ± 1 | I | [205] |
| (E)-2-hexenyl acetate | butanal | not quantified | V | [186] |
| formaldehyde | ||||
| propanal | ||||
| 2-methyl-3-buten-2-ol | Acetone | 47 ± 5 | II | [179] |
| 48 ± 4 | III | [207] | ||
| 38.5 ± 20.6 | IV | [204] | ||
| chloroacetaldehyde | 53 ± 5 | II | [179] | |
| 47 ± 5 | III | [207] | ||
| formyl chloride | <11 | II | [179] | |
| 6.8 ± 5.9 | IV | [204] | ||
| formaldehyde | 6 ± 2 | II | [179] | |
| 7.2 ± 0.6 | III | [207] | ||
| glycolaldehyde | 2.1 ± 0.2 | III | [207] | |
| formic acid | Below the quantification limit | III | [207] | |
| 1.8 ± 0.1 | IV | [204] | ||
| HCl | 15.7 ± 13.5 | IV | [204] | |
| CO | 20 ± 9.3 | |||
| CO2 | <15 |
| Expt | Photoreactor | Detection | Temp. | p | Cl Source | Ref. | ||
|---|---|---|---|---|---|---|---|---|
| Type | Vol. dm3 | Material | K | Atm | ||||
| I | Bag | 400 | Teflon | GC-FID, GC-MS | 298 | 1 | Trichloroacetyl chloride | [205] |
| II | Chamber | 47 | Steel | LP FTIR | 295 | Cl2 | [179] | |
| III | Chamber | 140 | Pyrex | FTIR | 296 ± 2 | 0.92 | Cl2 | [207] |
| IV | Chamber | 480 | Teflon | FTIR | 298 ± 2 | 0.97 | Cl2 | [204] |
| V | Bag | 80 | Teflon | GC-FID, GC-MS (SPME) | 298 | 1 | oxalyl chloride | [186] |
| GLV | k cm3 molecule−1 s−1 | T K | P Atm | Expt Table 16 | Ref. |
|---|---|---|---|---|---|
| Pentan-1-ol | (1.0 ± 0.1) × 10−11 | 298 | 1 | I | [210] |
| (1.08 ± 0.11) × 10−11 a | 296 | 0.03–0.07 | II | [211] | |
| (1.20 ± 0.16) × 10−11 a | 298 ± 2 | 1 | III | [212] | |
| (1.05 ± 0.13) × 10−11 | ibid | IV | |||
| (1.11 ± 0.11) × 10−11 | 298 ± 2 | 740 mmHg | V | [184] | |
| (1.23 ± 0.10) × 10−11 | 295 ± 2 | 1 | VI | [213] | |
| (1.26 ± 0.07) × 10−11 (1.20 ± 0.06) × 10−11 | 298 ± 2 | 1 | VII | [214] | |
| 1-penten-3-ol | (6.7 ± 0.9) × 10−11 | 298 | 1 | VIII | [185] |
| (Z)-2-penten-1-ol | (1.06 ± 0.15) × 10−10 | ||||
| (E)-2-pentenal | (2.35 ± 0.21) × 10−11 a | 298 | 0.132–0.526 | IX | [85] |
| 1-penten-3-one | 3.6 × 10⁻¹¹ b | 298 | 1 | X | [215] |
| Hexan-1-ol | (1.58 ± 0.35) × 10−11 | 296 ± 2 | 1 | XI | [216] |
| (Z)-2-hexen-1-ol | (1.1 ± 0.4) × 10−10 | 296 ± 2 | XII | [217] | |
| 0.95 × 10⁻¹⁰ b | 298 | ||||
| (8.53 ± 1.36) × 10−11 e | 298 | 1 | XIII | [171] | |
| (E)-2-hexen-1-ol | (1.0 ± 0.3) × 10−10 | 298 | 1 | XIV | [176] |
| (8.08 ± 1.33) × 10−11 e | 298 | 1 | XIII | [171] | |
| (Z)-3-hexen-1-ol | (1.2 ± 0.2) × 10−10 | 298 | 1 | XIV | [176] |
| (9.57 ± 2.42) × 10−11 a | 298 | XV | [57] | ||
| (1.08 ± 2.2) × 10−10 | 296 ± 2 | 0.974 | XVI | [174] | |
| (1.01 ± 0.16) × 10−10 e | 298 | 1 | XIII | [171] | |
| (E)-3-hexen-1-ol | (1.4 ± 0.3) × 10−10 | 298 | 1 | XIV | [176] |
| (1.14 ± 0.14) × 10−10 | 298 ± 2 | 1 | XVII | [175] | |
| (0.8 ± 0.1) × 10−10 | 296 2 | 0.98 ± 0.01 | XII | [217] | |
| 1.28 × 10⁻¹⁰ | 298 | ||||
| (9.10 ± 1.50) × 10−11 e | 298 | 1 | XIII | [171] | |
| (E)-4-hexen-1-ol | (7.14 ± 1.20) × 10−11 e | 298 | 1 | XIII | [171] |
| (Z)-4-hexen-1-ol | (7.86 ± 1.30) × 10−11 e | ||||
| n-hexanal | (2.60 ± 0.21) × 10−11 a | 298 | 0.132–0.526 | IX | [85] |
| (2.86 ± 0.13) × 10−11 | 298 ± 2 | 1.00 ± 0.01 | XVIII | [218] | |
| (3.17 ± 0.15) × 10−11 | 296 ± 2 | 1 | XIX | [219] | |
| (2.71 ± 0.20) × 10−11 | 298 ± 2 | 1 | XX | [220] | |
| (E)-2-hexenal | (0.681 ± 0.049) × 10−11 | 296 ± 2 | 0.974 | XVI | [174] |
| (2.95 ± 0.45) × 10−11 a | 298 | 0.132–0.526 | IX | [85] | |
| (3.95 ± 0.17) × 10−11 | 298 ± 2 | 1 | XXI | [221] | |
| (Z)−3-hexenal | (6.9 ± 0.9) × 10−11 | 298 | 1 | XXII | [160] |
| (Z)- 3-hexenyl formate | (4.61 ± 0.07) × 10−11 | 298 | 1 | XXIII | [222] |
| (4.24 ± 0.07) × 10−11 b | |||||
| (E)-2-hexenylacetate | (6.88 ± 1.41) × 10−11 | 298 ± 1 | 750 mmHg | XXIV | [186] |
| (Z)- 3-hexenyl acetate | (1.21 ± 0.71) × 10−11 | 296 ± 2 | 0.974 | XVI | [174] |
| (Z)-3-hepten-1-ol | (1.28 ± 0.23) × 10−10 | 298 ± 2 | 1 | XVII | [175] |
| 2-methyl-3-buten-2-ol | (6.9 ± 1.0) × 10−11 | 295 ± 1 | 0.921 | XXV | [179] |
| (5.67 ± 0.13) × 10−11 | 296 ± 2 | 0.974 | XIX | [223] | |
| (3.9 ± 1.2) × 10−11 | 298 ± 2 | 0.974 ± 0.007 | XXVI | [224] | |
| (6.6 ± 0.5) × 10−11 | 298 ± 2 | 1 | XXVII | [225] | |
| (5.6 ± 0.6) × 10−11 | 298 ± 2 | 1 | XXVIII | [177] | |
| (5.49 ± 0.44) × 10−11 a | 300 | 5 | XXIX | [226] | |
| (6.32 ± 0.27) × 10−11 a,d | |||||
| (6.61 ± 0.66) × 10−11 a,c | |||||
| (Z)-3-octen-1-ol | (1.49 ± 0.35) × 10−10 | 298 ± 2 | 1 | XVII | [175] |
| Nonanal | (3.6 ± 0.7) × 10−10 | 298 | 1 | XXX | [188] |
| (2.88 ± 0.20) × 10−11 | 298 ± 2 | 1 | XX | [220] | |
| Methyl salicylate | (3.20 ± 0.46) × 10−12 | 298 | 1 | XXXI | [227] |
| Expt | Photoreactor | Detection | OH Source | Add. | Reference Reactants | Ref. | ||
|---|---|---|---|---|---|---|---|---|
| Type | Vol. dm3 | Material | ||||||
| I | Bag | 140 | Teflon | GC-FID | H2O2 | Pentane 1,3-dioxolane Cyclohexane | [210] | |
| II | Bulbs | 5 | Pyrex | RF | H2O | no | [211] | |
| III | Cylinder | 50 | Teflon | GC-FID | H2O2 or CH3ONO | Cycloxexane | [212] | |
| IV | Cell | 1 | Steel | LP UV | no | |||
| V | Cylinder | 480 | Duran | LP FTIR; GC-PI | CH3ONO | NO a | Cycloxexane | [184] |
| VI | Bag | 100 | Teflon | GC-FID | H2O2 | Propane; hexane | [213] | |
| VII | Bag | 100 | Tedlar | GC-MS | CH3ONO | Cyclohexane; p-xylene | [214] | |
| VIII | Chamber | 47 | Steel | LP FTIR | CH3CH2ONO | propene | [185] | |
| IX | Cell PLP | 0.2 | Pyrex | LIF | H2O2 | no | [85] | |
| X | SSR LFER | [215] | ||||||
| XI | Chamber | 7600 | Teflon | GC-FID | CH3ONO | NO a | Cyclohexane | [216] |
| XII | Bag | 200 | Teflon | GC-FID | H2O2 | Allyl ether Cycloxexane 1-methyl-cyclohexane | [217] | |
| XIII | Bag | 150 | Teflon | GC-FID | H2O2 | Cyclohexane 2-methyl-3-buten-1-ol | [171] | |
| XIV | Bag | 80 | Teflon | GC-FID, SPME | H2O2 | Methyl methacrylate (E)-2-buten-1-ol | [176] | |
| XV | Cell PLP | 0.2 | Pyrex | UV, LIF | H2O2 | no | [57] | |
| XVI | Chamber | 6700 7900 | Teflon | GC-FID | CH3ONO | NO a | (E)-2-butene | [174] |
| XVII | Chamber | 1080 | Quartz | LP FTIR | H2O2 | (E)-2-butene isobutene | [175] | |
| XVIII | Reactor | 250 | Steel | LP FTIR | CH3ONO Other nitrites | Propene 1-butene | [218] | |
| XIX | Chamber | 7000 | Teflon | GC-FID | CH3ONO | NO a | 1,3,5-trimethylbenzene Methyl vinyl ketone | [219,223] |
| XX | Cylinder | 108O | Pyrex | LP FTIR | CH3ONO | (E)-2-butene; Methylvinyl ketone | [220] | |
| XXI | Bag | 100 | Tedlar | GC-MS | CH3ONO | 2-methyl-2-butene, β-pinene | [221] | |
| XXII | Chamber | 6000 | PFA | LP FTIR | CH3ONO | 1,3,5-trimethylbenzene | [160] | |
| XXIII | Bag | 400 | Teflon | GC-FID | H2O2 | Cyclohexane, n-octane, 1-butene | [222] | |
| XXIV | Bag | 80 | Teflon | GC-FID | H2O2 | (E)-3-hexen-1-ol 2-buten-1-ol | [186] | |
| XXV | Chamber | 47 | Steel | LP FTIR | CH3ONO | Ethylene, propylene | [179] | |
| XXVI | Chamber | 480 | Teflon | LP FTIR | H2O2 | Isoprene, propene | [224] | |
| XXVII | Chamber | 6000 | Teflon | LP FTIR | CH3ONO | NO a | di-n-butyl ether, propene | [225] |
| XXVIII | LISA CRAC EUPORE | 980, 3910 2 × 10⁵ | Pyrex FEP Teflon | LP FTIR | HONO H2O2 | NOx | Isoprene | [177] |
| XXIX | Discharge-flow reactor | 0.02 | Pyrex | LIF | F + H2O, H + NO2 | no | [226] | |
| XXX | Chamber | 5000 | Teflon | GC-FID | Isopropyl nitrite | NOx | Octane | [188] |
| XXXI | ICARE-CHRS chamber | 7300 | Teflon | HR PTR-TOF-MS | CH3ONO | Methyl ethyl ketone; Toluene; Di-n-butyl ether | [227] | |
| GLV | A | EA/R | kT | T | T Range | P | Expt | Ref. |
|---|---|---|---|---|---|---|---|---|
| cm3 Molecule−1 s−1 | K | cm3 Molecule−1 s−1 | K | K | Atm | Table 18 | ||
| Pentan-1-ol | (6.7 ± 3.8) × 10−12 a | −(132 ± 176) | (1.04 ± 0.59) × 10−11 a | 298 | 273–373 | 100 mmHg | I | [210] |
| 1-penten-3-ol | (6.8 ± 0.7) × 10−12 a | −(690 ± 20) | (7.12 ± 0.73) × 10−11 a | 297 | 243–404 | 20–100 mmHg | II | [228] |
| (7.7 ± 1.6) × 10−12 a | −(606 ± 60) a | (5.65 ± 0.76) × 10−11 a | 298 | 263–353 | III | [57] | ||
| (E)-2-penten-1-ol | (6.8 ± 0.8) × 10−12 a | −(680 ± 20) | (6.76 ± 0.70) × 10−11 a | |||||
| 1-penten-3-one | (4.4 ± 2.8) × 10−12 a | −(507 ± 180) a | (2.36 ± 0.47) × 10−11 a | |||||
| (E)-2-pentenal | (7.9 ± 1.2) × 10−12 a | −(510 ± 20) | (4.3 ± 0.6) × 10−11 a | 297 | 244–374 | 0.03–0.197 | IV | [173] |
| (E)-2-hexen-1-ol | (5.4 ± 0.6) × 10−12 a | −(690 ± 20) | (6.15 ± 0.75) × 10−11 a | 298 | 263–353 | III | [57] | |
| (Z)-3-hexen-1-ol | (1.3 ± 0.1) × 10−11 a | −(580 ± 10) | (1.06 ±0.12) × 10−10 a | 297 | 243–404 | 20–100 mmHg | II | [228] |
| hexanal | (4.2 ± 0.8) × 10−12 a | −(565 ± 65) | (2.78 ± 0.50) × 10−11 a | 298 | 263–353 | 0.066 | IV | [159] |
| (E)-2-hexenal | (7.5 ± 1.1) × 10−12 a | −(520 ± 30) | (4.4 ± 0.5) × 10−11 a | 297 | 244–374 | 0.03–0.197 | IV | [173] |
| (9.8 ± 2.4) × 10−12 a | −(455 ± 80) | (4.68 ± 0.50) × 10−11 a | 298 | 263–353 | 0.066 | IV | [159] | |
| 2-methyl-3- buten-2-ol | (8.2 ± 1.2) × 10−12 a 8.43 × 10⁻¹² b | −(610 ± 50) −619.4 b | (5.4 ± 0.4) × 10−11 a (6.4 ± 0.6) × 10−11 b | 299 298 | 254–410 254–360 | 1.3 | IV | [165] |
| Methyl salicylate | 5.0962 × 10⁻¹¹ a,c,d | 917 | 1.9595 × 10⁻¹² a,c,d | 298 | 278–298 | 1 | V | [190] |
| 1.54 × 10⁻¹² a,d,e | 5053.9 | 6.64 × 10⁻²⁰ a,d,e | 298 | 278–350 | 1 | VI | [189] |
| Expt | Photoreactor | Detection | OH Source | Ref. | ||
|---|---|---|---|---|---|---|
| Type | Vol. dm3 | Material | ||||
| I | Cell, LFP | Pyrex | LIF | H2O2 | [210] | |
| II | Cell, LFP | 0.15 | Pyrex | LIF | H2O2 | [173,228] |
| III | Cell PLP | 0.2 | Pyrex | UV, LIF | H2O2 | [57,159] |
| IV | Cell, PLP | 0.15 | Pyrex | LIF | HONO, DONO | [165] |
| V | RKKM theory at MN15-L/aug-cc-pVTZ level with Eckart tunneling correction | [190] | ||||
| VI | DFT theory using B3LYP, M06-2X, and MPW1K functionals with 6-311++G(d,p) basis set. | [189] | ||||
| GLV | k cm3 molecule−1 s−1 | T K | P Atm | Expt. Table 20 | Ref. |
|---|---|---|---|---|---|
| 1-penten-3-ol | (1.39 ± 0.19) × 10−14 a | 298 ± 3 | 1.00 ± 0.03 | I a | [192] |
| (Z)-2-penten-1-ol | (1.53 ± 0.23) × 10−13 a | ||||
| (3.5 ± 1.9) × 10−13 | I b | ||||
| (3.11 ± 0.11) × 10−13 | 295 ± 2 | 1 | II | [230] | |
| (E)-2-pentenal | (1.93 ± 0.40) × 10−14 | ||||
| 1-penten-3-one | 3.39 × 10⁻¹⁴ f | 298 | 1 | III | [215] |
| (Z)-4-hexen-1-ol | (2.93 ± 0.58) × 10−13 a | 298 ± 3 | I a | [231] | |
| (Z)-3-hexen-1-ol | (2.67 ± 0.42) × 10−13 a | ||||
| (2.72 ± 0.83) × 10−13 | 296 ± 2 | 0.974 | IV | [174] | |
| (E)-3-hexen-1-ol | (4.43 ± 0.91) × 10−13 a | 298 ± 3 | I a | [231] | |
| (5.2 ± 1.8) × 10−13 g | I b | ||||
| (Z)-2-hexen-1-ol | (1.56 ± 0.24) × 10−13 a | I a | |||
| (4.05 ± 0.45) × 10−13 d (3.57 ± 0.62) × 10−13 e | 295 ± 2 | 1 | II | [230] | |
| (E)-2-hexen-1-ol | (1.30 ± 0.24) × 10−13 a | 298 ± 3 | I a | [231] | |
| hexanal | (1.14 ± 0.14) × 10−14 | 298 ± 2 | 1.00 ± 0.01 | V | [218] |
| (1.73 ± 0.18) × 10−14 | 298 ± 2 | 1 | V | [232] | |
| (4.75 ± 0.62) × 10−14 b (1.07 ± 0.12) × 10−14 c | 296 ± 2 | 1 | VI | [219] | |
| (1.7 ± 0.1) × 10−14 | 297 ± 2 | 1 | VII a | [233] | |
| (Z)-2-hexenal | (1.36 ± 0.29) × 10−14 | 295 ± 2 | 1 | II | [230] |
| (E)-2-hexenal | (1.21 ± 0.10) × 10−14 | 296 ± 2 | 0.974 | IV | [174] |
| (4.7 ± 1.5) × 10−15 a | 294 ± 3 | 1 | VIII | [193] | |
| (Z)-3-hexenylacetate | (2.46 ± 0.75) × 10−13 | 296 ± 2 | 0.974 | IV | [174] |
| 2-methyl-3-buten-2-ol | (2.1 ± 0.3) × 10−14 a | 294 | 1 | IXa | [234] |
| (1.6 ± 0.6) × 10−14 | IX b | ||||
| (0.86 ± 0.29) × 10−14 | 298 ± 2 | 0.974 ± 0.007 | X | [224] | |
| Nonanal | (1.8 ± 0. 2) × 10−14 (2.2 ± 0. 3) × 10−14 | 297 ± 2 | 1 | VII b VII c | [233] |
| Methyl salicylate | (4.19 ± 0.92) × 10−15 | 298 | 1 | XI | [227] |
| Expt | Photoreactor | Detection | NO3 Source | Reference Reactants | Ref. | ||
|---|---|---|---|---|---|---|---|
| Type | Vol. dm3 | Material | |||||
| I a | Discharge flow tube | Off-axis continuous-wave CEAS | F + HONO | no | [192] | ||
| I b | Bag | 56 | Teflon | GC-FID | N2O5 | (E)-2-butene, 1-butene | |
| II | Flow-tube | 0.005 | Glass | CI MS | N2O5 | (E)-2-butene, Cyclopentane, 1,3-butadiene | [230] |
| III | SRR, LFER | [215] | |||||
| IV | Chamber | 6700 7900 | Teflon | GC-FID | N2O5 | (E)-2-butene, propene | [174] |
| V | Reactor | 250 | Steel | LP FTIR | N2O5 | Propene 1-butene | [218,232] |
| VI | Chanber | 6500 | Teflon | GC-FID | N2O5 | Methacrolein, 1-butene | [219] |
| VII a | Bag | 100 | PVF | (a) FTIR | N2O5 | (a) propene | [233] |
| VII b | (b,c) GC (SPME) | (b) butanal | |||||
| VII c | (c) 1-butene | ||||||
| VIII | Reactor | 977 | Pyrex | FTIR, UV | N2O5 | no | [193] |
| IX a | Flow tube FFD | LP FTIR | F + HNO3 | no | [234] | ||
| IX b | Reactor | 153 | N2O5 | propene | |||
| X | Chamber | 480 | Teflon | LP FTIR | N2O5 | propene | [224] |
| XI | ICARE-CHRS chamber | 7300 | Teflon | HR PTR-TOF-MS | NO2 + O3 | acetaldehyde | [227] |
| GLV | A | EA/R | kT | T | T Range | P | Expt | Ref. |
|---|---|---|---|---|---|---|---|---|
| Molecules cm−1 s−1 | K | Molecules cm−1 s−1 | K | K | mmHg | Table 22 | ||
| (E) -2-pentenal | (5.40 ± 0.30) × 10−12 | 1540 ± 200 | (2.88 ± 0.29) × 10−14 | 298 | 298–433 | 1 | I | [235] |
| (E) -2-hexenal | (1.2 ± 0.3) × 10−12 | 926 ± 85 | (5.49 ± 0.95) × 10−14 | 298 | 298–433 | 1 | [235] | |
| 2-methyl-3-butene-2-ol | 4.6 × 10⁻¹⁴ | 400 | (1.2 ± 0.09) × 10−14 | 298 | 267–400 | 1.2–8.8 | II | [236] |
| Exp | Photoreactor | Detection | OH Source | Add. | Reference Reactants | Ref. | ||
|---|---|---|---|---|---|---|---|---|
| Type | Vol. dm3 | Material | ||||||
| I | Flow tube FFD | LIF | F + HNO3 | no | [235] | |||
| II | Flow tube | LP VIS | N2O5 | no | [236] | |||
| III | ||||||||
| IV | ||||||||
| GLV | k cm3 molecule−1 s−1 | T K | P atm | Expt Table 24 | References |
|---|---|---|---|---|---|
| pentan-1-ol | (2.9 ± 0.2) × 10−17 | 298 | 1 | [210] | |
| 1-penten-3-ol | (1.64 ± 0.15) × 10−17 a | 298 | 1 | I | [201] |
| (1.79 ± 0.18) × 10−17 a | 289 ± 1 | 1 | II | [237] | |
| (Z)-2-penten-1-ol | (11.5 ± 0.66) × 10−17 a | 298 | 1 | I | [201] |
| (1.69 ± 0.25) × 10−16 a | 288 ± 1 | 1 | II | [237] | |
| 1-penten-3-one | (1.17 ± 0.15) × 10−17 a | 298 | 1 | I | [201] |
| (Z)-2-hexen-1-ol | (7.44 ± 1.03) × 10−17 a | 298 | 1 | III a | [238] |
| 10.4 × 10⁻¹⁷ | 298 | III b | |||
| (E)-2-hexen-1-ol | (5.98 ± 0.73) × 10−17 | 298 | 1 | IV | [239] |
| (1.66 ± 0.22) × 10−16 a | 298 | 1 | III a | [238] | |
| 2.86 × 10⁻¹⁶ | 298 | III b | |||
| (Z)-3-hexen-1-ol | 6.7 × 10⁻¹⁷ | 296 | 1 | V | [92] |
| 6.4 × 10⁻¹⁷ | |||||
| (1.05 ± 0.95) × 10−16 a | 258 | II | [237,240] | ||
| (6.4 ± 1.7) × 10−17 | 296 ± 2 | 0.974 | VI | [174] | |
| (6.04 ± 0.07) × 10−17 | 298 | 1 | IV | [239] | |
| (5.47 ± 0.71) × 10−17 a | 298 | 1 | III a | [238] | |
| 4.40 × 10⁻¹⁷ | 298 | III b | |||
| (E)-3-hexen-1-ol | (5.83 ± 0.86) × 10−17 | 298 | 1 | IV | [239] |
| (6.19 ± 0.72) × 10−17 a | 298 | 1 | III a | [238] | |
| 5.8 × 10⁻¹⁷ | III b | ||||
| (Z)-4-hexen-1-ol | (7.09 ± 0.91) × 10−17 a | 298 | 1 | III a | [238] |
| 8.38 × 10⁻¹⁷ | III b | ||||
| (E)-4-hexen-1-ol | (1.05 ± 0.14) × 10−16 a | III a | |||
| 0.88 × 10⁻¹⁶ | III b | ||||
| (E)-2-hexenal | (1.28 ± 0.28) × 10−18 | 287.3 ± 1.4 | 1 | II | [203] |
| (3.0 ± 2.1) × 10−18 | 296 ± 2 | 0.974 | VI | [174] | |
| (Z)-3-hexenal | (3.45 ± 0.30) × 10−17 | 298 | 1 | VII | [160] |
| (Z)-3-hexenyl formate | (4.06 ± 0.66) × 10−17 a | 298 | 1 | VIII a | [241] |
| 6.60 × 10⁻¹⁷ a,b | VIII b | ||||
| (E)-2-hexenyl acetate | (2.18 ± 0.28) × 10−17 | 288.4 ± 0.4 | 1 | II | [203] |
| (Z)-3-hexenyl acetate | 3.6 × 10⁻¹⁷; 5.4 × 10⁻¹⁷ | 296 | 1 | V | [92] |
| (5.4 ± 1.4) × 10−17 | 296 ± 2 | 0.974 | VI | [174] | |
| (5.77 ± 0.70) × 10−17 a | 298 | 1 | VIII a | [241] | |
| 6.84 × 10⁻¹⁷ a,b | VIII b | ||||
| (Z)-3-hexenyl propionate | (7.62 ± 0.88) × 10−17 a | 298 | 1 | VIII a | [241] |
| 1.084 × 10⁻¹⁶ a,b | VIII b | ||||
| (Z)-3-hexenyl butyrate | (1.234 ± 0.159) × 10−16 a | VIII a | |||
| 1.789 × 10⁻¹⁶ a,b | VIII b | ||||
| 2-methyl-3-buten-2-ol | (1.0 ± 0.03) × 10−17 a | 291 ± 1 | II | [237] | |
| (8.3 ± 1.0) × 10−18 a | 293 ± 2 | 1 | IX | [242] | |
| (8.6 ± 2.9) × 10−18 | 298 ± 2 | 0.974 ± 0.007 | X | [224] | |
| (8.6 ± 1.0) × 10−18 a | 298 ± 2 | 1 | XI | [177] | |
| 1-octen-3-ol | (5.00 ± 0.58) × 10−24 a | 298 | 1 | XII | [48] |
| Methyl salicylate | ~4 × 10⁻²¹ c | 298 ± 5 | 1 | XIII | [164] |
| (3.33 ± 2.01) × 10−19 | 298 | 1 | XIV | [227] |
| Expt | Photoreactor | Detection | Addition | Reference Reactants | Ref. | ||
|---|---|---|---|---|---|---|---|
| Type | Vol. dm3 | Material | |||||
| I | Cork LISA | 3910 977 | Teflon Pyrex | LP FTIR, O3 analyzer | no | [201] | |
| II | Chamber | 3500–3700 | Teflon | UV photometer | Cyclohexane a | no | [203,237,240] |
| III a | O3 analyzer | Cyclohexane a | no | [238] | |||
| III b | DFT method at the BH&HLYP/6-31+G(d,p) level of theory | ||||||
| IV | Chamber | 480 | Pyrex | LP FTIR | No b | 1,4-cyclohexadiene, isoprene | [239] |
| V | Chamber | 775 | Teflon | GC-MS | Fluorobenzene c | no | [92] |
| VI | Chamber | 6700 7900 | Teflon | GC-FID | Cyclohexane a | (E)-2-butene, propene, 2-methyl-2-butene | [174] |
| VII | Chamber | 6000 | PFA | LP FTIR | CO a | 1,3,5-trimethylbenzene | [160] |
| VIII a | Flow tube | 0.012 | O3 analyzer | no | [241] | ||
| VIII b | DFT calculations with the BHandHLYP functional and the 6-311+G(d,p) basis sets at the BHandHLYP/6-311+G(d,p) level of theory. | ||||||
| IX | Reactor | 977 | Pyrex | LP FTIR | CO a | no | [242] |
| X | Chamber | 480 | Teflon | LP FTIR | Propane a | Propene, isobutene | [224] |
| XI | LISA CRAC | 980 3910 | Pyrex FEP | LP FTIR GC-MS | CO a | no | [177] |
| XII | Chamber | 775 8000 | Teflon | NIR LDI MS, O3 analyzer | no | [48] | |
| XIII | Chamber | 50 | Teflon | GC-FID | Toluene | [164] | |
| XIV | ICARE-CHRS chamber | 7300 | Teflon | HR PTR-TOF-MS | 3,3,3-trifluoropropene | [227] | |
| GLV | A | EA/R | kT | T | T Range | P | Expt | Ref. |
|---|---|---|---|---|---|---|---|---|
| Molecules cm−1 s−1 | K | Molecules cm−1 s−1 | K | K | Atm | Table 26 | ||
| 1-penten-3-ol | (1.82 ± 2.08) × 10−16 | 730 ± 348 | (1.61 ± 0.21) × 10−17 | 298 ± 2 | 273–333 | 1 | I a | [243] |
| (1.75 ± 0.25) × 10−17 | 298 ± 2 | I b | ||||||
| 0.20 × 10⁻¹⁷ | 298 | I c | ||||||
| (Z)-2-penten-1-ol | (2.32 ± 1.94) × 10−15 | 902 ± 265 | (11.90 ± 1.40) × 10−17 | 298 ± 2 | 273–333 | 1 | I a | [243] |
| (9.07 ± 1.29) × 10−17 | 298 ± 2 | I b | ||||||
| 1.50 × 10⁻¹⁷ | 298 | I c | ||||||
| (E)-2-penten-1-al | (1.38 ± 0.73) × 10−16 a | 1406 ± 163 | (1.24 ± 0.06) × 10−18 a | 298 | 233–373 | 0.8–1 | II | [244] |
| (E)-3-hexen-1-ol | (1.74 ± 1.65) × 10−15 | 1020 ± 300 | (5.97 ± 0.99) × 10−17 | 298 ± 2 | 273–333 | 1 | I a | [243] |
| (6.50 ± 0.95) × 10−17 | 298 ± 2 | I b | ||||||
| 1.48 × 10⁻¹⁷ | 298 | I c | ||||||
| (E)-2-hexenal | (1.79 ± 0.54) × 10−16 a | 1457 ± 90 | (1.37 ± 0.03) × 10−18 a | 298 | 233–373 | 0.8–1 | II | [244] |
| (Z)-2-hexenyl acetate | (2.02 ± 0.65) × 10−15 c | 1306 ± 44 c | 2.50 × 10⁻¹⁷ b | 298 | 200–370 | 0.996 | III | [196] |
| (E)-2-hexenyl acetate | (7.21 ± 0.93) × 10−15 c | 1856 ± 33 c | 1.39 × 10⁻¹⁷ b | |||||
| (Z)-3-hexenyl acetate | (2.83 ± 0.39) × 10−15 c | 993 ± 35 c | 9.84 × 10⁻¹⁷ b | |||||
| (E)-3-hexenyl acetate | (1.68 ± 0.23) × 10−14 c | 925 ± 34 c | 7.37 × 10⁻¹⁶ b | |||||
| Methyl salicylate | 2.97 × 10⁻¹² b,d | 6185.6 | 2.9 × 10⁻²¹ d | 298 | 278–350 | 1 | IV | [189] |
| Exp | Photoreactor | Detection | Add. | Reference Reactants | Ref. | ||
|---|---|---|---|---|---|---|---|
| Type | Vol. dm3 | Material | |||||
| I a | Flow tube | 63 | Pyrex | LP FTIR | Cyclohexane a | 2,3-dimethyl-1,3- butadiene | [243] |
| I b | GC-MS (SPME) | 1-heptene | |||||
| I c | DFFT method with M06–2X functional and 6-311 þ G(d,p) triple split valence basis set | ||||||
| II | Flow tube | 63 | Pyrex | LP FTIR | Cyclohexane a | no | [244] |
| III | DFT and modified RRKM | [196] | |||||
| IV | DFT using B3LYP, M06-2X and MPW1K functionals with 6-311++G(d,p) basis set. | [189] | |||||
| GLV | K cm3 Molecule−1 s−1 | T K | P Atm | Expt Table 28 | Ref. |
|---|---|---|---|---|---|
| Pentan-1-ol | (2.9 ± 0.2) × 10−10 | 298 | 1 | I | [210] |
| (2.51 ± 0.13) × 10−10 | 298 ± 2 | 1 | II | [212] | |
| (2.57 ± 0.25) × 10−10 | 295 ± 2 | 1 | III | [213] | |
| 1-penten-3-ol | (2.96 ± 1.22) × 10−10 | 258 ± 1 | 1 | IV | [205] |
| (2.37 ± 0.38) × 10−10 | 262 ± 1 | 1 | [205] | ||
| (2.40 ± 0.54) × 10−10 | 273 ± 1 | 1 | [205] | ||
| (2.35 ± 0.31) × 10−10 | 298 ± 1 | 1 | [205] | ||
| (2.78 ± 0.30) × 10−10 | 313 ± 1 | 1 | [205] | ||
| (2.57 ± 0.28) × 10−10 | 333 ± 1 | 1 | [205] | ||
| (Z)-2-penten-1-ol | (2.99 ± 0.53) × 10−10 | 296 ± 2 | 1 | V | [245] |
| (3.00 ± 0.49) × 10−10 | 298 ± 1 | 1 | IV | [205] | |
| (2.66 ± 0.47) × 10−10 | 313 ± 1 | 1 | [205] | ||
| (3.26 ± 0.48) × 10−10 | 333 ± 1 | 1 | [205] | ||
| (E)-2-pentenal | (1.31 ± 0.19) × 10−10 | 298 | 1 | VI | [246] |
| 1-penten-3-one | (2.91 ± 1.10) × 10−10 | 298 | 1 | VII | [247] |
| (1.9 ± 0.4) × 10−10 | 297–400 | 1 | VIII | [248] | |
| (E)-2-hexen-1-ol | (3.41 ± 0.65) × 10−10 | 296 ± 2 | 1 | V | [245] |
| (3.49 ± 0.82) × 10−10 | 298 ± 3 | 1 | IX | [249] | |
| (Z)-3-hexen-1-ol | (3.15 ± 0.58) × 10−10 | 296 ± 2 | 1 | V | [245] |
| (2.94 ± 0.72) × 10−10 | 298 ± 3 | 1 | IX | [249] | |
| (E)-3-hexen-1-ol | (3.05 ± 0.59) × 10−10 | 296 ± 2 | 1 | V | [245] |
| (3.42 ± 0.79) × 10−10 | 298 ± 3 | 1 | IX | [249] | |
| (Z)-3-hepten-1-ol | (3.80 ± 0.86) × 10−10 | 298 3 | 1 | [249] | |
| Hexanal | (2.88 ± 0.37) × 10−10 | 298 | 1 | VI | [246] |
| (3.23 ± 0.15) × 10−10 | 298 ± 2 | 1 | X | [220] | |
| (E)-2-hexenal | (1.92 ± 0.22) × 10−10 | 298 | 1 | VI | [246] |
| (Z)-3-hexenyl formate | (2.45 ± 0.15) × 10−10 | 298 | 1 | IV | [222] |
| 4.94 × 10⁻¹⁰ a | 298 | 1 | [222] | ||
| (E)-2-hexenylacetate | (3.10 ± 1.13) × 10−10 | 298 ± 1 | 750 mmHg | XI | [186] |
| 2-methyl-3-buten-2-ol | (4.7 ± 1.0) × 10−10 | 298 ± 2 | 0.974 ± 0.007 | XII | [224] |
| (3.3 ± 0.4) × 10−10 | 295 ± 1 | 0.921 | XIII | [179] | |
| 1-octen-3-ol | (4.03 ± 0.77) × 10−10 | 296 ± 2 | 1 | V | [245] |
| (Z)-3-octen-1-ol | (4.13 ± 0.68) × 10−10 | 298 ± 3 | 1 | IX | [249] |
| Nonanal | (4.82 ± 0.20) × 10−10 | 298 ± 2 | 1 | X | [220] |
| methyl salicylate | (2.8 ± 0.44) × 10−12 | 298 ± 5 | 1 | XIV | [164] |
| (1.65 ± 0.3) × 10−12 | 298 | 1 | XV | [227] |
| Expt | Photoreactor | Detection | Cl Source | Add. | Reference Reactants | Ref. | ||
|---|---|---|---|---|---|---|---|---|
| Type | Vol. dm3 | Material | ||||||
| I | Bag | 140 | Teflon | GC-FID | Cl2 | Pentane 1,3-dioxolane Cyclohexane | [210] | |
| II | Cylinder | 50 | Teflon | GC-FID | Cl2, COCl2 | Cycloxexane | [212] | |
| III | Bag | 100 | Teflon | GC-FID | Cl2 | Propane; hexane | [213] | |
| IV | Chamber | 400 | Teflon | GC-FID | CCl3COCl | Octane, propene, cyclohexane | [205,222] | |
| V | Chamber | 600 | Teflon | Ion flow tupe MS | Cl2 | Tetrahydrofuran, propan-1-ol, octane | [245] | |
| VI | Chamber | 200 | Teflon | GC-FID | Cl2 | Ethene; propene; 1-butene | [246] | |
| VII | Bag | 80 | Teflon | GC-FID | ClC(O)C(O)Cl | Chloroethene 1,1-dichloroethene acrylonitrile | [247] | |
| VIII | Bulb | 0.5 | Pyrex | GC-FID; GC-MS; FTIR | Cl2 | Ethane | [248] | |
| IX | Chamber | 480 | Pyrex | LP FTIR | Cl2 | 1-butene, isobutene | [249] | |
| X | Cylinder | 108O | Pyrex | LP FTIR | Cl2 | (E)-2-butene; Methy lvinyl ketone | [220] | |
| XI | Bag | 80 | Teflon | GC-FID | ClC(O)C(O)Cl | (n-butyl methacrylate n-butyl acrylate | [186] | |
| XII | Chamber | 480 | Teflon | LP-FTIR | Cl2 | Ethene | [224] | |
| XIII | Chamber | 47 | Steel | LP-FTIR | Cl2 | Ethane, cyclohexane | [179] | |
| XIV | Chamber | 50 | Teflon | GC-FID | Cl2 | Acetone | [164] | |
| XV | ICARE-CNRS chamber | 7300 | Teflon | HR PTR-TOF-MS | Cl2 | Acetone | [227] | |
| GLV | A | EA/R | kT | T | T Range | P | Expt | Ref. |
|---|---|---|---|---|---|---|---|---|
| cm3 Molecule−1 s−1 | K | cm3 Molecule−1 s−1 | K | K | Atm | Table 30 | ||
| hexanal | (7.91 ± 0.66) × 10−11 a | −(349 ± 51) | (2.56 ± 0.24) × 10−11 a | 298 | 265–381 | 1 | I | [250] |
| 2-methyl-3-butene-2-ol | (2.83 ± 2.50) × 10−14 | −(2670 ± 249) | (2.13 ± 0.19) × 10−10 | 298 | 256–298 | 1 | II | [251] |
| methyl salicylate | 1.2703 × 10⁻⁸ a,b,c | 1438.4 | 1.01 × 10⁻¹⁰ a,b,c,d | 298 | 278–350 | 1 | III | [209] |
| Expt | Photoreactor | Detection | Cl Source | Add. | Reference Reactants | Ref. | ||
|---|---|---|---|---|---|---|---|---|
| Type | Vol. dm3 | Material | ||||||
| I | Cell (PLP) | 0.2 | Pyrex | RF | Cl2 | No | No | [250] |
| II | Chamber | 400 | Teflon | GC-FID | CCl3COCl | Cycloxexane, methanol, propene, 1-butene | [251] | |
| III | DFT methods at B3LYP and M06-2X levels of theory with 6-311++G(d,p) basis set | [209] | ||||||
| GLV | j s−1 | j/j(NO2) | Φ | θ ° | T K | Expt Table 32 | Ref. |
|---|---|---|---|---|---|---|---|
| 1-penten-3-ol | (1.61–2.36) × 10−6 a | 1 | 298 | I | [57] | ||
| (E)-2-pentenal | 3.06 × 10⁻⁴ | 1 | 20 | 298 | II | [162] | |
| 2.87 × 10⁻⁴ | 30 | ||||||
| 2.58 × 10⁻⁴ | 40 | ||||||
| 2.18 × 10⁻⁴ | 50 | ||||||
| 1.63 × 10⁻⁴ | 60 | ||||||
| 9.73 × 10⁻⁵ | 70 | ||||||
| 1-penten-3-one | (0.36−1.39) × 10−5 a | 1 | 298 | I | [57] | ||
| n-hexanal | 1.7 × 10⁻⁵ | 0.2 × 10⁻² | 0.28 | 286–294 | III | [161] | |
| 1.14 × 10⁻⁵ | 0.28 | 298 | I | [159] | |||
| (1.81 ± 0.10) × 10−5 | 0.31 ± 0.02 | 17 | 298 | IV | [220] | ||
| (Z)-3-hexenal | 2.1 × 10⁻⁵ | 0.4 × 10⁻² | 0.34 | 286–294 | III | [161] | |
| (2.61 ± 0.08) × 10−5 | (4.7 ± 0.4) × 10−3 | 0.25 ± 0.06 | 298 | V | [160] | ||
| (E)-2-hexenal | 1.0 × 10⁻⁴ | 1.8 × 10⁻² | 0.36 | 286–294 | III | [161] | |
| 3.80 × 10⁻⁴ | 1 | 20 | 298 | II | [162] | ||
| 4.05 × 10⁻⁴ | 30 | ||||||
| 3.80 × 10⁻⁴ | 40 | ||||||
| 3.42 × 10⁻⁴ | 50 | ||||||
| 2.89 × 10⁻⁴ | 60 | ||||||
| 2.17 × 10⁻⁴ | 70 | ||||||
| (Z)-3-hexen-1-ol | (1.61−2.36) × 10−5 a | 1 | 298 | I | [57] | ||
| Methyl salicylate | (2.82 ± 0.26) × 10−5 b Insignificant c | 298 | VI | [227] |
| Expt | Photoreactor | Detection | Additions | Ref. | ||
|---|---|---|---|---|---|---|
| Type | Vol. dm3 | Material | ||||
| I | Calculation conditions: clear-sky, July noon, Ciudad Real (Spain). The actinic flux was based on the TUV model a. | [57,159] | ||||
| II | The actinic flux was based on the TUV model a. | [162] | ||||
| III | EUPHORE | 2 × 10⁵ | PTFE | LP-FTIR, GC-FID, GC-MS | [161] | |
| IV | EUPHORE | 2 × 10⁵ | PTFE | LP-FTIR | [220] | |
| V | Chamber | 6000 | PFA | LP-FTIR | CO b, isoprene c | [160] |
| VI | ICARE-CNRS | 7300 | FEP | HR PTR-TOF-MS | [227] | |
| GLV | A | EA | T Range | pH | k298 K a | SOA | Ref. |
|---|---|---|---|---|---|---|---|
| 1011 M−1 s−1 | kJ mol−1 | K | 108 M−1 s−1 | % | |||
| 1-penten-3-ol | 10.4 ± 0.3 | 13 ± 2 | 278–318 | 7 | 6.3 ± 0.1 | - | [163] |
| 1-penten-3-one | 7.2 b | - | [215] | ||||
| (Z)-2-hexen-1-ol | 2.6± 0.1 | 9 ± 2 | 273–318 | 7 | 6.7 ± 0.3 | - | [163] |
| (Z)-3-hexen-1-ol | 8.1 ± 0.9 | 12 ± 0.3 | 278–298 | 5.4 | 5.1 ± 0.8 | 52 | [22] |
| (E)-2-hexenal | 5.2 ± 0.1 | 12 ± 1 | 273–318 | 7 | 4.8 ± 0.3 | - | [163] |
| (Z)-3-hexenyl acetate | 190 ± 40 | 17 ± 2 | 278–298 | 5.4 | 8.7 ± 1.1 | 8 | [22] |
| methyl salicylate | 58 ± 40 | 14 ± 1 | 278–298 | 5.4 | 7.8 ± 0.5 | 87 | |
| methyl jasmonate | 58 ± 9 | 15 ± 2 | 278–298 | 5.4 | 6.8 ± 0.8 | 67 | |
| 2-methyl-3-butene-2-ol | 23 ± 5 | 13 ± 2 | 278–298 | 5.4 | 7.5 ± 1.4 | 20 |
| GLV | X | A | EA | k298 K |
|---|---|---|---|---|
| 109 M−1 s−1 | kJ mol−1 | 108 M−1 s−1 | ||
| 1-penten-3-ol | SO4− | 7.9 ± 0.1 | 5 ± 1 | 9.4 ± 1.0 |
| NO3 | 150 ± 10 | 17 ± 2 | 1.5 ± 0.2 | |
| (Z)-2-hexen-1-ol | SO4− | 110 ± 10 | 10 ± 2 | 28.3 ± 3 |
| NO3 | 38 ± 1 | 9 ± 1 | 8.4 ± 2.3 | |
| (E)-2-hexenal | SO4− | 2.9 ± 0.1 | 4 ± 1 | 4,8 ± 0.2 |
| NO3 | 31 ± 1 | 17 ± 2 | 0.28 ± 0.07 |
| GLV | 1O2 * | 3DMB * | 3MAP * | ||||
|---|---|---|---|---|---|---|---|
| A | EA | k298 K | k | SOA | k | ||
| M−1 s−1 | kJ mol−1 | 106 M−1 s−1 | 106 M−1 s−1 | % | 106 M−1 s−1 | ||
| pH = 2.1 298 K | pH = 5.1 278–298 K | pH = 5.1 | |||||
| (Z)-3-hexen-1-ol | 6.1 × 10²⁰ | 82 ± 7.4 | 2.5 ± 0.3 | 0.33 ± 0.04 | 0.24 ± 0.1 | - | 1.2 ± 0.8 |
| (Z)-3-hexenyl acetate | 2.2 × 10¹⁵ | 50 ± 7.2 | 3.9 ± 0.8 | 14 ± 2 | 14 ± 7 | 38 | 7.3 ± 2 |
| methyl salicylate | - | - | ≤ 0.1 | 29 ± 2 | 12 ± 4 | 80 | 8.0 ± 0.8 |
| methyl jasmonate | 3.6 × 10²³ | 96 ± 4.8 | 6.0 ± 0.7 | 3.6 ± 0.5 | 4.2 ± 3 | 84 | 1.2 ± 0.5 |
| 2-methyl-3-butene-2-ol | 6.7 × 10⁹ | 22 ± 1.7 | 7.5 ± 1.4 | 0.28 ± 0.1 | 0.13 ± 0.07 | - | 0.55 ± 0.2 |
| Film Thickness, µm | ∞ (Bulk) | 193.1 | 77.2 | 38.6 |
|---|---|---|---|---|
| k1st, 10−4 min−1 | 2.83 ± 0.02 | 9.62 ± 0.43 | 11.0 ± 0.5 | 12.7 ± 0.6 |
| Name | Oxidant | MW | Formula | Structure | Phase | Ref. |
|---|---|---|---|---|---|---|
| acetaldehyde | O3 | 44 | C2H4O |  | gas | [92] |
| 2-propenal | 56 | C3H4O |  | |||
| propanal | 58 | C3H6O |  | |||
| acetic acid | 60 | C2H4O2 |  | |||
| 2-propenoic acid | 72 | C3H4O2 |  | |||
| 3-hydroxypropanal | 74 | C3H6O2 |  | PM | [198] | |
| propionic acid | 74 | C3H6O2 |  | Gas, PM | [92,198] | |
| 2-hydroxyacetic acid | 76 | C2H4O3 |  | PM | [198] | |
| 3-hydroxy-2- oxopropanal | 88 | C3H4O3 |  | |||
| 2,3-di-hydroxypropanal | 90 | C3H6O3 |  | |||
| 2-hydro-peroxypropanal | 90 | C3H6O3 |  | |||
| 3-hydroxy-2- oxopropanoic acid | 104 | C3H4O4 |  | |||
| 2-hydroperoxy-3- hydroxypropanal | 106 | C3H6O4 |  | |||
| 2-ethyl-1,3-dioxan-4-ol | OH, O3 | 132 | C6H12O3 |  | PM | [65,198] |
| 3-(2-hydroxy ethoxy) propanoic acid | 134 | C5H10O4 |  | [65] | ||
| 2-(2-hydroxyethyl)- 1,3-dioxan-4-ol | 148 | C6H12O4 |  | [65,198] | ||
| 2-(1,3-dioxin-2- yl) ethylformate | O3 | 158 | C7H10O4 |  | PM | [198] |
| 3-(3–hydroxy propanoyloxy) propanoic acid | OH, O3 | 162 | C6H10O5 |  | PM | [65] |
| 2-(4-hydroxy-1,3- dioxan-2-yl)ethyl formate | O3 | 176 | C7H12O5 |  | PM | [198] |
| 2-(1,3-dioxin-2-yl) ethyl propionate | 186 | C9H14O4 |  | |||
| 1-((2-ethyl-1,3-dioxan- 4-yl)oxy)propan-1-ol | 190 | C9H18O4 |  | |||
| 2-(2-((3-hydroxyprop- 1-en-1-yl)oxy)ethyl)- 1,3-dioxan-4-ol | 204 | C9H16O5 |  | |||
| 2-(4-hydroxy-1,3- dioxan-2-yl)ethyl propionate | 204 | C9H16O5 |  | |||
| 3-(3-(2- hydroxyethoxy) propanoyloxy) propanoic acid | OH, O3 | 206 | C8H14O6 |  | PM | [65] |
| 3-(formyloxy)-3-(2- oxoethoxy) propyl propionate | O3 | 218 | C9H14O6 |  | PM | [198] |
| 3-(3-(2-hydroxy ethoxy)-3- oxopropanoyloxy) propanoic acid | OH, O3 | 220 | C8H12O7 |  | PM | [65] |
| 3-(3-(2-hydroxyethoxy)-3-hydroxypropanoyloxy) propanoic acid | 222 | C8H14O7 |  | |||
| 1-(2-(4-hydroxyl-1,3-dioxan-2-yl)-ethoxy)-propane-1,3-diol | 222 | C9H18O6 |  | |||
| 1,3-dihydrox-3- (2-hydroxyethoxy) propyl- 3- hydroxy propanoate | 224 | C8H16O7 |  | |||
| 3-( 3-(3-hydroxy propanoyloxy) Propanoyloxy propanoic acid | 234 | C9H14O7 |  | |||
| 3-(carboxyoxy)-3-(2- oxoethoxy) propyl propionate | O3 | 234 | C9H14O7 |  | PM | [198] |
| 1-(1-((2-ethyl-1,3- dioxan-4-yl)oxy)propoxy) propan-1-ol | 248 | C12H24O5 |  | |||
| 3-(3-(3-(3-hydroxy propanoyloxy) propanoyloxy) propanoyloxypropanoic acid | OH, O3 | 306 | C12H18O9 |  | PM | [65] |
| Name | MW | Formula | Structure | Phase | Ref. |
|---|---|---|---|---|---|
| 2-propenal | 56 | C3H4O |  | Gas | [92] |
| Propanal | 58 | C3H6O |  | ||
| Acetic acid | 60 | C2H4O2 |  | ||
| 2-propenoic acid | 72 | C3H4O2 |  | ||
| Propionic acid | 74 | C3H6O2 |  | Gas, PM | [92,198] |
| 2-hydroperoxy propanal | 90 | C3H6O3 |  | PM | [198] |
| 3-oxo-propyl acetate | 116 | C5H8O3 |  | PM | [272] |
| 2-acetoxyacetic acid | 118 | C4H6O4 |  | PM | [198] |
| 2,3-dioxopropyl acetate | 130 | C5H6O4 |  | ||
| 2-hydroxy-3-oxopropyl acetate | 132 | C5H8O4 |  | ||
| 3-acetoxy-propanoic acid | 132 | C5H8O4 |  | PM | [198,272] |
| 3-acetoxy-2-oxopropanoic acid | 146 | C5H6O5 |  | PM | [198] |
| 2-hydroperoxy-3- oxopropyl acetate | 146 | C5H8O5 |  | ||
| 3-acetoxypropane peroxoic acid | 148 | C5H8O5 |  | PM | [272] |
| 3,4-dioxohexyl acetate | 172 | C8H12O4 |  | PM | [198] |
| 2-hydroxyethyl 3- acetoxypropanoate | 176 | C7H12O5 |  | PM | [272] |
| 2-(3-oxopropyl)ethyl 3- acetoxy propanoate | 232 | C10H16O6 |  | PM | [272] |
| 3-acetoxypropanoyl 3- acetoxypropanoate | 246 | C10H14O7 |  | PM | [198] |
| 2-(2-(3-acetoxy propanoyloxy)ethoxy) propanoic acid | 248 | C10H16O7 |  | PM | [272] |
| 5-acetoxy-3-oxopentyl-3-acetoxypropanoate | 274 | C12H18O7 |  | ||
| 2-(3- acetoxypropanoyloxy)ethyl 3-acetoxypropanoate | 290 | C12H18O8 |  | ||
| [3-[2-(3- acetoxypropoxy)ethoxy]-3-oxo-propyl] 3-acetoxypropanoate | 348 | C15H24O9 |  |
| MW | Name | Formula | Structure | Phase | Ref. | Ambient Aerosol |
|---|---|---|---|---|---|---|
| 30 | formaldehyde | CH2O |  | Gas | [273,274] | |
| 32 | methanol | CH4O |  | Aqu | [268] b | |
| 44 | acetaldehyde | C2H4O |  | Gas | [273] | |
| 46 | formic acid | CH2O2 |  | Aqu | [268] b | |
| 48 | formaldehyde hydrated (methanediol) | CH4O2 |  | |||
| 58 | acetone | C3H6O |  | Gas, aqu | [268,273,274] b | |
| 58 | glyoxal | C2H2O2 |  | Gas | [187,273] | |
| 60 | glycolaldehyde | C2H4O2 |  | |||
| 61 | acetic acid | C2H4O2 |  | Aqu | [268] b | |
| 72 | methylglyoxal | C3H4O2 |  | Gas | [273] | |
| 74 | glyoxylic acid | C2H2O3 |  | |||
| 76 | glycolic acid | C2H4O3 |  | Aqu | [268] b | |
| 78 | glycolaldehyde hydrated | C2H6O3 |  | |||
| 86 | 1,3-butanedione | C4H6O2 |  | Gas | [273] | |
| 86 | 2-oxopropanedial | C3H2O3 |  | |||
| 88 | 2-hydroxy-2-methylpropanal | C4H8O2 |  | Gas | [187,273] | |
| 88 | 2-hydroxypropaneial | C3H4O3 |  | Gas | [273] | |
| 100 | 2,3-dioxobutanal | C4H4O3 |  | |||
| 114 | 2,3-dioxobutane-1,4-dial | C4H2O4 |  | |||
| 116 | 2-oxovaleric acid | C5H8O3 |  | |||
| 118 | 1,3-dihydroxy-3-methyl- butan-2-one | C5H10O3 |  | Gas, PM | ||
| 118 | 2,3-dihydroxy-3- methylbutanal | C5H10O3 |  | Gas | ||
| 120 | 2,3-dihydroxyisopentanol | C5H12O3 |  | PM, aqu | [266] a, [268] b, [273] | PM2.5 [273,275] |
| 132 | 2,3-dihydroxy-2-methylbutane dialdehyde | C5H8O4 |  | Gas, PM | [273] | |
| 134 | 2,3-dihydroxy-3-methyl- butanoic acid | C5H10O4 |  | PM | ||
| 134 | 2-hydroxy-2- methylpropenedioic acid | C4H6O5 |  | |||
| 136 | 2-methylerythritol | C5H12O4 |  | PM2.5 [273,275] | ||
| 136 | 2-methylthreitol | C5H12O4 |  | PM2.5 [273,275] | ||
| 164 | 2,3-dihydroxy-2- methylsuccinic acid c | C5H8O6 |  | PM2.5 [276] |
| Product | Parent Compound | Formation Process | Ref. | Ambient Aerosol | |||
|---|---|---|---|---|---|---|---|
| MW | Name | Formula | Structure | ||||
| 140 | Glycolaldehyde sulfate | C2H4O5S |  | MBO | SO4− addition | [268] b | PM2.5 [277] PM10 [278] |
| 154 | Hydroxyacetone sulfate | C3H6O5S |  | (Z)-3-hexen-1-ol | OH photolysis, ozonolysis | [279] | PM1 [280,281], PM2.5 [277,279,282,283,284,285], PM10 [278] |
| 156 | Glycolic acid sulfate | C2H4O6S |  | MBO | SO4− addition | [268] b | PM1 [280,281,286], PM2.5 [277,282,283,284,285,287,288] |
| 158 | Hydrated glycol sulfate | C2H6O6S |  | MBO | SO4− addition | [268] b | |
| 170 | Lactic acid sulfate | C3H6O6S |  | (E)-2-pentenal | Ozonolysis | [289] | PM1 [280,286], PM2.5 [277,282,283,284,287,289,290,291,292] |
| 170 | 1-sulfooxy-2- hydroxybutane | C4H10O5S |  | (E)-2-pentenal | Ozonolysis | [289] | PM2.5 [289] |
| 170 | 2-Sulfoxy-3- hydroxy-propanal | C3H6O6S |  | (Z)-3-hexen-1-ol | OH photolysis, ozonolysis | [279] | PM2.5 [279] |
| 186 | 3-sulfoxy-2- hydroxy-propanoic acid | C3H6O7S |  | (Z)-3-hexen-1-ol | OH photolysis, ozonolysis | [279] | PM2.5 [279] |
| 198 | 3-hydroxy-3- methyl-butan-2-one sulfate | C5H10O6S |  | MBO | SO4− addition | [268] b | |
| 198 | 4-sulfoxy-1- hydroxy-3- m3thyl-butan-2-one | C5H10O6S |  | MBO | SO4− addition | [268] b | PM2.5 [277], PM2.5 [288] |
| 200 | 2,3-dihydroxy-3-methyl-butane sulfate | C5H12O6S |  | MBO | OH photolysis SO4− addition | [266] a, [268] b,[293] | PM1 [280,281] ?, PM2.5 [277,283,293], [288] ? |
| 210 | (Z)-5-sulfoxy- hex-3-enoic acid | C6H10O6S |  | (Z)-3-hexen-1-ol | OH photolysis, ozonolysis | [279] | PM1 [280,281] ?, PM2.5 [279], PM10 [278] ? |
| 212 | 6-(sulfoxy) hexanoic acid | C6H12O6S |  | (Z)-3-hexen-1-ol | OH photolysis, ozonolysis | [279] | PM1 [280,281] ?, PM2.5 [279] |
| 214 | 3-sulfoxy-2- hydroxypentanoic acid | C5H10O7S |  | (E)-2-pentenal (E)-2-pentenoic acid | Ozonolysis, SO4− (aqu) | [289] | PM1 [280] ?, PM2.5 [289] |
| 214 | 2-sulfoxy-3- hydroxypentanoic acid | C5H10O7S |  | (E)-2-pentenal | Ozonolysis | [289] | PM1, [280,281] ?, PM2.5 [289] |
| 226 | (E)-5-sulfoxy-4- hydroxy-hex-2-enoic acid | C6H10O7S |  | (Z)-3-hexen-1-ol | OH photolysis, ozonolysis | [279] | PM2.5 [279] |
| 226 | C6H10O7S |  | (Z)-3-hexenal | Ozonolysis | [294] | PM2.5 [294] | |
| 230 | 3-sulfooxy-2,4- dihydroxypentanoic acid | C5H10O8S |  | (E)-2-pentenal, (Z)-3-hexenal (Z)-2-hexenal | Ozonolysis ozonolysis | [289] | PM2.5 [289] |
| 270 | C9H18O7S | - | (Z)-3-hexen-1-ol | OH photolysis, ozonolysis | [279] | PM2.5 [279] | |
| GLV | OH | NO3 | O3 | Cl | Photolysis | ||||||
|---|---|---|---|---|---|---|---|---|---|---|---|
| τ h | Ref. | τ h | Ref. | τ h | Ref. | τ h | Ref. | τ h | Zenith Angle, ° | Ref. | |
| Pentan-1-ol | 24 b | [184] | |||||||||
| 1-penten-3-ol | 2.1 | [185] | 40 | [192] a | 23.5 | [201] | 118 | [205] a | 174–120 c | [57] | |
| 2.83 | [57] b | 22.3 | [237] a | ||||||||
| 1.95 | [228] a | 24.3 | [243] b | ||||||||
| (Z)-2-penten-1-ol | 1.3 | [185] | 3.6 | [192] a | 3.7 | [201] | 93 | [245] | |||
| 2.5 | [237] a | 92.6 | [205] a | ||||||||
| 2.1 | [243] b | ||||||||||
| (E)-2-penten-1-ol | 2.05 | [57] a | |||||||||
| (E)-2-pentenal | 5.9 | [85] a | 28.8 | [230] a | 309 | [244] b | 212 | [246] b | 0.73 | 26 | [162] |
| 3.23 | [173] a | ||||||||||
| 1-penten-3-one | 1.18 | [57] b | 16.4 | [215] a | 29.2 | [201] | 77–20 ac | [57] | |||
| hexanal | 4.4 | [85] a | 32 | [232] a | 97 | [246] b | 24.4–13.4 ac | [159] | |||
| 5.0 | [159] a | ||||||||||
| (Z)-2-hexen-1-ol | 1.25 | [217] b | 3.6 | [231] | 5.3 | [238] | |||||
| 4.27 | [171] b | 1.5 | [230] | ||||||||
| (E)-2-hexen-1-ol | 1.4 | [176] | 4.3 | [231] | 6.7 | [175] | 81 | [245] | |||
| 4.04 | [171] b | 2.4 | [238] | 81 | [249] | ||||||
| 2.26 | [57] a | ||||||||||
| (Z)-3-hexen-1-ol | 1.3 | [174,228] a | 2.1 | [231] | 3.8 | [237,240] a | 91 | [245] | 17.4–11.8 ac | [57] | |
| 1.0 | [176] | 2.0 | [174] | 2.8 | [243] b | 95 | [249] | ||||
| 4.78 | [57] b | 6.6 | [175] | ||||||||
| 5.05 | [171] b | 6.2 | [174] | ||||||||
| 7.2 | [238] | ||||||||||
| (E)-3-hexen-1-ol | 1.2 | [176] | 1.3 | [231] | 6.9 | [175] | 86 | [245] | |||
| 1.25 | [175] | 6.4 | [238] | 81 | [249] | ||||||
| 1.75 | [217] b | 6.6 | [243] a | ||||||||
| 4.55 | [171] b | ||||||||||
| (Z)-4-hexen-1-ol | 3.92 | [171] b | 1.9 | [231] | 5.6 | [238] | |||||
| (E)-4-hexen-1-ol | 3.57 | [171] b | 3.8 | [238] | |||||||
| (Z)-2-hexenal | 40.8 | [230] a | |||||||||
| (E)-2-hexenal | 3.12 | [174] b | 81.2 | [174] | 192 | [174] | 145 | [246] b | 0.48 | 26 | [162] |
| 2.97 | [159] a | 41 | [230] | 274 | [244] b | 2.7 | [161] | ||||
| 10 | [235] | ||||||||||
| 125 | [193] | ||||||||||
| (Z)-3-hexenal | 11.5 | [160] a | 13.3 | [161] | |||||||
| 5.6 | 30 | [160] | |||||||||
| (Z)-3-hepten-1-ol | 1.09 | [175] | 73 | [249] | |||||||
| 1-octen-3-ol | 69 | [245] | |||||||||
| (Z)-3-octen-1-ol | 0.94 | [175] | 67 | [249] | |||||||
| 2-methyl-3-buten-2-ol | 3.56 | [224] a | 26.5 | [234] b | 39.9 | [237] a | 130 | [251] a | >5 yrs | [165] | |
| 2.01 | [179] a | 46 | [236] | 47.8 | [242] a | 59.1 | [224] a | ||||
| 2.17 | [165] a | 46.1 | [224] a | 84.2 | [179] a | ||||||
| 2.5 | [177] | ||||||||||
| (E)-2-hexenylacetate | 2 | [186] | 9.0 | [186] | |||||||
| (Z)-3-hexenyl formate | 3 | [222] b | 9.8 | [241] | 113.5 | [222] | |||||
| (Z)-3-hexenyl acetate | 1.76 | [174] b | 2.3 | [174] | 7.3 | [174] | |||||
| 6.9 | [241] | ||||||||||
| 4.0 | [196] a | ||||||||||
| (Z)-3-hexenyl propionate | 5.2 | [241] | |||||||||
| (Z)-3-hexenyl butyrate | 3.2 | [241] | |||||||||
| Methyl salicylate | 70.88 | [190] | 99192 11.3 yrs | [164] b | 15378 1.64 yr | [164] b | |||||
| 15.6 yrs | [189] a | 275 b | [209] | ||||||||
Publisher’s Note: MDPI stays neutral with regard to jurisdictional claims in published maps and institutional affiliations. |
© 2021 by the authors. Licensee MDPI, Basel, Switzerland. This article is an open access article distributed under the terms and conditions of the Creative Commons Attribution (CC BY) license (https://creativecommons.org/licenses/by/4.0/).
Share and Cite
Sarang, K.; Rudziński, K.J.; Szmigielski, R. Green Leaf Volatiles in the Atmosphere—Properties, Transformation, and Significance. Atmosphere 2021, 12, 1655. https://doi.org/10.3390/atmos12121655
Sarang K, Rudziński KJ, Szmigielski R. Green Leaf Volatiles in the Atmosphere—Properties, Transformation, and Significance. Atmosphere. 2021; 12(12):1655. https://doi.org/10.3390/atmos12121655
Chicago/Turabian StyleSarang, Kumar, Krzysztof J. Rudziński, and Rafał Szmigielski. 2021. "Green Leaf Volatiles in the Atmosphere—Properties, Transformation, and Significance" Atmosphere 12, no. 12: 1655. https://doi.org/10.3390/atmos12121655
APA StyleSarang, K., Rudziński, K. J., & Szmigielski, R. (2021). Green Leaf Volatiles in the Atmosphere—Properties, Transformation, and Significance. Atmosphere, 12(12), 1655. https://doi.org/10.3390/atmos12121655