Article

Combined Impact of Climate Change and Land Qualities on Winter Wheat Yield in Central Fore-Caucasus: The Long-Term Retrospective Study

1
School of Economics and Management, Harbin Engineering University, Harbin 150001, China
2
Faculty of Agrobiology and Land Resources, Stavropol State Agrarian University, 355017 Stavropol, Russia
3
Faculty of Social and Cultural Service and Tourism, Stavropol State Agrarian University, 355017 Stavropol, Russia
*
Author to whom correspondence should be addressed.
Land 2021, 10(12), 1339; https://doi.org/10.3390/land10121339
Submission received: 9 October 2021 / Revised: 1 December 2021 / Accepted: 2 December 2021 / Published: 5 December 2021
(This article belongs to the Section Land–Climate Interactions)

Abstract

:
Progressing climate change has been increasingly threatening the agricultural sector by compromising the resilience of ecosystems and endangering food security worldwide. Altering patterns of major climatic parameters require the perspectives of agricultural production to be assessed in a holistic way to understand the interactions of climatic and non-climatic factors on crop yield. However, it is difficult to distinguish the direct influence of changing temperature and precipitation on the productivity of crops while simultaneously capturing other contributing factors, such as spatial allocation of agricultural lands, economic conditions of land use, and soil fertility. Wide temporal and spatial fluctuations of climatic impacts substantially complicate the task. In the case of the 170-year retrospective analysis of the winter wheat sector in the south of Russia, this study tackles the challenge by establishing the multiplicative function to estimate crop yields as a long-term result of a combined influence of agricultural output parameters, qualities of soils, and climate variables. It is found that within the climate–land–yield triangle, linkages tighten or weaken depending on the strength of noise effects of economic and social perturbations. Still, the overall pressure of climate change on the cultivation of winter wheat has been aggravating. The inter-territory relocation of areas under crops based on the matching of soil types, precipitation, air temperature, and erodibility of lands is suggested as a climate response option. The approach can be employed as a decision support tool when developing territory-specific land management policies to cope with adverse climate impacts on the winter wheat sector.

1. Introduction

Progressing climate change drastically challenges establishing food security and ensuring the sustainable development of countries and territories worldwide [1,2]. According to the Food and Agriculture Organization of the United Nations (FAO) [3], the demand for food rises globally due to increasing population and improving living standards. The boom is particularly evident across developing economies in Asia and Latin America. If food consumption continues rising globally, agricultural output will need to be lifted by at least 60% to meet growing demand. Although yields of all crops have increased over the past decades [4], the growth has been achieved mainly due to improvements in plant genetics, the arrival of new crops, and land management practices. Crop productivity is likely to continue improving in the coming years. However, the growth is expected to be lower than it could be in the case without climate change (60% by 2050 over 2010 level with climate change against 70% without it, according to the International Food Policy Research Institute (IFPRI) [5]).
Lobell and Field [6] found at least 30% of variations in average yields to be explained by spatial averages of air temperatures and precipitation based on the locations of crops. Many studies [7,8,9] show that throughout the history of crop production until the XIX century, the pre-industrial global mean temperatures had remained relatively stable within a range of ±1 °C from today’s levels. Since the early 1900s, climate impacts on crop productivity have been becoming increasingly uncertain. Mean temperatures have been rising, first, critically faster than ever [10] and, second, beyond the established Paris climate threshold [11]. Kimball [12], Allen [13], Keeling et al. [14], and Tubiello and Ewert [15] revealed that a substantial increase in atmospheric CO2 concentration in the XX century compared to the pre-industrial era affected crop yields in warmer environments. Mounting evidence suggests that anthropogenic climate change and other indirect human-induced environmental and agricultural processes aggravate soil degradation, soil loss, and soil erosion problems [16,17,18]. Not as immediately disturbing as sudden extreme weather events, the ongoing pressure of climatic factors on soils in the long run substantially increases threats to soil fertility, lowers yields of most staples, and ultimately deteriorates food security prospects worldwide [19,20].
Various models have been applied to estimate the impacts of climate-related factors on agricultural production. Crop models captured changes in air temperature, precipitation, greenhouse gas emissions, and other environmental factors, hydrology models focused on studying water resources, while economic models emphasized the allocation of scarce inputs to sustain yields [10,21,22,23,24,25,26]. Despite certain differences in approaches employed, most forecasts expect the climate to increasingly influence crop production by shifting land supply and land use patterns, transforming allocation of land to irrigated and rainfed crops, and threatening yields [27,28,29,30,31]. The adjustment of food supply to such changes requires comprehensive transformations of crop production (geophysical, spatial, economic, and social) [32]. In a broad sense, the transformation should be considered as the establishment of a food production system more resilient to external factors [33,34,35,36,37,38]. Since the 1970s, many advanced agronomic studies [39,40,41,42,43] have been working on adapting physiological processes of plant growth, seed formation, and yields to climate change. Brisson et al. [44], Keating et al. [45], and Challinor et al. [46] employed biophysical process-based models and agro-ecosystem models to evaluate the impacts of climate change on crops. Rosenzweig et al. [47] used global-gridded crop model intercomparisons, while Schlenker et al. [48] and Lobell and Burke [49] carried out statistical analyses of historical data. Many scholars agree that one of the essential aspects of how climate affects food security is the difference in the methods of farming based on available resources (availability of agricultural lands, competition for scarce land resources between agricultural and non-agricultural land uses, quality of soils, accessibility of water for irrigation, etc.) [17].
Fluctuations in the average annual growth rates of air temperature and precipitation undermine the stability of agricultural production. However, Lenton et al. [50], Lockwood [51], Rial et al. [52], and other climate-related studies have proved climate impacts on land use to be nonlinear. Even relatively recent records show how periods of warming invert to cooling and annual precipitation rates rise and fall [27,53]. According to Easterling et al. [54], Lobell and Field [6], and Ju et al. [55], the ability to simulate extreme weather events speaks in favor of the quality of crop models. Nevertheless, temporal and spatial mismatches between weather extremes and responses demonstrated by crop models call for more extended simulations. Long-term observations of synthesized climate and crop yield data are crucial to establish a reliable picture of whether time trends in climate variables exert significant impacts on the productivity of crops [56]. In diverse environments, studying the decades-long crop productivity elasticities with respect to climate effects show adaptations in agriculture through acreage adjustments [57,58]. The climate-induced volatility of land use affects crop substitution, the expansion or reduction of agricultural lands, the specialization of farmers on cultivation of particular crops, crop rotations, etc. [1,10,59,60,61,62].
The uncertainty regarding revealing direct climate impacts on the agricultural sector is exacerbated at the regional and local levels. The effects of territory-specific production and technological decisions play out in the territory-specific land use systems [63]. Climate change is commonly believed to have reduced yields globally, but this opinion does not preclude the possibility that some regions could experience gains in crop productivity [6]. The latter could be true for higher latitudes where rising temperature and precipitation make the climate milder, thus allowing for the expansion of crop production [64]. For instance, Olesen et al. [65], Gornall et al. [66], and Rötter et al. [67] evidenced gains in crop production in Northern Europe and losses over Southern and Eastern Europe amid an overall rise in temperature and precipitation across the continent. Nonetheless, in many conventional farming centers in southern and middle latitudes, changes in temperature and precipitation regimes dramatically deteriorate the cultivation of high-performing crops [1]. In particular, Dronin and Kirilenko [64], Alcamo et al. [68], Smith et al. [69], and Korsak et al. [70] point out that Russia’s largest crop centers, including the Central Fore-Caucasus and Volga regions, have been increasingly suffering crop output shortfalls in recent decades due to a higher frequency and spatial heterogeneity of extreme climate events.
Thus, the ongoing climate change has been imposing evident impacts on the production of field crops. However, as evidenced by Lobell and Asner [71], Tao et al. [56], and Challinor et al. [72], the extent of climate effects has differed both temporally and spatially. Crop production has always been inextricably linked with climate. Still, ongoing climate change has made this link much more vulnerable by increasing trends in temperature, volatile precipitation, and more frequent and damaging weather extremes. The impacts of climatic variables have become less predictable, more diverse by time and location, and, to a much greater degree, distorted by side influencings, such as agricultural technology, market uncertainties, land use practices, and land ownership, among others. Therefore, there is a need to consider these effects in the broader context of weather inputs, soil conditions, local farming practices, and endemic features of land use [63]. As lamented by White et al. [73], Rötter et al. [74], and Claussen et al. [75], such a tripartite approach (climate–land–yield) has been rarely applied at the regional level in combination with historical data. We consider the retrospective orientation of the territory-specific analysis particularly promising. It allows for drawing a comprehensive picture of the long-term effects of climate trends, not weather peaks, on the production of crops. In view of sustaining the food supply, it also reflects the transformation of land management practices and land use patterns. From this perspective, the current study aims to explore the exposure of multivariate factors on crop yield by capturing long-term impacts of (1) changes in air temperature and precipitation, (2) allocation of lands between agricultural and non-agricultural categories, and (3) the interdependence between crop productivity, climate change, and quality characteristics of soils.
The remainder of this paper is divided into four sections. In Section 2, we establish the multiplicative climate–yield model based on the discussion of impacts of climate-related factors and land use patterns on winter wheat yields. Section 2 also outlines the case study area, the data used in the study, and the time frame. In Section 3, we present the results of the 170-year retrospective analysis of the winter wheat sector in Stavropol Krai, Russia. In Section 4, the findings are discussed through the lens of changes in the revealed effects of climate and land variables on winter wheat yields. Finally, the paper concludes with a summary of the theoretical and practical implications of the study and the limitation of the multiplicative climate–yield model.

2. Materials and Methods

2.1. Climate Impact

Correlations between crop yields and climate change have been comprehensively studied from various angles, such as the emission of greenhouse gases [76], the concentration of carbon dioxide in the atmosphere [47], solar radiation [77], ozone impacts on crops [78], and biotic and abiotic stresses [79], among others. These factors have been substantially influencing agricultural production since the advent of widespread industrialization in the XVIII–XIX centuries. It is commonly agreed today [80,81,82] that industrialization has become one of the critical factors for temperature increase. The latter has triggered the recent volatility of climate impacts on plant physiology and crop yields throughout the world. Temperature extremes directly influence the reproductive phase of plant growth [83] and make the climate more vulnerable through changing precipitation regimes. Droughts and floods are equally destructive for crops, but even slight changes in rainfall alone can have a potentially essential influence on crop yields [27].
Thus, temperature and precipitation are believed to be the increasingly exaggerating climate impacts on the productivity of the agricultural sector both globally and locally [84], in any location and any agricultural system, because they can dramatically lower crop yields [85]. However, it is not just rapid temperature spikes or rainfall extremes that threaten crops in the short run. A longer-term gradual rise in temperature or slowly changing precipitation rates affects the overall sustainability of the agricultural sector over the long-term horizon. As evidenced by Lobell and Burke [49], estimating precipitation responses requires the employment of long-term time-series models. At the same time, that of temperature responses should also involve cross-section methods. Proceeding from the approaches to determining climate impacts on agricultural production, we calculate the former by dividing the sum of the annual average precipitation by the sum of the annual average air temperatures (Equation (1)). This approach allows us to identify the optimal values of the annual average air temperature and precipitation, deviation from which does not result in a significant drop in crop yield:
V = (   R   T ) n
where V = climate impact;   R = sum of the annual average precipitation, mm;   T = sum of the annual average air temperatures, °C; and n = study period.

2.2. Land Use Impact

In view of the exacerbating effects of both rising temperature and more volatile precipitation patterns on agricultural production, many scholars highlight the need to make land use systems more adaptive to the ongoing climate change [27,85,86]. As demonstrated by Challinor et al. [87], local warming by 2 °C causes losses in productivity of most crops, while adaptations allow farmers to increase yields by an average of 7 to 15%. Among others, adaptation practices may include modifications to crop management regimes [88], a shift to more resilient crop species [89], or an introduction of new crops [90]. Still, historically, the most common response to drops in crop yields has been an increase in the planting area of crops [91]. Nowadays, a simple expansion of areas under crops is hardly an effective response to climate impacts anymore, since such a spatial targeting of adaptation measures is hampered by geographical factors [92], pervasive land-use change impacts [93], and infrastructure constraints [94]. Following Lin et al. [85], Egbebiyi et al. [90], Rippke et al. [95], and Challinor et al. [87], we approach analyzing land use impact on agricultural production by revealing spatial patterns of allocation of lands between agricultural and non-agricultural uses. Generally, agricultural lands do not directly compete with other categories for the same land areas at a regional scale due to the specific climate and soil requirements for farming [96]. However, according to Mather and Needle [97], dos Santos et al. [98], and Zhang et al. [99], in territories where climate conditions are highly variable, farmers try to adjust areas under crops to better match soil quality, and the conflicts between different functional land types tend to emerge. Equation (2) allows for characterizing territories by type and level of agricultural and non-agricultural land use, and thus shows the degree of involvement of lands into agricultural production:
S A L = ( d S C + d S R + d S H + d S P P + d S R I L + d S P P L + d S O L ) n
where S A L = total area of agricultural land use, ha; S C = croplands; S R = rangelands; S H = hayfields; S P P = perennial plantings; S R I L = residential and industrial lands; S P P L = publicly protected lands; S O L = other lands; d = share of the category in the land use; and n = study period.
Based on the studies of organizational forms of land use in Russia [96,100,101], the categories of agricultural and non-agricultural lands included in the study are defined as follows:
  • Croplands: lands systematically cultivated for crop production, including perennial grasses and clean fallow;
  • Rangelands: lands systematically and predominantly used for livestock grazing, including lands appropriate for livestock grazing but not used as hayfields or fallow;
  • Hayfields: lands where herbaceous plants are systematically grown for hay;
  • Perennial plantings: lands under homogeneous stands of arboreal plants, bushes, and herbaceous plants used for the production of horticultural, technical, and medical products;
  • Residential and industrial lands: areas of intensive use in urban and suburban territories with much of the land covered by residential and industrial structures, including in the locations isolated from urban areas;
  • Publicly protected lands: lands of state nature reserves, including biosphere reserves, state nature reserves, natural monuments, national parks, natural parks, dendrological parks, and botanical gardens;
  • Other lands: lands under utilities, infrastructure, and waterworks facilities, as well as areas involved in processing, treatment, and transportation of water, gas, oil, and electricity.

2.3. The Multiplicative Climate–Yield Model
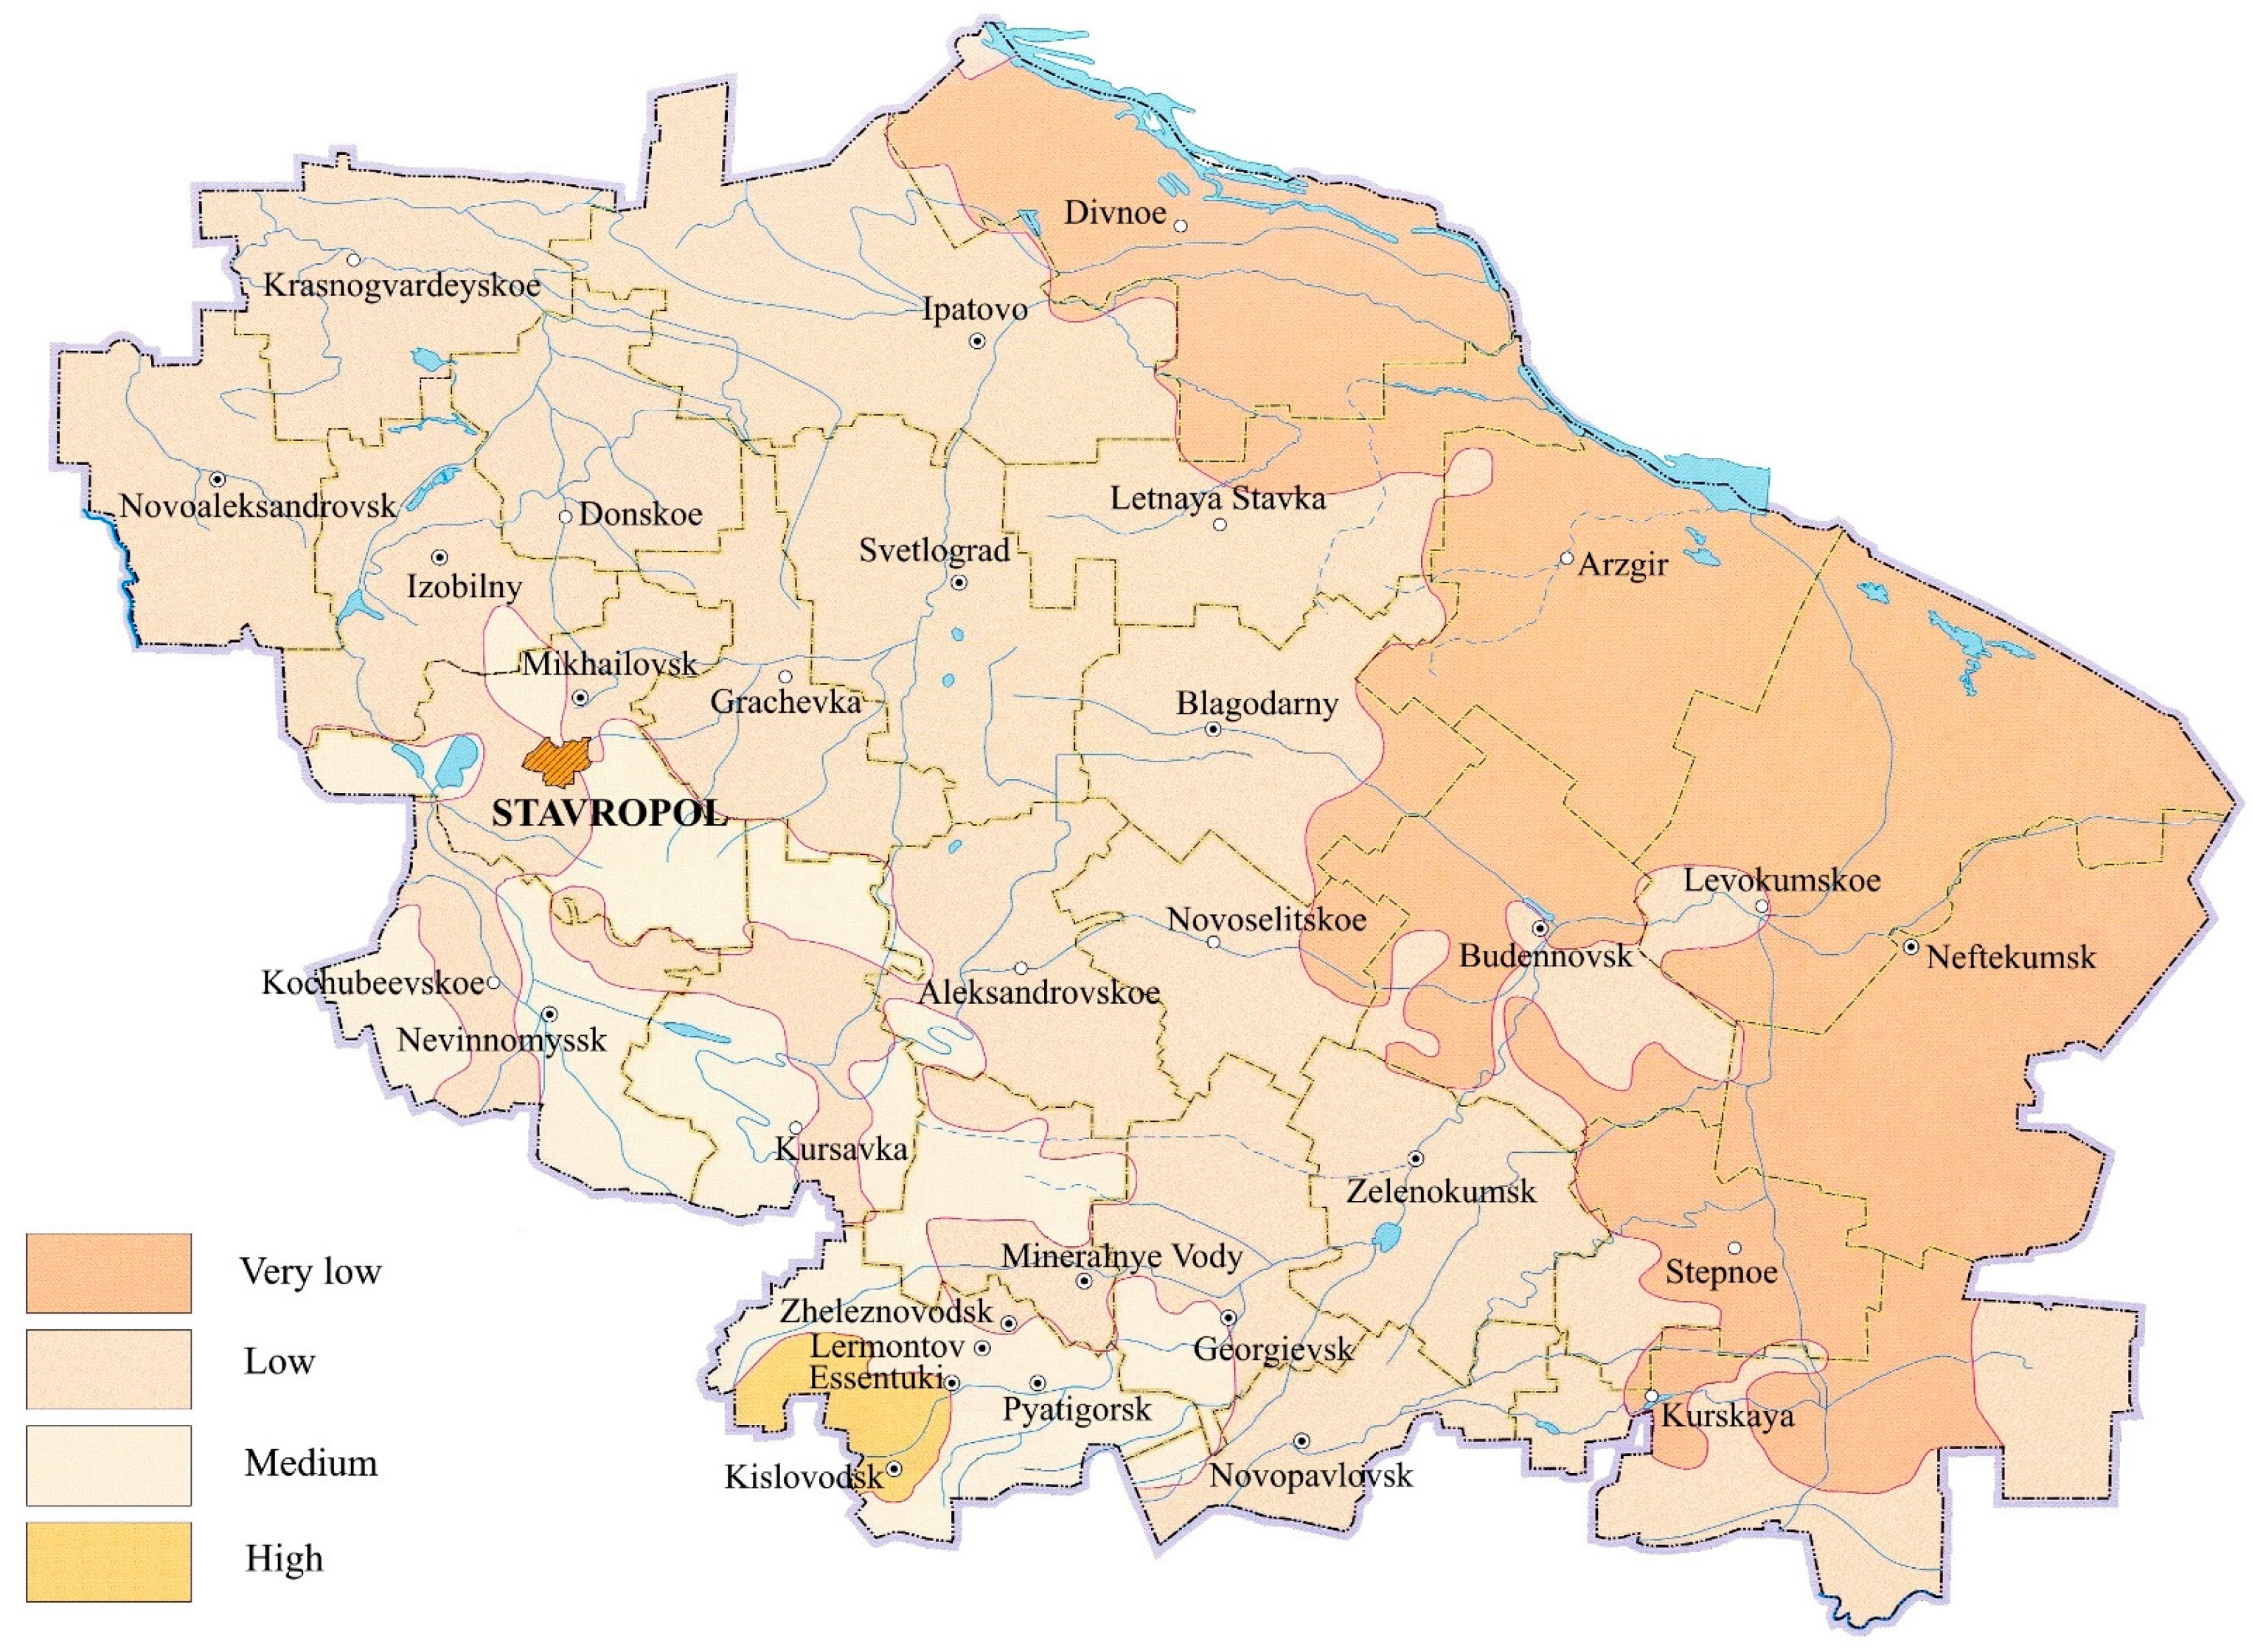
The adjustment of the farming system to climate impacts and the specifics of the land use pattern should take into account productivity parameters of soils. However, as demonstrated by Mearns et al. [42] and Altieri and Nicholls [84], it is quite difficult to distinguish the influence of climatic factors on crop yields from spatial allocation of agricultural lands, while simultaneously capturing other contributing factors, such as economic conditions of land use, plant diversity, soil fertility, and output boosters (fertilizers, mechanization, irrigation, etc.). We approach this problem’s solution by establishing the multiplicative function, which estimates crop yields as a resultant of a combined impact of agricultural output parameters, qualities of soils, and climate impacts (Equation (3)). The rationale of inclusion of the effect of heterogeneous soils on crop yields corresponds with the findings of Giorgi and Mearns [102], Risbey and Stone [103], and Mearns et al. [42], who associated variations in soil characteristics over space with regional climate change effects on agriculture:
Y t = A t n × ( ( T a ± T t ) × ( R a ± R t ) × ( C ± C t ) × ( M ± M t ) × ( O ± O t ) ) n
where Y t = crop yield, tons/ha; A t = neutral technical progress; T a = annual average air temperature, °C; T t = deviation from annual average air temperature, °C; R a = annual average precipitation, mm; R t = deviation from annual average precipitation, mm; C = humus content, %; C t = deviation from humus content, %; M = applied mineral fertilizers, thousand tons active ingredient; M t = deviation from the total volume of applied mineral fertilizers, thousand tons active ingredient; O = applied organic fertilizers, thousand tons; O t = deviation from the total volume of applied organic fertilizers, thousand tons; and n = study period.
The concept of neutral technical progress is introduced to measure the accumulated effects of the three types of impacts (output, soils, climate) on crop yields over time. Although this concept has been scarcely addressed in relation to agriculture, the progress is expected to be land-saving in land-deficit regions. At the same time, land-abundant territories are likely to experience the expansion of areas under crops [104]. Furthermore, available studies [105,106] prove the application of the neutral technical progress variable in multiplicative functions to be reasonable, since the variable allows for capturing diverse effects while ensuring that neither of the impacts becomes more or less important at the margin.
When using time series as raw data, it is important to exclude autocorrelation of random errors for various observations. Autocorrelation could result in misinterpreting the results due to autoregression when derived parameters in a series are linearly dependent on previous values. To deal with the time series nature of data, this study employed the Cochrane–Orcutt estimation. This procedure adjusts a linear model for serial correlation in the error term. The method allowed us to obtain more accurate estimates of the regression coefficients in the case of residual autocorrelation. The calculation was made in the IBM SPSS Statistics package. The evaluation procedure was terminated in the appropriate iteration when the parameter change was less than 0.001.

2.4. Territory

The study is carried out in the case of Stavropol Krai, which currently establishes Russia’s section of Central Fore-Caucasus between Georgia in the south, Ukraine in the northwest, and Kazakhstan in the northeast. Stavropol Krai is one of the administrative regions of Russia’s North-Caucasus Federal district. It is located within the temperate continental belt (44–46° north latitude) northward of the Caucasus mountains between the Black Sea in the west and the Caspian Sea in the east (Figure 1).
In terms of the climate-related variables (see Section 2.1), the territory of Stavropol Krai is divided into eight zones (Appendix A Figure A1). The annual average precipitation varies from ultra-low in the east of the region (below 300 mm) to high in the westernmost territories around Stavropol, the capital city (above 600 mm). The climate is temperate continental. The average air temperature is −5 °C in winter and +23 °C in summer.
Agricultural lands dominate the land fund of the territory (92.62% of the total land acreage), out of which croplands occupy 64.38%. Rangelands (25.90% of agricultural lands) are concentrated along the eastern and northeastern borders of Stavropol Krai, where annual precipitation is low (Appendix A Figure A2). The portions of other land categories in the total land fund are small (perennial plantings—1.67%, hayfields—0.44%, fallows—0.23%). Among non-agricultural categories of lands included in the study (Section 2.2), the shares of residential and industrial lands, publicly protected lands, and other lands in the total land fund are 0.83%, 0.01%, and 1.16%, respectively [107].
Productive black soils and chestnut soils represent the land fund of the territory. Allocation of soils is considered constant when establishing the time series, since fluctuations in the composition of soils have remained negligibly small in comparison with changes in climate, agricultural output, and land use parameters. The humus content, one of the parameters of soil quality employed in the multiplicative climate–output model (Section 2.3), varies from very low (below 2.0%) in eastern territories to high (up to 8.0%) in western territories of Stavropol Krai (Appendix A Figure A3).
Due to a diversity of geographical characteristics, climate, landscape, and spatial features of land allocation, Stavropol Krai serves as a model territory for studying the impacts of climate and land use on agricultural output:
  • Zone 1. East and Northeast: low precipitation (below 350 mm), high air temperature (+25 °C), the predominance of rangelands, very low humus content in soils (below 2.0%);
  • Zone 2. Center and Northwest: medium precipitation (350–500 mm), moderate air temperature (+23–24 °C), the predominance of croplands, low humus content in soils (2.1–4.0%);
  • Zone 3. West and Southwest: high precipitation (above 500 mm), moderate air temperature (+20–23 °C), croplands and rangelands, medium and high humus content in soils (above 4.1%).
The coexistence of the three zones allows for comparing the impacts of diverse parameters of climate, land use patterns, and quality of soils on crop yields in a relatively compact territory (66.16 thousand km2).

2.5. Data

The agricultural sector of Stavropol Krai provides for about 15% of the gross regional product. It specializes in crop production (wheat, sunflower, corn) and horticulture (vineyards, orchards). Being the major crop cultivated across all soil and climatic zones in Central Fore-Caucasus [108], winter wheat is used as a model crop for this study. The crop is produced by all types of agricultural entities, including agricultural enterprises (56.7% of the total crop acreage is under winter wheat) and farm households (61.6%, respectively).
While the application of fertilizers can improve soil productivity and bring higher yields in the short run, climate impacts on output should be monitored in the longer-term retrospective. According to Lobell and Burke [49], statistical models that assess the effects of climate change on agricultural production become more accurate and reliable as both the scale of the data and the scale at which output projections are made become broader. To obtain a relevant picture of climate–output relationships and their changes under the influence of the above addressed land-related factors, we traced the variables back to 1850. The period under study is broken down into four stages in order to, first, ensure the comparability of data across different data acquisition techniques applied in different periods of time and, second, more precisely capture the historical settings of land use patterns and crop production in Central Fore-Caucasus under the Russian Empire (Stage I), then Soviet Union (stages II and III), and then modern Russia (Stage IV) (Table 1).

3. Results

3.1. Climate Impact

Central Fore-Caucasus is located in a temperate continental zone with east–west prevailing winds. The average annual values of air temperature and precipitation are +10.4 °C and 348–394 mm, respectively. Despite some differences in precipitation rates between eastern, central, and western sections of the area, the overall climate pattern is classified as arid. Therefore, the precipitation rate could be defined as the main limiting factor for the development of crop production. To some extent, the adverse impact of scarce precipitation on crop yield has been counter-balanced by the advancement of farming practices.
Contrary to the widespread belief that climate change is associated with a one-way rise in air temperature and rainfall intensity, our results demonstrate the volatility of these two parameters in the long run (Table 2). At stages I and II, air temperature increased from 11.1 °C to 11.3 °C (±0.4 °C on average for a decade), while precipitation rate fell from 415.0 mm to 367 mm (±11.5%, respectively). In 1950–1990, temperatures plummeted by almost 1 °C on average (−0.25 °C per decade) amid the substantial growth of the precipitation rate. Since the 1990s, moderate warming (a negligible +0.03 °C per decade) has been accompanied by a radical rise in rainfall (on average, by 14.3% per decade).
The deviations of the resulting climate impact had been relatively modest before the 1990s. However, since then, the precipitation–temperature ratio has dramatically climbed due to the outstripping growth of the precipitation rate. In general, for the entire period under study, the trend of average annual precipitation for Central Fore-Caucasus amounts to 10.6% per decade.

3.2. Land Use Impact

In the XIX century, the reclamation of agricultural lands across Central Fore-Caucasus and their introduction into economic turnover took place against the background of the evolvement of landlord property, the then-new form of land use [111]. Cossacks and those peasants relatively well endowed with land established the foundation for the development of farms. However, until the 1850s, the share of cultivated lands in the total land fund had remained relatively modest. Because of the employment of underdeveloped farming practices and pervasive cultivation of grain crops (wheat, millet, etc.), farmers had to rotate croplands every 6–10 years and reclaim virgin and fallow lands. By the mid-XIX century, such a gradual extension of cultivated lands had made agriculture the leading branch of economic activity in Central Fore-Caucasus [112]. Extensive plowing of new lands by primitive tools substantially eroded the agricultural potential of the territory [113] and made dry winds and dust storms increasingly frequent [114].
The specifics of the early days of commercial crop production preconditioned winter wheat cultivation with no artificial irrigation (rainfed cropping) in the second half of the XIX century, which further evolved into the dryland farming system at Stage II (Table 3). Back then, the system allowed for obtaining stable yields of winter wheat, protecting soils from erosion, and ensuring relatively high productivity of the agricultural sector in difficult soil and climatic conditions. On the wave of intensification and mechanization of agricultural production after the World War II, the dry land system was replaced by irrigation farming (Stage III). The latter existed until the collapse of the Soviet planned economy in the late 1980s. Market reforms in Russia triggered an outflow of financial resources and labor from lower-margin agriculture to higher-return sectors, and farmers switched back to much less expensive dryland farming (Stage IV).
The land use equations show the structural transformations of the land fund. Under dryland farming at stages I and II, the total area of agricultural land use in Central Fore-Caucasus was dominated by rangelands and hayfields. The transition to irrigation farming in the 1950s allowed for a radical increase in croplands. The further switch to dryland farming in the 1990s has not changed the trend—the share of croplands in the total land fund has been gradually increasing at the price of reducing rangelands and hayfields. Amid the economic downturn, farmers first cut the livestock production, where returns are much longer compared to crop farming.

3.2.1. Stage I

At the turn of the 1860s and 1870s, Central Fore-Caucasus became one of the major Russian centers of fine-wool sheep breeding. There were active reclamation of lands and development of agricultural production [115]. Farmers specialized in cultivating winter and spring wheat, sunflower, potatoes, hemp, flax, grapes, and tobacco. Gradually, the territory blossomed into the largest producer of grain in Russia with an ever-growing gross output of wheat [112]. Despite the substantial increase in gross cropped area, most agricultural lands remained unirrigated. The winter wheat yield increased from 0.3 to 1.0 tons/ha, but the growth of the gross output was achieved by means of the expansion of cultivated area (by 3.5 times in 1896–1913) [116] (Figure 2).
At Stage I, the winter wheat yield depended entirely on climate conditions because farming practices were still primitive, and fertilizers were not applied. Farmers failed to ensure high and relatively stable yields because the composition of agricultural lands was dominated by fallow used for grazing. The portion of clean fallow in the land use was negligible. Crop rotations were unsystematic and irregular [117]. Bondar [112] dates the first evidence of dust storms in Central Fore-Caucasus back to the 1880s, when the plough-disturbance rate of tilled areas reached 20%. Lengthy bouts of drought and strong winds in 1885–1886 triggered soil blowing.

3.2.2. Stage II

By 1913, the area of arable land accounted for 3.499 million ha. The crop production center moved from the forest-steppe zone (black soils in Zone 3) to steppe and semi-desert zones (chestnut soils in Zone 2 and partially Zone 1). The Bolshevik Revolution (1917) and the Civil War (1917–1922) radically transformed land ownership and land use patterns in Russia in the 1920s (abolition of private ownership of land, collectivization, repression against relatively well-performing farmers, persecution of other peasants, etc.). The agricultural sector was drastically damaged. Thus, Krasnov [118] and Ryabov [119] report the increasing desertification of steppe zone lands in 1921 to 1928. As a result of economic and social turbulences in Russia in the late 1910s and the 1920s, the output of all kinds of crops slumped.
On the back of the overall industrialization of the Soviet economy in the 1930s, the area of arable land in Central Fore-Caucasus was substantially expanded. Crop production was intensified with the use of mechanization, chemicalization, and hydrotechnical amelioration. Grass sowing became widespread as one of the lead farming practices [120]. As previously at Stage I, the cultivation of grain crops was carried out with no regular crop rotations. Such an unsystematic approach resulted in a decrease in the humus content in soils. Technical and technological improvements allowed for lifting the average yield of winter wheat to 1.45 tons/ha, but until the 1950s, the year-to-year yields were extremely volatile (Figure 3). The development of agriculture was hindered by the lack of irrigation and watering systems. Despite all advancements, the overall backwardness of farming practices and technologies ramped up the pressure of climatic factors (rising temperature and falling precipitation) and climatic extremes (droughts and dry winds) on wheat output.

3.2.3. Stage III

In the 1950–1960s, the agricultural sector was being restored after World War II. The gross output of grain increased from 7.17 million tons in 1950 to 13.31 million tons in 1960 and then to 14.88 million tons in 1965. Winter wheat yield grew up to 2.97 tons/hectare (Figure 4). The expansion of the land area under crops, along with the intensification of farming (advanced agricultural tools and machinery, new crop varieties, mineral fertilizers, plant protection, etc.) facilitated the increase in the gross output by 2.1 times [121].
Initially, grain crops dominated the gross cropped area. However, by late 1950, the area under grain crops had shrunk down to 51.7% of the total cropland, as previously abandoned clean fallow had been restored. Without keeping a substantial area under clean fallow, it is hard to ensure stable grain yields in dry steppe-kind zones 1 and 2. Because of such a decrease in cropped area, the growth rate of gross output of winter wheat slowed down. In the 1960s, land reclamation measures focused on implementing complex chemicalization, mechanization, specialization of crop production, and upscaling the land use pattern by the consolidation of farms.
By the mid-1980s, crop production costs had risen amid the drop in efficacy of land use, the degradation of soil qualities, poor land management, and overall economic downturn in Russia. Although chemical, irrigation, and drainage measures of land reclamation and protective afforestation were carried out widely, the average yield of grain crops was almost twice lower than the global average. Instead of intensifying the use of high-quality lands of the forest-steppe and steppe zones (Zone 3 and western sections of Zone 2, respectively), where soil characteristics allowed for substantially increasing yields, a significant portion of barren lands were brought into turnover (Zone 1 and eastern sections of Zone 2), including erosion threatening and alkali-saline soils. Thus, the center of crop production shifted to arid areas (central and eastern territories of Stavropol Krai) [122].
The growth in productivity of winter wheat was supported by the nutrient content of arable lands. The latter was affected by the ever-increasing introduction of fertilizers. The role of mineral fertilizers in establishing the nutrient balance increased up to 66% of the total volume of introduced fertilizers in 1976–1980 (compared to 53% in 1971–1975). At the same time, considering the losses and binding of fertilizer nutrients by the soil, crop production triggered substantial environmental problems. Soil blowing penetrated into more humid areas of Zone 2 and Zone 3. In 1969, the intensification of farming resulted in the failure and damage of two million hectares of crops. In 1976, the cases of intensive soil retirement due to wing erosion were registered in the foothill areas. In 1980 and 1984, soil blowing events occurred massively across Central Fore-Caucasus, including in the western, southwestern, and foothill areas (Zone 3) and the central territories (Zone 2).

3.2.4. Stage IV

The significant transformations in agriculture in the 1990s radically changed land use patterns in Russia by introducing private land ownership, establishing a land market and diversifying organizational and legal forms of agricultural entities (agroholdings, agricultural enterprises, peasant farm households, individual farmers, etc.). However, early market-oriented reforms failed to ensure the growth in output and productivity, while the efficacy of using agricultural land and other natural resources declined substantially [117]. In 1990, the last year of the Soviet Union, the winter wheat yield reached 3.61 tons/ha due to the intensive application of mineral fertilizers. It fell to 3.18 tons/ha in just one year (1991) and then declined to 2.60 tons/ha on average in 1992–1999 (Figure 5).
Amid the ongoing market reforms in Russia, some of the transformations in the sphere of land management included the on-farm organization of the territory of agricultural enterprises, the introduction of a differentiated approach to determining the optimal composition of croplands, the systematization of crop rotation schemes, and the development of technologies for the tillage and cultivation of crops, among others. Within two decades (2000–2020), the productivity of winter wheat increased to 3.44 tons/ha on average (around 4.00 tons/ha by the late 2010s).
Nowadays, Russia is self-sufficient in winter wheat (Stavropol Krai being one of the largest producers and suppliers in the domestic market and abroad). The demand for certain crops in the market determines the specialization of farms, portions of particular crops in the total output, and the allocation of cropped areas between crops and lands between categories. Structural bottlenecks, however, do not allow for radical improvement in productivity. Due to the acute lack of financial resources in the 1990s, most farms experienced a drastic reduction in mechanization and application of mineral and organic fertilizers (11.6 and 8.7 times, respectively, compared to the 1980s). Soil fertility has degraded down to the level where it could no longer be maintained naturally [125].

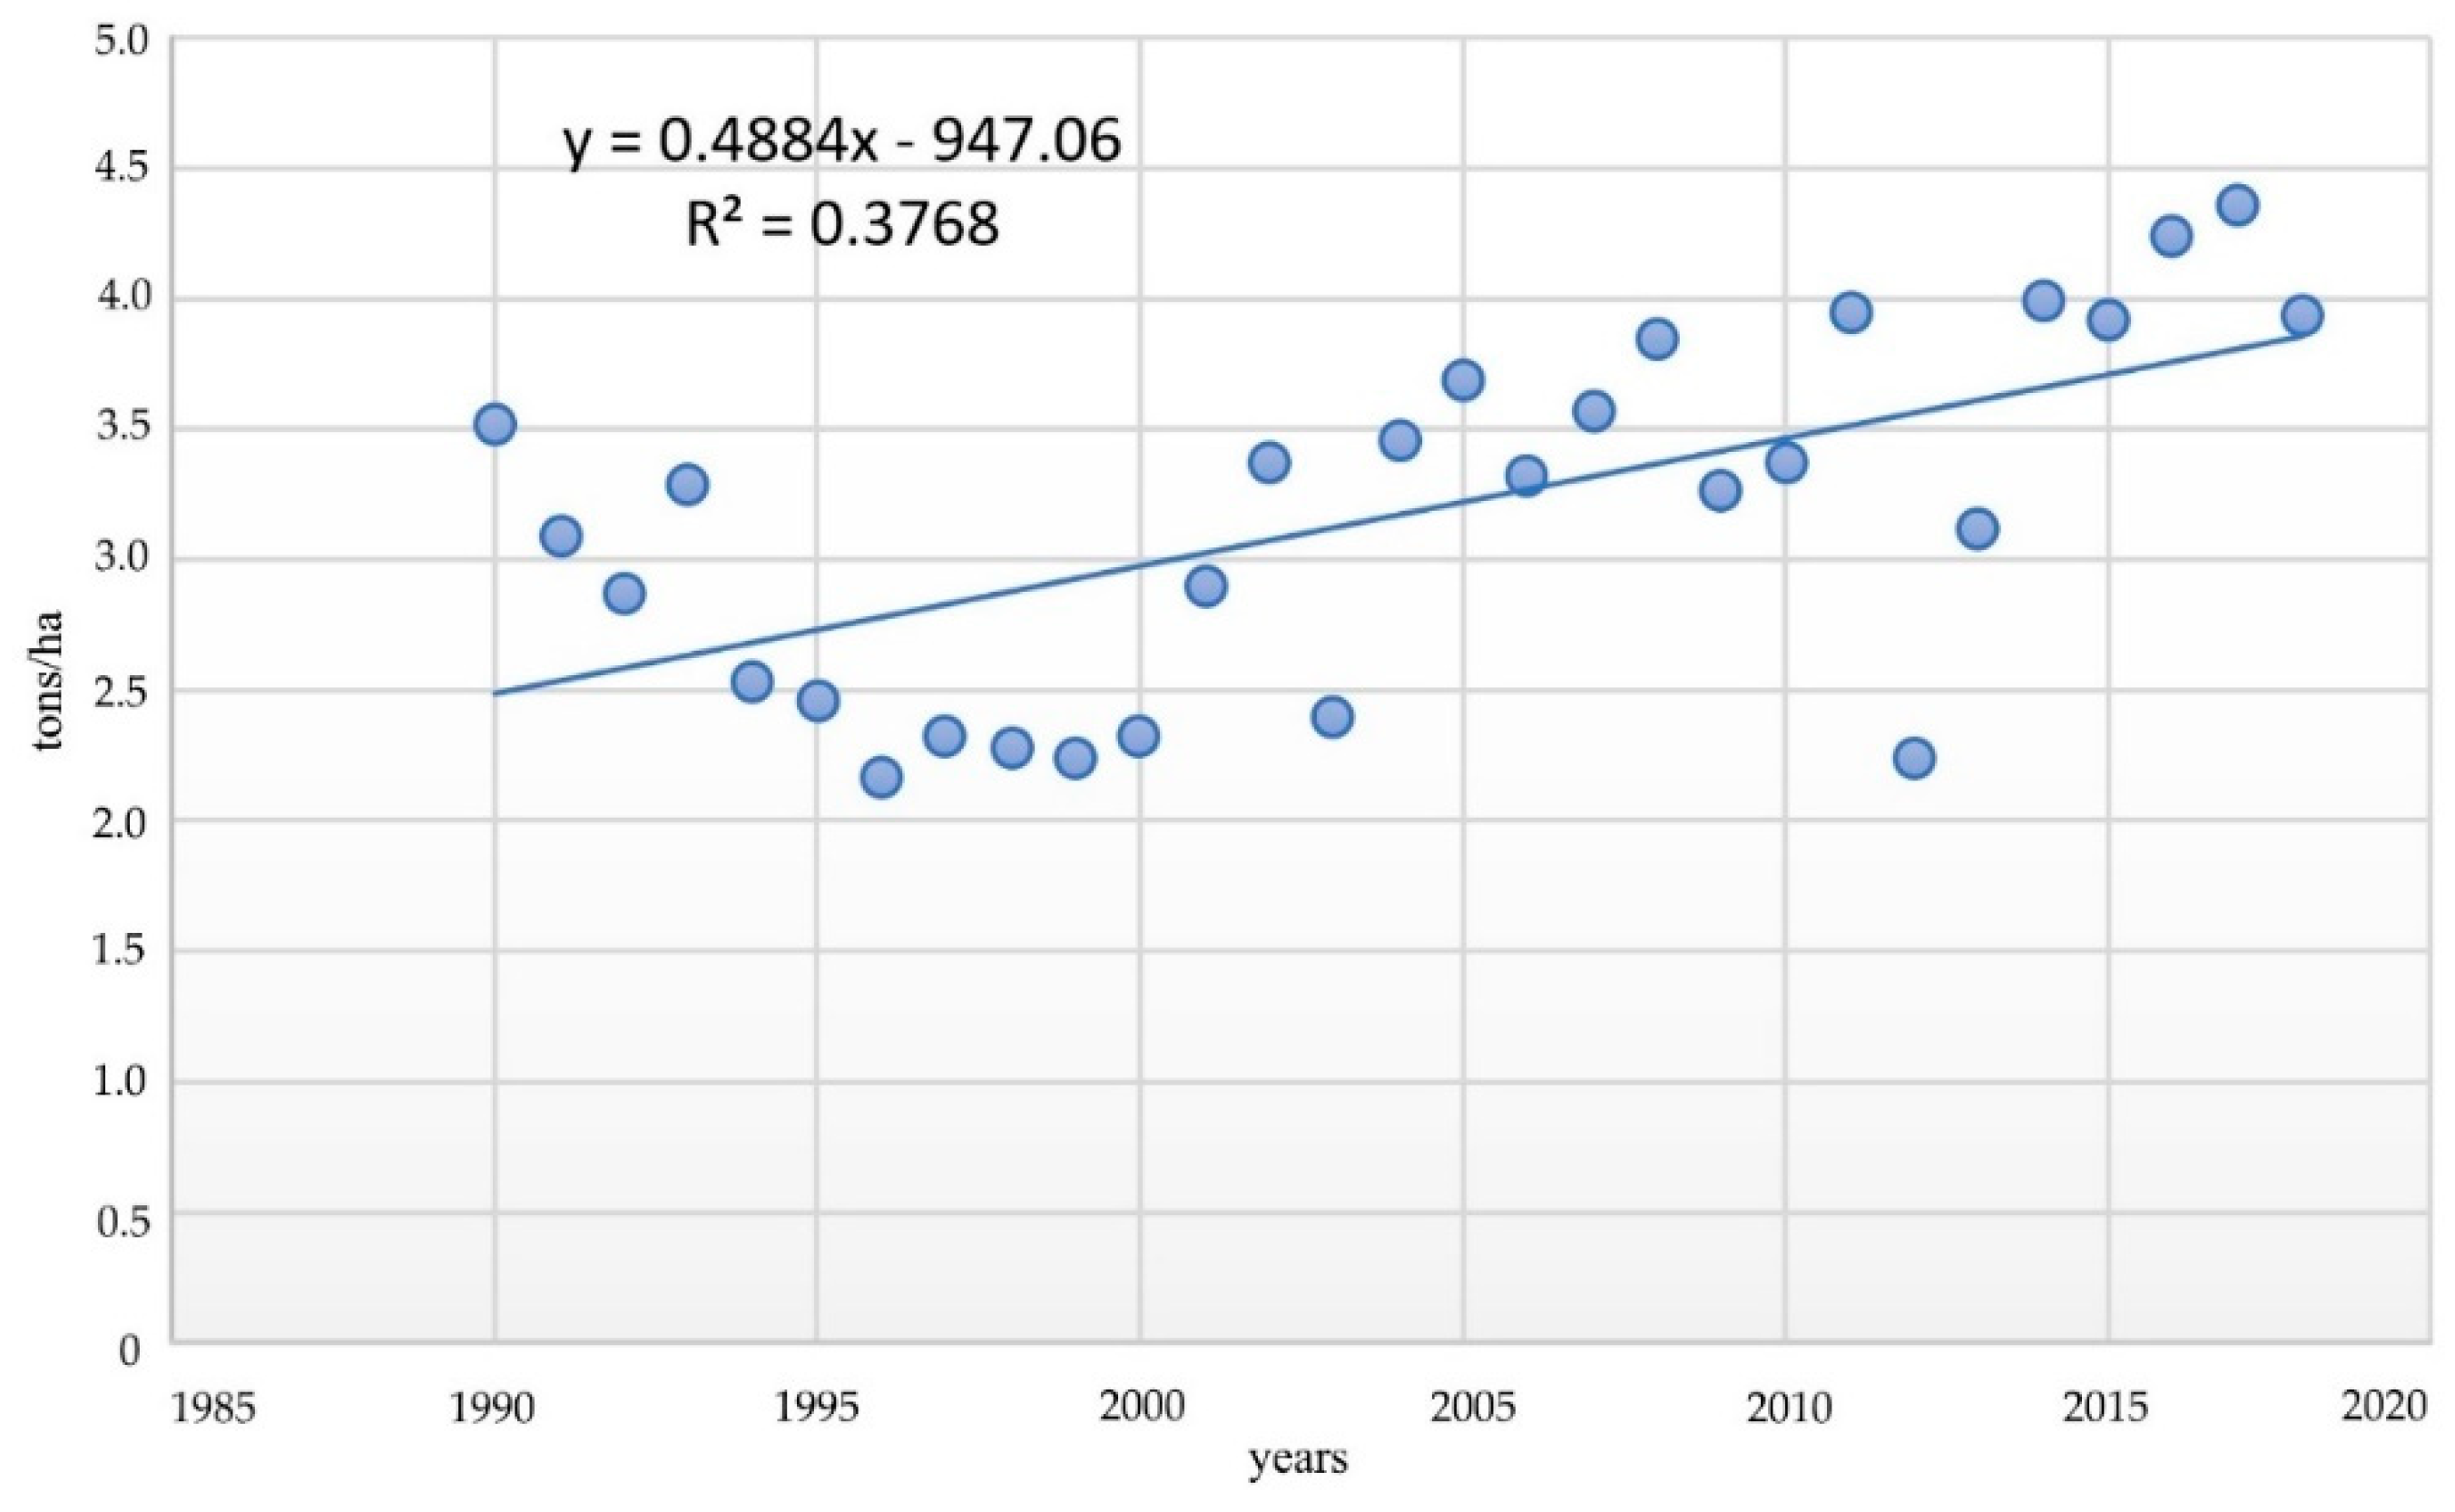
3.3. Climate–Yield Models

Since the 1910s, there has been an increase in both the yield and gross output of winter wheat in Central Fore-Caucasus. The yield growth trend between Stage II and Stage III is 0.21 tons/ha/decade, while at Stage IV, it increases to 0.59 tons/ha/decade. That of the gross output is 481.0 tons/decade and 537.2 tons/decade, respectively. In general, for the entire period under review, the trend of the yield growth is 1.72 tons/ha/decade and gross output—2476.1 tons/decade (Table 4).
The ordinary least square (OLS) method was used to obtain the parameters of linear regression equations. Table 4 shows that the significance of regression coefficients is rather low. This could be due to the fact that the retrospective data used in the study are far from perfect. Such a quality of the empirical data is due to two reasons. First, since the 1850s until present days, geophysical data have been collected irregularly. For instance, data gaps happened in the late 1910s and the early 1920s due to the revolution and civil war in Russia, as well as in the 1940s during the Second World War. In addition, during the 170-years observation period, the network of stationary meteorological points in Stavropol Krai has undergone transformations (stage I—2 stations; stage II—18 stations; stage III—26 stations; stage IV—16 stations). Low regression coefficients require robustness testing. The employment of the Cochrane–Orcutt estimation allowed us to exclude autocorrelation. For all stages, the quality of the econometric model increased, although insignificantly. Thus, the multiple correlation coefficient R for Stage I reached 0.239 versus 0.109 (Appendix A Table A1 and Table A2).
Building the multiplicative climate–output equations (Table 5) shows that a gain in productivity could not be exclusively attributed to the advancement of land use practices, technical progress, or the application of fertilizers. Winter wheat yield has been increasing gradually amid both intensive uses of mineral and organic fertilizers at Stage III and dramatic cut of application of fertilizers and decline in humus content in soils at Stage IV. This trend could be explained by the adaptive organization of land use, which accounted for multiplicative effects of volatile production and climatic conditions, the composition of croplands and other categories of agricultural land, the crop rotation system, and the varieties and hybrids of crops used in agriculture.

4. Discussion

The climate is becoming less predictable—that is the critical challenge crop farmers are facing today [28,30]. Many studies [8,126,127,128] conclude that winter wheat yield worldwide could drop substantially due to climate change vulnerabilities. In Central Fore-Caucasus, the overall force of climate impact on crop productivity is particularly strong in the development period between the World War II and the collapse of the Soviet Union (Stage III) [129]. In times of either social or economic turbulences (Stage II and early years of Stage IV), final impacts essentially depend on complex interactions of climatic factors with non-climatic disturbances (the latter commonly offset the former). The finding that the yield–climate correlation becomes tighter in the absence of external perturbations agrees well with Pismennaya and Stukalo [130] and Korsak et al. [70], who attributed the year-to-year extremes in winter wheat yields in the south of Russia to climatic events, such as droughts and increased wind erosion in the early 1960s (yields dropped down to 0.81 tons/ha in 1964) and more favorable weather conditions in the late 1960s (a rise to 2.09 tons/ha in 1970). Challinor et al. [87] and Rusakova et al. [129] also revealed yield losses to increase in magnitude since the 1950s, when even moderate warming or reduction in precipitation might threaten crop yields in many locations.
The revealed trend makes us join Burnett [4], Challinor et al. [87], and Katsov et al. [1] in expecting more frequent and more dramatic impacts of climatic parameters on crop yields: extreme frosts followed by sudden thaws in winter and longer periods of abnormal heat waves and more intense droughts in summer. According to Brown and Rosenberg [41], wheat yields may increase above baseline in cases where temperature rises concurrently with precipitation, especially in fall and winter. Tao et al. [56] suggested that the negative temperature–yield correlation could mean that current temperatures are beyond the optimal level for crop production. In the territory under study, the overall increase in precipitation from 415 mm at Stage I to 525 mm at Stage IV is unevenly distributed among seasons of the year. The deviation corridor narrows down but still remains large (at Stage IV, 70.7 mm, or 13.47% of the mean value). The parameter of air temperature demonstrates the reverse attitude—mean temperature declines from 11.1 °C at Stage I to 10.5 °C at Stage IV but becomes increasingly variable (±0.6 °C, or 5.71% of the mean value). A particular increase in the length of the growing season of winter crops has occurred over the past decade as autumn has gotten warmer and drier. Less precipitation in autumn hampers sowing, while warmer winters trigger the earlier vegetation of crops. Increasingly often, in late May, plants are seized by droughts due to a decrease in precipitation and a reduction in soil moisture availability. This “higher temperature—sooner maturity—lower yields” effect has been commonly observed worldwide [41,80]. For instance, Tao et al. [56] observed that warming has fundamentally shifted crop phenology and affected crop yields in China in recent decades.
Fluctuations in wheat yields are indeed explained by the spatial averages of air temperatures and precipitation, as argued by Lobell and Field [6], Altieri and Nicholls [84], Slingo et al. [27], and Lin et al. [85]. Still, we aimed to capture other influences, such as the quality characteristics of soils and the allocation of lands between agricultural and non-agricultural categories. Challinor et al. [72] suggested that assessments of climate impacts based on yield alone are prone to overestimation of climate impacts. Therefore, addressing land use change and crop suitability is critical when studying the climate–yield interaction. Betts [28] emphasized changes in physical characteristics of lands, as well as farming practices that may result in the long-term responses of crops to climatic factors. Lesk et al. [80] and Gornall et al. [66] associated decreases in a harvested area with droughts and substantial losses in crop yields—a multiplied action of a combination of climatic and land use influences.
In temperate regions, such a comprehensive approach to adaptation to climate change at the crop and farm levels through putting climate factors in the context of land use practices could bring more promising results compared to lower latitudes [63]. As a long-term strategy to cope with deteriorating climate impacts on crop production in Russia, some scholars [131,132,133] advocate the inter-territory reconfiguration of land use through transferring grain production centers northward to Central Russia. Shaykova et al. [134], Shpanev [135], and Toropova et al. [136] demonstrated that the advancement of technologies and farming practices, along with the use of new varieties and hybrids of crops might allow growing winter crops even in the northern regions of Russia, which were previously considered unsuitable for crop production. The use of climate-resilient crops which perform better at lower inputs in various biotic and abiotic stress-tolerant traits is particularly promising [31]. As witnessed by Qiao et al. [58], a planned crop distribution change within determined transitional zones could exert a significant impact on wheat productivity in the long run. On the contrary, Lobell and Burke [49], Sthapit et al. [137], and Rippke et al. [95] assumed farmers to be able to respond automatically to climate impacts without changing locations by adapting the varieties they grow to local conditions and adjusting the use of territory-specific farming techniques. The comprehensive survey of farmers made by Olesen et al. [65] across European countries evidenced the growing occurrence of changing the timing of cultivation and substituting crop species and cultivars. Altieri and Nicholls [84], Reidsma et al. [63], and Lin et al. [85] argued that the diversification of plant communities with due account to both environmental perturbations and lands available in the particular territory could make farmers more resilient to climate impacts.
However, the extent to which crop producers could really adapt to long-term climate trends is uncertain [138]. In planning their adaptation strategy, farmers should both correctly interpret the impacts of past climate change and assess future trends [139,140]. Although Schlenker and Roberts [141] estimated the impact of such on-farm adaptations on yields of maize and soybean to be modest, we see that in the case of winter wheat, yields demonstrate high responsiveness to changes in land use patterns within a relatively compact territory of Central Fore-Caucasus. This agrees well with temporal variations in crop acreage elasticities due to climate change that Cui [57] revealed in the USA. There, climate-driven crop substitutions explain over one-third of the observed expansions of lands under crops since the 1990s. Although diverse climatic and soil quality conditions allow for capturing the variety of impacts across three zones, larger-scale estimates of the effect of land use on wheat yield could capture more diverse climatic data. Thus, they potentially tend to be more accurate than the individual district models [142].
When discussing the crop relocation strategy as a response to climate change, particular importance should be attached to non-climatic factors, such as qualitative parameters of soils, crop production and management practices, cultivation of land, etc. Wiebe et al. [126], Rudel et al. [143], Neumann et al. [144], and Hertel [106] found that yields varied with changes in many non-climatic impacts, agricultural intensification being the most decisive of them. Qiao et al. [58] demonstrated that crop distribution for wheat has experienced radical changes since the 1980s due to the ecological-engineering-related advancements in agriculture. Reidsma et al. [63] even advocated greater influence of changes in technology and agricultural policy on farms than climatic and environmental factors. For several territories in Southern Russia, neighboring Stavropol Krai, Licker et al. [145] and Savchenko et al. [146] downplayed the importance of climatic factors in transforming the winter wheat yield trends. Pismennaya et al. [147], Loshakov [107], and Savin et al. [148] attributed crop productivity gains in western and central areas of Stavropol Krai (Zone 3 and western section of Zone 1) to the improvement of farming technologies, the growth in the adaptive potential of cultivated varieties of crops, and the increase in the introduction of fertilizers. As evidenced by Altieri and Nicholls [84] and Liu et al. [149], applying sufficient amounts of organic matter into soils is critical when confronting adverse climatic impacts on wheat yield. It is notorious that in the short run, fertilizer application boosts yield [150,151,152]. Still, over a long-term horizon, we see a correlation between the volume of introduced mineral and organic fertilizers and the depletion of humus content in soils (from 40.2% at Stage III to only 10.8% at Stage IV).
Since our findings show that the change in soil qualities itself brings a minor marginal contribution in boosting crop productivity, the reconfiguration strategy should incorporate multiple parameters of soils, climate, and the environment. Cronin et al. [153] and Pavlova et al. [154,155] expect that climate change would reduce suitable areas for the cultivation of winter wheat in southern regions of Russia. However, grasslands and rangelands may still be moderately suitable for cultivation in the future. With the advent of farming technologies, new croplands can be reclaimed from rangelands in Zone 1 and lower-productive croplands in Zone 2. Considering that the humus content in soils in these zones is lower than that in the western areas of Central Fore-Caucasus, we selected eight “islands” within generally unfavorable climatic zones in which a combination of soil types, precipitation, air temperature, and the erodibility of lands could potentially allow farmers to expand the acreage under winter wheat (Table 6).
As demonstrated by Burnett [4] and Chen et al. [127], in contemporary crop production, the increases or decreases in cropped acreage have become less important than the productivity gains. Thus, since less land would be needed to produce the same amount of output, we may assume that the intra-territory reconfiguration of cropped areas could help support yields and sustain gross output. The employment of land plots in less favorable climatic conditions, but potentially suitable for crop production due to the combination of soil and natural characteristics, will ensure wider land-use flexibility. The retrospective approach revealed significant differences in the dynamics of the qualitative characteristics of agricultural lands between the zones. Intensively cultivated lands in Zone 3 and the western section of Zone 2 have been degrading much faster compared to the lands in the east of Stavropol Krai. With climatic events turning into more volatile extremes, cultivated lands in Zone 3 are becoming more susceptible to erosion by both wind and water. Transferring part of the acreage to the eight allocated sites where soil erodibility is lower will improve the variability of land distribution under winter crops across the region. In its turn, this will reduce the load on most productive lands in Zone 3. Farmers in the west will be able to get back on track and carry out land management and land reclamation measures, vary crop rotations, allocate land fallow, etc., on a regular basis. The expected yield provided by lands in zones 1 and 2 would offset the loss resulting from the reduction of rangelands, resulting in a net increase in the total output of winter wheat. Thus, a partial relocation of crop production to the east of Central Fore-Caucasus could improve the overall sustainability of land use in the region against the background of growing instability of climatic impacts.

5. Conclusions

To summarize the findings, we highlight the practical-related implications of the approach to studying climate impacts on winter wheat productivity along with the authors’ vision of the theoretical implications of the multiplicative climate–yield model.
Concerning the practical dimension, in the case of one of the major grain-producing regions in Russia, the study demonstrated how the territory-specific features of the climate–land–yield triangle have evolved since the 1850s. We found a direct correlation between the winter wheat yield and climatic variables. However, the tightness of dependence of crop yield on the temperature/precipitation ratio fluctuates. At Stage III, the linkage is strongest, while in other periods, the effects of economic and social turbulences (Stage II) and land use reforms (Stage IV) outweigh the pure impact of climatic factors on yield. In the long-term retrospective, we see a rising pressure of climate change on the winter wheat sector. A relocation of areas under crops was suggested as a climate change response. It could be adopted in territories where the diversity of types of soils and landscapes allows for drawing idle lands, rangelands, hayfields, or perennial grasses into the systematic cultivation of crops. The approach to selecting alternative sites for crop production is based on the matching of such parameters as soil types, precipitation, air temperature, and erodibility of lands. It can be used by local authorities and farmers’ associations as a decision support tool when developing climate change adaptation and mitigation strategies.
Concerning the theoretical dimension, the study elaborated the approach to revealing interdependences between crop productivity, climate change, and quality characteristics of soils in the long run. We tested the assumption that variations in average yields could be mainly explained by spatial averages of air temperatures and precipitation based on the locations of crops (supposed by Lobell and Field [6], Raza et al. [83], Lin et al. [85], and Slingo et al. [27], among others). Our findings confirmed that the long-term weighted averages of both temperature and precipitation importantly account for the spatial distribution of winter wheat crops. However, as we specifically aimed to explore the interdependence between crop productivity, climate change, and quality characteristics of soils, we also found winter wheat yields to be elastic to changes in land use patterns.
This finding assumes that there could be other essential side influences missing in the analysis. These are likely to include effects of genetic and agronomical progress, agricultural technologies and machinery, and changes in economic conditions that affect crop production. The limitation the study faced is intrinsic to large arrays that trace statistics far back in the past. It is difficult to ensure the comparability of data obtained in different periods and account thoroughly for diverse effects of technology, as well as economic and social fluctuations occurring over 170 years of observations. If a reliable and full set of data is available for all four stages, the side effects may have disturbed the trend analysis. For instance, we may assume strong effects of genetic and agronomical progress or mechanization of the agricultural sector that cause increases in crop yields. Consideration of these variables would likely improve the results, but the model still omits these variables. Regular agronomical reports were introduced in Stavropol Krai in the 1950s, while the environmental monitoring system was launched in the 1960s. Agricultural mechanization radically improved the performance of crop farms, but the first tractors and machines appeared in the Russian South in the 1930s. Other parameters deserving further development in the territory-specific climate–land–yield models include the differences in the agricultural land supply and the varieties of crops cultivated in different locations, the sensitivity of climate change impacts to differences in social and economic conditions, the volume and intensity of emissions, the effects of non-grain production (for example, biomass) on land use, and the pests and diseases prevailing in certain areas.
Nevertheless, the established full four-stage dataset of climatic variables (temperature and precipitation) and land-related variables (humus content, mineral fertilizers, and organic fertilizers) captured major historical processes and depicted the evolution of links between yields, climate, and land use. The projections made in this study assume that farmers can automatically adapt crop varieties they grow and land use practices they employ to different types of soils and new climate conditions. This assumption should be further tested in future studies across different types of land management systems and farming conditions. For instance, a northward shift of crop production centers might be instrumental in land-scarce territories with homogeneous soils. In Russia, winter wheat acreage may be expanded in the central and northwest parts of the country or Siberia, where the climate is becoming milder due to climate change.

Author Contributions

Conceptualization, A.E., E.P. and V.E.; methodology, A.E. and E.P.; formal analysis, A.E., E.P. and A.I.; investigation, A.E., E.P., E.G., O.V. and A.I.; data curation, A.E., E.P., E.G., O.V. and A.I.; writing—original draft preparation, A.E., E.P. and V.E.; writing—review and editing, V.E.; visualization, V.E., A.E. and E.P.; supervision, A.E. and E.P. All authors have read and agreed to the published version of the manuscript.

Funding

This research received no external funding.

Institutional Review Board Statement

Not applicable.

Informed Consent Statement

Not applicable.

Data Availability Statement

The data presented in this study are available on request from the corresponding author.

Conflicts of Interest

The authors declare no conflict of interest.

Appendix A

Figure A1. Stavropol Krai: Climate parameters. Source: authors’ development.
Land 10 01339 g0a1
Figure A2. Stavropol Krai: Allocation of agricultural lands. Source: authors’ development.
Land 10 01339 g0a2
Figure A3. Stavropol Krai: Humus content in soils. Note: very low = below 2.0%; low = 2.1–4.0%; medium = 4.1–6.0%; high = 6.1–8.0%. Source: authors’ development.
Land 10 01339 g0a3
Figure A4. Relocation of sites for production winter wheat in Central Fore-Caucasus. Note: 1–8 = potential sites (see Table 6 for details). Source: authors’ development.
Land 10 01339 g0a4
Table A1. Cochrane–Orcutt estimation results.
StageAutocorrelation Parameter pStandard
Error
Multiple
Correlation
Coefficient R
R-Squared
Coefficient
Adjusted
R-Squared
Coefficient
Root Mean Standard
Error
Durbin–
Watson
Statistic
I0.2710.1850.2390.057−0.0512.1131.582
II0.3520.1630.0460.002−0.0913.2091.973
III0.2760.1600.2550.065−0.0155.5081.791
IV0.6010.1600.1380.019−0.1045.6692.137
Source: authors’ development.
Table A2. Cochrane–Orcutt estimation results: Regression coefficients.
StageVariable/
Parameter
Non-Standardized Coefficient Standard
Error
Standardized
Coefficient
TValue
IXT−0.3680.431−0.553−0.8540.401
XR0.0130.0120.7041.0870.287
Constant6.4490.535 12.0450.000
IIXT−0.0030.138−0.005−0.0200.984
XR−0.0010.005−0.043−0.1840.855
Constant7.6980.890 8.6450.000
IIIXT0.3070.2990.1921.0260.312
XR−0.0100.006−0.285−1.5240.136
Constant17.1971.420 12.1100.000
IVXT−1.3562.284−0.121−0.5930.558
XR0.0340.1390.0500.2440.809
Constant28.44280.105 0.3550.726
Note: X T = air temperature; X R = precipitation. Source: authors’ development.

References

  1. Katsov, V.M.; Kobysheva, N.V.; Meleshko, V.P.; Porfiriev, B.N.; Revich, B.A.; Sirotenko, O.D.; Stadnik, V.V.; Khlebnikova, E.I.; Chicherin, S.S.; Shalygin, A.L. Assessment of Macroeconomic Consequences of Climate Change in the Russian Federation until 2030 and Further Perspective; D’ART: Moscow, Russia, 2011. [Google Scholar]
  2. Porfiriev, B. Nature and Economics: Risks of Interaction; Ankil: Moscow, Russia, 2011. [Google Scholar]
  3. Food and Agriculture Organization of the United Nations; International Fund for Agricultural Development; United Nations Children’s Fund; World Food Programme; World Health Organization. The State of Food Security and Nutrition in the World 2020. Transforming Food Systems for Affordable Healthy Diets; FAO: Rome, Italy, 2020. [Google Scholar] [CrossRef]
  4. Burnett, B. Climate Change Impacts on Crop Selection and Rotation in 2050. Available online: https://umanitoba.ca/faculties/afs/ncle/pdf/Ag2050_Essay_Burnett.pdf (accessed on 27 September 2021).
  5. International Food Policy Research Institute. 2019 Global Food Policy Report; International Food Policy Research Institute: Washington, DC, USA, 2019. [Google Scholar] [CrossRef]
  6. Lobell, D.; Field, C. Global scale climate-crop yield relationships and the impacts of recent warming. Environ. Res. Lett. 2007, 2, 014002. [Google Scholar] [CrossRef]
  7. Schellnhuber, H.J.; Rahmstorf, S.; Winkelmann, R. Why the right climate target was agreed in Paris. Nat. Clim. Chang. 2016, 6, 649–653. [Google Scholar] [CrossRef]
  8. Glantz, M.; Gommes, R.; Ramasamy, S. Coping with a Changing Climate: Considerations for Adaptation and Mitigation in Agriculture; FAO: Rome, Italy, 2009. [Google Scholar]
  9. Edenhofer, O.; Pichs-Madruga, R.; Sokona, Y.; Farahani, E.; Kadner, S.; Seyboth, K.; Adler, A.; Baum, I.; Brunner, S.; Eickemeier, P.; et al. Climate Change 2014: Mitigation of Climate Change: Working Group III Contribution to the IPCC Fifth Assessment Report; Cambridge University Press: Cambridge, UK, 2014. [Google Scholar]
  10. Rosengrant, M.; Wiebe, K.; Sulser, T.; Mason-D’Croz, D.; Willenbockel, D. Climate change and agricultural development. In Agricultural Development: New Perspectives in a Changing World; Otsuka, K., Fan, S., Eds.; International Food Policy Research Institute: Washington, DC, USA, 2021; pp. 629–660. [Google Scholar] [CrossRef]
  11. Jaeger, C.C.; Jaeger, J. Three views of two degrees. Reg. Environ. Chang. 2011, 11, 15–26. [Google Scholar] [CrossRef] [Green Version]
  12. Kimball, B. Carbon dioxide and agricultural yield: An assemblage and analysis of 430 prior observations. Agron. J. 1983, 75, 779–788. [Google Scholar] [CrossRef]
  13. Allen, L. Plant responses to rising carbon dioxide and potential interactions with air pollutants. J. Environ. Qual. 1990, 19, 15–34. [Google Scholar] [CrossRef]
  14. Keeling, C.D.; Whorf, T.P.; Wahlen, M.; van der Plichtt, J. Interannual extremes in the rate of rise of atmospheric carbon dioxide since 1980. Nature 1995, 375, 660–670. [Google Scholar] [CrossRef]
  15. Tubiello, F.; Ewert, F. Simulating the effects of elevated CO2 on crops: Approaches and applications for climate change. Eur. J. Agron. 2002, 18, 57–74. [Google Scholar] [CrossRef]
  16. Lal, R. Climate change and soil degradation mitigation by sustainable management of soils and other natural resources. Agric. Res. 2012, 1, 199–212. [Google Scholar] [CrossRef] [Green Version]
  17. Steffen, W.; Persson, Å.; Deutsch, L.; Zalasiewicz, J.; Williams, M.; Richardson, K.; Crumley, C.; Crutzen, P.; Folke, C.; Gordon, L.; et al. The anthropocene: From global change to planetary stewardship. AMBIO 2011, 40, 739. [Google Scholar] [CrossRef] [Green Version]
  18. Hamidov, A.; Helming, K.; Bellocchi, G.; Bojar, W.; Dalgaard, T.; Ghaley, B.B.; Hoffmann, C.; Holman, I.; Holzkämper, A.; Krzeminska, D.; et al. Impacts of climate change adaptation options on soil functions: A review of European case-studies. Land Degrad. Dev. 2018, 29, 2378–2389. [Google Scholar] [CrossRef]
  19. Lal, R.; Delgado, J.A.; Groffman, P.M.; Millar, N.; Dell, C.; Rotz, A. Management to mitigate and adapt to climate change. J. Soil Water Conserv. 2011, 66, 276–285. [Google Scholar] [CrossRef] [Green Version]
  20. Xiong, X.; Grunwald, S.; Myers, D.B.; Ross, C.W.; Harris, W.G.; Comerford, N.B. Interaction effects of climate and land use/land cover change on soil organic carbon sequestration. Sci. Total Environ. 2014, 493, 974–982. [Google Scholar] [CrossRef]
  21. Robinson, S.; Mason-D’Croz, D.; Islam, S.; Sulser, T.; Robertson, R.; Zhu, T.; Gueneau, A.; Pitois, G.; Rosengrant, M. The International Model for Policy Analysis of Agricultural Commodities and Trade (IMPACT); International Food Policy Research Institute: Washington, DC, USA, 2015. [Google Scholar]
  22. Robertson, R. Mink: Details of a Global Gridded Crop. Modeling System; International Food Policy Research Institute: Washington, DC, USA, 2017. [Google Scholar]
  23. Jones, J.W.; Hoogenboom, G.; Porter, C.H.; Boote, K.J.; Batchelor, W.D.; Hunt, L.A.; Wilkens, P.W.; Singh, U.; Gijsman, A.J.; Ritchie, J.T. DSSAT cropping system model. Eur. J. Agron. 2003, 18, 235–265. [Google Scholar] [CrossRef]
  24. Rosenzweig, C.; Jones, J.W.; Hatfield, J.L.; Ruane, A.C.; Boote, A.C.; Thorburn, P.; Antle, J.M.; Nelson, G.C.; Porter, C.; Janssen, S.; et al. The agricultural model intercomparison and improvement project (AgMIP): Protocols and pilot studies. Agric. For. Meteorol. 2013, 170, 166–182. [Google Scholar] [CrossRef] [Green Version]
  25. Rosenzweig, C.; Ruane, A.; Antle, J.; Elliott, J.; Ashfaq, M.; Chatta, A.A.; Ewert, F.; Folberth, C.; Hathie, I.; Havlik, P.; et al. Coordinating AgMIP data and models across global and regional scales for 1.5 °C and 2.0 °C assessments. Philos. Trans. R. Soc. A Math. Phys. Eng. Sci. 2018, 376, 20160455. [Google Scholar] [CrossRef]
  26. Moss, R.; Edmonds, J.; Hibbard, K.; Manning, M.; Rose, S.; van Vuuren, D.; Carter, T.; Emori, S.; Kainuma, M.; Kram, T.; et al. The next generation of scenarios for climate change research and assessment. Nature 2010, 463, 747–756. [Google Scholar] [CrossRef]
  27. Slingo, J.M.; Challinor, A.J.; Hoskins, B.J.; Wheeler, T.R. Introduction: Food crops in a changing climate. Philos. Trans. R. Soc. B Biol. Sci. 2005, 360, 1983–1989. [Google Scholar] [CrossRef] [Green Version]
  28. Betts, R. Integrated approaches to climate-crop modelling: Needs and challenges. Philos. Trans. R. Soc. B Biol. Sci. 2005, 360, 2049–2065. [Google Scholar] [CrossRef] [Green Version]
  29. Challinor, A.; Wheeler, T.; Garforth, C.; Craufurd, P.; Kassam, A. Assessing the vulnerability of food crop systems in Africa to climate change. Clim. Chang. 2007, 83, 381–399. [Google Scholar] [CrossRef]
  30. Singh, A.; Church, S.; Dang, L.; Hennes, E.; Prokopy, L. Does climate change framing matter? Evidence from an experiment of crop advisors in the Midwestern United States. Clim. Chang. 2020, 162, 1031–1044. [Google Scholar] [CrossRef]
  31. Chadalavada, K.; Kumari, B.D.R.; Kumar, T.S. Sorghum mitigates climate variability and change on crop yield and quality. Planta 2021, 253, 113. [Google Scholar] [CrossRef]
  32. Richardson, K.; Steffen, W.; Liverman, D. Climate Change: Global Risks, Challenges and Decisions; Cambridge University Press: Cambridge, UK, 2011. [Google Scholar]
  33. Tchijevsky, A. Physical factors of the historical process. Cycles 1971, 22, 11–27. [Google Scholar]
  34. Chaplitskaya, A.; Heijman, W.; Ophem, J.v.; Kusakina, O. Innovation policy and sustainable regional development in agriculture: A case study of the Stavropol territory, Russia. Sustainability 2021, 13, 3509. [Google Scholar] [CrossRef]
  35. Islas-Vargas, M. Adaptation to climate change: Definition, subjects and disputes. Let. Verdes Rev. Latinoam. Estud. Socioambientales 2020, 28, 9–30. [Google Scholar] [CrossRef]
  36. Moriondo, M.; Bindi, M.; Brilli, L.; Costafreda-Aumedes, S.; Dibari, C.; Leolini, L.; Padovan, G.; Trombi, G.; Karali, A.; Varotsos, K.V.; et al. Assessing climate change impacts on crops by adopting a set of crop performance indicators. Euro Mediterr. J. Environ. Integr. 2021, 6, 1–18. [Google Scholar] [CrossRef]
  37. Sarfaraz, S.; Shoukat, S.S.; Khan, T.M.A. Investigating wheat yield and climate parameters regression model based on Akaike information criteria. Pak. J. Bot. 2021, 53, 1299–1306. [Google Scholar] [CrossRef]
  38. Plastina, A.; Lence, S.H.; Ortiz-Bobea, A. How weather affects the decomposition of total factor productivity in U.S. agriculture. Agric. Econ. 2021, 52, 215–234. [Google Scholar] [CrossRef]
  39. Black, J.R.; Thompson, S.R. Some evidence on weather-crop-yield interaction. Am. J. Agric. Econ. 1978, 60, 540–543. [Google Scholar] [CrossRef]
  40. Adams, R.M.; Flemming, R.A.; Chang, C.C.; McCarl, B.; Rosenzweig, C. A Reassessment of the economic effects of global climate change on U.S. agriculture. Clim. Chang. 1995, 30, 147–167. [Google Scholar] [CrossRef]
  41. Brown, R.A.; Rosenberg, N.J. Climate change impacts on the potential productivity of corn and winter wheat in their primary United States growing regions. Clim. Chang. 1999, 41, 73–107. [Google Scholar] [CrossRef]
  42. Mearns, L.O.; Easterling, W.; Hays, C.; Marx, D. Comparison of agricultural impacts of climate change calculated from high and low resolution climate change scenarios: Part I. The uncertainty due to spatial scale. Clim. Chang. 2001, 51, 131–172. [Google Scholar] [CrossRef]
  43. Stockle, C.O.; Donatelli, M.; Nelson, R. CropSyst, a cropping systems simulation model. Eur. J. Agron. 2003, 18, 289–307. [Google Scholar] [CrossRef]
  44. Brisson, N.; Gary, C.; Justes, E.; Roche, R.; Mary, B.; Ripoche, D.; Zimmer, D.; Sierra, J.; Bertuzzi, P.; Burger, P.; et al. An overview of the crop model STICS. Eur. J. Agron. 2003, 18, 309–332. [Google Scholar] [CrossRef]
  45. Keating, B.A.; Carberry, P.S.; Hammer, G.L.; Probet, M.E.; Robertson, M.J.; Holzworth, D.; Huth, N.I.; Hargreaves, J.N.G.; Meinke, H.; Hochman, Z.; et al. An overview of APSIM, a model designed for farming systems simulation. Eur. J. Agron. 2003, 18, 267–288. [Google Scholar] [CrossRef] [Green Version]
  46. Challinor, A.J.; Wheeler, T.R.; Craufurd, P.Q.; Slingo, J.M.; Grimes, D.I.F. Design and optimization of a large-area process-based model for annual crops. Agric. For. Meteorol. 2004, 124, 99–120. [Google Scholar] [CrossRef]
  47. Rosenzweig, C.; Elliott, J.; Deryng, D.; Ruane, A.C.; Müller, C.; Arneth, A.; Boote, K.J.; Folberth, C.; Glotter, M.; Khabarov, N. Assessing agricultural risks of climate change in the 21st century in a global gridded crop model intercomparison. Pro. Natl. Acad. Sci. USA 2014, 111, 3268–3273. [Google Scholar] [CrossRef] [Green Version]
  48. Schlenker, W.; Hanemann, W.M.; Fisher, A.C. The impact of global warming on U.S. agriculture: An econometric analysis of optimal growing conditions. Rev. Econ. Stat. 2006, 88, 113–125. [Google Scholar] [CrossRef]
  49. Lobell, D.B.; Burke, M.B. On the use of statistical models to predict crop yield responses to climate change. Agric. For. Meteorol. 2010, 150, 1443–1452. [Google Scholar] [CrossRef]
  50. Lenton, T.; Held, H.; Kriegler, E.; Hall, J.; Lucht, W.; Rahmstorf, S.; Schellnhuber, H.J. Tipping elements in the Earth’s climate system. Pro. Natl. Acad. Sci. USA 2008, 105, 1786–1793. [Google Scholar] [CrossRef] [Green Version]
  51. Lockwood, J.G. Abrupt and sudden climatic transitions and fluctuations: A review. Int. J. Climatol. 2001, 21, 1153–1179. [Google Scholar] [CrossRef]
  52. Rial, J.A.; Pielke, R.A.; Beniston, M.; Claussen, M.; Canadell, J.; Cox, P.; Held, H.; de Noblet-Ducoudre, N.; Prinn, R.; Reynolds, J.; et al. Nonlinearities, feedbacks and critical thresholds within the Earth’s climate system. Clim. Chang. 2004, 65, 11–38. [Google Scholar] [CrossRef] [Green Version]
  53. Tao, F.; Yokozawa, M.; Zhang, Z.; Hayashi, Y.; Grassl, H.; Fu, C. Climatological and agricultural production variability in China in association with East Asia Monsoon and El Niño Southern Oscillation. Clim. Res. 2004, 28, 23–30. [Google Scholar] [CrossRef] [Green Version]
  54. Easterling, W.E.; Chen, X.; Hays, C.; Brandle, J.R.; Zhang, H. Improving the validation of model-simulated crop yield response to climate change: An application to the EPIC model. Clim. Res. 1996, 6, 263–273. [Google Scholar] [CrossRef]
  55. Ju, H.; Lin, E.; Wheeler, T.; Challinor, A.; Jiang, S. Climate change modelling and its roles to Chinese crops yield. J. Integr. Agric. 2013, 12, 892–902. [Google Scholar] [CrossRef]
  56. Tao, F.; Yokozawa, M.; Xu, Y.; Hayashi, Y.; Zhang, Z. Climate changes and trends in phenology and yields of field crops in China, 1981–2000. Agric. For. Meteorol. 2006, 138, 82–92. [Google Scholar] [CrossRef]
  57. Cui, X. Climate change and adaptation in agriculture: Evidence from US cropping patterns. J. Environ. Econ. Manag. 2020, 101, 102306. [Google Scholar] [CrossRef]
  58. Qiao, J.; Yu, D.; Wang, Q.; Liu, Y. Diverse effects of crop distribution and climate change on crop production in the agro-pastoral transitional zone of China. Front. Earth Sci. 2018, 12, 408–419. [Google Scholar] [CrossRef]
  59. Skrypnyk, A.; Zhemoyda, O.; Klymenko, N.; Galaieva, L.; Koval, T. Econometric analysis of the impact of climate change on the sustainability of agricultural production in Ukraine. J. Ecol. Eng. 2021, 22, 275–288. [Google Scholar] [CrossRef]
  60. Zougmoré, R.B.; Läderach, P.; Campbell, B.M. Transforming food systems in Africa under climate change pressure: Role of climate-smart agriculture. Sustainability 2021, 13, 4305. [Google Scholar] [CrossRef]
  61. Zhang, J.; Mishra, A.K.; Hirsch, S. Market-oriented agriculture and farm performance: Evidence from rural China. Food Policy 2021, 100, 102023. [Google Scholar] [CrossRef]
  62. Mitroshkin, K.; Pavlovsky, S. Forest and Field; Kolos: Moscow, Russia, 1979. [Google Scholar]
  63. Reidsma, P.; Wolf, J.; Kanellopoulos, A.; Schaap, B.; Mandryk, M.; Verhagen, J.; van Ittersum, M. Climate change impact and adaptation research requires integrated assessment and farming systems analysis: A case study in the Netherlands. Environ. Res. Lett. 2015, 10, 045004. [Google Scholar] [CrossRef]
  64. Dronin, N.; Kirilenko, A. Climate change, food stress, and security in Russia. Reg. Environ. Chang. 2011, 11, 167–178. [Google Scholar] [CrossRef]
  65. Olesen, J.E.; Trnka, M.; Kersebaum, C.-K.; Skjelvag, A.O.; Seguin, B.; Peltonen-Sainio, P.; Rossi, F.; Kozyra, J.; Micale, F. Impacts and adaptation of European crop production systems to climate change. Eur. J. Agron. 2011, 34, 96–112. [Google Scholar] [CrossRef]
  66. Gornall, J.; Betts, R.; Burke, E.; Clark, R.; Camp, J.; Willett, K.; Wiltshire, A. Implications of climate change for agricultural productivity in the early twenty-first century. Philos. Trans. R. Soc. B Biol. Sci. 2010, 365, 2973–2989. [Google Scholar] [CrossRef] [PubMed]
  67. Rötter, R.; Höhn, J.; Fronzek, S. Projections of climate change impacts on crop production: A global and a Nordic perspective. Acta Agric. Scand. Sect. A Anim. Sci. 2012, 62, 166–180. [Google Scholar] [CrossRef]
  68. Alcamo, J.; Dronin, N.; Endejan, M.; Golubev, G.; Kirilenko, A. A new assessment of climate change impacts on food production shortfalls and water availability in Russia. Glob. Environ. Chang. 2007, 17, 429–444. [Google Scholar] [CrossRef]
  69. Smith, P.; Smith, J.; Franko, U.; Kuka, K.; Romanenkov, V.; Shevtsova, L.; Wattenbach, M.; Gottschalk, P.; Sirotenko, O.; Rukhovich, D.; et al. Changes in mineral soil organic carbon stocks in the croplands of European Russia and the Ukraine, 1990–2070; comparison of three models and implications for climate mitigation. Reg. Environ. Chang. 2007, 7, 105–119. [Google Scholar] [CrossRef]
  70. Korsak, V.; Kravchuk, A.; Prokopets, R.; Nikishanov, A.; Arjanuhina, E. Scenarios of global warming and forecasting changes of agroclimatic resources of the Volga region. Agrar. Nauchnyy Zhurnal 2018, 1, 51–55. [Google Scholar] [CrossRef] [Green Version]
  71. Lobell, D.; Asner, G. Climate and management contributions to recent trends in US Agricultural Yields. Science 2003, 299, 1032. [Google Scholar] [CrossRef] [PubMed]
  72. Challinor, A.; Parkes, B.; Ramirez-Villegas, J. Crop yield response to climate change varies with cropping intensity. Glob. Chang. Biol. 2015, 21, 1679–1688. [Google Scholar] [CrossRef] [Green Version]
  73. White, J.W.; Hoogenboom, G.; Kimball, B.A.; Wall, G.W. Methodologies for simulating impacts of climate change on crop production. Field Crop. Res. 2011, 124, 357–368. [Google Scholar] [CrossRef] [Green Version]
  74. Rötter, R.P.; Carter, T.R.; Olesen, J.E.; Porter, J.R. Crop-climate models need an overhaul. Nat. Clim. Chang. 2011, 1, 175–177. [Google Scholar] [CrossRef]
  75. Claussen, M.; Brovkin, V.; Ganopolski, A.; Kubatzki, C.; Petoukhov, V. Climate change in Northern Africa: The past is not the future. Clim. Chang. 2003, 57, 99–118. [Google Scholar] [CrossRef] [Green Version]
  76. Berhane, A. Climate change and variability impacts on agricultural productivity and food security. J. Climatol. Weather Forecast. 2018, 6, 240. [Google Scholar] [CrossRef]
  77. Stanhill, G.; Cohen, S. Global dimming: A review of the evidence for a widespread and significant reduction in global radiation with discussion of its probable causes and possible agricultural consequences. Agric. For. Meteorol. 2001, 107, 255–278. [Google Scholar] [CrossRef]
  78. Dentener, F.; Stevenson, D.; Cofala, J.; Mechler, R.; Amann, M.; Bergamaschi, P.; Raes, F.; Derwent, R. The impact of air pollutant and methane emission controls on tropospheric ozone and radiative forcing: CTM calculations for the period 1990–2030. Atmos. Chem. Phys. 2005, 5, 1731–1755. [Google Scholar] [CrossRef] [Green Version]
  79. Vaughan, M.M.; Block, A.; Christensen, S.A.; Allen, L.H.; Schmelz, E.A. The effects of climate change associated abiotic stresses on maize phytochemical defenses. Phytochem. Rev. 2018, 17, 37–49. [Google Scholar] [CrossRef]
  80. Lesk, C.; Rowhani, P.; Ramankutty, N. Influence of extreme weather disasters on global crop production. Nature 2016, 529, 84–87. [Google Scholar] [CrossRef]
  81. Pachauri, R.K.; Allen, M.R.; Barros, V.R.; Broome, J.; Cramer, W.; Christ, R.; Church, J.A.; Clarke, L.; Dahe, Q.; Dasgupta, P. Climate Change 2014: Synthesis Report; IPCC: Geneva, Switzerland, 2014. [Google Scholar]
  82. Rogelj, J.; den Elzen, M.; Höhne, N.; Fransen, T.; Fekete, H.; Winkler, H.; Schaeffer, R.; Fu, S.; Riahi, K.; Meinshausen, M. Paris Agreement climate proposals need a boost to keep warming well below 2 °C. Nature 2016, 534, 631–639. [Google Scholar] [CrossRef] [PubMed] [Green Version]
  83. Raza, A.; Razzaq, A.; Mehmood, S.S.; Zou, X.; Zhang, X.; Lv, Y.; Xu, J. Impact of climate change on crops adaptation and strategies to tackle its outcome: A review. Plants 2019, 8, 34. [Google Scholar] [CrossRef] [PubMed] [Green Version]
  84. Altieri, M.A.; Nicholls, C.I. The adaptation and mitigation potential of traditional agriculture in a changing climate. Clim. Chang. 2017, 140, 33–45. [Google Scholar] [CrossRef]
  85. Lin, B.B.; Perfecto, I.; Vandermeer, J. Synergies between agricultural intensification and climate change could create surprising vulnerabilities for crops. BioScience 2008, 58, 847–854. [Google Scholar] [CrossRef] [Green Version]
  86. Eakin, H. Smallholder maize production and climatic risk: A case study from Mexico. Clim. Chang. 2000, 45, 19–36. [Google Scholar] [CrossRef]
  87. Challinor, A.J.; Watson, J.; Lobell, D.B.; Howden, S.M.; Smith, D.R.; Chhetri, N. A meta-analysis of crop yield under climate change and adaptation. Nat. Clim. Chang. 2014, 4, 287–291. [Google Scholar] [CrossRef]
  88. Wheeler, T.; von Braun, J. Climate change impacts on global food security. Science 2013, 341, 55–60. [Google Scholar] [CrossRef] [PubMed]
  89. Ramirez-Villegas, J.; Lau, C.; Hooker, J.; Jarvis, A.; Ann-Kristin, K.; Arnell, N.; Tom, O. Climate Analogues: Finding Tomorrow’s Agriculture Today CGIAR Research Program. on Climate Change; Agriculture and Food Security (CCAFS): Copenhagen, Denmark, 2011. [Google Scholar]
  90. Egbebiyi, T.S.; Crespo, O.; Lennard, C. Defining crop-climate departure in West Africa: Improved understanding of the timing of future changes in crop suitability. Climate 2019, 7, 101. [Google Scholar] [CrossRef] [Green Version]
  91. Porter, J.R.; Semenov, M.A. Crop responses to climatic variation. Philos. Trans. R. Soc. B Biol. Sci. 2005, 360, 2021–2035. [Google Scholar] [CrossRef]
  92. Gibbs, H.K.; Ruesch, A.S.; Achard, F.; Clayton, M.K.; Holmgren, P.; Ramankutty, N.; Foley, J.A. Tropical forests were the primary sources of new agricultural land in the 1980s and 1990s. Proc. Natl. Acad. Sci. USA 2010, 107, 16732–16737. [Google Scholar] [CrossRef] [Green Version]
  93. Smith, P. Delivering food security without increasing pressure on land. Glob. Food Secur. 2013, 2, 18–23. [Google Scholar] [CrossRef]
  94. Erokhin, V.; Gao, T. Handbook of Research on Globalized Agricultural Trade and New Challenges for Food Security; IGI Global: Hershey, PA, USA, 2020. [Google Scholar] [CrossRef]
  95. Rippke, U.; Ramirez-Villegas, J.; Jarvis, A.; Vermeulen, S.J.; Parker, L.; Mer, F.; Diekkrüger, B.; Challinor, A.J.; Howden, M. Timescales of transformational climate change adaptation in Sub-Saharan African agriculture. Nat. Clim. Chang. 2016, 6, 605–609. [Google Scholar] [CrossRef]
  96. Erokhin, V.; Gao, T.; Ivolga, A. Structural variations in the composition of land funds at regional scales across Russia. Land 2020, 9, 201. [Google Scholar] [CrossRef]
  97. Mather, A.S.; Needle, C.L. The forest transition: A theoretical basis. Area 1998, 30, 117–124. [Google Scholar] [CrossRef]
  98. dos Santos, J.; Fushita, A.; de Souza, I.; Amorim, L.; Andrade, V. Agriculture and forest transition: Understanding of land use change in a cultural landscape. Open J. Appl. Sci. 2015, 5, 797–807. [Google Scholar] [CrossRef] [Green Version]
  99. Zhang, H.; Xu, E.; Zhu, H. Ecological-living-productive land classification system in China. J. Resour. Ecol. 2017, 8, 121–128. [Google Scholar] [CrossRef]
  100. Trukhachev, V.; Ivolga, A.; Lescheva, M. Enhancement of land tenure relations as a factor of sustainable agricultural development: Case of Stavropol Krai, Russia. Sustainability 2015, 7, 164–179. [Google Scholar] [CrossRef] [Green Version]
  101. Smirnov, V.; Mulendeeva, A. A structural analysis of land use in Russia. Natl. Interests Priorities Secur. 2019, 15, 1057–1074. [Google Scholar] [CrossRef]
  102. Giorgi, F.; Mearns, L.O. Approaches to the simulation of regional climate change: A review. Rev. Geophys. 1991, 29, 191–216. [Google Scholar] [CrossRef]
  103. Risbey, J.S.; Stone, P.H. A Case study of the adequacy of GCM simulations for input to regional climate change assessments. J. Clim. 1996, 9, 1441–1467. [Google Scholar] [CrossRef]
  104. Villoria, N.; Byerlee, D.; Stevenson, J. The effects of agricultural technological progress on deforestation: What do we really know? Appl. Econ. Perspect. Policy 2014, 36, 211–237. [Google Scholar] [CrossRef]
  105. Wang, W.; Guo, L. Sources of production growth in Chinese agriculture: Empirical evidence from panel data results 2001–2018. Appl. Econ. 2021, 53, 5135–5157. [Google Scholar] [CrossRef]
  106. Hertel, T. Implications of Agricultural Productivity for Global Cropland Use and GHG Emissions: Borlaug vs. Jevons; Purdue University: West Lafayette, IN, USA, 2012. [Google Scholar]
  107. Loshakov, A. Condition and use of the land fund of Stavropol region. Econ. Ecol. Territ. Form. 2018, 2, 114–123. [Google Scholar] [CrossRef]
  108. Petrova, L.; Eroshenko, F.; Eroshenko, A. Productivity of winter wheat in different soil and climatic zones of the North Caucasus. Achiev. Sci. Technol. Agric. Ind. Complex. 2015, 29, 80–84. [Google Scholar]
  109. Center for Hydrometeorology and Environmental Monitoring of Stavropol Krai. Hydrometeorological Information. Available online: http://stavpogoda.ru/u_monit.shtml (accessed on 25 November 2021).
  110. Weather and Climate. Stavropol Climate Chronicle. Available online: http://www.pogodaiklimat.ru/history/34949.htm (accessed on 25 November 2021).
  111. Kulinstev, V.; Godunova, E.; Zhelnakova, L.; Udovydchenko, V.; Petrova, L.; Dridiger, V.; Antonov, S.; Andrianov, D.; Dzybov, D.; Kravtsov, V.; et al. The System of Agriculture of the New Generation of the Stavropol Territory; AGRUS: Stavropol, Russia, 2013. [Google Scholar]
  112. Bondar, I. Socio-Economic Support for the Integration of the Ciscaucasia into the System of Agrarian Capitalism in Russia: The Second Half of the XIX Century – Beginning of the XX Century (On the Case of Stavropol and Kuban); North Osetia State University: Vladikavkaz, Russia, 2012. [Google Scholar]
  113. Korobeynikov, A. Essays on the Development of the Stavropol Territory; Stavropol Publishing House: Stavropol, Russia, 1986. [Google Scholar]
  114. Stavropol Provincial Statistics Committee. Review of the Stavropol Province in 1890; Publishing House of the Provincial Government: Stavropol, Russia, 1891.
  115. Ryabov, E. Wind Erosion (Deflation) and Measures to Prevent It; Stavropol Publishing House: Stavropol, Russia, 1996. [Google Scholar]
  116. Shatsky, P. Agriculture of the Ciscaucasia in 1861–1905; USSR Academy of Sciences: Leningrad, Russia, 1970. [Google Scholar]
  117. Kochura, D.; Nevskaya, V. Our Region. Stavropol: Essays of History; Shat-gora: Stavropol, Russia, 1999. [Google Scholar]
  118. Krasnov, G. Struggle for the Alteration of the Nature of Stavropol; Stavropol Publishing House: Stavropol, Russia, 1952. [Google Scholar]
  119. Ryabov, E. Erosion and Deflation as the Main Factors of Desertification of the Territory and Measures to Overcome Them; Stavropol Publishing House: Stavropol, Russia, 2001. [Google Scholar]
  120. Samofalova, M.; Khachaturova, L. Experience of Hydrometeorological Support of the National Economy of the Stavropol Territory; Gidrometeoizdat: Stavropol, Russia, 1983. [Google Scholar]
  121. Ryabov, E. Influence of Unfavorable Weather Conditions on the Crop and Land Resources of the Stavropol Territory; Stavropol Publishing House: Stavropol, Russia, 2001. [Google Scholar]
  122. Nikolsky, S. Agrarian Course of Russia (The Worldview of Reformers and the Practice of Agrarian Reforms in Socio-Historical, Economic and Philosophical Aspects); Kolos: Moscow, Russia, 2003. [Google Scholar]
  123. Directorate of the Federal State Statistics Service of the Russian Federation for North Caucasian Federal District. Official Statistics. Available online: https://stavstat.gks.ru/ofstatistics (accessed on 25 November 2021).
  124. Skorkina, N. Stavropol Krai in Figures. Statistical Yearbook; Directorate of the Federal State Statistics Service of the Russian Federation for North Caucasian Federal District: Stavropol, Russia, 2020.
  125. Zhernovoy, V. The general rise is planned. Agriculture 1999, 4, 14–15. [Google Scholar]
  126. Wiebe, K.; Lotze-Campen, H.; Sands, R.; Tabeau, A.; van der Mensbrugghe, D.; Biewald, A.; Bodirsky, B.; Islam, S.; Kavallari, A.; Mason-D’Croz, D.; et al. Climate change impacts on agriculture in 2050 under a range of plausible socioeconomic and emissions scenarios. Environ. Res. Lett. 2015, 10, 085010. [Google Scholar] [CrossRef]
  127. Chen, Q.; Liu, Y.; Ge, Q.; Pan, T. Impacts of historic climate variability and land use change on winter wheat climatic productivity in the North China Plain during 1980–2010. Land Use Policy 2018, 76, 1–9. [Google Scholar] [CrossRef]
  128. Kaya, Y. Winter wheat adaptation to climate change in Turkey. Agronomy 2021, 11, 689. [Google Scholar] [CrossRef]
  129. Rusakova, T.; Lebedeva, V.; Gringof, I. Studying climate-related yield fluctuations of basic grain crops and their qualitative assessment under new socioeconomic conditions of the Russian Federation. Russ. Meteorol. Hydrol. 2010, 35, 851–857. [Google Scholar] [CrossRef]
  130. Pismennaya, E.; Stukalo, V. Trends in use of the steppe land resources of Stavropol region in different periods of the agrarian economy. South. Russ. Ecol. Dev. 2017, 12, 79–89. [Google Scholar] [CrossRef] [Green Version]
  131. Sanin, S. Protection of wheat against diseases in modern intensive technologies of its cultivation in the Central Region of Russia. Legumes Groat Crop. 2013, 6, 34–40. [Google Scholar]
  132. Belyaev, N.; Dubinkina, E. Assessment of adaptation of winter wheat varieties in conditions of Central Chernozem. Legumes Groat Crop. 2018, 27, 91–95. [Google Scholar] [CrossRef]
  133. Goryanin, O.; Madyakin, E.; Dzhangabaev, B.; Yakovleva, N. The improvement of the winter wheat cultivation technology in arid conditions of the Povolzhie. Grain Econ. Russ. 2021, 1, 52–56. [Google Scholar] [CrossRef]
  134. Shaykova, T.; Dyatlova, M.; Volkova, E.; Stepanova, I. Grain productivity of winter wheat as affected by complex fertilizers in the North-West of Russia. Fodd. Prod. 2020, 5, 30–34. [Google Scholar]
  135. Shpanev, A. Harmfulness of weed plants in winter wheat crops in the North-West of Russia. Plant. Prot. News 2018, 2, 42–46. [Google Scholar] [CrossRef] [Green Version]
  136. Toropova, E.; Stetsov, G.; Peshkov, S. Phytosanitary bases of winter wheat cultivation in Western Siberia. Prot. Quar. Plants 2021, 1, 28–37. [Google Scholar] [CrossRef]
  137. Sthapit, B.; Vasudeva, R.; Rajan, S.; Sripinta, P.; Reddy, B.M.C.; Arsanti, I.W.; Idris, S.; Lamers, H.; Ramanatha Rao, V. On-farm conservation of tropical fruit tree diversity: Roles and motivations of custodian farmers and emerging threats and challenges. Acta Hortic. 2015, 1101, 69–74. [Google Scholar] [CrossRef]
  138. Rosenzweig, C.; Parry, M. Potential impact of climate-change on world food-supply. Nature 1994, 367, 133–138. [Google Scholar] [CrossRef]
  139. Parry, M.; Rosenzweig, C.; Livermore, M. Climate change, global food supply and risk of hunger. Philos. Trans. R. Soc. B Biol. Sci. 2005, 360, 2125–2138. [Google Scholar] [CrossRef] [PubMed] [Green Version]
  140. Fischer, G.; Shah, M.; Tubiello, F.; van Velhuizen, H. Socio-economic and climate change impacts on agriculture: An integrated assessment, 1990–2080. Philos. Trans. R. Soc. B Biol. Sci. 2005, 360, 2067–2083. [Google Scholar] [CrossRef]
  141. Schlenker, W.; Roberts, M.J. Nonlinear temperature effects indicate severe damages to U.S. crop yields under climate change. Proc. Natl. Acad. Sci. USA 2009, 106, 15594–15598. [Google Scholar] [CrossRef] [PubMed] [Green Version]
  142. Greene, D.; Sutherland, S.; Kirkham, M. Influence of area on winter wheat climatic models. Clim. Chang. 1979, 2, 21–32. [Google Scholar] [CrossRef]
  143. Rudel, T.; Schneider, L.; Uriarte, M.; Turner, B.L.; DeFries, R.; Lawrence, D.; Geoghegan, J.; Hecht, S.; Ickowitz, A.; Lambin, E.; et al. Agricultural intensification and changes in cultivated areas, 1970–2005. Proc. Natl. Acad. Sci. USA 2009, 106, 20675–20680. [Google Scholar] [CrossRef] [Green Version]
  144. Neumann, K.; Verburg, P.; Stehfest, E.; Müller, C. The yield gap of global grain production: A spatial analysis. Agric. Syst. 2010, 103, 316–326. [Google Scholar] [CrossRef]
  145. Licker, R.; Kucharik, C.; Dore, T.; Lindeman, M.; Makowski, D. Climatic impacts on winter wheat yields in Picardy, France and Rostov, Russia: 1973–2010. Agric. For. Meteorol. 2013, 176, 25–37. [Google Scholar] [CrossRef]
  146. Savchenko, I.; Pryanishnikov, A.; Shabaev, A. Scientific coverage of stable agricultural production under conditions of growing climate iridizations. Russ. Agric. Sci. 2014, 6, 18–20. [Google Scholar]
  147. Pismennaya, E.; Loshakov, A.; Odinsov, S.; Stukalo, V. Improving model of territorial organization of agricultural land tenure. Res. J. Pharm. Biol. Chem. Sci. 2016, 7, 1783–1787. [Google Scholar]
  148. Savin, I.; Stolbovoy, V.; Savitskaya, N. Climatic potential for winter wheat yield in Russia. Russ. Agric. Sci. 2017, 43, 296–299. [Google Scholar] [CrossRef]
  149. Liu, J.; Dong, C.; Liu, S.; Rahman, S.; Sriboonchitta, S. Sources of total-factor productivity and efficiency changes in China’s agriculture. Agriculture 2020, 10, 279. [Google Scholar] [CrossRef]
  150. Loncaric, R.; Loncaric, Z.; Zmaic, K. Economic effects of winter wheat fertilization. Cereal Res. Commun. 2006, 34, 825–828. [Google Scholar] [CrossRef]
  151. Kulhánek, M.; Balík, J.; Černý, J.; Peklová, L.; Sedlář, O. Winter wheat fertilizing using nitrogen-sulphur fertilizer. Arch. Agron. Soil Sci. 2014, 60, 67–74. [Google Scholar] [CrossRef]
  152. Burykina, S.; Kryvenko, A.; Solomonov, R.; Kapustina, G.; Drobitko, A. Efficiency of winter wheat fertilization systems in the steppe zone of Southern Ukraine. Int. J. Ecosyst. Ecol. Sci. 2021, 11, 819–830. [Google Scholar] [CrossRef]
  153. Cronin, J.; Zabel, F.; Dessens, O.; Anandarajah, G. Land suitability for energy crops under scenarios of climate change and land-use. Glob. Chang. Biol. Bioenergy 2020, 12, 648–665. [Google Scholar] [CrossRef]
  154. Pavlova, V.; Shkolnik, I.; Pikaleva, A.; Efimov, S.; Karachenkova, A.; Kattsov, V. Future changes in spring wheat yield in the European Russia as inferred from a large ensemble of high-resolution climate projections. Environ. Res. Lett. 2019, 14, 034010. [Google Scholar] [CrossRef]
  155. Pavlova, V.; Calanca, P.; Karachenkova, A. Grain Crops Productivity in the European Part of Russia under Recent Climate Change. Russ. Meteorol. Hydrol. 2020, 45, 290–302. [Google Scholar] [CrossRef]
Figure 1. Map of Central Fore-Caucasus. Note: 1 = Adygeya; 2 = Astrakhan; 3 = Chechnya; 4 = Dagestan; 5 = Ingushetia; 6 = Kabardino-Balkaria; 7 = Kalmykia; 8 = Karachaevo-Cherkessia; 9 = Krasnodar; 10 = North Osetia-Alania; 11 = Rostov; 12 = Volgograd. Source: authors’ development.
Land 10 01339 g001
Figure 2. Winter wheat yields in 1850–1910, tons/ha. Source: authors’ development based on [112,114,116].
Land 10 01339 g002
Figure 3. Winter wheat yields in 1910–1950, tons/ha. Source: authors’ development based on [118,119,120].
Land 10 01339 g003
Figure 4. Winter wheat yields in 1950–1990, tons/ha. Source: authors’ development based on [121,122].
Land 10 01339 g004
Figure 5. Winter wheat yields in 1990–2020, tons/ha. Source: authors’ development based on [123,124].
Land 10 01339 g005
Table 1. Periods under study.
StageYearsAgricultural ProductionLand Use PatternsSoil QualityWinter Wheat Yields, tons/ha
I1850–1910Establishment of the grain production cluster in the south of Russia.Misbalances in land use patterns. Countervailing of rangelands and lands under crops in the total land use.Early manifestations of soil erosion and soil blowing.0.15–1.00
II1910–1950Temporal drops in output (civil tensions and wars in 1917–1922 and 1941–1945).Intensification of crop production. Development of irrigation and water distribution systems. Adverse environmental impacts and deterioration in the quality of soils.1.00–1.50
III1950–1990Switch to adaptive development of crop production. Enhancing the productivity of crop farming.Widespread amelioration (chemical, water, forest, etc.). Technical and technological modernization of crop production.Accelerated degradation of soils and loss of agricultural lands, adverse environmental impacts.1.50–3.00
IV1990–2020Breaking of established value chains amid the dissolution of the Soviet Union. Deterioration of the basic infrastructure in the crop sector.Market reforms in the agricultural sector. The market for agricultural land. Diverse organizational forms of land use.Intense soil erosion and soil blowing, arable land loss, transfer of agricultural lands to non-agricultural uses.3.00–4.14
Source: authors’ development.
Table 2. Precipitation, air temperature, and climate impact on crop production in Central Fore-Caucasus in 1850–2020.
StageParametersClimate
Impact
(V)
Air temperature (T), °CPrecipitation (R), mm
Min *Mean **Max ***Min *Mean **Max ***
I7.6 (1878)11.1 ± 0.411.4 (1890)240 (1900)415.0 ± 90.0525 (1895)37.4 ± 45.2
II7.7 (1929)11.3 ± 0.411.9 (1935)275 (1940)367.4 ± 71.0529 (1945)32.5 ± 35.3
III7.7 (1976)10.4 ± 1.111.5 (1966)286 (1954)399.2 ± 68.5546 (1951)38.4 ± 33.7
IV7.4 (1993)10.5 ± 0.611.7 (2010)255 (1995)525.0 ± 70.7554 (2017)50.5 ± 34.7
Note: * = minimum over the stage period (year in parenthesis); ** = mean value over the stage period (± = deviations from the mean value per decade); *** = maximum over the stage period (year in parenthesis). Source: authors’ development based on [109,110].
Table 3. Evolution of agricultural land use patterns in Central Fore-Caucasus in 1850–2020.
Farming SystemSpecializationStagesComposition of the Agricultural Land Fund, Share in Total, %Land Use Equation (2)
SCSR + SHSPPSPPLSOL
Dryland farmingDeveloping crop production, advanced livestock productionI and II10.080.01.00.09.0 S A L = 0.1 S C + 0.8 ( S R + S H ) + 0.01 S P P + 0.09 S O L
Irrigation farmingAdvanced crop production, advanced livestock productionIII60.030.00.71.08.3 S A L = 0.6 S C + 0.3 ( S R + S H ) + 0.007 S P P + 0.01 S P P L + 0.083 S O L
Dryland farmingAdvanced crop production, degrading livestock productionIV70.020.00.71.08.3 S A L = 0.7 S C + 0.2 ( S R + S H ) + 0.007 S P P + 0.01 S P P L + 0.083 S O L
Note: S A L = total area of agricultural land use, ha; S C = croplands; S R = rangelands; S H = hayfields; S P P = perennial plantings; S P P L = publicly protected lands; S O L = other lands. Source: authors’ development.
Table 4. Gross output and yield of winter wheat and parameters of agricultural lands in Central Fore-Caucasus in 1850–2020.
StageParametersLinear Regression EquationRegression Coefficient R
YGCOM
I0.46 ± 0.20No dataNo dataNo dataNo data Y = 6.373 0.171 X T + 0.003 X R 0.11
II0.74 ± 0.260.655 ± 0.252No dataNo dataNo data Y = 7.424 0.097 X T + 0.001 X R 0.12
III1.58 ± 0.502.657 ± 0.87040.2 ± 27.99.0 ± 2.1190.2 ± 90.7 Y = 17.453 + 0.076 X T 0.013 X R 0.40
IV3.17 ± 0.574.192 ± 1.18510.8 ± 2.23.6 ± 1.888.8 ± 24.6 Y = 74.946 0.197 X T + 0.207 X R 0.20
Note: Y = winter wheat yield, tons/ha; G = gross output of winter wheat, million tons; C = humus content, %; O = applied organic fertilizers, thousand tons; M = applied mineral fertilizers, thousand tons active ingredient; X T = air temperature; X R = precipitation. Source: authors’ development.
Table 5. Multiplicative climate–yield equations for winter wheat in Central Fore-Caucasus in 1850–2020.
StageModel
I Y 1 ( 4.6 ± 2.0 ) = A 1 ( I ) × T 1 ( 11.1 ± 0.4 ) × R 1 ( 415.0 ± 90.0 ) × ( C 1 ± C 1 ( t ) ) × ( M 1 ± M 1 ( t ) ) × ( O 1 ± O 1 ( t ) )
II Y 2 ( 7.4 ± 2.6 ) = A 2 ( I I ) × T 2 ( 11.3 ± 0.4 ) × R 2 ( 367.4 ± 71.0 ) × ( C 2 ± C 2 ( t ) ) × ( M 2 ± M 2 ( t ) ) × ( O 2 ± O 2 ( t ) )
III Y 3 ( 15.8 ± 5.0 ) = A 3 ( I I I ) × T 3 ( 10.4 ± 1.1 ) × R 3 ( 399.2 ± 68.5 ) × C 3 ( 40.2 ± 27.9 ) × M 3 ( 190.2 ± 90.7 ) × O 3 ( 9.0 ± 2.1 )
IV Y 4 ( 31.7 ± 5.7 ) = A 4 ( I V ) × T 4 ( 10.5 ± 0.6 ) × R 4 ( 525.0 ± 70.7 ) × C 4 ( 10.8 ± 2.2 ) × M 4 ( 88.8 ± 24.6 ) × O 4 ( 3.6 ± 1.8 )
Average Y a v e r ( 14.9 ± 8.9 ) = A a v e r × T a v e r ( 10.8 ± 0.3 ) × R a v e r ( 426.7 ± 25.1 ) × C a v e r ( 25.5 ± 14.7 ) × M a v e r ( 139.5 ± 79.3 ) × O a v e r ( 6.3 ± 3.2 )
Note:   Y t = crop yield, tons/ha; A t = neutral technical progress; T t = deviation from annual average air temperature, °C; R t = deviation from annual average precipitation, mm; C t = deviation from humus content, %; M t = deviation from the total volume of applied mineral fertilizers, thousand tons active ingredient; O t = deviation from the total volume of applied organic fertilizers, thousand tons. Source: authors’ development.
Table 6. Potential areas for relocation of winter wheat sites in Central Fore-Caucasus.
Site *ZoneSoil TypeCTwTsRErodibility
by Waterby Wind
11Chestnut black soilLow−4.0+24.0400–450NonerodibleStrong
21Dark chestnut soilLow−4.0+24.0350–400NonerodibleMedium
31Dark chestnut soilLow−4.0+24.0400–450MediumMedium
42Chestnut soilLow−4.0+24.0350–400NonerodibleStrong
51Dark chestnut soilLow−4.0+24.0300–350NonerodibleStrong
62Dark chestnut soilLow−4.0+23.0350–400NonerodibleVery strong
72Chestnut soilLow−4.0+24.0350–400MediumMedium
82Dark chestnut soilLow−4.0+23.0400–450NonerodibleStrong
Note: * = see Appendix A Figure A4 for locations of sites; T w = average temperature (January), °C;   T s = average temperature (July), °C; R = annual average precipitation, mm; C = humus content in soil, %. Source: authors’ development.
Publisher’s Note: MDPI stays neutral with regard to jurisdictional claims in published maps and institutional affiliations.

