Article

A Comprehensive Plant microRNA Simple Sequence Repeat Marker Database to Accelerate Genetic Improvements in Crops

1
Institute of Fruit Tree Research, Guangdong Academy of Agricultural Sciences, Guangzhou 510640, China
2
Department of Genetics and Genome Biology, University of Leicester, Leicester LE1 7RH, UK
3
Department of Computer Science and Engineering, Maulana Abul Kalam Azad University of Technology, Kalyani 700064, West Bengal, India
*
Authors to whom correspondence should be addressed.
Agronomy 2021, 11(11), 2298; https://doi.org/10.3390/agronomy11112298
Submission received: 5 September 2021 / Revised: 3 November 2021 / Accepted: 4 November 2021 / Published: 13 November 2021
(This article belongs to the Special Issue Legumes Cultivars and Their Genetic Improvements)

Abstract

:
Microsatellites, or simple sequences repeat (SSRs), are distributed in genes, intergenic regions and transposable elements in the genome. SSRs were identified for developing markers from draft genome assemblies, transcriptome sequences and genome survey sequences in plant and animals. The identification, distribution, and density of microsatellites in pre-microRNAs (miRNAs) are not well documented in plants. In this study, SSRs were identified in 16,892 pre-miRNA sequences from 292 plant species in six taxonomic groups (algae to dicots). Fifty-one percent of pre-miRNA sequences contained SSRs. Mononucleotide repeats were the most abundant, followed by di- and trinucleotide repeats. Tetra-, penta-, and hexarepeats were rare. A total of 9,498 (57.46%) microsatellite loci had potential as pre-miRNA SSR markers. Of the markers, 3,573 (37.62%) were non-redundant, and 2,341 (65.51%) primer pairs could be transferred to at least one of the plant taxonomic groups. All data and primer pairs were deposited in a user-friendly, freely accessible plant miRNA SSR marker database. The data presented in this study, accelerate the understanding of pre-miRNA evolution and serve as valuable genomic treasure for genetic improvements in a wide range of crops, including legumes, cereals, and cruciferous crops.

1. Introduction

Microsatellites, also called simple sequence repeats (SSRs), consist of tandemly repeated units of one to six nucleotides. They are abundant elements in both prokaryotic and eukaryotic genomes, although their frequency varies greatly among different organisms [1]. Simple sequence repeats likely originate from either de novo or adoptive genesis [2]. The slippage in DNA replication and unequal recombination are responsible for length-altering mutations of SSRs, thus causing their increase and evolution [3,4]. Simple sequence repeats are inherently unstable, as a result they can be highly polymorphic even among closely related species [5]. The mutation rates within SSRs generally increase with the increasing number of repeat units [4]. SSRs are not randomly distributed in genomes [2,6] and they are found in noncoding, as well as coding, regions [3,7]. Mutations in SSRs can affect the function of sequence segments and ultimately lead to phenotypic changes [8,9]. In this sense, SSRs are described as potential evolutionary tuning knobs [10,11], allowing for a fast adaptation under selection pressure.
In recent years, SSRs have become one of the most popular classes of genetic markers because of their high reproducibility, codominant inheritance, multi-allelic nature, high genomic abundance, wide range of distribution and high mutational rate [12]. For these reasons, SSRs are used as informative molecular markers in population genetic [13,14,15] and phylogenetic [16,17,18] studies. Furthermore, SSR markers are used extensively in studies on mapping [19,20], as well as linkage associations [21].
Simple sequence repeats are identified in ESTs (Expressed Sequence Tag) [22,23] and genomic sequences in species from fungi to vascular plants [3,7,24,25,26,27]. However, the occurrence and frequency of SSRs in plant pre-microRNAs (miRNAs) has not been investigated. Pre-miRNAs are short sequences that become functional miRNAs after nuclear and cytoplasmic processing [28]. MicroRNAs received considerable attention in recent years, and several studies characterized pre-miRNA and miRNA functions in plants [29,30]; a miRNA database was also constructed [31]. Thus, these data are available for further use, including in functional analysis, target prediction and even in the development of molecular markers. Several studies indicated that SSR-bearing “pri-miRNA candidates” may have roles in gene regulation and can be used for the development of functional molecular markers. For example, Joy and Soniya [32] reported that a CT-motif dinucleotide is the key element in one of the SSR-bearing “pri-miRNA candidates” that was found in the Piper nigrum genome. This candidate has an important regulatory function in the miRNA-mediated mechanism for plant growth and development. In Cleistogenes songorica, 110 SSR-bearing “pri-miRNA candidates” were identified; SSR markers were developed and their transferability to other nongrass species was tested. Then, their utility in population structure and genetic diversity estimations was validated [33]. This study demonstrated that SSR-bearing “pri-miRNA candidates” were the potential source of molecular markers for the study of genetic diversity and marker-assisted breeding of grass species [33].
Notably, even single-nucleotide changes in pre-miRNAs can greatly affect their function [33,34]. On the basis of this observation, the abundance of SSRs in pre-miRNAs was investigated. In brief, in this study, the frequency, density, and repeat-type characteristics of SSRs were determined in pre-miRNA sequences in plant species from different taxonomic groups. This work provides a foundation to increase the understanding of the roles SSRs play in pre-miRNA functions. Furthermore, to maximize the utility of the data, a freely accessible database was developed.

2. Methods

2.1. Retrieving and Processing pre-miRNA Sequences

A total of 16,892 pre-miRNA sequences were obtained from PMD (http://bioinformatics.cau.edu.cn/PMRD/ accessed on 14 September 2019) and miRNEST2.0 (http://lemur.amu.edu.pl/share/php/mirnest/downloads.php accessed on 14 September 2019) [31], as well as from in-house mining of pre-miRNA sequences from fungi and citrus EST databases. Pre-miRNA sequences of fungal and citrus species were predicted from the EST sequences. The miRNA database v21 was used for homology searches against fungal and citrus EST collections. The best hits with a minimum length of 18 nucleotides and a maximum miRNA length cover up to 26 nucleotides, with no more than three mismatches considered as putative candidate miRNAs. Further, BLASTx [35] was applied to eliminate protein coding transcripts. Then, Mfold [36] was used to predict stem–loop structure. Potential pre-miRNA sequences were selected according to the following criteria: (a) a mature miRNA on the arm of the hairpin; (b) minimum paired and unpaired residues in miRNA of 14 and ≤5, respectively; (c) maximum number of five G–U pairs in miRNA; (d) maximum bulge size of 3 nt; (e) low negative minimal folding free energy (MFE) (≤−18 kcal/mol) [37]; and (f) high minimal folding free energy index (MFEI = [(MFE/length of the RNA sequence) × 100]/(G + C)%) (>0.85) [38,39,40]. In this study, pre-miRNAs of different plant species were separated into six taxonomic groups: algae, fungi, mosses–ferns, conifers, monocots, and dicots (listed in Supplementary Table S1).

2.2. Microsatellite Search and Localization and Primer Design

A Perl script was developed to scan plant pre-miRNA sequences for perfect microsatellites. In the search, a minimum of three repeat units was required, similar to a survey of SSRs in Escherichia coli [41]. To verify results, two tools were used to detect SSRs, as described by Chen et al. [42]. Locations of SSR motifs on pre-miRNA sequences were predicted by comparing SSR location and stem–loop structure using Perl scrip developed in-house. Primer pairs from identified SSR-associated miRNAs were designed with primer3 software using the following parameters: primer length range 18 to 23 nt, with 21 nt the optimum; PCR product size range = 100 to 250 nt; optimum annealing temperature 55 °C; and GC content 40% to 60%, with 50% the optimum [43]. Perl script was used to remove redundant primer sets from the primer database. If more than one set of primers was generated for the same sequence, one primer set was selected randomly for further analysis.

2.3. In Silico Characterization, Transferability, and Polymorphism of Primer Sets

Identified SSRs were characterized in silico according to (i) length of repeat motifs (Class I ≥ 20 nt, Class II < 20 nt) and (ii) base composition of repeat motifs (AT-rich, GC-rich, and AT–GC balanced). Localization of SSR motifs in either stem or loop regions of pre-miRNAs was determined by correlating stem–loop position and SSR position within pre-miRNA sequences. MicroRNA SSRs were mapped onto 35 plant genomes (covering all six taxonomic groups) using the ePCR strategy. Marker positions on mapped genomes were recorded, and in silico PCR amplicon size was calculated. Then, the size of each marker in different genomes was compared. If an amplicon size differed by at least 2 bp, the SSR was classified as polymorphic; other amplicons were considered as monomorphic.

2.4. Creation of PmiRNASM (Plant microRNA Simple Sequence Repeat Marker) Database

A user-friendly, freely accessible pre-miRNA SSR marker database (PmiRNASSRdb: http://plantmirssr.enset-project.org/ or http://genomicsres.org/plantmirssr/) was constructed to maximize the use of the markers. The web interface was designed by using HTML and JAVA script, which is compatible with various browsers, including Google Chrome, Mozilla Firefox and Internet Explorer. In this study, PHP scripts were used for communication between user interface and database at the server. The information regarding SSR primers, their flanking sequences, miRNA association, transferability, and polymorphism details are cataloged in the MySql server. The database can be accessed through http://plantmirssr.enset-project.org/ or http://genomicsres.org/plantmirssr/.

2.5. Statistical Analyses

Relative occurrence of SSRs in each taxonomic group was calculated as follows: relative occurrence of an SSR = (number of SSRs) / (number of pre-miRNAs). The frequency of an SSR class of unit size i (1 ≤ i ≤ 6) was calculated as the average number of SSRs per kilobase as follows: Fi = (Ni/G) × 1000, where Ni is the total number of SSRs with unit size i, and G is the size of the pre-miRNA sequence. The SSR density per kilobase was obtained as follows: Di = (Li/G) × 1000, where Li is the total length of SSR motifs with unit size i. Linear regression was used to determine relations between average number, frequency and density of microsatellites and genome features (namely AT or GC content). Quadratic regressions (QR) of SSR density, SSR frequency, and SSR subgroup on pre-miRNA sequence AT content were determined using Perl script and MS Excel. Goodness of fit of a QR was determined by R2, and f-tests and t-tests were used to determine statistical significance of regressions and coefficients, respectively. Pearson correlations and Student’s t-tests were also performed using MS Excel.

3. Results

3.1. Frequency, Density and Distribution of Simple Sequence Repeats

A total of 16,892 pre-miRNA sequences from 292 plant species were searched for SSRs, and the results are summarized in Table 1. The percentage of SSR-containing pre-miRNAs ranged from 38 for mosses and conifers to 84 for fungi. On average, at least 1.2 SSRs were found per plant, pre-miRNA sequence. Overall, 51% of plant pre-miRNA sequences contained at least one SSR. The SSR frequency and density gradually increased from lower to higher in the plant species. Class II (SSR length shorter than 20 bp) SSRs were more frequent than Class I (longer than 19 bp) SSRs in plant pre-miRNA sequences. The most abundant SSRs were those of 5 to 10 bp in length, and the least frequent were those longer than 20 bp, as shown in Figure 1a,b. The frequency of the repeat numbers of the SSR motifs in the pre-miRNA sequences was not significantly different among the six plant taxonomic groups. The most frequent number of repeats in pre-miRNA sequences was five (Figure 1a).

3.2. Occurrence and Relative Counts of Repeat Units

In plant pre-miRNAs, the mononucleotide motif was the most common repeat class (Table 2). The relative occurrence of mononucleotide repeats ranged from 0.43 in mosses to 1.76 in fungi. In ferns–mosses, conifers, monocots and dicots, poly (A/U) repeats dominated, whereas, in algae, poly (C/G) repeats dominated (Figure 1c). In fungi, the numbers of poly (A/C) repeats and poly (G/U) repeats were comparable (Figure 2). The longest mononucleotide repeat was (A)38, which was found in dicot pre-miRNAs, and it was followed by (A)28 in monocots and (U)20 in fungi (Supplementary Table S2).
Dinucleotide repeats were the second-most abundant repeat class in pre-miRNAs (Table 2) for most of the taxa except fungi and algae. The AG/CU repeats were predominant in fungi, ferns–mosses, conifers, monocots and dicots, whereas AG/CU and AU/UA repeats were not found in 109 algal pre-miRNAs (Figure 1c). Notably, CG/GC repeats were relatively rare in ferns–mosses, conifer, monocot and dicot pre-miRNAs. The longest dinucleotide repeat was (AU)33, which was found in monocot pre-miRNAs (Supplementary Table S2).
Relative counts of trinucleotide repeats ranged from 0.02 in monocots to 0.45 in fungi (Table 2). In plant pre-miRNAs, trinucleotide repeats were less frequent than di- and mononucleotide repeats. The ACU/AGU and AUG/GUA repeats were common in all six plant taxonomic groups, whereas other trinucleotide repeat units were rare (Figure 1c). Notably, most trinucleotide repeat units contained the base “U.” In dicot pre-miRNAs, “U”-containing trinucleotide repeat units were predominant, whereas in monocots, “C”-containing trinucleotide repeat units were predominant. The longest trinucleotide repeat unit was (GAA)30, which was found in monocot pre-miRNAs (Supplementary Table S2).
Tetra-, penta-, and hexanucleotide repeats were less abundant than other repeats in plant pre-miRNAs (Table 2). In particular, tetranucleotide repeats were not found in fungi, algae, mosses and conifers, whereas pentanucleotide repeats were not found in algae pre-miRNAs (Figure 1c). AU-rich and AU–GC balanced tetra nucleotide repeats were dominant in dicot and monocot pre-miRNAs. The GC-rich penta nucleotide repeats were more abundant in mosses than in other plant pre-miRNAs. The longest penta nucleotide repeat was (AACCG)6 with a length of 30 bp, and it was found in algal pre-miRNAs. A total of 34 different hexanucleotide repeat motifs were identified, but a common motif was not found among the six taxonomic groups of plants. However, the CCUCUU motif was more frequent in fungal pre-miRNAs. The longest hexanucleotide repeat was (CUUCCU)13, which was found in dicot pre-miRNAs.

3.3. Effect of Nucleotide Composition on Simple Sequence Repeat Frequency, Density and Variation within pre-microRNAs

To evaluate the effects of the nucleotide composition of plant pre-miRNAs on SSR frequency, density and variation in SSR motif composition, correlations between the AT/GC content of pre-miRNA sequences and different features of SSRs (density, frequency and motif nucleotide composition) were determined for the different plant species (Figure 2). The AT content of plant pre-miRNA sequences was weakly correlated with the SSR frequency and density of the different plant species. The regressions of the frequency and density of each type of SSR on AT content were also determined, and the coefficient a increased with the increase in SSR frequency (Supplementary Tables S3 and S4). For example, mono- and di-repeat types of SSR were more frequent in pre-miRNA sequences, and their regression coefficients were also higher than those of other types of SSR repeats (Figure 2).
To evaluate the effect of pre-miRNA sequence nucleotide composition on SSR motif constitution, each type of SSR was categorized according to their repeat unit nucleotide composition into AT-rich, GC-rich, or AT–GC balanced SSR motif subgroups. The abundance of the motif of each subgroup per SSR type was determined, and the percentage was calculated. Subsequently, the percentage of abundance was plotted against the AT content (%) of pre-miRNA sequences of different plant species (Figure 2). As expected, AT-rich and GC-rich motifs were the most common for high-AT and GC-rich pre-miRNA sequences, respectively. Balanced AT–GC motifs were more common in AT–GC balanced sequences. In addition, the difference in AT and GC contents (%) of pre-miRNA sequences was not significant (Table 1).

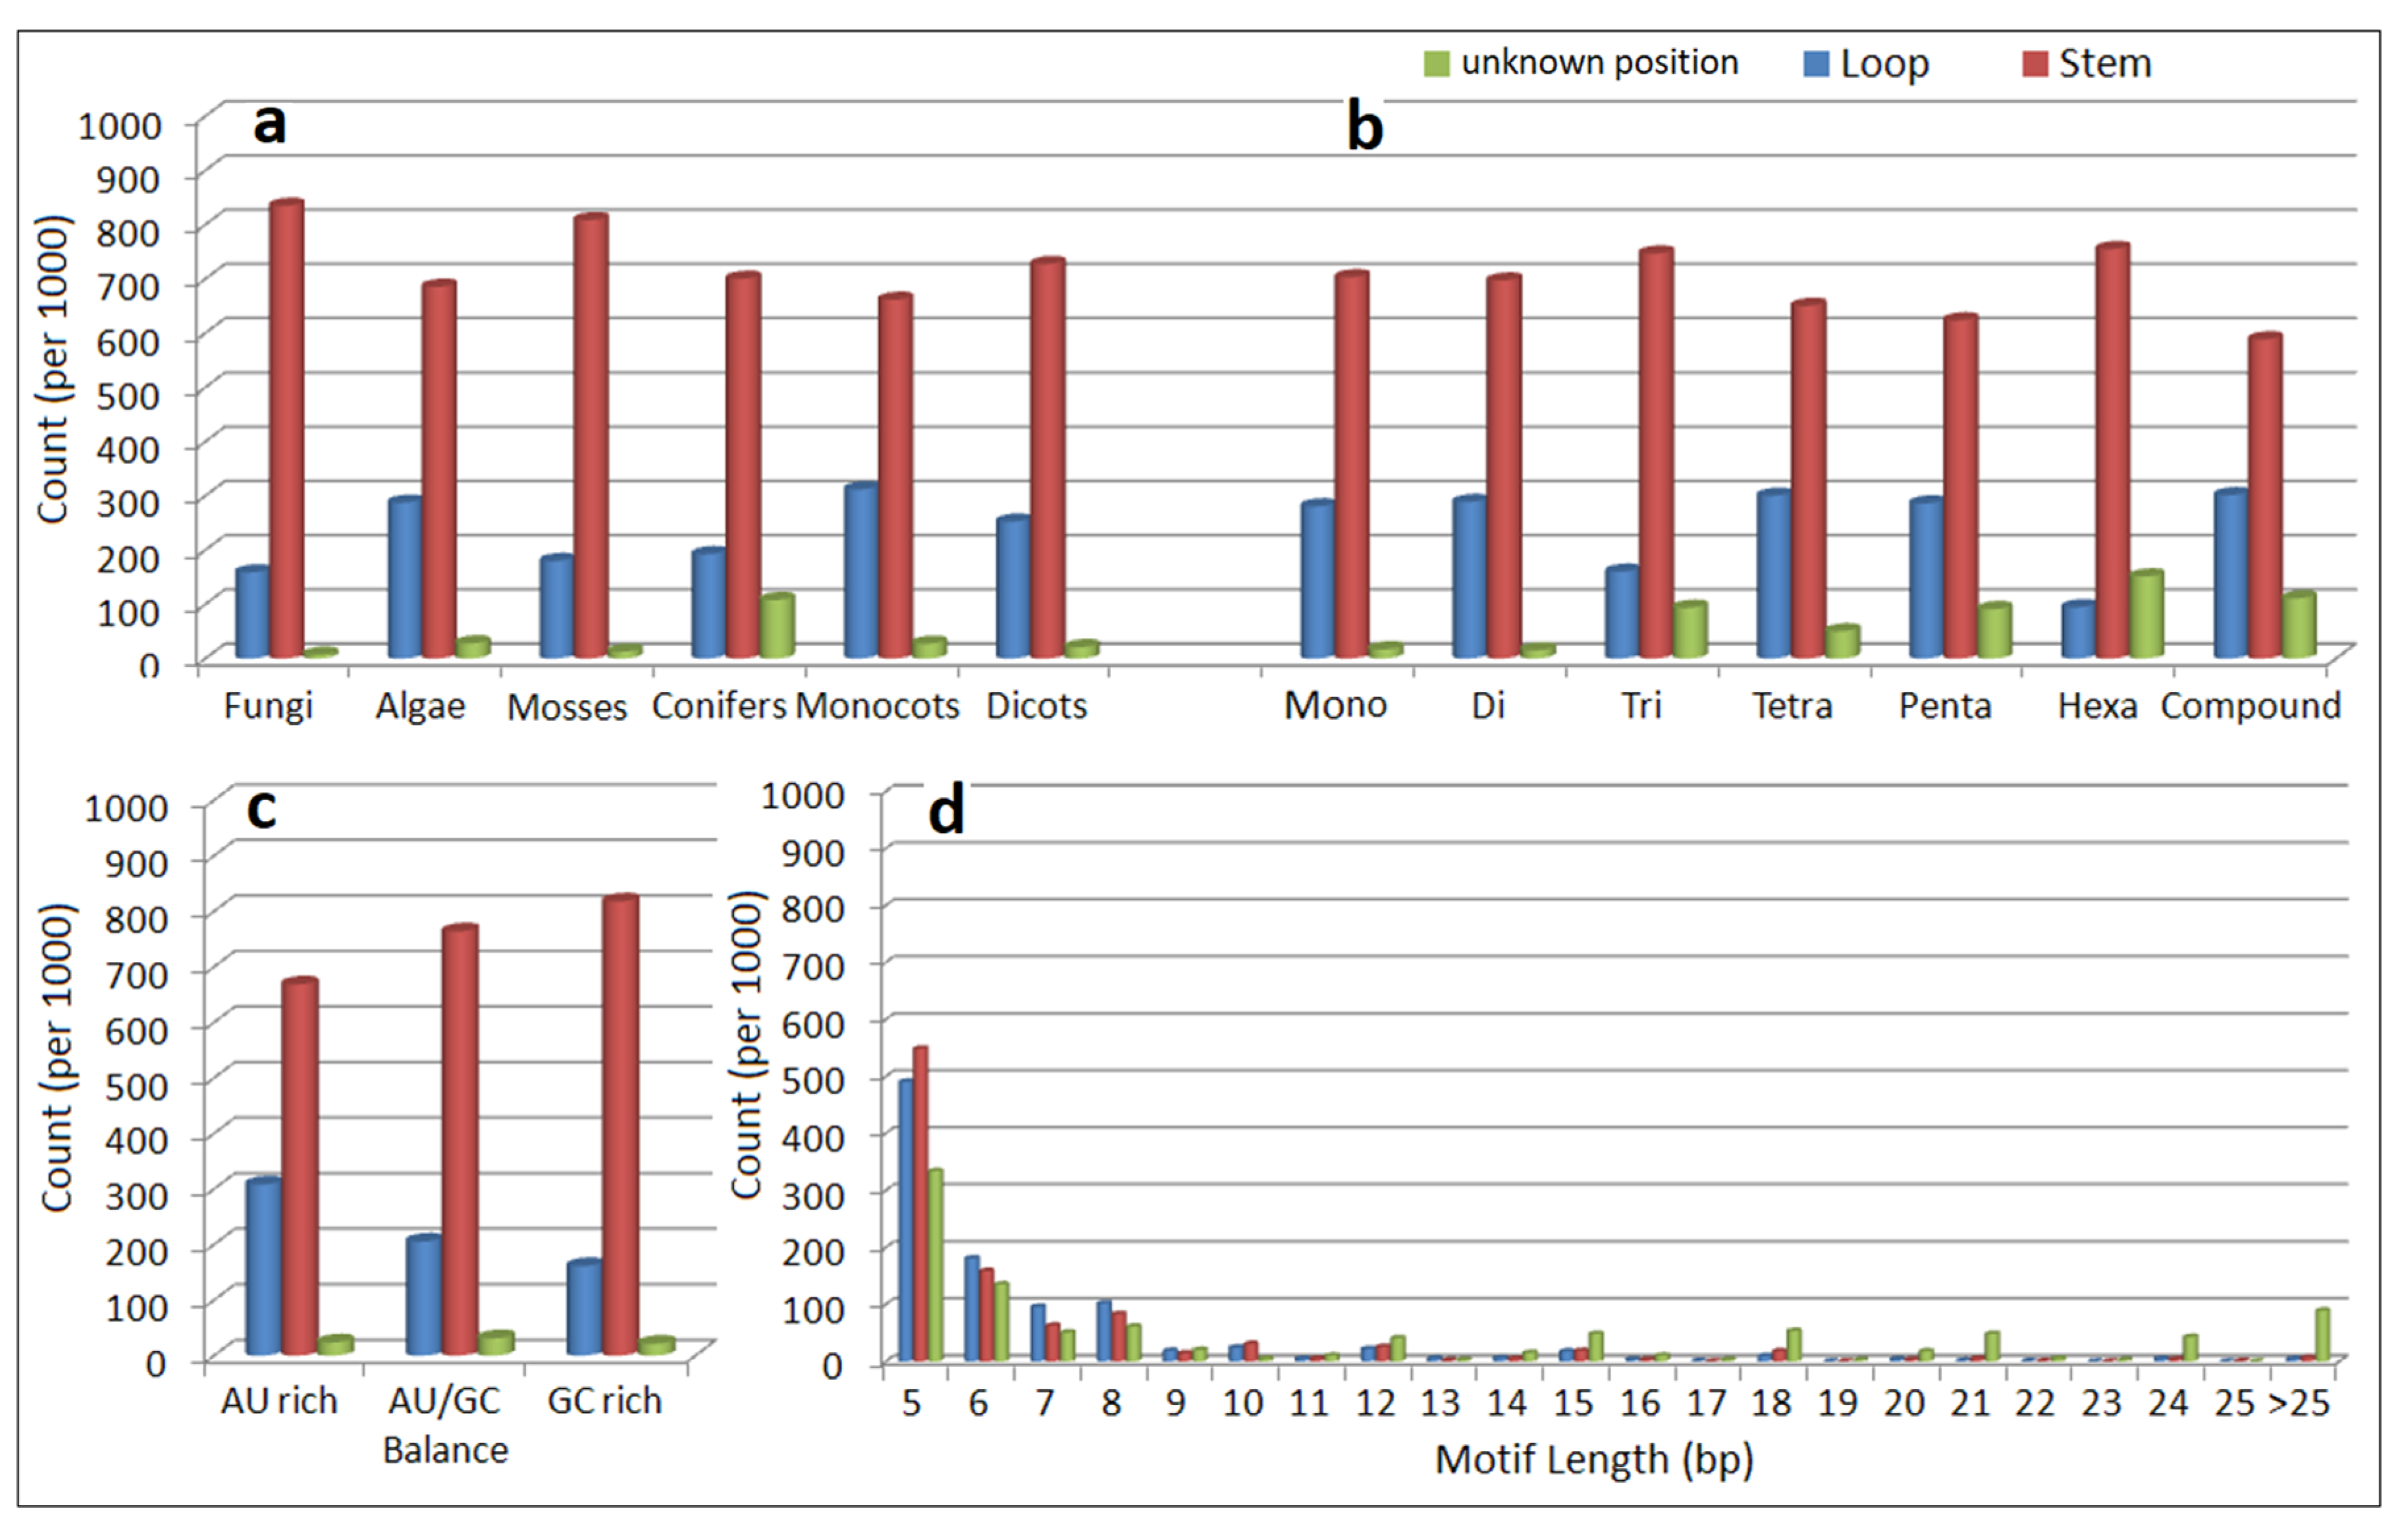
3.4. Location of Simple Sequence Repeat Loci in pre-microRNA Sequences

A comparative analysis of SSR motif localization on pre-miRNAs was conducted, and the results are summarized in Figure 3. In all plant taxonomic groups, most SSR motifs were in the stem of miRNAs. Similarly, most motifs, mono- to hexanucleotide, were in the stem of miRNAs. Overall, 20% of SSR motifs were in the loop of miRNAs.

3.5. Pre-microRNA Simple Sequence Repeat Marker Development and In Silico Characterization, Transferability, and Polymorphism Test

To maximize the utility of miRNA SSRs, primers were designed and their in silico transferability, polymorphism, and function were tested. The results are provided in Tables S5 and S6 and Figure 4. Among 16,531 SSR loci, 9498 (57.46%) could be used as markers. The remining 42.54% of loci failed to generate specific primers because of limited lengths of flanking sequences on both sides of the SSR tract. Some pre-miRNA sequences contained more than one SSR loci and, in those cases, multiple sets of primers were generated from the same pre-miRNA sequence. In most cases, the primer sequences of the multiple primer sets were the same; therefore, many duplicate primers were generated from multiple loci-containing sequences. To reduce primer redundancy, only one primer set was selected from one pre-miRNA sequence. In this study, 3573 non-redundant sets of pre-miRNA SSR primers were designed. Primer modeling success varied significantly among plant taxonomic groups. The highest and lowest primer modeling rates were noted in mosses (34.29%) and fungi (15.17%), respectively. Compound repeat loci had the highest percentage of primer modeling success, and they were followed by tetra-, di-, and monorepeat motifs (Figure 4a). Primer modeling success rate was also partitioned on the basis of the SSR type, nucleotide base composition of the SSR motif, and motif length in the six plant taxonomic groups (Figure 4b). In the analysis of nucleotide base composition of SSR motifs, AU-rich SSR loci had the best performance in primer modeling in all plant taxonomic groups except algae. The Class II-type SSR motif was better for primer modeling than the Class I-type SSR motif in all six plant taxonomic groups.
e-PCR was used to estimate the in silico transferability and polymorphism of miRNA SSRs. All non-redundant miRNA SSR primer pairs were blasted against 35 plant species from the six major plant groups, and 2341 (65.51%) of the miRNA SSRs were transferable to at least one of the six plant taxonomic groups. Thus, they were highly conserved among the plant species (Figure 4c). The highest number of markers was transferable to O. sativa (26.61%), followed by Arabidopsis (11.61%), P. glauca (11.08%), and P. virgatum (10.24%). Notably, two of the markers, PmiR03763 and PmiR09889, could be transferred to all taxonomic groups (Figure 4d). MicroRNA SSR markers were classified as either monomorphic or polymorphic based on their ePCR amplicon size variation, and 937 (26.22%) markers were monomorphic and 1404 (39.29%) were polymorphic.

3.6. PmiRNASSR (Plant microRNA Simple Sequence Repeat Marker) Database

To facilitate the wider use of SSRs associated with plant miRNAs, a freely accessible web-based, searchable and downloadable database was constructed. The database included 3573 miRNA SSR markers with the following features: motif repeats, motif length, SSR class (Class I or II), motif type, motif nucleotide base composition (AT-rich, GC-rich, AT–GC balanced), marker id, miRNA family, in silico transferability and polymorphic information. The marker information could be retrieved using the general search or customized search option (tools). General search tools facilitated the search of miRNA SSR marker information on the basis of single search parameters such as SSR type, SSR class, SSR motif richness and miRNA family. With the customized search tool, more specific miRNA SSR marker information could be extracted from the database using three parameters in different combinations based on user interest. The snapshots of the various features and utilities of the database are shown in Figure 5.
A search returns of all the information on markers as a list in tabular format, including marker id, SSR motif, motif type, motif nucleotide base composition, primer sequences, annealing temperature, PCR product size, flanking sequences, miRNA family, transferability and polymorphism. In addition, the database has two other link pages, home and about. The home page provides the basic information and objectives of the database. The about us page details the workflow, methodology applied and Perl script used in this study, as well as some additional data files and useful links. Furthermore, the database provides a download facility for the search data. The database can be accessed via the web link http://plantmirssr.enset-project.org/index.html (Mirror: http://genomicsres.org/plantmirssr/).

4. Discussion

Plant pre-miRNAs are found in the intronic, exonic and intergenic regions of genomes [28], and they are typically associated with at least some microsatellites. The availability of plant pre-miRNA sequences provides opportunities to analyze the sequences for microsatellites. A total of 16892 plant pre-miRNA sequences from 292 plant species were screened for microsatellites, and many contained at least one microsatellite repeat. This finding suggested that microsatellites played important roles in pre-miRNA structure, function and evolution. A comprehensive analysis of SSRs in animal pre-miRNAs found similar results [42]. The distribution of SSRs in plant pre-miRNAs varied not only among taxonomic groups but also among species (Figure 1). As expected, SSR loci were shorter in pre-miRNA sequences than in other genomic regions (e.g., genes, CDS, mRNA and introns), because pre-miRNA sequences are much shorter than those of other genomic regions.
Among tandem repeat unit classes in plant pre-miRNAs, the most abundant were mono and di repeats, which were also observed in other genomic regions of plant species [7]. The distributions of poly (A/U) and poly (G/C) repeats in plant pre-miRNAs were compared among the plant taxonomic groups, and poly (A/U) repeats were more abundant than poly (G/C) repeats in all taxonomic groups except algae. Similar results were reported for animal pre-miRNAs [42]. The dominance of poly (G/C) repeats in pre-miRNAs of algae was correlated with a higher GC content in algal pre-miRNAs (Figure 1c), and in algae as a whole [7]. Overall, the repeat unit characteristics in pre-miRNAs depended strongly on the species as well as the nucleotide composition in the genome. According to a previous study [7], the dominant dinucleotide repeats units are AG/CT in ferns, mosses, monocots and dicots, whereas AC/GT and AT/TA are dominant in algae and pines. Notably, in this study, the most abundant dinucleotide repeats in plant pre-miRNAs were AG/CU repeats, except in those of algae.
Microsatellites are usually classified into two categories according to their length, i.e., ≥20 nt (class I) and <20 nt (class II) [44]. In the plant pre-miRNAs, very few SSRs were longer than 8 to 12 nt, with most measuring 6 to 8 nt. Because pre-miRNAs are short elements, it is possible that they cannot host long repeats, and, seemingly, microsatellites cannot significantly expand the size of pre-miRNAs. This conclusion is consistent with the general recognition that miRNAs are highly conserved elements [28]. Therefore, the substantial contributions of microsatellites in those elements found in this survey could even be considered unexpected.
In this study, 80% of SSR motifs were in the stem of miRNAs. Thus, it was assumed the stem was the preferred position of SSRs within the pre-miRNA sequences. The remaining 20% of SSR motifs were in the loop nucleotides of the pre-miRNAs, where they may interfere with the stem–loop structure by the concatenation or deduction of SSR motifs. The pre-miRNA loop nucleotides may be important in controlling the activity of miRNA genes [42]. Even members of the same miRNA gene family show different functional activities caused by alternations in their pre-miRNA loop sequences or structures. Chen et al. [42] proposed that SSR variation within the pre-miRNAs was critical for normal miRNA activity because the insertion or deletion of SSRs in pre-miRNAs directly affected the corresponding miRNA products. Thus, the SSR variation in the miRNA loop may alter the biogenesis, structure, function, and evolution of miRNAs.
The development and validation of SSR markers from SSR-bearing “pre-miRNA candidates” were recently achieved in several crop species, including rice [45], Arabidopsis thaliana [46], Brassica [47], Medicago truncatula [48], pomegranate [49], Melilotus albus [50], and wheat [51,52]. Despite the many SSR-bearing “pre-miRNA candidates” from a wide range of plant species, these candidates were not explored for marker development. Therefore, in this study, 8651 SSR-bearing “pre-miRNA candidates” from 292 plant species were examined for potential markers; the markers were then in silico characterized and tested for cross-taxa transferability and polymorphism. Lastly, an online database was developed for the miRNA SSR markers. The study revealed that a significant number of SSR-bearing “pre-miRNA candidates” had a high potential for therapeutic SSR marker development. Similar results were reported in rice, Medicago, and pomegranate.
Genome-wide SSR markers and marker-based online resources were developed for crop plants. However, similar approaches have not yet been applied for SSR-bearing “pre-miRNA candidates” in different plant species. Therefore, previous approaches were replicated, and the first online SSR marker database for SSR-bearing plant “pre-miRNA candidates” was developed. The unique, freely accessible database accelerates the general research on miRNA SSRs, as well as that on the molecular breeding programs of 292 plant species.

5. Conclusions

In the present study, 8651 (51%) pre-miRNA SSR candidates were identified from 292 plant species. A total of 9498 (57%) SSR loci had the potential to be pre-miRNA SSR markers. Subsequently, the selected pre-miRNA SSR markers were in silico characterized. Lastly, an online, freely accessible marker database was developed to increase the use of the pre-miRNA SSR markers. The database contains the largest, freely available dataset of pre-miRNA SSR markers for plant species. The database is the first genomic resource for pre-miRNA SSR markers and is an excellent source of molecular markers for plant molecular breeding studies.

Supplementary Materials

The following are available online at https://www.mdpi.com/article/10.3390/agronomy11112298/s1. Table S1. List of plant species in different taxonomic groups and number of pre-microRNA sequences per plant species. Table S2. Longest simple sequence repeats (SSR) contained in pre-microRNA sequences. Table S3. Coefficients of quadratic regressions of relations between simple sequence repeat (SSR) frequency and density and AT content. Table S4. Coefficients of quadratic regressions of relations between simple sequence repeat (SSR) subgroups and AT content. Table S5. Summary of pre-miRNA simple sequence repeat (SSR) markers. Table S6. Distribution of pre-miRNA simple sequence repeat (SSR) markers among different classes of SSR.

Author Contributions

All authors contributed substantially to this work. Conceptualization: M.K.B. and G.Y.; methodology: M.K.B., G.D. and D.B.; software: M.K.B. and D.B.; formal analysis: M.K.B., M.B. and G.D.; investigation: M.K.B. and G.D.; data curation: D.B., M.B.; writing—original draft preparation: M.K.B.; writing—review and editing: M.K.B. and G.Y; supervision: G.Y. and G.D.; project administration: G.D.; funding acquisition: G.Y. All authors have read and agreed to the published version of the manuscript.

Funding

This research was funded by the National Natural Science Foundation of China (Category: International (Regional) Cooperation and Exchange Program; Program: Research Fund for International Young Scientist, FY2015 (Grant no.: 31550110217); the China Post Doc Council; the National Key Research and Development Project (2018YFD1000102); the National Natural Science Foundation of China (31601720); the Guangdong Science and Technology Project (2019B030316007); the Special Fund for Scientific Innovation Strategy-Construction of High Level Academy of Agriculture Science (R2018PY-QY004); the Guangzhou National Modern Agricultural Industry Science and Technology Innovation Centre Project (2018kczx06), and the National Banana Industry and Technology System Project (CARS-31-01).

Institutional Review Board Statement

Not applicable.

Informed Consent Statement

Not applicable.

Data Availability Statement

Data are contained within the article or in the Supplementary Materials.

Acknowledgments

The authors thank the personnel of the China Postdoc Council, NSF; Guangdong Science and Technology; Guangzhou National modern Agricultural Industry Science and Technology Innovation Centre; National Banana Industry and Technology System; and those in the finance and administration sectors of the Institution of Fruit Tree Research, Guangdong Academy of Agricultural Sciences, Guangzhou, Guangdong Province, China. The authors are also grateful to Christoph Mayer from the Forschungsmuseum Alexander Koenig, Bonn, Adenauerallee 160, 53113 Bonn, Germany for his advice, review the MS and data analysis.

Conflicts of Interest

Authors declare no conflict of interest.

References

  1. Karaoglu, H.; Lee, C.; Meyer, W. Survey of Simple Sequence Repeats in Completed Fungal Genomes. Mol. Biol. Evol. 2005, 22, 639–649. [Google Scholar] [CrossRef] [PubMed]
  2. Kim, T.-S.; Booth, J.G.; Gauch, H.G.; Sun, Q.; Park, J.; Lee, Y.-H.; Lee, K. Simple sequence repeats in Neurospora crassa: Distribution, polymorphism and evolutionary inference. BMC Genom. 2008, 9, 31. [Google Scholar] [CrossRef] [Green Version]
  3. Tóth, G.; Gáspári, Z.; Jurka, J. Microsatellites in Different Eukaryotic Genomes: Survey and Analysis. Genome Res. 2000, 10, 967–981. [Google Scholar] [CrossRef] [Green Version]
  4. Katti, M.V.; Ranjekar, P.K.; Gupta, V.S. Differential Distribution of Simple Sequence Repeats in Eukaryotic Genome Sequences. Mol. Biol. Evol. 2001, 18, 1161–1167. [Google Scholar] [CrossRef] [Green Version]
  5. Heesacker, A.; Kishore, V.K.; Gao, W.; Tang, S.; Kolkman, J.M.; Gingle, A.; Matvienko, M.; Kozik, A.; Michelmore, R.M.; Lai, Z.; et al. SSRs and INDELs mined from the sunflower EST database: Abundance, polymorphisms, and cross-taxa utility. Theor. Appl. Genet. 2008, 117, 1021–1029. [Google Scholar] [CrossRef] [PubMed]
  6. Li, Y.-C.; Korol, A.B.; Fahima, T.; Nevo, E. Microsatellites within Genes: Structure, Function, and Evolution. Mol. Biol. Evol. 2004, 21, 991–1007. [Google Scholar] [CrossRef]
  7. Victoria, F.; da Maia, L.; de Oliveira, A. In silico comparative analysis of SSR markers in plants. BMC Plant Biol. 2011, 11, 15. [Google Scholar] [CrossRef] [Green Version]
  8. Fondon, J.W.; Garner, H.R. Molecular origins of rapid and continuous morphological evolution. Proc. Natl. Acad. Sci. USA 2004, 101, 18058–18063. [Google Scholar] [CrossRef] [Green Version]
  9. Kashi, Y.; King, D.G. Simple sequence repeats as advantageous mutators in evolution. Trends Genet. 2006, 22, 253–259. [Google Scholar] [CrossRef] [Green Version]
  10. Kashi, Y.; King, D.; Soller, M. Simple sequence repeats as a source of quantitative genetic variation. Trends Genet. 1997, 13, 74–78. [Google Scholar] [CrossRef]
  11. Trifonov, E.N. Tuning function of tandemly repeating sequences: A molecular device for fast adaptation. In Evolutionary Theory and Processes: Modern Horizons; Springer: Berlin/Heidelberg, Germany, 2004; pp. 115–138. [Google Scholar]
  12. Schlotterer, C. The evolution of molecular markers [mdash] just a matter of fashion? Nat. Rev. Genet. 2004, 5, 63–69. [Google Scholar] [CrossRef] [PubMed]
  13. Pereira, J.F.; Consoli, L.; Bombonatto, E.A.D.S.; Bonato, A.L.V.; Maciel, J.L.N. Development of Genomic SSR Markers and Molecular Characterization of Magnaporthe oryzae Isolates from Wheat in Brazil. Biochem. Genet. 2014, 52, 52–70. [Google Scholar] [CrossRef] [Green Version]
  14. Jing, Z.; Wang, X.; Cheng, J. Analysis of genetic diversity among Chinese wild Vitis species revealed with SSR and SRAP markers. Genet. Mol. Res. 2013, 12, 1962–1973. [Google Scholar] [CrossRef] [PubMed]
  15. Würschum, T.; Langer, S.M.; Longin, C.F.H.; Korzun, V.; Akhunov, E.; Ebmeyer, E.; Schachschneider, R.; Schacht, J.; Kazman, E.; Reif, J.C. Population structure, genetic diversity and linkage disequilibrium in elite winter wheat assessed with SNP and SSR markers. Theor. Appl. Genet. 2013, 126, 1477–1486. [Google Scholar] [CrossRef] [PubMed]
  16. Khaing, A.; Moe, K.; Hong, W.; Park, C.; Yeon, K.; Park, H.; Kim, D.; Choi, B.; Jung, J.; Chae, S.; et al. Phylogenetic relationships of chrysanthemums in Korea based on novel SSR markers. Genet. Mol. Res. 2013, 12, 5335–5347. [Google Scholar] [CrossRef]
  17. Rauscher, G.; Simko, I. Development of genomic SSR markers for fingerprinting lettuce (Lactuca sativa L.) cultivars and mapping genes. BMC Plant Biol. 2013, 13, 11. [Google Scholar] [CrossRef] [Green Version]
  18. Akfirat, F.S.; Uncuoglu, A.A. Genetic Diversity of Winter Wheat (Triticum aestivum L.) Revealed by SSR Markers. Biochem. Genet. 2012, 51, 223–229. [Google Scholar] [CrossRef]
  19. Kayesh, E.; Zhang, Y.; Liu, G.; Bilkish, N.; Sun, X.; Leng, X.; Fang, J. Development of highly polymorphic EST-SSR markers and segregation in F1 hybrid population of Vitis vinifera L. Genet. Mol. Res. 2013, 12, 3871–3878. [Google Scholar] [CrossRef]
  20. Ting, N.-C.; Jansen, J.; Nagappan, J.; Ishak, Z.; Chin, C.-W.; Tan, S.-G.; Cheah, S.-C.; Singh, R. Identification of QTLs Associated with Callogenesis and Embryogenesis in Oil Palm Using Genetic Linkage Maps Improved with SSR Markers. PLoS ONE 2013, 8, e53076. [Google Scholar] [CrossRef] [Green Version]
  21. Chu, C.-G.; Chao, S.; Friesen, T.L.; Faris, J.; Zhong, S.; Xu, S.S. Identification of novel tan spot resistance QTLs using an SSR-based linkage map of tetraploid wheat. Mol. Breed. 2009, 25, 327–338. [Google Scholar] [CrossRef]
  22. Biswas, M.K.; Bagchi, M.; Nath, U.K.; Biswas, D.; Natarajan, S.; Jesse, D.M.I.; Park, J.-I.; Nou, I.-S. Transcriptome wide SSR discovery cross-taxa transferability and development of marker database for studying genetic diversity population structure of Lilium species. Sci. Rep. 2020, 10, 1–13. [Google Scholar] [CrossRef] [PubMed]
  23. Biswas, M.K.; Nath, U.K.; Howlader, J.; Bagchi, M.; Natarajan, S.; Kayum, A.; Kim, H.-T.; Park, J.-I.; Kang, J.-G.; Nou, I.-S. Exploration and Exploitation of Novel SSR Markers for Candidate Transcription Factor Genes in Lilium Species. Genes 2018, 9, 97. [Google Scholar] [CrossRef] [PubMed] [Green Version]
  24. Sharma, P.C.; Grover, A.; Kahl, G. Mining microsatellites in eukaryotic genomes. Trends Biotechnol. 2007, 25, 490–498. [Google Scholar] [CrossRef]
  25. Biswas, M.K.; Bagchi, M.; Biswas, D.; Harikrishna, J.A.; Liu, Y.; Li, C.; Sheng, O.; Mayer, C.; Yi, G.; Deng, G. Genome-Wide Novel Genic Microsatellite Marker Resource Development and Validation for Genetic Diversity and Population Structure Analysis of Banana. Genes 2020, 11, 1479. [Google Scholar] [CrossRef]
  26. Biswas, M.K.; Darbar, J.N.; Borrell, J.S.; Bagchi, M.; Biswas, D.; Nuraga, G.W.; Demissew, S.; Wilkin, P.; Schwarzacher, T.; Heslop-Harrison, J.S. The landscape of microsatellites in the enset (Ensete ventricosum) genome and web-based marker resource development. Sci. Rep. 2020, 10, 1–11. [Google Scholar] [CrossRef]
  27. Biswas, M.K.; Liu, Y.; Li, C.; Sheng, O.; Mayer, C.; Yi, G. Genome-Wide Computational Analysis of Musa Microsatellites: Classification, Cross-Taxon Transferability, Functional Annotation, Association with Transposons & miRNAs, and Genetic Marker Potential. PLoS ONE 2015, 10, e0131312. [Google Scholar] [CrossRef] [Green Version]
  28. Bartel, D.P. MicroRNAs: Genomics, Biogenesis, Mechanism, and Function. Cell 2004, 116, 281–297. [Google Scholar] [CrossRef] [Green Version]
  29. Frazier, T.P.; Xie, F.; Freistaedter, A.; Burklew, C.E.; Zhang, B. Identification and characterization of microRNAs and their target genes in tobacco (Nicotiana tabacum). Planta 2010, 232, 1289–1308. [Google Scholar] [CrossRef]
  30. Dhandapani, V.; Ramchiary, N.; Paul, P.; Kim, J.; Choi, S.H.; Lee, J.; Hur, Y.; Lim, Y.P. Identification of potential microRNAs and their targets in Brassica rapa L. Mol. Cells 2011, 32, 21–37. [Google Scholar] [CrossRef] [Green Version]
  31. Zhang, Z.; Yu, J.; Li, D.; Zhang, Z.; Liu, F.; Zhou, X.; Wang, T.; Ling, Y.; Su, Z. PMRD: Plant microRNA database. Nucleic Acids Res. 2010, 38, D806–D813. [Google Scholar] [CrossRef] [Green Version]
  32. Joy, N.; Soniya, E.V. Identification of an miRNA candidate reflects the possible significance of transcribed microsatellites in the hairpin precursors of black pepper. Funct. Integr. Genom. 2012, 12, 387–395. [Google Scholar] [CrossRef] [PubMed]
  33. Liu, Q.; Wang, H.; Zhu, L.; Hu, H.; Sun, Y. Genome-wide identification and analysis of miRNA-related single nucleotide polymorphisms (SNPs) in rice. Rice 2013, 6, 1–10. [Google Scholar] [CrossRef] [Green Version]
  34. Gong, J.; Tong, Y.; Zhang, H.-M.; Wang, K.; Hu, T.; Shan, G.; Sun, J.; Guo, A.-Y. Genome-wide identification of SNPs in microRNA genes and the SNP effects on microRNA target binding and biogenesis. Hum. Mutat. 2012, 33, 254–263. [Google Scholar] [CrossRef]
  35. Altschul, S.F.; Gish, W.; Miller, W.; Myers, E.W.; Lipman, D.J. Basic local alignment search tool. J. Mol. Biol. 1990, 215, 403–410. [Google Scholar] [CrossRef]
  36. Zuker, M. Mfold web server for nucleic acid folding and hybridization prediction. Nucleic Acids Res. 2003, 31, 3406–3415. [Google Scholar] [CrossRef]
  37. Das, A.; Mondal, T.K. Computational Identification of Conserved microRNAs and Their Targets in Tea (Camellia sinensis). Am. J. Plant Sci. 2010, 01, 77–86. [Google Scholar] [CrossRef] [Green Version]
  38. Zhang, B.; Pan, X.; Cannon, C.H.; Cobb, G.P.; Anderson, T.A. Conservation and divergence of plant microRNA genes. Plant J. 2006, 46, 243–259. [Google Scholar] [CrossRef]
  39. Li, X.; Hou, Y.; Zhang, L.; Zhang, W.; Quan, C.; Cui, Y.; Bian, S. Computational identification of conserved microRNAs and their targets from expression sequence tags of blueberry (Vaccinium corybosum). Plant Signal. Behav. 2014, 9, e29462. [Google Scholar] [CrossRef] [Green Version]
  40. Zhang, B.H.; Pan, X.P.; Cox, S.B.; Cobb, G.; Anderson, T.A. Evidence that miRNAs are different from other RNAs. Cell. Mol. Life Sci. 2006, 63, 246–254. [Google Scholar] [CrossRef] [PubMed]
  41. Gur-Arie, R.; Cohen, C.J.; Eitan, Y.; Shelef, L.; Hallerman, E.M.; Kashi, Y. Simple Sequence Repeats in Escherichia coli: Abundance, Distribution, Composition, and Polymorphism. Genome Res. 2000, 10, 62–71. [Google Scholar]
  42. Chen, M.; Tan, Z.; Zeng, G.; Peng, J. Comprehensive Analysis of Simple Sequence Repeats in Pre-miRNAs. Mol. Biol. Evol. 2010, 27, 2227–2232. [Google Scholar] [CrossRef] [PubMed] [Green Version]
  43. You, F.M.; Huo, N.; Gu, Y.Q.; Luo, M.-C.; Ma, Y.; Hane, D.; Lazo, G.R.; Dvorak, J.; Anderson, O.D. BatchPrimer3: A high throughput web application for PCR and sequencing primer design. BMC Bioinform. 2008, 9, 1–13. [Google Scholar] [CrossRef] [Green Version]
  44. Rajendrakumar, P.; Biswal, A.K.; Balachandran, S.M.; Srinivasarao, K.; Sundaram, R.M. Simple sequence repeats in organellar genomes of rice: Frequency and distribution in genic and intergenic regions. Bioinformatics 2007, 23, 1–4. [Google Scholar] [CrossRef] [Green Version]
  45. Ganie, S.A.; Mondal, T.K. Genome-wide development of novel miRNA-based microsatellite markers of rice (Oryza sativa) for genotyping applications. Mol. Breed. 2015, 35, 1–12. [Google Scholar] [CrossRef]
  46. Gautam, V.; Singh, A.; Verma, S.; Kumar, A.; Kumar, P.; Mahima; Singh, S.; Mishra, V.; Sarkar, A.K. Role of miRNAs in root development of model plant Arabidopsis thaliana. Indian J. Plant Physiol. 2017, 22, 382–392. [Google Scholar] [CrossRef]
  47. Singh, I.; Smita, S.; Mishra, D.C.; Kumar, S.; Singh, B.K.; Rai, A. Abiotic stress responsive miRNA-target network and related markers (SNP, SSR) in Brassica juncea. Front. Plant Sci. 2017, 8, 1943. [Google Scholar] [CrossRef] [PubMed] [Green Version]
  48. Min, X.; Zhang, Z.; Liu, Y.; Wei, X.; Liu, Z.; Wang, Y.; Liu, W. Genome-wide development of microRNA-based SSR markers in Medicago truncatula with their transferability analysis and utilization in related legume species. Int. J. Mol. Sci. 2017, 18, 2440. [Google Scholar] [CrossRef] [Green Version]
  49. Patil, P.G.; Singh, N.; Parashuram, S.; Bohra, A.; Mundewadikar, D.M.; Sangnure, V.R.; Babu, K.D.; Sharma, J. Genome wide identification, characterization and validation of novel miRNA-based SSR markers in pomegranate (Punica granatum L.). Physiol. Mol. Biol. Plants 2020, 26, 683–696. [Google Scholar] [CrossRef]
  50. Kanzana, G.; Musaza, J.; Wu, F.; Ouyang, Z.; Wang, Y.; Ma, T.; Akoy, B.I.R.; Zhang, J. Genome-wide development and application of miRNA-SSR markers in Melilotus genus. Physiol. Mol. Biol. Plants 2021, 27, 2269–2282. [Google Scholar] [CrossRef]
  51. Sharma, P.; Mehta, G.; Shefali; Muthusamy, S.K.; Singh, S.K.; Singh, G.P. Development and validation of heat-responsive candidate gene and miRNA gene based SSR markers to analysis genetic diversity in wheat for heat tolerance breeding. Mol. Biol. Rep. 2021, 48, 381–393. [Google Scholar] [CrossRef]
  52. Tyagi, S.; Kumar, A.; Gautam, T.; Pandey, R.; Rustgi, S.; Mir, R.R. Development and use of miRNA-derived SSR markers for the study of genetic diversity, population structure, and characterization of genotypes for breeding heat tolerant wheat varieties. PLoS ONE 2021, 16, e0231063. [Google Scholar] [CrossRef] [PubMed]
Figure 1. Frequency and distribution of simple sequence repeats (SSR) in pre-microRNAs in six different plant taxonomic groups. (a) Frequency distribution of number of SSR motifs; (b) frequency distribution of motif length; (c) nucleotide base composition of different types of SSR motifs and (d) localization of SSR motifs on stem–loop structure among different data sets.
Agronomy 11 02298 g001
Figure 2. Relations between GC/AT content and simple sequence repeat (SSR) frequency and density.
Agronomy 11 02298 g002
Figure 3. Locations of simple sequence repeats in stems and loops of pre-microRNA sequences. (a) Locations in six plant taxonomic groups; (b) locations of different motifs; (c) locations by nucleotide composition of motifs and (d) locations based on motif lengths.
Agronomy 11 02298 g003
Figure 4. Comparative features of pre-microRNA simple sequence repeat (SSR) primers and in silico characterization, transferability and polymorphism of SSR markers. (a) Primer modeling success (%); (b) primer modeling success rate partitioned on the basis of SSR type, nucleotide base composition of SSR motif and motif length; (c) transferability (%) and polymorphism (%) of SSR markers among 34 species and (d) number of transferable SSR markers among six plant taxonomic groups.
Agronomy 11 02298 g004
Figure 5. Flow of a search in PmiRNASSRdb (plant microRNA simple sequence repeat database). (a) Home page, (b) marker search interface, (c) query result, and (d) detailed information on each marker.
Agronomy 11 02298 g005
Table 1. Summary of in silico simple sequence repeat (SSR) mining in plant pre-microRNA sequences (PMS).
ItemFungiAlgaeMossesConifersMonocotsDicotsOverall
No. of species23631056194292
No. of analyzed PMS451094252486838922716892
Range length of PMS106–86565–93267–53358–65045–91041–102141–1021
Average length of PMS370241158150142141200
Total length of PMS16,65926,25867,25837,139973,2001,300,5622,421,076
Average GC content48.3957.5847.7746.2344.4544.3748
No. of non-SSR PMS760265154337343828241
No. of SSR-containing PMS384916094346548458651
% of SSR-containing PMS84453838515351
Total no. of SSRs1451082451306754914916531
Density of SSRs per bp of PMS115243275286144142146
Range of SSR occurrence in PMS1–131–121–51–41–101–291–29
Average no. of SSRs per PMS3.210.60.5111.2
Class I SSRs2575573286401
Class II SSRs1201012401256681886316,130
GC-rich SSRs37785228107117863052
AU-rich SSRs8928152945330672412417
GC–AU balanced SSRs1924183536391062
Table 2. Number of pre-microRNA sequences (PMS) and absolute and relative numbers of simple sequence repeats in different plant taxonomic groups.
Plant
Groups
No. of PMSRepeat TypeTotal
MonoDiTriTetraPentaHexaCompound
Fungi4579(1.76)5(0.11)20(0.45)0(0.00)2(0.04)17(0.38)22(0.49)145(3.22)
Algae10971(0.65)5(0.05)28(0.26)0(0.00)0(0.00)2(0.02)2(0.02)108(0.99)
Mosses425183(0.43)43(0.10)11(0.03)0(0.00)6(0.01)1(0.00)1(0.00)245(0.56)
Conifers248109(0.44)8(0.03)8(0.03)0(0.00)1(0.00)2(0.01)2(0.01)130(0.52)
Monocots68385725(0.84)698(0.10)138(0.02)12(0.00)44(0.01)49(0.01)88(0.01)6754(0.99)
Dicots92277454(0.81)791(0.07)533(0.06)8(0.00)101(0.01)88(0.01)174(0.02)9149(0.99)
Total16,89213,621(0.81)1550(0.09)738(0.04)20(0.00)154(0.01)159(0.01)289(0.02)
Publisher’s Note: MDPI stays neutral with regard to jurisdictional claims in published maps and institutional affiliations.

