Communication

Implications of Experimental Design on Predicting Economic Optimum Nitrogen Rates in Rice

1
Delta Irrigation Design, LLC, Little Rock, AR 72217, USA
2
Mississippi Water Resources Research Institute, Mississippi State University, Mississippi State, MS 39762, USA
3
Delta Research and Extension Center, Mississippi State University, Stoneville, MS 38776, USA
4
Department of Plant and Soil Sciences, Mississippi State University, Mississippi State, MS 39762, USA
5
Horizon Ag, LLC, Memphis, TN 38125, USA
6
Office of the Area Director, USDA-ARS, Stoneville, MS 38776, USA
*
Author to whom correspondence should be addressed.
Agronomy 2021, 11(11), 2296; https://doi.org/10.3390/agronomy11112296
Submission received: 7 October 2021 / Revised: 29 October 2021 / Accepted: 10 November 2021 / Published: 12 November 2021

Abstract

:
Nitrogen (N) response studies in rice (Oryza sativa L.) are conducted to provide grower recommendations with economically optimum N rates (EONRs). This study was conducted to determine if experimental design alters the predicted EONR for rice. The effects of experimental design and soil texture on predicted EONR were investigated near Arcola, Greenville, Minter City, and Shaw, MS on soil textures ranging from sandy loam to clay. The response of rice grain yield to seven N fertilizer rates was fitted with a quadratic equation, and the quadratic trend was compared between the randomized complete block (RCB) and split-plot (SP) designs. No differences were detected between RCB and SP designs for rice grain yield response to N rate; therefore, either design, RCB or SP, would be appropriate for use in N response studies for rice.

1. Introduction

Rice (Oryza sativa L.) is produced on approximately 160 million hectares worldwide and is the primary staple for over half of the global population [1]. Nearly 90% of rice is grown in Asia, while less than 2% is produced in the US [1]. In Mississippi, rice is the fourth largest crop by hectarage and 500,000 metric tons are produced annually [2]. Across the southern region of the US, including Mississippi, rice is produced in the drill-seeded, delayed flood production system where rice is grown upland until the four- to the five-leaf stage, at which time a flood is established [3].
Historically, nitrogen (N) fertilizer recommendations for rice have been defined according to the current inbred or hybrid cultivars being grown and are modified according to soil texture, tillage system, seedbed condition, and previous crop [4,5]. Fertilizer recommendations are derived from response data generated each year by university scientists across multiple locations [6]. Annual N response experiments are necessary because of the dynamic nature of N, especially in the dry-seeded, delayed-flood rice culture common to much of the southern US.
Currently, N response experiments for rice are conducted in small-plot trials with a minimum of three replications arranged in a randomized complete block (RCB) design [4,5,6]. In this experimental design, factors such as rice cultivars and N rates are randomized within each replication, and adjacent plots have different fertilizer treatments. Plots are harvested and yield data are subjected to a quadratic response curve to predict economically optimum nitrogen rates (EONRs) for newly released rice cultivars in the mid-southern US [6].
In an RCB design, the interaction of adjacent experimental units can increase error and decrease the accuracy of the response model through border effects, particularly in grain crops with narrow row spacing [7]. Gomez and Gomez (1984) reported differences in grain yield between the outer and inner rows in fertilized and non-fertilized plots. An interaction between the adjacent N rate and the outside rows was detected; however, the N rate of adjacent plots did not impact yield on the inner rows. When adjacent units receive different fertilizer treatments, border effects can be expected if a levee is not constructed between experimental units [8]. However, constructing levees between plots is not practical for US rice research programs, primarily due to a lack of time for field preparation prior to planting.
A practical solution to mitigate experimental error associated with outside rows is to remove the outermost rows of each experimental unit before data analysis, as is practiced by several US researchers. For example, nitrogen response experiments conducted in Arkansas use a custom-built combine header to harvest the middle four rows [9], the middle five rows [10,11,12], or five to eight of nine rows [13]. However, the International Rice Research Institute (IRRI) concluded that rice grain yield was no different if outside rows were included or excluded in the analysis.
Another method to minimize border effects is through experimental design. Grouping homogeneous treatments, as in a split-plot (SP) design with fertilizer as the main-plot factor, allows the grouping of plots with similar fertilizer rates, thus minimizing fertilizer competition [7]. The disadvantage of the split-plot design is that the error terms associated with the main units will likely be greater compared to an experimental design with no block component [14]. This is especially true if the main unit error is a large source of the total variability. The objective of this study was to determine if experimental design, RCB vs. SP, alters the predicted EONR for rice N rate response experiments on clay and silt loam textured soils in Mississippi.

2. Materials and Methods
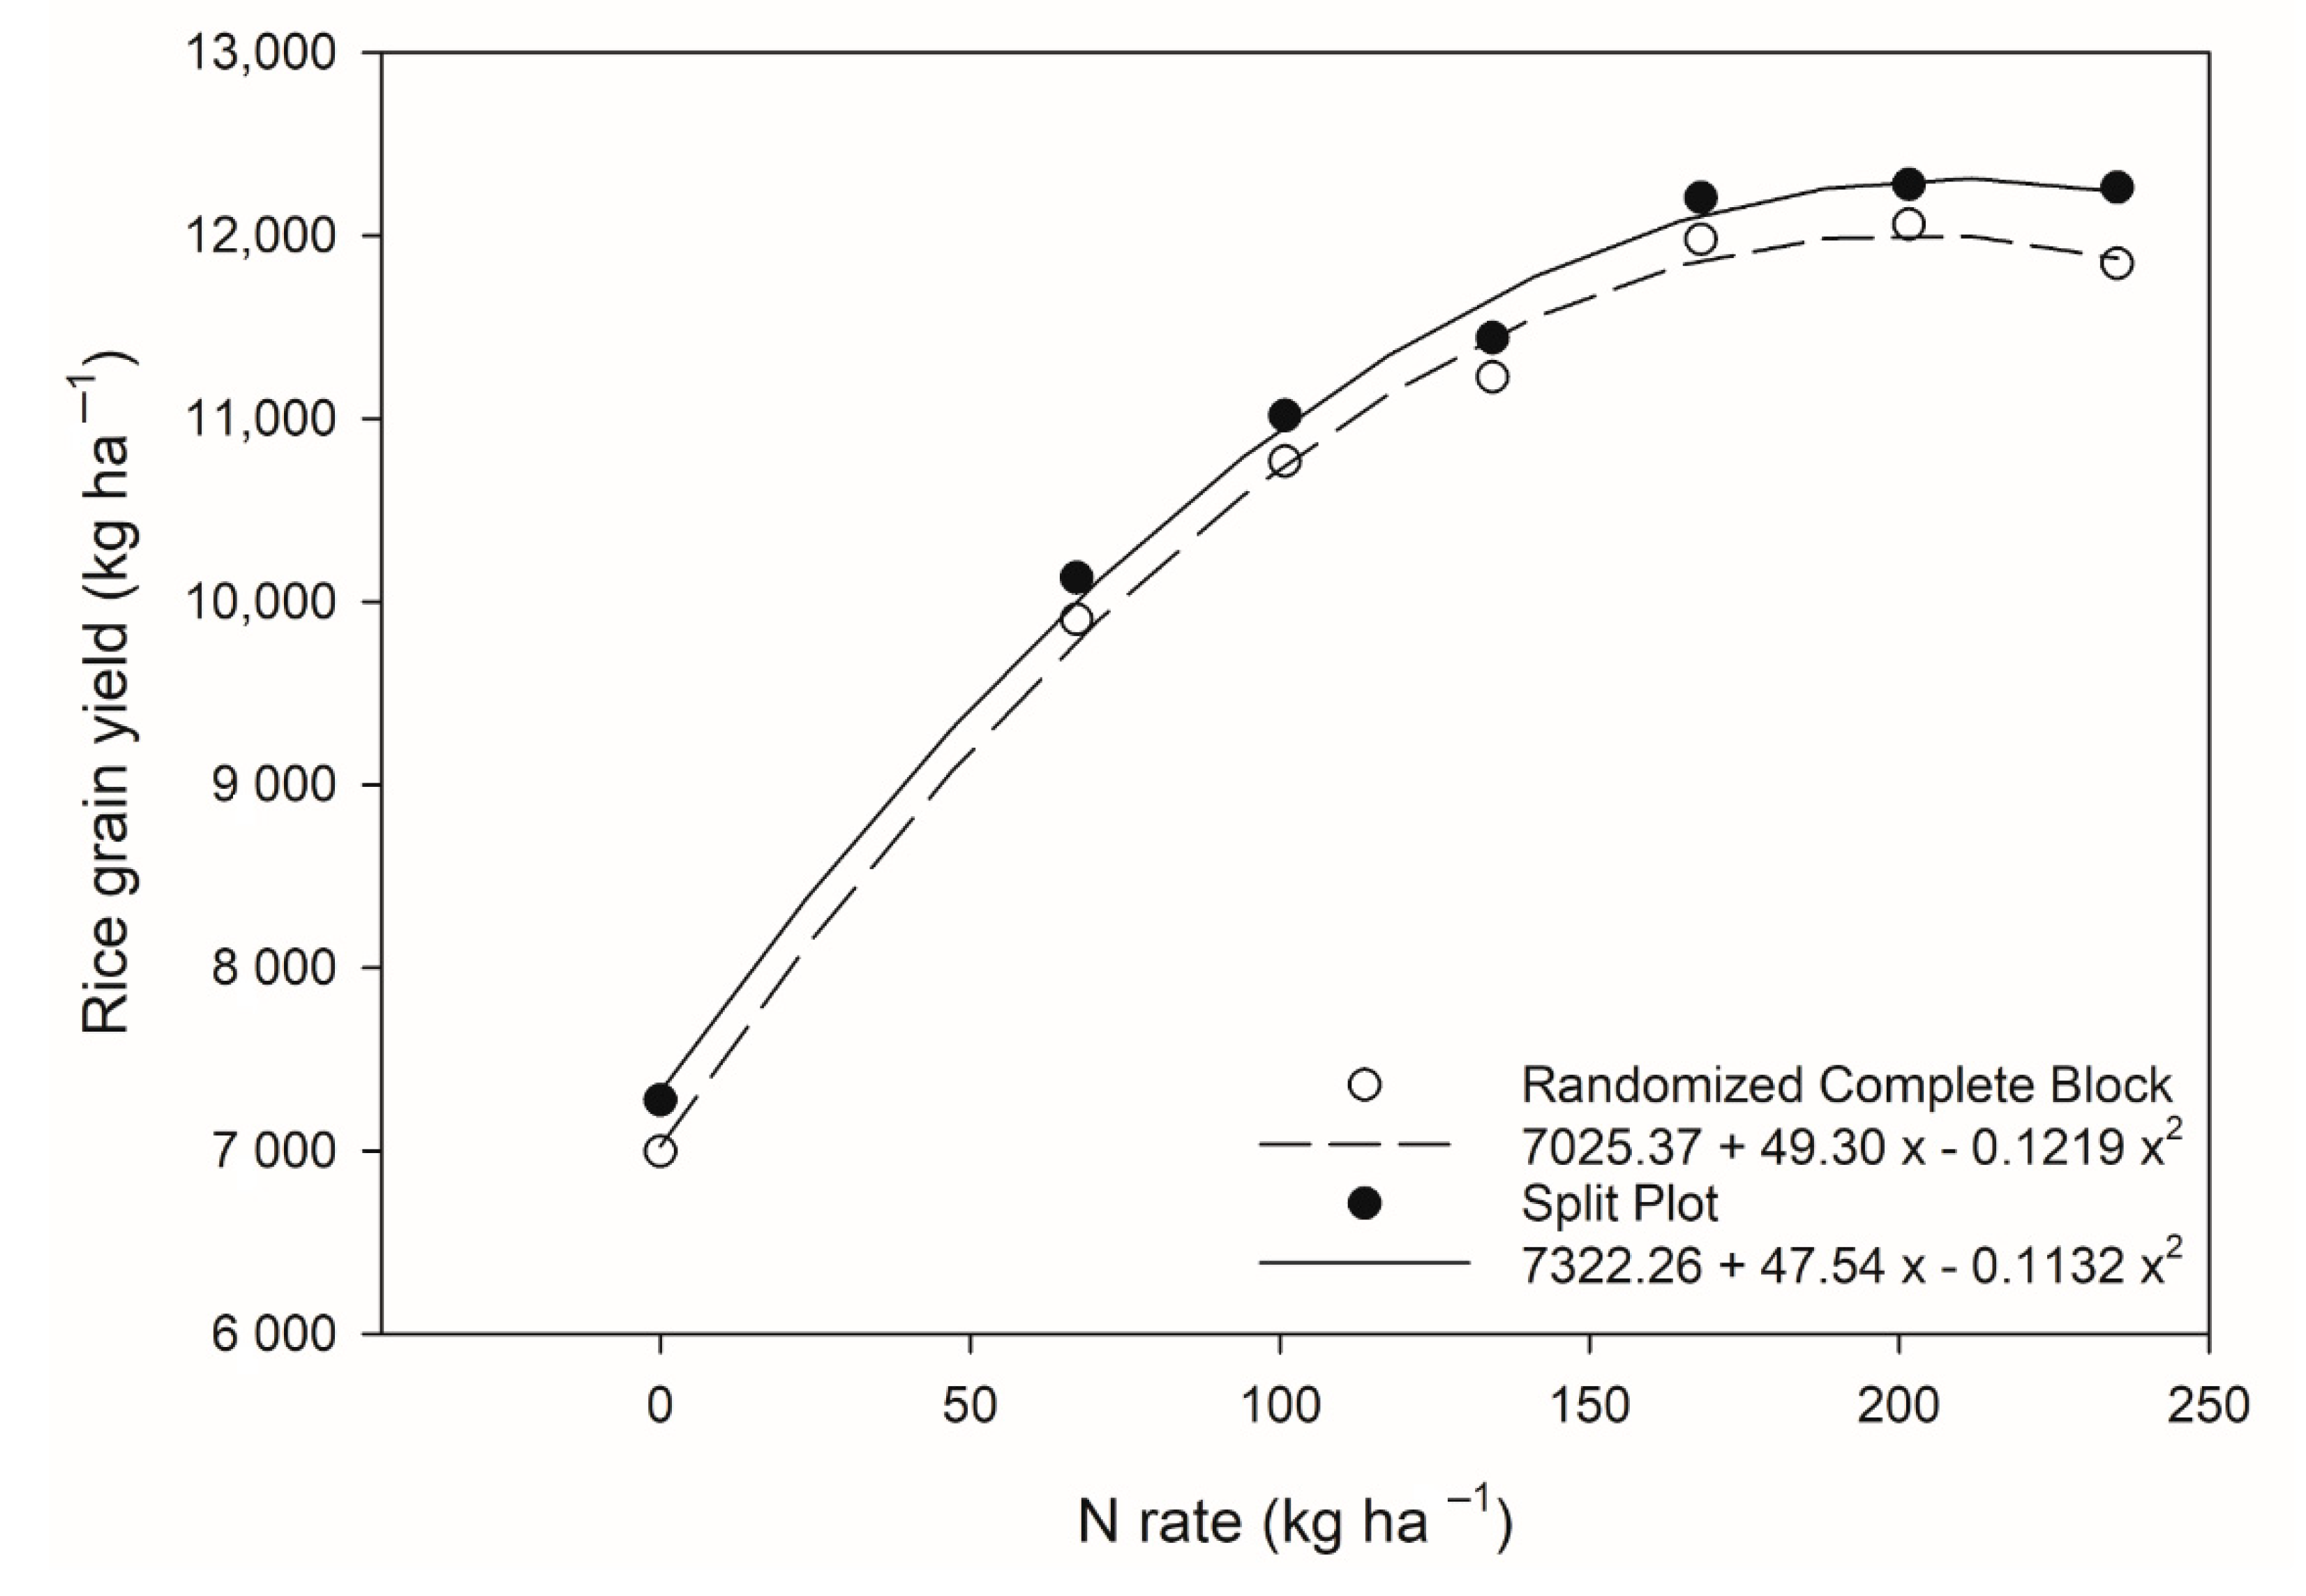
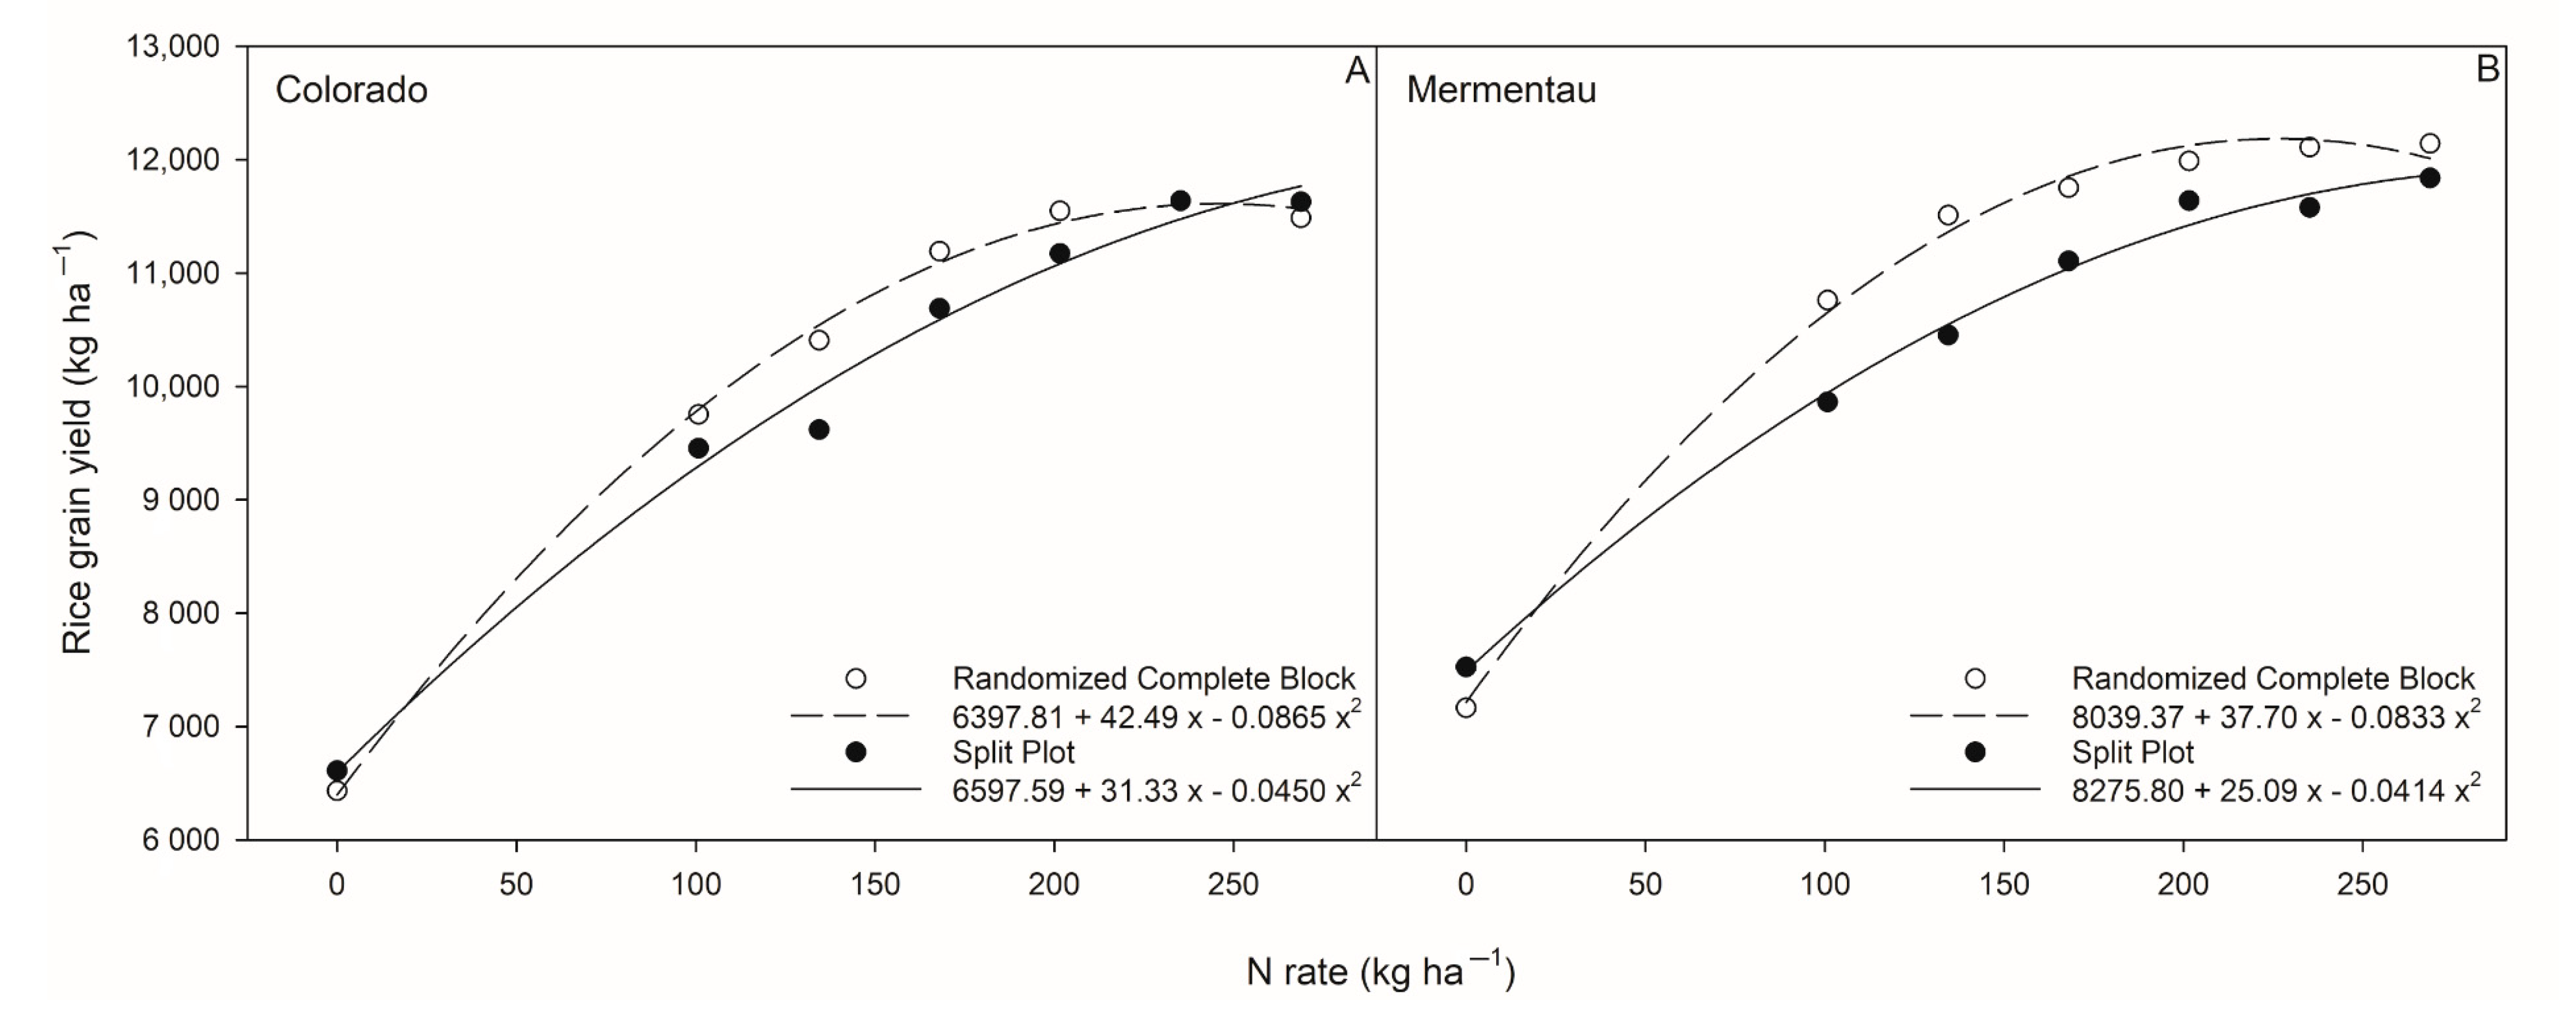
Replicated N response studies were conducted at six locations in Mississippi from 2013 and 2014 on soil textures ranging from sandy loam to clay (Table 1). Two newly released cultivars, ‘Colorado’ [15] and ‘Mermentau’ [16], were evaluated to compare two different experimental designs: RCB and SP. The experimental design was a split-plot, with the environment (ENV) as the main plot and design (RCB or SP) as the sub-plot. Within sub-plot treatment (design), the SP treatment was arranged with N rate as the main plot and the cultivar was the sub-plot. One replicate of each experimental design was evaluated in each ENV, with four replications of N rate and cultivar for both SP and RCB. At each site year, the SP and RCB treatments were arranged directly adjacent to one another. The SP design was compared to a RCB design separately for clay and silt loam soil textures.
All individual experimental units consisted of eight-row plots (20 cm spacing) at 4.6 m in length seeded at 80 kg ha−1. Adjacent plots were spaced at 40 cm. A 1.6-m alley separated each experimental unit replication in front of and behind each plot. For all experimental units, rice was grown in an upland condition until the five-leaf growth stage, at which time N treatments were broadcasted onto dry soil as urea (46-0-0) within 2 days prior to flood establishment. Nitrogen rates used were 0, 67, 100, 135, 170, 200, and 235 kg N ha−1 for silt loam textured soils and 0, 100, 135, 170, 200, 235, and 270 kg N ha−1 for clay textured soils. Fertilizer was applied using a Hege 80 belt cone (Wintersteiger, Inc., Salt Lake City, UT, USA) and a zero-max (Zero-Max, Inc., Plymouth, MN, USA) situated onto a custom-manufactured, self-propelled distributor. Agronomic and pest management practices were conducted according to Mississippi State University recommendations [4]. Plots were drained at maturity, approximately 2 weeks prior to harvest.
Rice plots were harvested with a Wintersteiger Delta (Wintersteiger USA, Salt Lake City, UT, USA) small-plot combine when grain moisture reached a range of 150 to 180 g kg−1. Plot grain yields were measured using a Harvest Master weighing system (Juniper Systems, Inc., Logan, UT, USA) equipped on the combine. Yields were adjusted to a moisture content of 120 g kg−1 for analysis.
Rice grain yield data were subjected to analysis of variance (ANOVA) using a general linear mixed model. Initially, a separate ANOVA was performed on each environment for each type of design. Rough rice grain yield response was analyzed with N rate, variety and their interactions as fixed effects. For comparisons purposes, random effects of Block and Block*N rate were included for both the RCB and split-plot design; however, the Block*N rate should not be necessary for the RCB design. N rate was treated as a quadratic trend in the model instead of a classification effect. A quadratic response model was selected for use in response analysis due to its superiority of fit over other models in rice small plot experiments [6]. The quadratic response is defined by:
Y = a + bN + cN2
where Y is rough rice grain yield (kg ha−1) and N is the rate of N application (kg ha−1); a is the yield when no N is applied (intercept), b is the linear coefficient and c is the quadratic coefficient [6].
Analysis of variance was also performed on data combined over environments for each soil type and design, with environments and interactions with environments included as random effects. Considering site-year, an environmental or random effect permits inferences about treatments to be made over a range of environments [17,18]. Based on this combined analysis, nonsignificant (p > 0.05) model terms were removed, and a final ANOVA was performed for each soil texture to test for differences in N rate quadratic trend coefficients for RCB and SP experimental designs. Estimates for parameters for each trend and test to compare the trends of RCB and SP designs were calculated using the GLMMIX procedure [19] in SAS 9.4 (SAS Institute Inc., Cary, NC, USA).
Grain yield response equations to N rate were used to calculate EONR using coefficients derived from Equation (1). Based on the final ANOVA, separate EONRs were calculated using the trend parameter estimates of significant model terms. EONRs were calculated by equating the first derivatives of the response equations to a fertilizer-to-rice price ratio and solving for N [20]. The prices of fertilizer ($1.22 kg−1 N) and rice ($0.30 kg−1 rice) were chosen based on 2013 and 2014 planning budgets [21,22].

3. Results

Based on the final ANOVA, no significant differences were discovered in a trend of RCB compared to SP design (F = 0.02, p = 0.97) for silt loam textured soils. In addition, no differences were detected in intercept values for the design × cultivar interaction. (F = 1.3, p = 0.26). Therefore, these terms were eliminated from the model to obtain an F-test for the overall design effect, which was insignificant (F = 1.0, p = 0.44). The trend of RCB and SP design and model estimates on silt loam soil texture are shown in Figure 1.
For clay textured soils, the interaction of trend × cultivar did affect the grain yield response to N rate (F = 10.35, p = 0.0002); however, no trend × cultivar × design interaction was detected (F = 0.22, p = 0.8). Additionally, pooled over cultivar, design did not influence the trend (F = 1.18, p = 0.32). These terms were removed from the model to obtain an overall test for design, which was not significant (F = 1.39, p = 0.36). For each cultivar, Colorado and Mermentau, the trend of RCB and SP design and model estimates for environments with clay soils are shown in Figure 2.
The response trend of rice grain yield to N rate was similar for RCB and SP design; therefore one EONR was calculated for each soil texture. The EONR for rice grown in Mississippi on silt loam soils for 2013 and 2014 was determined to be 205 kg N ha−1, and the predicted rice grain yield for EONR was 12160 kg ha−1. The EONR for rice grown in Mississippi on clay soils in 2013 and 2014 was determined to be 265 kg N ha−1, and the predicted rice grain yield at EONR is 11880 kg ha−1.

4. Discussion

The objective of this study was to determine if experimental design, RCB vs. SP, affects the predicted EONR for rice N rate response experiments on clay and silt loam textured soils in Mississippi. The experimental design had no effect on the response trend of rice grain yield to N rate or predicted EONR for both clay and silt loam soil textures. These data validate the use of RCB design for N response studies conducted in Mississippi. The plot-to-plot movement of N fertilizer to adjacent units does not influence the trend derived from rice grain yield data for RCB as compared to SP design. No differences in the intercept coefficient comparing RCB and SP indicates that movement of N from experimental units treated with high N rate, such as 270 kg N ha−1, to a lower N rate (i.e., 0 kg ha−1) is minimal or does not occur.
Grouping similar N rate treatments together, as in SP experimental design, did not positively affect the precision of this experiment (Table 2). Ideally, the main unit (MU) rep x rate component of error for the RCB design should be equal to 0. In this study, however, the MU error for RCB > 0 in three of six environments. For the SP design, a MU rep × rate component of error > 0 indicates that experimental units within the overall block were not uniform. In this experiment, the SP MU error was not different from 0 in five of six environments (Table 2).
Using a split-plot experimental design for rice N response trials may reduce the amount of time spent on preparation (i.e., measuring fertilizer) and minimize error during the application of fertilizer to individual units in RCB designs. However, RCB design experiments allow rice agronomists and breeders to make side-by-side visual comparisons of multiple cultivar and N rate combinations. Visual observation of experimental plots is vital for phenotypic response comparisons, as well as pest and disease infestations that may differ among cultivar and N rates. Although both RCB and SP experimental designs provide advantages to research scientists, our data suggest that the use of one experimental design over another does not influence the response of rice grain yield to N rate. This provides research scientists versatility in choosing an experimental design appropriate for the research program without sacrificing accurate rice grain yield response to N fertilizer rates.

Author Contributions

Conceptualization, R.L.A., L.J.K., J.A.B., K.R.R., J.G. and T.W.W.; methodology, R.L.A., L.J.K. and D.B.; validation, R.L.A., L.J.K. and G.D.S.; formal analysis, R.L.A. and D.B.; investigation, R.L.A.; writing—original draft preparation, R.L.A.; writing—review and editing, L.J.K. and G.D.S. All authors have read and agreed to the published version of the manuscript.

Funding

This research was funded by the Mississippi Rice Promotion Board (N/A).

Data Availability Statement

Restrictions apply to the availability of these data. Data is not available unless express permission is obtained from the Mississippi Rice Promotion Board.

Conflicts of Interest

The authors declare no conflict of interest. The funders had no role in the design of the study; in the collection, analyses, or interpretation of data; in the writing of the manuscript, or in the decision to publish the results.

References

  1. USDA-ERS (U.S. Department of Agriculture, Economic Research Service) Rice Webpage. Available online: https://www.ers.usda.gov/topics/crops/rice/ (accessed on 29 October 2021).
  2. USDA-NASS (U.S. Department of Agriculture, National Agricultural Statistics Service) Quick Stats. Available online: https://quickstats.nass.usda.gov/ (accessed on 29 October 2021).
  3. Street, J.E.; Bollich, P.K. Rice Production. In Rice: Origin, History, Technology, and Production; Smith, C.W., Ed.; John Wiley & Sons: Hoboken, NJ, USA, 2003; pp. 271–296. [Google Scholar]
  4. Beuhring, N.; Kanter, D.; Walker, T.W.; Bond, J.; Silva, M.; Pringle, L.; Damicone, J.; Moore, B.; Fox, J.; Sciumbato, G.; et al. Mississippi Rice Growers Guide; Publication 2255; Mississippi State University Extension Service: Mississippi State, MS, USA, 2008. [Google Scholar]
  5. Saichuk, J.K.; Brown, S.; Deshotel, V.; Gauthier, S.; Growth, D.E.; Harrell, D.L.; Hollier, C.A.; Linscombe, S.D.; Oard, J.; Stout, M.J.; et al. Rice Varieties and Management Tips; LSU Agricultural Ctr. Publ. No. 2270; Louisiana State University Agricultural Center: Baton Rouge, LA, USA, 2014. [Google Scholar]
  6. Harrell, D.L.; Walker, T.W.; Salassi, M.E.; Bond, J.A.; Gerard, P.D. Modeling rice grain yield response to nitrogen fertilization for delayed-flood production. J. Plant. Nutr. 2011, 34, 2158–2171. [Google Scholar] [CrossRef]
  7. Gomez, K.A.; Gomez, A.A. Statistical Procedures for Agriculture Research, 2nd ed.; International Rice Research Institute; Wiley and Sons: New York, NY, USA, 1984. [Google Scholar]
  8. Gomez, K.A. Techniques for Field Experiments with Rice; Layout/Sampling/Sources of Error; International Rice Research Institute: Los Banos, Laguna, Philippines, 1972. [Google Scholar]
  9. Roberts, T.L.; Norman, R.J.; Slaton, N.A.; Hardke, J.T.; Greub, C.E.; Fulford, A.M.; Williamson, S.M.; Shafer, J.B.J.; Frizzell, D.L.; Duren, M.W. Field validation of the nitrogen soil test for rice (N-ST*R) for rice produced on clay soils. In B.R. Wells Arkansas Rice Research Studies 2013; Norman, R.J., Moldenhauer, K.A.K., Eds.; Arkansas Agricultural Experiment Station Research Series 617: Fayetteville, AR, USA, 2014; pp. 311–316. [Google Scholar]
  10. Norman, R.J.; Roberts, T.L.; Hardke, J.T.; Slaton, N.A.; Moldenhauer, K.A.K.; Frizzell, D.L.; Duren, M.W.; Castaneda-Gonzalez, E. Grain yield response of eight new rice cultivars to nitrogen fertilization. In B.R. Wells Arkansas Rice Research Studies 2013; Norman, R.J., Moldenhauer, K.A.K., Eds.; Arkansas Agricultural Experiment Station Research Series 617: Fayetteville, AR, USA, 2014; pp. 293–303. [Google Scholar]
  11. Norman, R.J.; Hardke, J.T.; Roberts, T.L.; Slaton, N.A.; Frizzell, D.L.; Duren, M.W.; Castaneda-Gonzalez, E. Response of two rice varieties to midseason nitrogen fertilizer application timing. In B.R. Wells Arkansas Rice Research Studies 2013; Norman, R.J., Moldenhauer, K.A.K., Eds.; Arkansas Agricultural Experiment Station Research Series 617: Fayetteville, AR, USA, 2014; pp. 303–310. [Google Scholar]
  12. Rogers, C.W.; Norman, R.J.; Brye, K.R.; Smartt, A.D.; Hardke, J.T.; Roberts, T.L.; Slaton, N.A.; Dempsey, R.; Fulford, A.M.; Frizzell, D.L. Rice grain yield as influenced by nitrogen source, rate, and application time. In B.R. Wells Arkansas Rice Research Studies 2013; Norman, R.J., Moldenhauer, K.A.K., Eds.; Arkansas Agricultural Experiment Station Research Series 617: Fayetteville, AR, USA, 2014; pp. 317–323. [Google Scholar]
  13. Slaton, N.A.; Fryer, M.; Roberts, T.L.; DeLong, R.E.; Dempsey, R.; Parvej, R.; Hedge, J.; Massey, C.G. Validation of soil-test-based fertilizer recommendations for flood-irrigated rice. In B.R. Wells Arkansas Rice Research Studies 2013; Norman, R.J., Moldenhauer, K.A.K., Eds.; Arkansas Agricultural Experiment Station Research Series 617: Fayetteville, AR, USA, 2014; pp. 324–331. [Google Scholar]
  14. Little, T.M.; Hills, F.J. Agricultural Experimentation, Design and Analysis; John Wiley and Sons: New York, NY, USA, 1978. [Google Scholar]
  15. Tabien, R.E.; Samonte, S.O.P.B.; Wilson, L.T.; Harper, C.H.; Medley, J.C.; Frank, P. Development and registration of ‘Colorado’, a high-yielding rice cultivar. J. Plant. Regist. 2015, 9, 60–66. [Google Scholar] [CrossRef]
  16. Oard, J.H.; Harrell, D.L.; Growth, D.E.; Bearb, K.F.; White, L.M., III; Linscombe, S.L. Registration of ‘Mermentau’ rice. J. Plant. Regist. 2014, 8, 135–138. [Google Scholar] [CrossRef]
  17. Blouin, D.C.; Webster, E.P.; Bond, J.A. On the analysis of combined experiments. Weed Tech. 2011, 25, 165–169. [Google Scholar] [CrossRef]
  18. Carmer, S.G.; Nyquist, W.E.; Walker, W.M. Least significant differences in combined analyses of experiments with two- or three-factor treatment designs. Agron. J. 1989, 81, 655–672. [Google Scholar] [CrossRef]
  19. SAS Institute. The SAS System for Windows Release 9.4; SAS Institute: Cary, NC, USA, 2013. [Google Scholar]
  20. Nelson, L.A.; Voss, R.D.; Pesek, J.T. Agronomic and statistical evaluation of fertilizer response. In Fertilizer Technology and Use; Engelstad, O.P., Ed.; American Society of Agronomy: Madison, WI, USA, 1985; pp. 53–90. [Google Scholar]
  21. MSU-DAE. Rice 2013 Planning Budgets, Budget Report No. 2012-06; Department of Agricultural Economics, Mississippi State University: Mississippi State, MS, USA, 2012. [Google Scholar]
  22. MSU-DAE. Rice 2014 Planning Budgets, Budget Report No. 2013-04; Department of Agricultural Economics, Mississippi State University: Mississippi State, MS, USA, 2013. [Google Scholar]
Figure 1. Rice grain yield response to N fertilizer rate for an experiment comparing the trend of a randomized complete block design to the trend of a split-plot experimental design for environments with a silt loam soil texture in 2013 and 2014.
Agronomy 11 02296 g001
Figure 2. Rice grain yield response of two cultivars, Colorado (A) and Mermentau (B), to N fertilizer rates for an experiment comparing the trend of a randomized complete block design to the trend of a split-plot experimental design for environments with clay textured soil in 2013 and 2014.
Agronomy 11 02296 g002
Table 1. Individual site locations, soil series, taxonomic classification, and crop rotation information for rice nitrogen (N) response tests were conducted comparing randomized complete block (RCB) and split-plot (SP) experimental designs in Mississippi in 2013 and 2014.
Soil
SiteYearLocationSeriesTextureTaxonomic ClassificationCrop Rotation
12013Shaw, MSSharkeyClayVery-fine, smectic, thermicChromic EpiaquertsRice-soybean
22013Greenville, MSCommerceSandy loamFine-silty, mixed, superactive, nonacid, thermic Fluvaquentic EndoaqueptsRice-soybean
32013Minter City, MSDubbsLoamFine-silty, mixed, thermic TypicHapludalfsRice-soybean
42014Shaw, MSSharkeyClayVery-fine, smectic, thermicChromic EpiaquertsRice-soybean
52014Shaw, MSForestdaleSilty clayloamFine, smectitic, thermic TypicEndoaqualfsRice-soybean
62014Arcola, MSSharkeyClayVery-fine, smectic, thermicChromic EpiaquertsRice-soybean
Table 2. Initial ANOVA estimates of variance and standard errors (SE) for random effects, covariance for random effects, and variability percentage described for main and subunit errors for an N rate response experiment comparing a split-plot (SP) design to a randomized complete block (RCB) design.
RCBSPVariability
SoilEnv CovParm §EstimateSEEstimateSE RCBSP
Silt loam2rep4,387(15,578)204,806(197,326)Block
Silt loam2rate × rep43,452(33,279)80,900(91,485)MU err28.5%18.8%
Silt loam2Residual108,823(30,780)349,095(98,739)SU err71.5%81.2%
Total (excluding block)152,274 429,995
Silt loam3rep72,813(89,136)59,650(77,605)Block
Silt loam3rate × rep0 115,956(79,752)MU err0.0%32.6%
Silt loam3Residual500,643(104,360)240,080(69,456)SU err100.0%67.4%
Total (excluding block)500,643 356,036
Silt loam5rep770,899(679,224)1,039,663(921,203)Block
Silt loam5rate × rep0 0 MU err0.0%0.0%
Silt loam5Residual852,109(175,777)1,237,312(255,238)SU err100.0%100.0%
Total (excluding block)852,109 1,237,312
Sharkey1rep17,263(24,768)42,255(49,267)Block
Sharkey1rate × rep6,370(35,564)38,435(44,579)MU err3.7%18.3%
Sharkey1Residual165,158(46,714)171,337(48,461)SU err96.3%81.7%
Total (excluding block)171,528 209,772
Sharkey4rep25,382(58,434)1,296,037(1,147,604)Block
Sharkey4rate × rep111,307(109,078)630,452(232,871)MU err21.9%70.5%
Sharkey4Residual397,462(112,419)263,833(74,623)SU err78.1%29.5%
Total (excluding block)508,768 894,285
Sharkey6rep66,962(69,678)233,282(207,379)Block
Sharkey6rate × rep0 87,224(46,468)MU err0.0%43.7%
Sharkey6Residual255,516(52,709)112,270(32,253)SU err100.0%56.3%
Total (excluding block)255,516 199,494
Variability, % of variability described by main-unit error (MU err) and sub-unit error (SU err). Env, environment. § CovParm, random-effect variance component Estimate, variance component estimate.
Publisher’s Note: MDPI stays neutral with regard to jurisdictional claims in published maps and institutional affiliations.

