Article

Genome-Wide Association Mapping for Seed Weight in Soybean with Black Seed Coats and Green Cotyledons

1
Department of Applied Biosciences, Kyungpook National University, Daegu 41566, Korea
2
Gyeongsangbuk-do Provincial Agricultural Research & Extension Service, Daegu 41404, Korea
3
Department of Integrative Biology, Kyungpook National University, Daegu 41566, Korea
*
Author to whom correspondence should be addressed.
Agronomy 2022, 12(2), 250; https://doi.org/10.3390/agronomy12020250
Submission received: 2 December 2021 / Revised: 10 January 2022 / Accepted: 18 January 2022 / Published: 19 January 2022
(This article belongs to the Special Issue Legumes Cultivars and Their Genetic Improvements)

Abstract

:
The yield of soybean (Glycine max (L.) Merr.) is based on several components, such as the number of plants per unit area, pod number per plant, number of nodes, and seed weight. Additionally, the hundred-seed weight (HSW) is an important component affecting soybean yield. The HSW trait can determine soy products meant for human consumption. In this study, we conducted genome-wide association studies with 470 accessions of black seed coats with green cotyledons and applied an online tool with publicly available genome sequencing data. The objective of the study was to identify the genomic regions in the soybean genome associated with seed weight and to identify the candidate genes in linkage disequilibrium blocks where the most significant SNPs were located. This study identified significant SNPs for seed weight on chromosomes 2 and 16. Furthermore, this study indicated that GmCYP78A57 (Glyma.02G119600) encoded a cytochrome P450 monooxygenase may be a possible candidate gene for controlling the seed size in soybean. We assumed that another gene on chromosome 16 may play the important role of a small additive genetic effect to reduce seed size along with GmCYP78A57. An online tool was used to identify 12 allelic variations of GmCYP78A57 with publicly available genomic sequence data. The HSW of 45 accessions having a missense mutation from the Germplasm Resources Information Network ranged from 4.4 to 17.6 g. In addition, 19 accessions were shown to be less than 10.0 g of HSW. This information can provide for the development of molecular markers to use in soybean breeding programs to release new cultivars with increased or decreased seed weight.

1. Introduction

Soybean (Glycine max (L.) Merr.) is one of the most economically and nutritionally important crops worldwide because it contains 40% protein, 20% oil, and 15% soluble carbohydrates in the seed. Soybean is mainly used for producing high-protein meals for livestock and vegetable oils. Its yields have slowly increased in the past decades [1,2]. The yield is determined by several components, such as the number of plants per unit area, pod number per plant, number of nodes, and seed weight [3]. The seed weight is not only an important component affecting the soybean yield, but also a determinant of soy products for human consumption [4,5,6,7]. Small-seed soybeans are used for the production of high-quality soybean sprouts and natto, whereas large-seed soybeans are preferred to produce tofu, soybean paste, edamame, and miso soup [8]. Therefore, it is important to understand the genetic basis of hundred-seed weight (HSW) in improving the potential of soybean yield and the associated soybean food quality. In addition, this understanding will provide helpful information in the soybean breeding program to develop a new cultivar.
The HSW trait is a complex and quantitatively inherited trait controlled by multiple genes with small additive genetic effects [9]. Many quantitative trait loci (QTLs) controlling the HSW of soybean have been reported through linkage analysis and genome-wide association studies (GWAS). To date, a total of 304 QTL regions of seed weight have been documented in SoyBase [10] using intraspecific and interspecific mapping populations with different genetic backgrounds, and 94 SNPs (single nucleotide polymorphism) were associated with seed weight through GWAS. Studies indicated that the HSW is highly inherited with 98% of heritability, indicating that genotypic value is an important factor controlling HSW variations in soybean seeds [11,12].
GWAS is association mapping or linkage disequilibrium (LD) mapping with unrelated individuals to detect the SNPs associated with the traits of interest, such as agronomic, seed composition, and diseases in soybeans [13,14,15,16,17,18,19]. The mapping studies have identified QTLs in many crop species, such as rice, maize, and soybean. The determinants, such as population size, genetic diversity, and genetic structure, influence the precision of QTL regions by GWAS analysis [20]. For the HSW, GWAS with different genetic backgrounds were conducted to identify significant SNPs in soybean [12,17,18,19]. Zhang et al. [17] reported the results of GWAS analyses with 366 Chinese soybean landrace accessions to identify 39 candidate genes for the HSW trait. Zhang et al. [12] conducted GWAS for HSW with 309 plant introductions from USDA soybean germplasm collections from Maturity Groups 0 and 00. They indicated that 22 loci showed minor effects on HSW. In addition, many QTLs in multiple environments were detected by QTL mapping through intraspecific and interspecific crossing populations [21,22,23,24,25].
The genetic studies for seed size have been well-reported in Arabidopsis and rice. Several signaling pathways, including the ubiquitin-proteasome pathway, G-protein signaling, mitogen-activated protein kinase signaling, phytohormone perception, and transcriptional regulatory factors, have been shown to control seed size [26]. Recently, transcriptional regulatory factors consisting of PEAPOD2 (PPD2), kinase inducible domain interacting 8/9 (KIX 8/9), and TPL (TOPLESS) complex have been reported to negatively regulate the expression of D3-type cyclins [27]. Eigher null mutations in PPD or KIX in Arabidopsis increased the organ size, such as seed and leave [28,29,30]. Recently, Nguyen et al. [31] demonstrated that GmKIX8-1 (Glyma.17G112800) as repressor-regulated D3-type cyclins have been identified to control seed weight and leaf size of soybeans from fast neutron mutant populations. Other studies demonstrated that causal genes for seed weight and size have been reported in soybeans. Sun et al. [32] reported that overexpression of miR156 improved soybean architecture and yield with increased HSW as well as number of branches, nodes and pods. In addition, PP2C (Glyma.17G221100) encodes a putative phosphatase 2C protein that has been identified to control seed weight through linkage analysis of an intraspecific crossing population [33]. PP2C may be associated with GmBZR1 which is one of the key transcriptional factors in brassinosteroid signaling, and finally promoted seed weight and size in soybeans.
Cytochrome P450s (CYP) is involved in biochemical pathways to produce secondary metabolites and plant hormones including brassinosterioid, gibberellin, abscisic acid, and jasmonic acid [34,35]. CYP78A subfamily genes containing a single oxygenase have been identified to produce enlarged leaves, flowers, larger diameter stems and seeds in Arabidopsis and rice [34,35,36,37,38,39,40]. Some of the CYP78A genes control cell proliferation and expansion in plants. In Arabidopsis, CYP78A5 mutation had early termination of cell division in smaller organs such as petals, sepals, leaves, and stems [34]. In rice, GYP78A13 is associated with the balance between embryo and endosperm size. In addition, Miyoshi et al. [41] reported with rice that CYP78A11 is associated with the regulation of leaf development. Through a reverse genetic approach, Zhao et al. [42] investigated the role of the CYP78A gene in soybean seed size and reported that the overexpression of GmCYP78A72 produced larger soybean seeds. However, they reported that knock-down of GmCYP78A72 did not decrease the seed size, whereas silencing to three GmCYP78A genes reduced the grain size of transgenic plants. In addition, homologous CYP78A, GmCYP78A10 was reported to associate with seed size as well as pod number, plant height and branch number in soybean [43].
Soybeans possessing black seed coats with green cotyledons (BLG) have been used as traditional ingredients in medicinal treatments in China, Japan, and Korea [44]. Due to increasing consumer awareness regarding the BLG soybeans, it has become a preferred soybean as a food ingredient in South Korea. Recently, Lee et al. [45] reported a wide phenotypic variation of HSW, which ranged from 9.1 g to 49.3 g for 470 BLG accessions. The HSW of the elite soybean cultivar ranged from 18.0 to 20.0 g, whereas its wild soybean was from 3.0 to 4.0 g [46]. This suggests that BLG germplasms are a good source of materials to identify the unique, favorable, and rare alleles for the understanding of the genetic basis of HSW in soybeans.
With the recent advancements in sequencing technologies, the utilization of whole-genome sequencing is now more feasible. In addition, the cost of whole-genome sequencing has been significantly declining and has been sequenced faster with high depths, thereby being available to reveal the identification or allelic variation of genes of interest. Since the genome sequencing efforts for cultivar and wild soybeans were completed in 2010 [47,48], the amount of re-sequencing data of soybeans has risen over the last decade [49,50,51,52]. Online tools and databases have been developed with publicly available genome sequencing data, such as SoyBase [10], Phytozome [53], and SoyKB [54]. In this study, we have conducted GWAS with agronomic traits of 470 BLG accessions [45] and 6K SNPs [55], and application of online tools with publicly available genome sequencing data. The objective of this study was to identify the QTLs in the soybean genome, which are associated with HSW, and to identify the candidate genes in LD blocks where the most significant SNPs are located.

2. Materials and Methods

2.1. Growth Conditions of BLG Germplasm and Phenotype Collection

To conduct the GWAS analysis, 470 BLG accessions, including three cultivars (Cheongja, Cheongja 3 and Uram), formed the total population [45,55]. The 470 BLG accessions were grown at Gyeongsanbuk-do Agricultural Research and Extension, Daegu, Republic of Korea in the years 2013, 2014 and 2015 with the planting dates over the three years being 14 June, 29 May, and 15 June, respectively. The 470 BLG accessions were planted in a single row of 1 m long with a row to row spacing of 80 cm by hand. Each single row was harvested in bulk at R8 harvest maturity stage [56]. Five randomly selected plants per plot were used to measure plant height and number of nodes per plant. Harvested soybeans from each plot were measured for HSW.

2.2. DNA Extraction and Determination of Genotypes for BLG Accessions

Genotypic information from 470 BLG accessions was described in Jo et al. [38]. Young trifoliate leaves of each BLG accession were collected with three cultivars. The leaves of each accession were ground into a fine powder with mortar and pestle with liquid nitrogen. Powder (20 mg) from each sample was used to extract the genomic DNA using the cetyltrimethylammonium bromide method with a minor modification [57]. Quantification and qualification of the genomic DNA of each accession was determined by running on 1.5% agarose gel. Genomic DNA (30 µL) at a concentration of 100 ng/µL from 470 accessions were genotyped with BARCsoySNP6K BeadChip at the National Instrumentation Center for Environmental Management (NICEM; Republic of Korea) at Seoul National University [58]. A total of 5122 SNP alleles were called using the Genome Studio Genotyping Module (Illumina, Inc. San Diego, CA, USA) [59].

2.3. Genome-Wide Association Studies

A total of 4459 SNPs were used for association mapping after filtering through the TASSEL software to exclude those with >20% missing data and rare SNPs (minor allele frequency, MAF > 0.01). Therefore, principal component analysis (PCA) was constructed with 4459 SNPs [60]. A general linear model (GLM) with PCA was implemented in comparison with the result of mixed linear model (MLM) using TASSEL software and the GAPIT R package. The kinship coefficient matrix was used to provide an estimate of additive genetic variance [60,61]. In the present study, we used a MLM with PCA and kinship produced p values to populate Manhattan plots [61,62]. The significance of associations between SNPs and traits was based on false discovery rate (FDR) analyses.

2.4. Linkage Disequilibrium Estimation

Distances of SNPs and physical position were calculated using Glycine max Wm82.a2 reference genome. Pairwise LD between SNPs was calculated as the squared correlation coefficient (r2) of alleles using TASSEL software. The r2 for SNPs with pairwise distance in a window of 100 SNPs was used to draw the average LD decay figure by R script [63]. The LD decay rates of the BLG accessions were measured as the chromosomal distance where r2 dropped to half of the maximum value [64].

2.5. Online Tool and Phenotypic Data Set from GRIN

The soybean allele catalog, as an online tool, was used to identify the allelic variation through SoyKB [65]. The input was the name of the gene of interest (GmCYP78A57, Glyma.02G119600). The list of accessions can be downloaded from the online tool. Based on the list, phenotypic data of HSW were obtained from SoyBase [66].

2.6. Statistical Data Analysis

All statistical analyses in this study were conducted in SAS v9.4 (SAS Institute, 2013). A comparison of the measured chlorophyll and anthocyanin between the two groups was determined using genotyping, and a Student’s t-test analysis (p < 0.05) was conducted using PROC TTEST in SAS. Mean differences among the genotypic groups were analyzed with Fisher’s Least Significant Difference (LSD) test at p = 0.05 using PROC GLM. For the correlation analysis, PROC CORR of SAS code was used.

3. Results

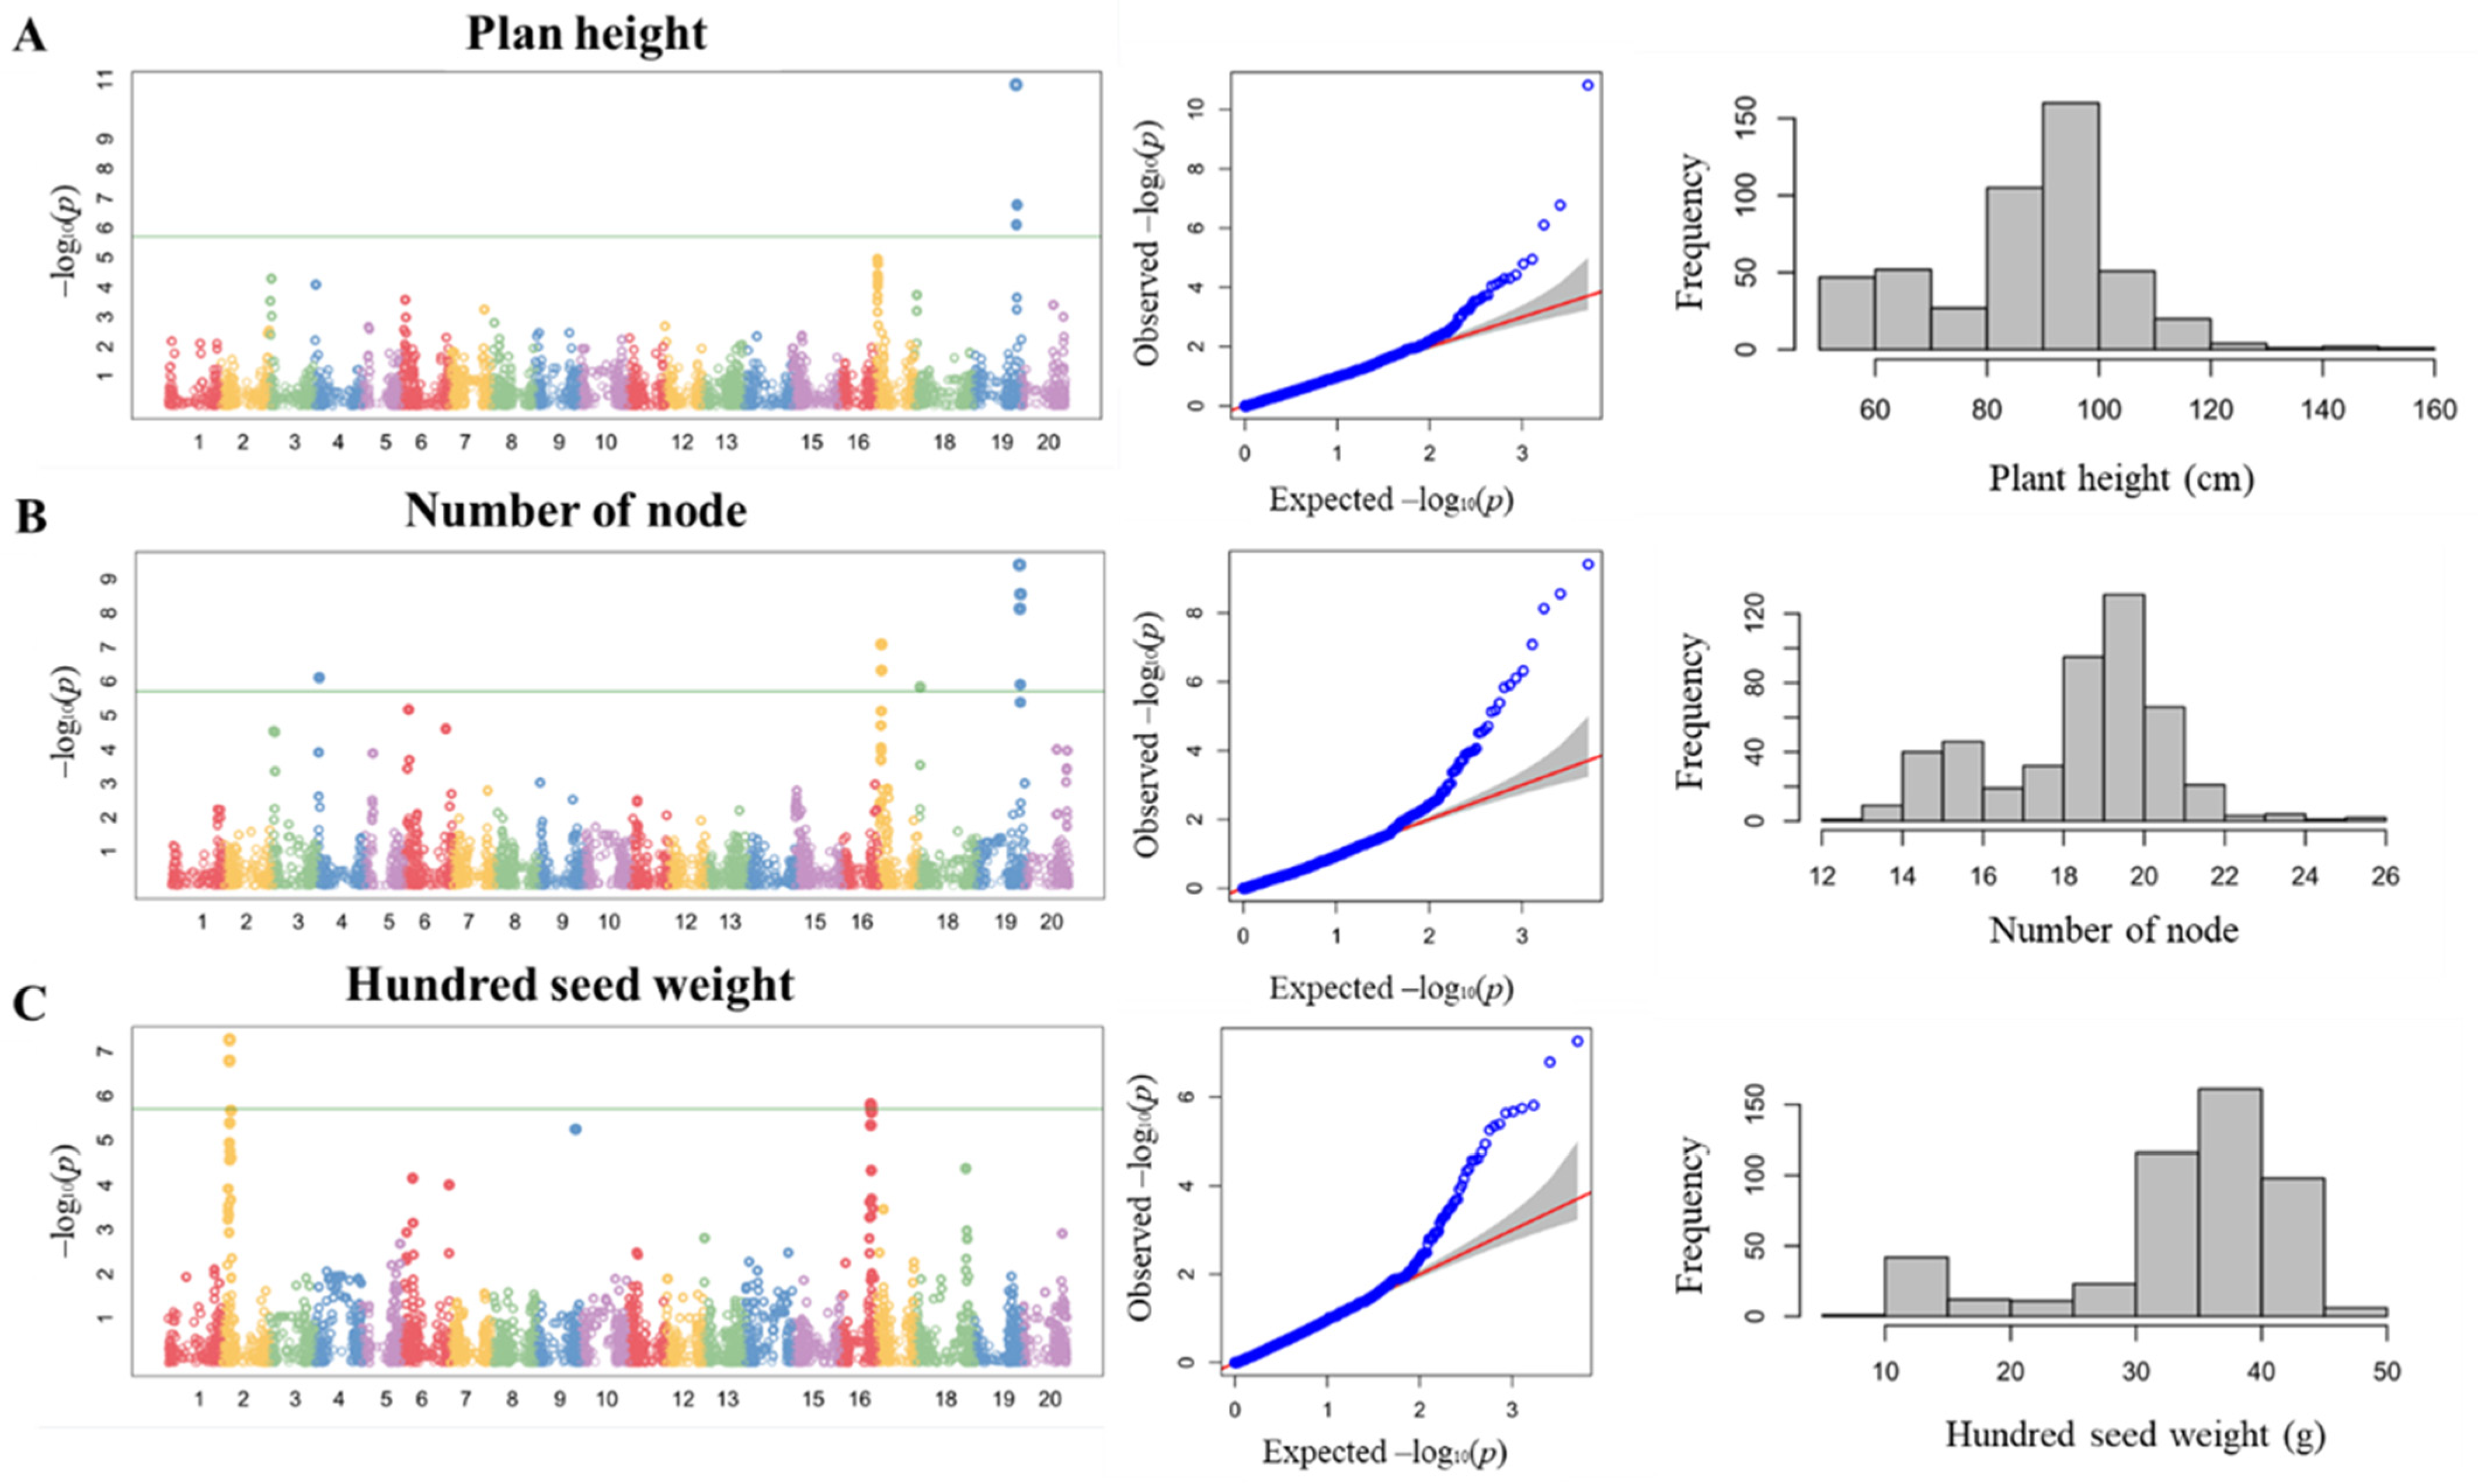
3.1. Phenotypic Distribution of Agronomic Traits in BLG Germplasm

The phenotypic distribution of 470 BLG accessions for plant height, number of nodes, and HSW over the three years of this study were evaluated (Figure 1). BLG accessions displayed continuous variation suggesting quantitative traits for plant height, number of nodes, and HSW. The plant height of 470 BLG accessions ranged from 49.6 to 151.6 cm, with an average height of 87.0 cm (Figure 1A). Forty-two accessions showed less than 60.0 cm of plant height. Eighty-one of the BLG accessions belong to a category with plant height varying from 60.0 to 80.0 cm. In addition, 73.0% of the total accessions had more than 80.0 cm of plant height in this study. Three cultivars, namely: Cheongja 3, Cheongja, and Uram, were 74.2, 77.7, and 62.9 cm in plant height, respectively. The number of nodes in BLG accessions ranged from 12.3 to 25.9 (Figure 1B). In this study, plant height was strongly positively correlated with the number of nodes (r = 0.84, p < 0.001). The HSW of BLG accessions was from 9.1 to 49.3 g with an average HSW of 33.9 g (Figure 1C). Only one accession (BLG466, 9.1 g) was shown to be less than 10.0 g in HSW. In this study, 380 of the BLG accessions had more than 30.0 g in HSW. The HSW of Cheongja 3, Chenogja, and Uram were 38.7, 41.5, and 30.3 g, respectively. Furthermore, the phenotypic distributions of HSW were shown to be left-skewed.

3.2. GWAS with Plant Height and Number of Nodes

With a total of 4459 SNPs, a GWAS was performed with the MLM, which greatly reduced the false-positive rates, and quantile–quantile (QQ) plots (Figure 1). The summarized results of MLM analyses with plant height, number of nodes, and HSW across three years are represented in Table 1. Two overlapping SNPs on chromosome 19 across the three years were associated with plant height at 10.8 and 6.1 of −log10(p) value based on MLM association analysis. Six overlapping SNPs on four different chromosomes were significantly detected for the number of nodes with BLG accessions. A most significant SNP (Gm19_45204441) was colocalized for plant height and number of nodes. In the haplotype block, a candidate gene for plant height and number of nodes may be Dt1 (Glyma.19G194300), which is involved in the regulation of stem growth habits.

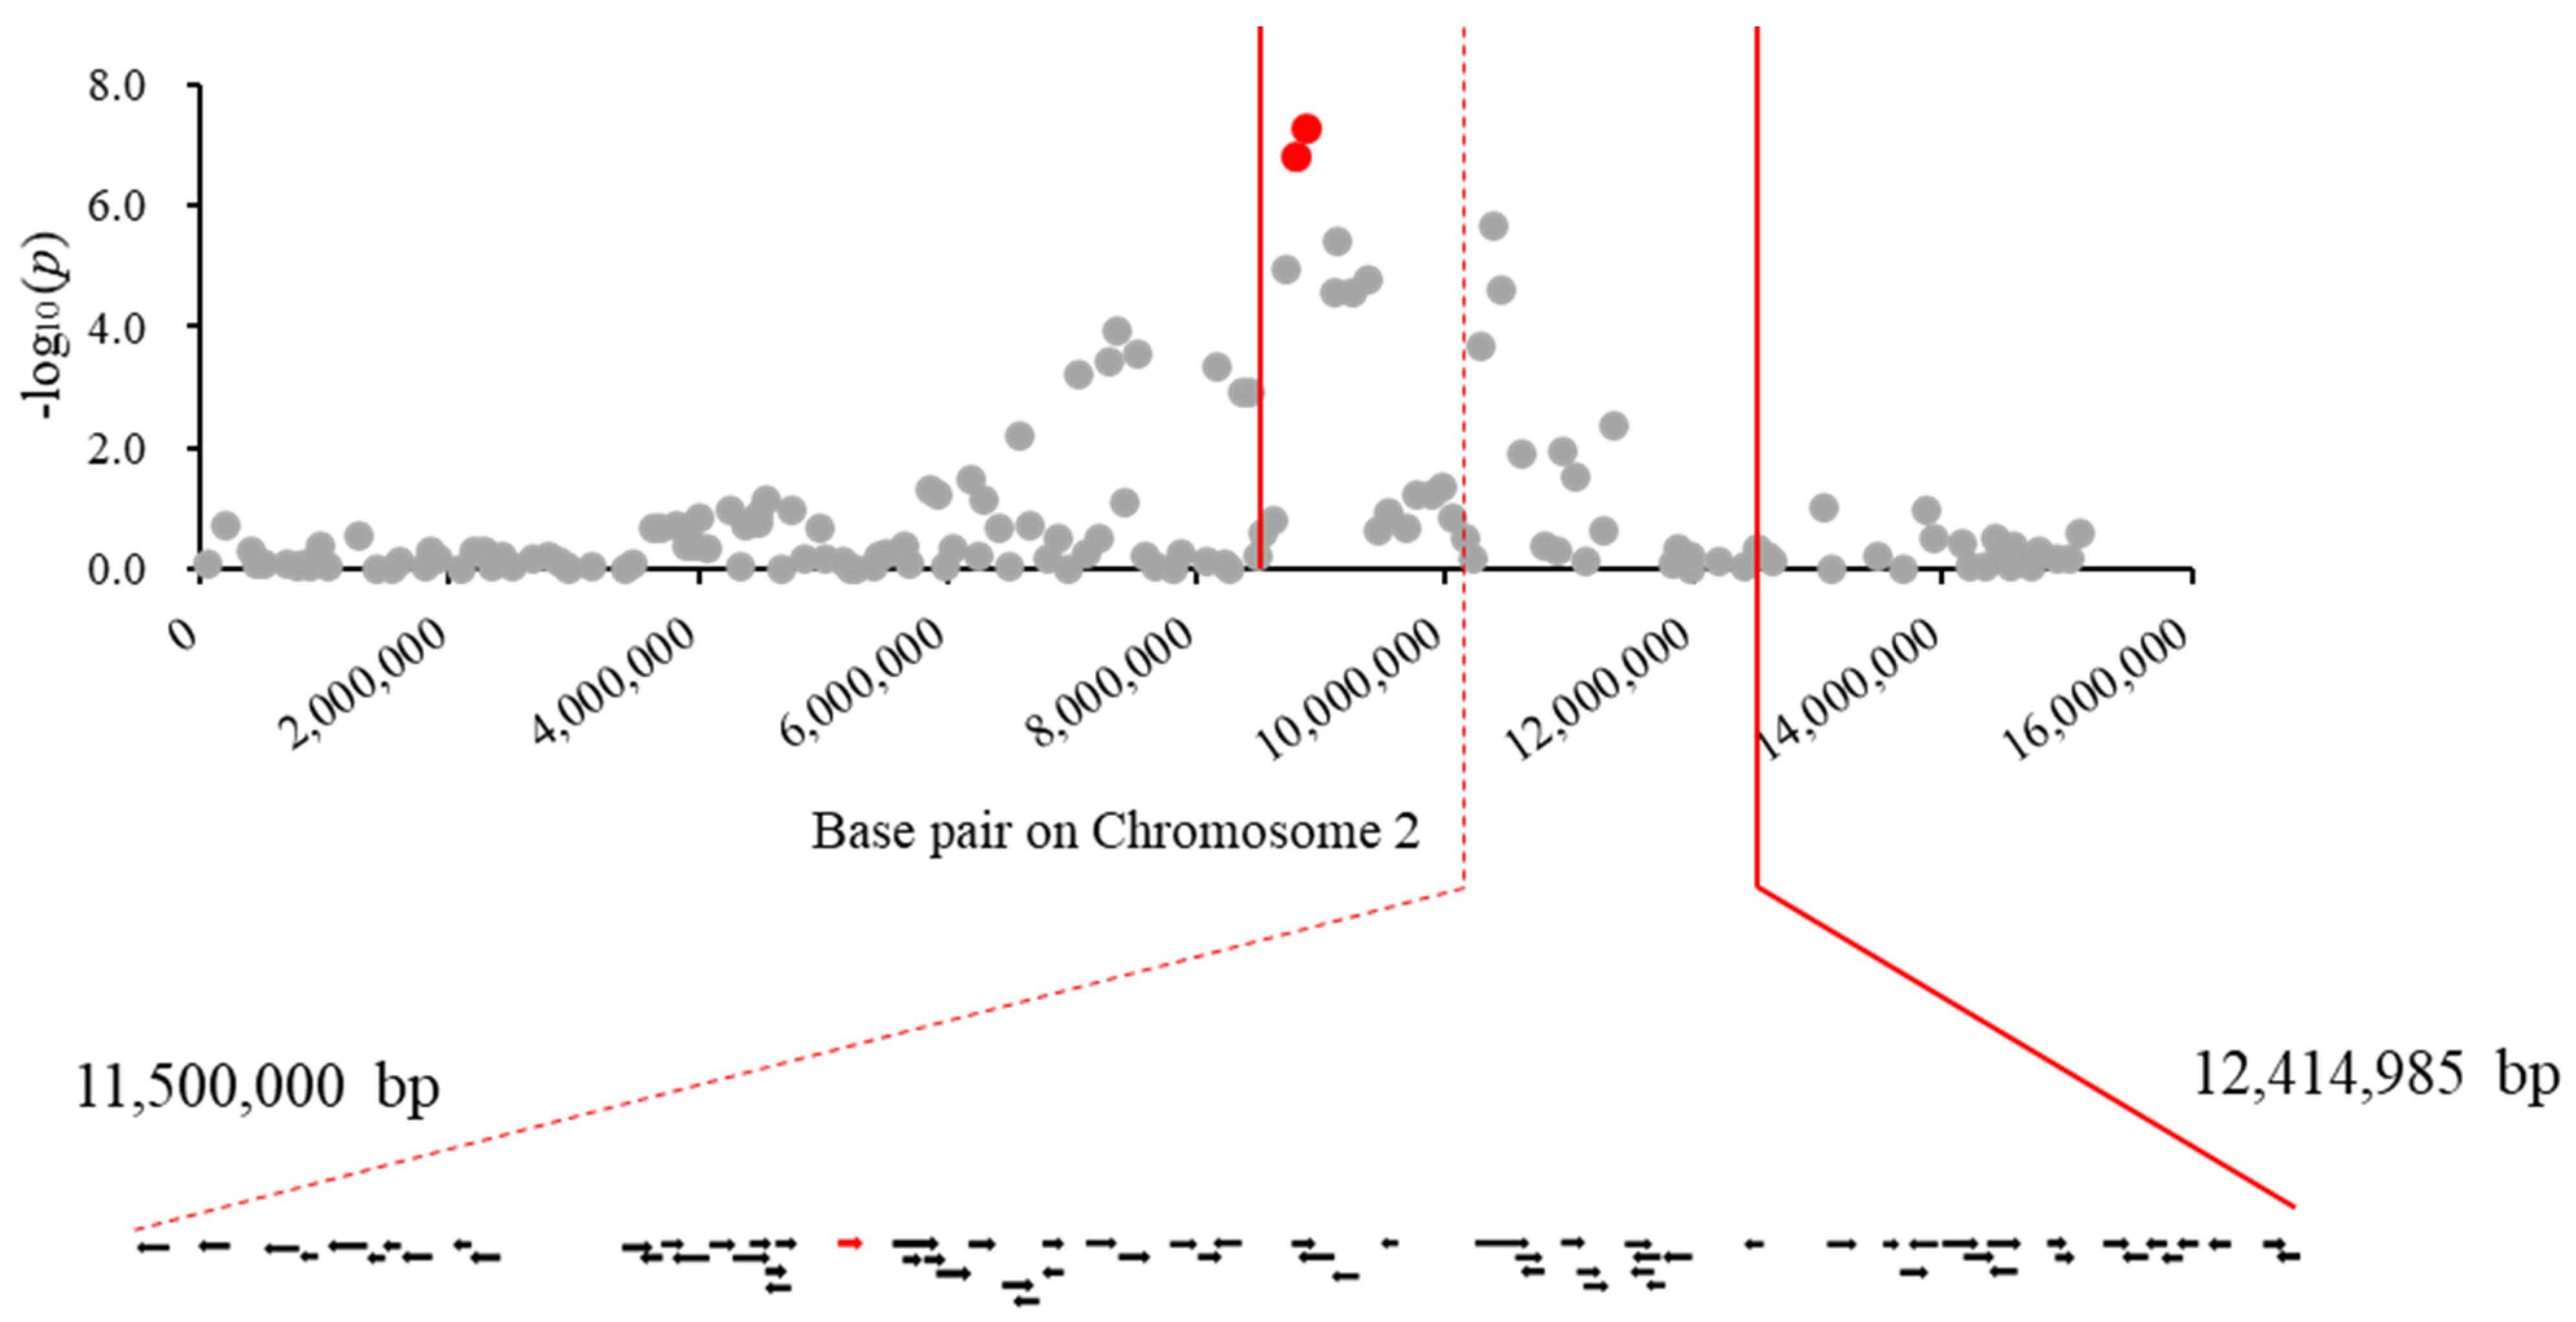
3.3. GWAS of HSW in BLG Accessions and Candidate Gene Prediction

In addition, six significant SNPs for HSW were located on chromosomes 2 and 16, respectively (p < 0.05). The most significant SNPs were Gm02_8896955 and Gm16_31822897 on chromosomes 2 and 16, respectively. For further analysis, this study indicated that genotype “A” is represented as adenine base of Gm02_8896955, whereas “a” is guanine base of Gm02_8896955. Genotype “B” indicates the adenine base of Gm16_31822897 and “b” shows the guanine base of Gm16_31822897. Based on the genotype of SNP Gm02_8896955, the HSW in genotype “AA” had 34.5 ± 8.3 g (mean ± standard deviation), which is significantly higher than the one in genotype “aa” (20.9 ± 6.2 g) (Figure 2A). The interaction of two SNPs was shown in Figure 2B. The genotype “AABB” was shown to be significantly higher than other genotypes. In addition, genotype “aabb” (17.6 ± 3.9 g) exhibited the smallest seed size in BLG accessions. Although they did not show significance between genotypes “AAbb” and “aaBB,” the mean values of HSW for “AAbb” and “aaBB” were 29.2 g and 24.2 g, respectively. For the HSW trait, there were 255 genes in the LD block on chromosome 2 and the encoded genes are shown in part of the LD block (Figure 3). Among them, a candidate gene GmCYP78A57 encoded the Cytochromes P450 gene family, which has been shown in Arabidopsis and soybean to be associated with seed size. In this study, a SNP on chromosome 16 has a minor allelic effect, but may be associated with HSW in BLG accessions in this study.

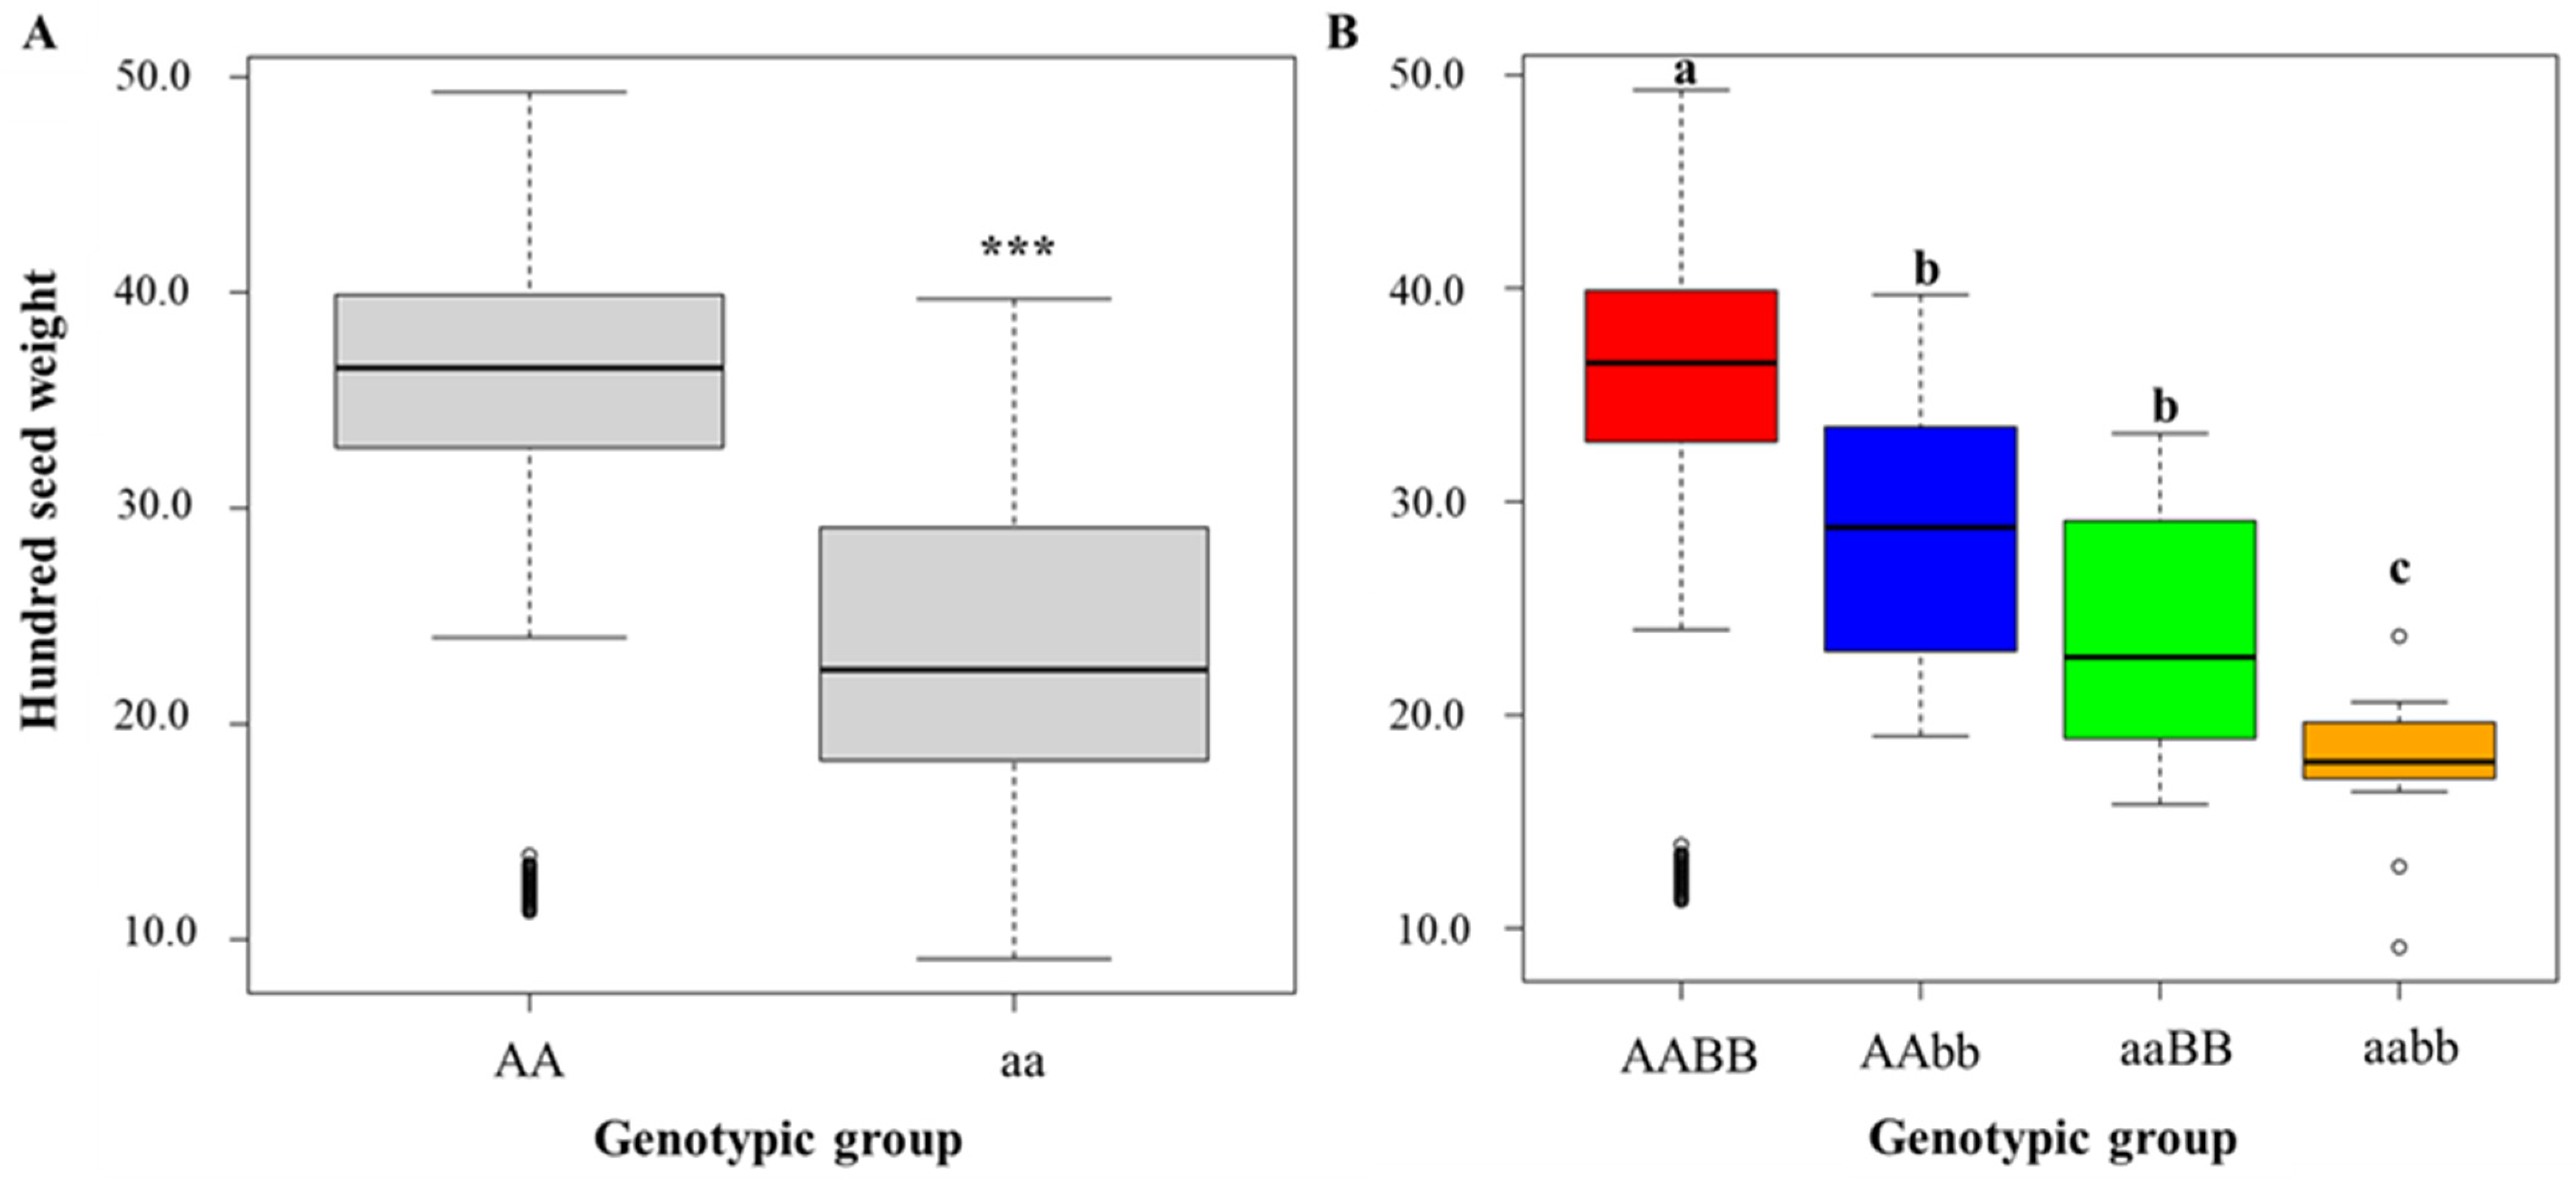
3.4. Allelic Variation of Candidate Gene Analyzed with Publicly Available Genome Sequencing Data

GmCYP78A57 consists of two exons and one intron with the gene structure shown in Figure 4A. Soybean allele catalog, an online tool, was used to identify the allelic variation of GmCYP78A57 with publicly available genomic sequence data. In this study, we have used 952 accessions including 107 Glycine soja, 649 soybean cultivars, 196 landrace, and 146 undefined accessions (Figure 4B). There were 11 missense mutations and one frameshift in exons 1 and 2 of GmCYP78A57, namely: A-T at physical position 11,775,156; T-C at 11,775,225; deletion of G at 11,775,251; C-T at 11,775,266; T-C at 11,775,270; T-C at 11,775,297; G-A at 11,775,425; G-A at 11,775,440; G-A at 11,775,450; C-G at 11,775,686; G-T at 11,775,753; and C-G at 11,776,568, respectively (Figure 4B). Red lines of variants represented ones of cultivars, whereas blue lines of variants were from wild soybean. Among them, nine missense mutations were shown from the wild soybean accessions, whereas three variants were from the genome of cultivars. These results indicated that there are wider allelic variations in the wild soybean than in the cultivars. In addition, 91% of total accessions (868 out of 952), including Glycine soja, cultivars, and landrace had functional GmCYP78A57. Forty-three cultivars representing 95.6% of total cultivars (43/45 cultivars) had SNP variant at position A11,775,440G, resulting in a glycine-to-serine variant at amino acid position 110.

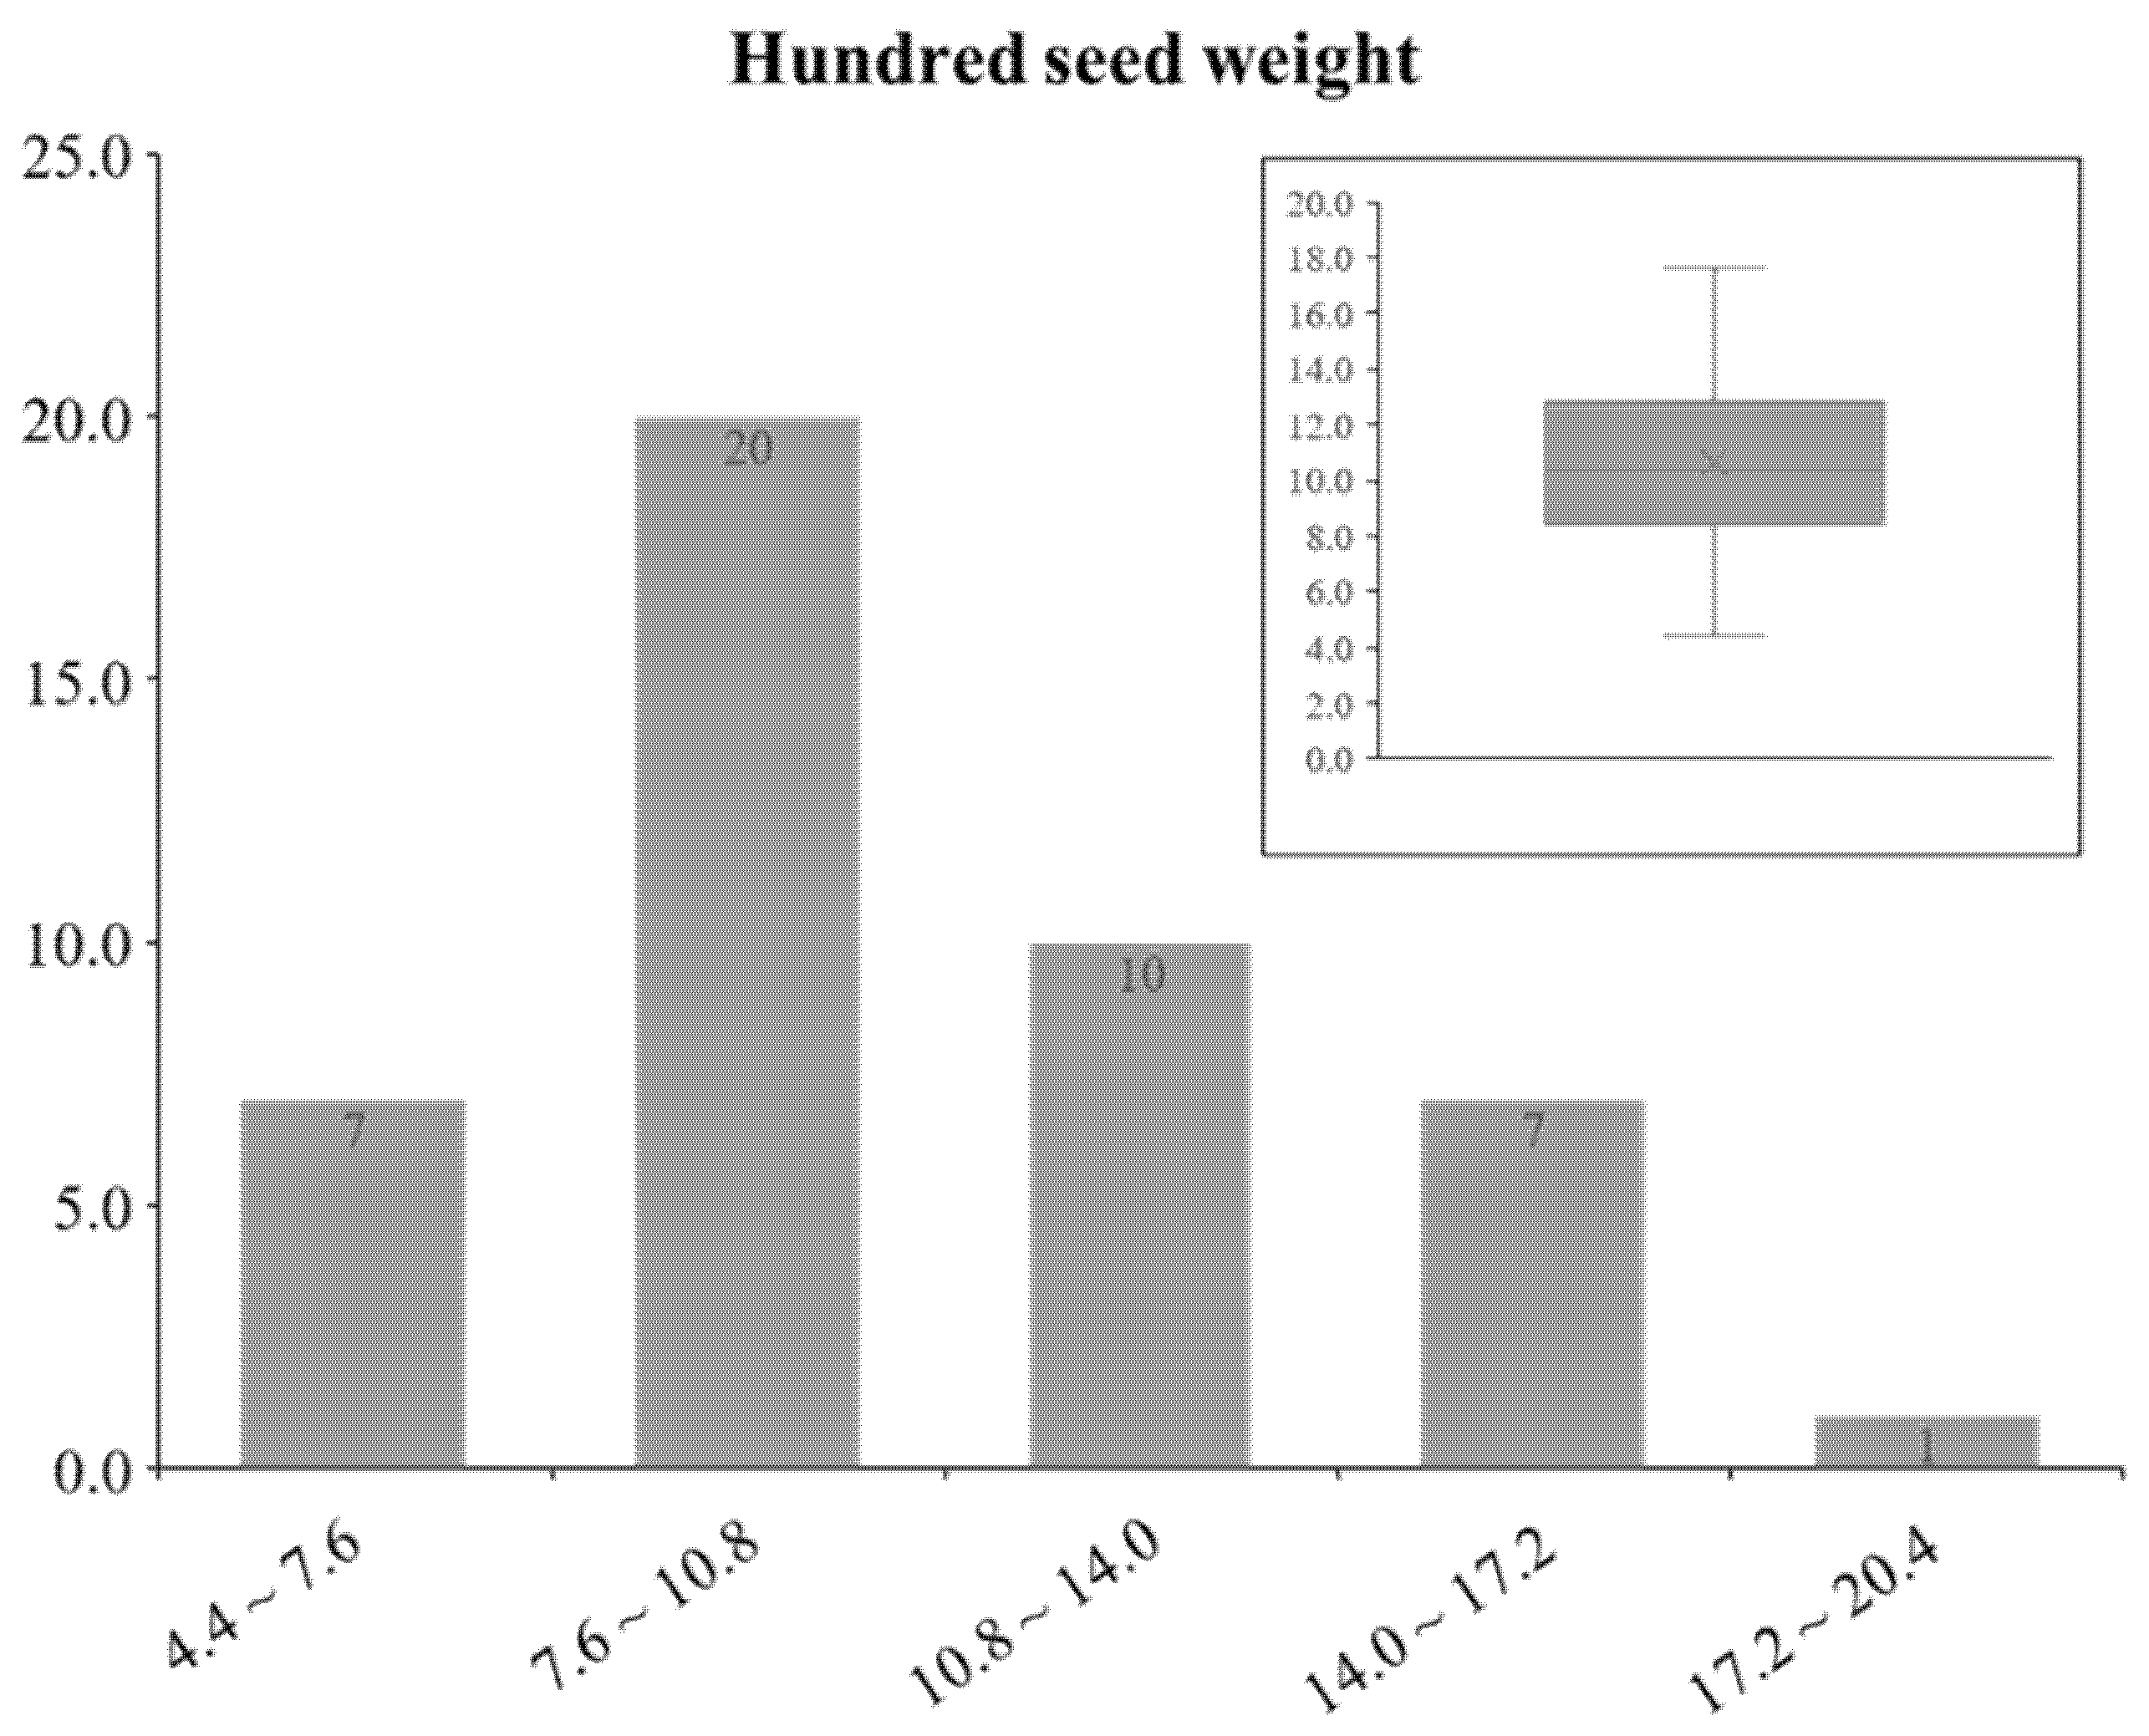
3.5. Phenotypic Data Set of HSW from GRIN

The influence of the possible candidate gene, GmCYP78A57 on seed size was investigated by comparing the variants of cultivars with reported GRIN seed weight available on SoyBase [49]. Of the 69 soybean cultivars and landraces, 45 accessions have been reported to HSW data, consisting of 26 soybean cultivars and 19 landraces (Figure 5; Supplementary Table S1). Of these, only PI416890 had a SNP variant at position G11,775,425A, resulting in an alanine-to-threonine variant at amino acid position 105, whereas the rest of them had a G110S variant. The HSW of these accessions was from 4.4 to 17.6 g, with 10.6 ± 3.2 g. Nineteen accessions were shown to be less than 10.0 g of HSW.

4. Discussion

BLG soybeans have been used as traditional ingredients in medicinal treatments in China, Japan, and Korea [44]. Studies have indicated that daily consumption of black soybeans may reduce the risk of breast cancer and cardiovascular diseases [67,68,69,70]. Due to the health benefits of BLG soybean, consumers prefer to use it to cook with rice and other side dishes in Korea. Higher HSW is an interesting trait to develop a new BLG cultivar in Korea due to consumers’ preference [71]. This study investigated the phenotypic variation of HSW in BLG accessions, ranging from 9.1 to 49.3 g, with a mean value of 33.9 g (Figure 1C). Among them, 380 accessions had more than 30.0 g in HSW. The power of GWAS to detect the significant SNPs associated with the trait of interest is determined by the phenotypic variance [72,73]. We assumed that BLG accessions could be valuable materials to identify the genes to increase seed size in soybeans. In addition, with BLG accessions, our previous study reported that most significant SNPs related to anthocyanin compositions were colocalized with the O locus, which corresponded with an anthocyanidin reductase gene and R locus, which is the R2R3 MYB transcription factor for upregulating UDP-glycose: flavonoid 3-O-glycosyltranferase (UF3GT) in black soybeans [55].
Seed weight is an important yield component in soybeans, with a positive correlation between HSW and yield [5,6]. Although HSW is a complex and quantitative trait, understanding its genetic basis can provide useful information to improve the potentials of soybean yield. The genetic studies for seed size have been well-reported in Arabidopsis and rice. In Arabidopsis, the CYP78A5 (KLU) gene encoded Cytochromes P450 gene family were reported to control increased flower and seed size [36]. With ortholog of CYP78A5, Zhao et al. [42] indicated that GmCYP78A genes were associated with the regulation of seed size in soybeans through reverse genetic approaches, such as overexpression and knock-down. They found that GmCYP78A72 was overexpressed in soybeans and Arabidopsis, resulting in increased seed size. However, knock-down of a single GmCYP78A72 gene did not result in decreased seed size in soybean, whereas triple variants of GmCYP78A genes reduced the soybean seed in transgenic plants [42]. In addition, Wang et al. [43] found that mutant alleles of GmCYP78A10 in wild and cultivated soybean were associated with smaller seed size. In this study, significant SNPs were identified to control the seed size of soybean on chromosome 2 through a forward genetic approach. Guanine base of the most significant SNP on chromosome 2 statistically reduced the seed size of BLG accessions. The result of this study indicated that GmCYP78A57 may be a possible candidate gene for controlling the seed size in soybean. In addition, an interaction plot between SNPs on chromosomes 2 and 16 supported that QTL on chromosome 16 showed a minor allelic effect for seed size in this study (Figure 2). This result assumed that another gene on chromosome 16 may be playing an important role of additive effect to reduce seed size with GmCYP78A57.
The molecular mechanisms to control the seed size were well identified in Arabidopsis and rice. Several signaling pathways have been shown to control seed size [26]. In soybean, genes for soybean seed size were identified to be involved in different pathways. The complex of PPD/KIX/TPL is involved in cell proliferation, resulting in increased soybean seed size [31]. In addition, PP2C (Glyma.17G221100) associated with brassinosteroid signaling from Chinese wild soybean have been identified to control seed weight [33]. Identified loci, in this study, may be associated with CYP78A genes. BLG accessions with small-seed sizes were still shown in genotypic group “AA” of Gm02_8896955 (Figure 2A). The result of this study assumed that small-seed sizes of BLG accessions with “AA” of Gm02_8896955 were involved in different pathways to reduce seed weight. In addition, our previous study reported the analyses of population structure and PCA to reveal three clusters in 470 BLG accessions. Small-seed sizes of BLG accessions with “AA” of Gm02_8896955 were in cluster 3, whereas the ones with the “aabb” genotype belonged to cluster 2, which had relatively higher genetic diversity than clusters 1 and 3 [55]. As small-seed sizes in the “AA” genotype of Gm02_8896955 may be associated with other genes for HSW, further research like linkage analysis with a bi-parental mapping population will be required to identify genes to control seed weight with BLG accessions in “AA” genotype of Gm02_8896955.
The amount of re-sequencing data on soybean has risen to be publicly available over the last decade [49,50,51,52]. Online tools and databases have been developed with genome sequencing data. In this study, the soybean allele catalog, an online tool, was used to identify the allelic variation of GmCYP78A57 through SoyKB [65], revealing 11 missense mutations and one deletion in exons (Figure 4). Of these, 10 variants of GmCYP78A57 were shown in wild soybean accessions. We supported that wild soybean accessions showed a wide range of allelic variations.
The growth habits of soybean are classified as determinate, indeterminate, and semi-determinate types [74]. Dt1 (Glyma.19G194300) is homolog of Arabidopsis terminal flower 1 (TFL1). Mutations in the dt1 gene cause the transition from indeterminate to determinate phenotype in soybeans [75]. The trait of growth habit in soybeans is a critical one that affects the flowering time, plant height, number of nodes, and maturity, thereby resulting in soybean production [75,76,77,78]. A second gene, Dt2 (Glyma.18G273600) encoded MADS-domain factor gene were identified for the stem growth habit in soybean [74]. Semi-determinate were determined by the dt2dt2 genotype along with Dt1Dt1 background, whereas the Dt1Dt1Dt2Dt2 genotype in soybean had an indeterminate growth habit. In this study, a correlation analysis demonstrated that plant height was strongly positively correlated with the number of nodes (r = 0.84, p < 0.001). In addition, a most significant SNP (Gm19_45204441) was colocalized for plant height and number of nodes. In the haplotype block, a candidate gene for plant height and number of nodes may be the Dt1 gene in BLG accessions. Similarly, a GWAS with 419 diverse soybean plant introductions from 26 countries reported that the Dt1 gene showed pleotropic effects for plant height and internode number [25].
Our previous study reported that BLG collections exhibited narrow genetic variability [55]. BLG accessions may spread over a wide range of geographical areas by farmers’ distribution due to better performance and yield for a long history of soybean cultivation in South Korea. In this study, we supported to show the larger size of LD blocks on significant SNPs across different chromosomes. Moreover, the LD decay rate was approximately 1200 kb (Supplementary Figure S1). Although BLG accessions showed narrow genetic diversity, in this study, the phenotypic variation of HSW in BLG accessions, ranging from 9.1 to 49.3 g, indicated a wide range of phenotypic distribution. Thus, BLG accessions were suitable materials for studying HSW in soybean.
In conclusion, GWAS with 470 BLG accessions and 6K SNPs were conducted to identify significant SNPs for HSW on chromosomes 2 and 16. This study indicated that GmCYP78A57 may be a possible candidate gene for controlling the seed size in soybeans, and the QTL on chromosome 16 showed a minor allelic effect for seed size. We assumed that another gene on chromosome 16 may play an important role of additive genetic effect to reduce seed size along with GmCYP78A57. This information can provide the development of molecular markers to use in soybean breeding programs to release a new BLG cultivar with increased or decreased seed weight and improved soybean yield.

Supplementary Materials

The following supporting information can be downloaded at: https://www.mdpi.com/article/10.3390/agronomy12020250/s1. Supplementary Figure S1: The mean level of linkage disequilibrium in 470 BLG accessions. Supplementary Table S1: Hundred seed weight and missense mutation from GRIN database and publicly available genome sequences.

Author Contributions

Conceptualization, J.-D.L.; formal analysis, H.J. and J.Y.L.; investigation, H.J. and J.Y.L.; writing—original draft preparation, H.J.; writing—review and editing, H.J., J.Y.L. and J.-D.L. All authors have read and agreed to the published version of the manuscript.

Funding

This work was carried out with the support of “Cooperative Research Program for Agriculture Science and Technology Development (Project No. PJ01416803)” Rural Development Administration, Jeonju, Republic of Korea.

Institutional Review Board Statement

Not applicable.

Informed Consent Statement

Not applicable.

Data Availability Statement

The datasets generated during this study are available from the corresponding author on reasonable request.

Acknowledgments

The authors would like to acknowledge the personnel from the Plant Genetics and Breeding lab at the Kyungpook National University and Gyeongsangbuk-do Provincial Agricultural Research & Extension Service for their time and work on the field experiments.

Conflicts of Interest

The authors declare no conflict of interest.

References

  1. Liu, S.; Zhang, M.; Feng, F.; Tian, Z. Toward a “green revolution” for soybean. Mol. Plant 2020, 13, 688–697. [Google Scholar] [CrossRef] [PubMed]
  2. Ray, D.K.; Mueller, N.D.; West, P.C.; Foley, J.A. Yield trends are insufficient to double global crop production by 2050. PLoS ONE 2013, 8, e66428. [Google Scholar] [CrossRef] [PubMed] [Green Version]
  3. Liu, B.; Liu, X.B.; Wang, C.; Li, Y.S.; Jin, J.; Herbert, S.J. Soybean yield and yield component distribution across the main axis in response to light enrichment and shading under different densities. Plant Soil Environ. 2010, 56, 384–392. [Google Scholar] [CrossRef] [Green Version]
  4. Burris, J.S.; Edje, O.T.; Wahab, A.H. Effect of seed size on seedling performance in soybeans. II. Seedling growth and photosynthesis and field performance. Crop Sci. 1973, 13, 207–210. [Google Scholar] [CrossRef]
  5. Smith, T.J.; Camper, H.M. Effect of seed size on soybean performance. Agron. J. 1975, 67, 681–684. [Google Scholar] [CrossRef]
  6. Maughan, P.J.; Maroof, M.S.; Buss, G.R. Molecular marker analysis of seed-weight: Genomic locations, gene action, and evidence for orthologous evolution among three legume species. Theor. Appl. Genet. 1996, 93, 574–579. [Google Scholar] [CrossRef]
  7. Mian, M.A.; Bailey, M.A.; Tamulonis, J.P.; Shipe, E.R.; Carter, T.E.; Parrott, W.A.; Ashley, D.A.; Hussey, R.S.; Boerma, H.R. Molecular markers associated with seed weight in two soybean populations. Theor. Appl. Genet. 1996, 93, 1011–1016. [Google Scholar] [CrossRef]
  8. Wilson, D. Storage of orthodox seeds. In Seed Quality: Basic Mechanisms, Agricultural Implications, 1st ed.; Basra, A.S., Ed.; CRC Press: New York, NY, USA, 1995; pp. 173–208. [Google Scholar]
  9. Brim, C.A.; Cockerham, C.C. Inheritance of quantitative characters in soybean. Crop Sci. 1961, 1, 187–190. [Google Scholar] [CrossRef] [Green Version]
  10. SoyBase. Available online: www.soybase.org (accessed on 11 November 2021).
  11. Yan, L.; Hofmann, N.; Li, S.; Ferreira, M.E.; Song, B.; Jiang, G.; Ren, S.; Quigley, C.; Fickus, E.; Cregan, P.; et al. Identification of QTL with large effect on seed weight in a selective population of soybean with genome-wide association and fixation index analyses. BMC Genom. 2017, 18, 529. [Google Scholar] [CrossRef] [Green Version]
  12. Zhang, J.; Song, Q.; Cregan, P.B.; Jiang, G.L. Genome-wide association study, genomic prediction and marker-assisted selection for seed weight in soybean (Glycine max). Theor. Appl. Genet. 2016, 129, 117–130. [Google Scholar] [CrossRef] [PubMed] [Green Version]
  13. Hwang, E.Y.; Song, Q.; Jia, G.; Specht, J.E.; Hyten, D.L.; Costa, J.; Cregan, P.B. A genome-wide association study of seed protein and oil content in soybean. BMC Genom. 2014, 15, 1. [Google Scholar] [CrossRef] [Green Version]
  14. Sonah, H.; O’Donoughue, L.; Cober, E.; Rajcan, I.; Belzile, F. Identification of loci governing eight agronomic traits using a GBS-GWAS approach and validation by QTL mapping in soya bean. Plant Biotechnol. J. 2015, 13, 211–221. [Google Scholar] [CrossRef] [PubMed]
  15. Wen, Z.; Tan, R.; Yuan, J.; Bales, C.; Du, W.; Zhang, S.; Chilvers, M.I.; Schmidt, C.; Song, Q.; Cregan, P.B. Genome-wide association mapping of quantitative resistance to sudden death syndrome in soybean. BMC Genom. 2014, 15, 809. [Google Scholar] [CrossRef] [PubMed] [Green Version]
  16. Zhang, J.; Singh, A.; Mueller, D.S.; Singh, A.K. Genome-wide association and epistasis studies unravel the genetic architecture of sudden death syndrome resistance in soybean. Plant J. 2015, 84, 1124–1136. [Google Scholar] [CrossRef] [Green Version]
  17. Zhang, Y.; He, J.; Wang, Y.; Xing, G.; Zhao, J.; Li, Y.; Yang, S.; Palmer, R.; Zhao, T.; Gai, J. Establishment of a 100-seed weight quantitative trait locus–allele matrix of the germplasm population for optimal recombination design in soybean breeding programmes. J. Exp. Bot. 2015, 66, 6311–6325. [Google Scholar] [CrossRef] [PubMed] [Green Version]
  18. Kaler, A.S.; Purcell, L.C. Association mapping identifies and confirms loci for soybean seed weight. Crop Sci. 2021, 61, 1289–1300. [Google Scholar] [CrossRef]
  19. Karikari, B.; Wang, Z.; Zhou, Y.; Yan, W.; Feng, J.; Zhao, T. Identification of quantitative trait nucleotides and candidate genes for soybean seed weight by multiple models of genome-wide association study. BMC Plant Biol. 2020, 20, 404. [Google Scholar] [CrossRef]
  20. Assefa, T.; Otyama, P.I.; Brown, A.V.; Kalberer, S.R.; Kulkarni, R.S.; Cannon, S.B. Genome-wide associations and epistatic interactions for internode number, plant height, seed weight and seed yield in soybean. BMC Genom. 2019, 20, 527. [Google Scholar] [CrossRef] [Green Version]
  21. Teng, W.; Feng, L.; Li, W.; Wu, D.; Zhao, X.; Han, Y.; Li, W. Dissection of the genetic architecture for soybean seed weight across multiple environments. Crop Pasture Sci. 2017, 68, 358–365. [Google Scholar] [CrossRef]
  22. Han, Y.; Li, D.; Zhu, D.; Li, H.; Li, X.; Teng, W.; Li, W. QTL analysis of soybean seed weight across multi-genetic backgrounds and environments. Theor. Appl. Genet. 2012, 125, 671–683. [Google Scholar] [CrossRef]
  23. Yan, L.; Li, Y.H.; Yang, C.Y.; Ren, S.X.; Chang, R.Z.; Zhang, M.C.; Qiu, L.J. Identification and validation of an over-dominant QTL controlling soybean seed weight using populations derived from Glycine max × Glycine soja. Plant Breed. 2014, 133, 632–637. [Google Scholar] [CrossRef]
  24. Kulkarni, K.P.; Kim, M.; Shannon, J.G.; Lee, J.D. Identification of quantitative trait loci controlling soybean seed weight in recombinant inbred lines derived from PI 483463 (Glycine soja) × ‘Hutcheson’ (G. max). Plant Breed. 2016, 135, 614–620. [Google Scholar] [CrossRef]
  25. Yu, M.; Liu, Z.; Jiang, S.; Xu, N.; Chen, Q.; Qi, Z.; Lv, W. QTL mapping and candidate gene mining for soybean seed weight per plant. Biotechnol. Biotechnol. Equip. 2018, 32, 908–914. [Google Scholar] [CrossRef] [Green Version]
  26. Li, N.; Xu, R.; Li, Y. Molecular networks of seed size control in plants. Annu. Rev. Plant Biol. 2019, 70, 435–463. [Google Scholar] [CrossRef]
  27. Baekelandt, A.; Pauwels, L.; Wang, Z.; Li, N.; De Milde, L.; Natran, A.; Vermeersch, M.; Li, Y.; Goossens, A.; Inzé, D.; et al. Arabidopsis leaf flatness is regulated by PPD2 and NINJA through repression of CYCLIN D3 genes. Plant Physiol. 2018, 178, 217–232. [Google Scholar] [CrossRef] [PubMed] [Green Version]
  28. Gonzalez, N.; Pauwels, L.; Baekelandt, A.; De Milde, L.; Van Leene, J.; Besbrugge, N.; Heyndrickx, K.S.; Pérez, A.C.; Durand, A.N.; De Clercq, R.; et al. A repressor protein complex regulates leaf growth in Arabidopsis. Plant Cell 2015, 27, 2273–2287. [Google Scholar] [CrossRef] [PubMed] [Green Version]
  29. Wang, Z.; Li, N.; Jiang, S.; Gonzalez, N.; Huang, X.; Wang, Y.; Inze, D.; Li, Y. SCFSAP controls organ size by targeting PPD proteins for degradation in Arabidopsis thaliana. Nat. Commun. 2016, 7, 11192. [Google Scholar] [CrossRef] [Green Version]
  30. White, D.W. PEAPOD regulates lamina size and curvature in Arabidopsis. Proc. Natl. Acad. Sci. USA 2006, 103, 13238–13243. [Google Scholar] [CrossRef] [PubMed] [Green Version]
  31. Nguyen, C.X.; Paddock, K.J.; Zhang, Z.; Stacey, M.G. GmKIX8-1 regulates organ size in soybean and is the causative gene for the major seed weight QTL qSw17-1. New Phytol. 2021, 229, 920–934. [Google Scholar] [CrossRef]
  32. Sun, Z.; Su, C.; Yun, J.; Jiang, Q.; Wang, L.; Wang, Y.; Cao, D.; Zhao, F.; Zhao, Q.; Zhang, M.; et al. Genetic improvement of the shoot architecture and yield in soya bean plants via the manipulation of GmmiR156b. Plant Biotechnol. J. 2019, 17, 50–62. [Google Scholar] [CrossRef] [Green Version]
  33. Lu, X.; Xiong, Q.; Cheng, T.; Li, Q.T.; Liu, X.L.; Bi, Y.D.; Li, W.; Zhang, W.K.; Ma, B.; Lai, Y.C.; et al. A PP2C-1 allele underlying a quantitative trait locus enhances soybean 100-seed weight. Mol. Plant 2017, 10, 670–684. [Google Scholar] [CrossRef] [Green Version]
  34. Helliwell, C.A.; Peacock, W.J.; Dennis, E.S. Isolation and functional characterization of cytochrome P450s in gibberellin biosynthesis pathway. Methods Enzymol. 2002, 357, 381–388. [Google Scholar] [CrossRef] [PubMed]
  35. Hull, A.K.; Vij, R.; Celenza, J.L. Arabidopsis cytochrome P450s that catalyze the first step of tryptophan-dependent indole- 3-acetic acid biosynthesis. Proc. Natl. Acad. Sci. USA 2000, 97, 2379–2384. [Google Scholar] [CrossRef] [PubMed] [Green Version]
  36. Anastasiou, E.; Kenz, S.; Gerstung, M.; MacLean, D.; Timmer, J.; Fleck, C.; Lenhard, M. Control of plant organ size by KLUH/CYP78A5-dependent intercellular signaling. Dev. Cell 2007, 13, 843–856. [Google Scholar] [CrossRef] [Green Version]
  37. Fang, W.; Wang, Z.; Cui, R.; Li, J.; Li, Y. Maternal control of seed size by EOD3/CYP78A6 in Arabidopsis thaliana. Plant J. 2012, 70, 929–939. [Google Scholar] [CrossRef] [PubMed]
  38. Nagasawa, N.; Hibara, K.I.; Heppard, E.P.; Vander Velden, K.A.; Luck, S.; Beatty, M.; Nagato, Y.; Sakai, H. GIANT EMBRYO encodes CYP78A13, required for proper size balance between embryo and endosperm in rice. Plant J. 2013, 75, 592–605. [Google Scholar] [CrossRef]
  39. Xu, F.; Fang, J.; Ou, S.; Gao, S.; Zhang, F.; Du, L.; Xiao, Y.; Wang, H.; Sun, X.; Chu, J.; et al. Variations in CYP78A13 coding region influence grain size and yield in rice. Plant Cell Environ. 2015, 38, 800–811. [Google Scholar] [CrossRef]
  40. Yang, W.; Gao, M.; Yin, X.; Liu, J.; Xu, Y.; Zeng, L.; Li, Q.; Zhang, S.; Wang, J.; Zhang, X.; et al. Control of rice embryo development, shoot apical meristem maintenance, and grain yield by a novel cytochrome p450. Mol. Plant 2013, 6, 1945–1960. [Google Scholar] [CrossRef] [Green Version]
  41. Miyoshi, K.; Ahn, B.O.; Kawakatsu, T.; Ito, Y.; Itoh, J.; Nagato, Y.; Kurata, N. PLASTOCHRON1, a timekeeper of leaf initiation in rice, encodes cytochrome P450. Proc. Natl. Acad. Sci. USA 2004, 101, 875–880. [Google Scholar] [CrossRef] [Green Version]
  42. Zhao, B.; Dai, A.; Wei, H.; Yang, S.; Wang, B.; Jiang, N.; Feng, X. Arabidopsis KLU homologue GmCYP78A72 regulates seed size in soybean. Plant Mol. Biol. 2016, 90, 33–47. [Google Scholar] [CrossRef]
  43. Wang, X.; Li, Y.; Zhang, H.; Sun, G.; Zhang, W.; Qiu, L. Evolution and association analysis of GmCYP78A10 gene with seed size/weight and pod number in soybean. Mol. Biol. Rep. 2015, 42, 489–496. [Google Scholar] [CrossRef]
  44. Xu, B.; Chang, S.K. Antioxidant capacity of seed coat, dehulled bean, and whole black soybeans in relation to their distributions of total phenolics, phenolic acids, anthocyanins, and isoflavones. J. Agric. Food Chem. 2008, 56, 8365–8373. [Google Scholar] [CrossRef] [PubMed]
  45. Lee, J.Y.; Choi, H.J.; Son, C.K.; Bae, J.S.; Jo, H.; Lee, J.D. Genetic diversity of black soybean germplasms with green cotyledon based on agronomic traits and cotyledon pigments. Korean J. Breed. Sci. 2021, 53, 127–139. [Google Scholar] [CrossRef]
  46. Yan, W.; Yingpeng, H.; Xue, Z.; Yongguang, L.; Weili, T.; Dongmei, L.; Yong, Z.; Wenbin, L. Mapping isoflavone QTL with main, epistatic and QTL × environment effects in recombinant inbred lines of soybean. PLoS ONE. 2015, 10, e0118447. [Google Scholar] [CrossRef]
  47. Schmutz, J.; Cannon, S.B.; Schlueter, J.; Ma, J.; Mitros, T.; Nelson, W.; Hyten, D.L.; Song, Q.; Thelen, J.J.; Cheng, J.; et al. Genome sequence of the palaeopolyploid soybean. Nature 2010, 463, 178–183. [Google Scholar] [CrossRef] [PubMed] [Green Version]
  48. Kim, M.Y.; Lee, S.; Van, K.; Kim, T.H.; Jeong, S.C.; Choi, I.Y.; Kim, D.S.; Lee, Y.S.; Park, D.; Ma, J.; et al. Whole-genome sequencing and intensive analysis of the undomesticated soybean (Glycine soja Sieb. and Zucc.) genome. Proc. Natl. Acad. Sci. USA 2010, 107, 22032–22037. [Google Scholar] [CrossRef] [Green Version]
  49. Fang, C.; Ma, Y.; Wu, S.; Liu, Z.; Wang, Z.; Yang, R.; Hu, G.; Zhou, Z.; Yu, H.; Zhang, M.; et al. Genome-wide association studies dissect the genetic networks underlying agronomical traits in soybean. Genome Biol. 2017, 18, 161. [Google Scholar] [CrossRef]
  50. Kim, M.S.; Lozano, R.; Kim, J.H.; Bae, D.N.; Kim, S.T.; Park, J.H.; Choi, M.S.; Kim, J.; Ok, H.C.; Park, S.K.; et al. The patterns of deleterious mutations during the domestication of soybean. Nat. Commun. 2021, 12, 97. [Google Scholar] [CrossRef] [PubMed]
  51. Valliyodan, B.; Qiu, D.; Patil, G.; Zeng, P.; Huang, J.; Dai, L.; Chen, C.; Li, Y.; Joshi, T.; Song, L.; et al. Landscape of genomic diversity and trait discovery in soybean. Sci. Rep. 2016, 6, 23598. [Google Scholar] [CrossRef] [Green Version]
  52. Valliyodan, B.; Brown, A.V.; Wang, J.; Patil, G.; Liu, Y.; Otyama, P.I.; Nelson, R.T.; Vuong, T.; Song, Q.; Musket, T.A.; et al. Genetic variation among 481 diverse soybean accessions, inferred from genomic re-sequencing. Sci. Data 2021, 8, 50. [Google Scholar] [CrossRef]
  53. Phytozome. Available online: https://phytozome-next.jgi.doe.gov/ (accessed on 11 November 2021).
  54. SoyKB. Available online: https://soykb.org/ (accessed on 11 November 2021).
  55. Jo, H.; Lee, J.Y.; Cho, H.; Choi, H.J.; Son, C.K.; Bae, J.S.; Bilyeu, K.; Song, J.T.; Lee, J.D. Genetic Diversity of Soybeans (Glycine max (L.) Merr.) with Black Seed Coats and Green Cotyledons in Korean Germplasm. Agronomy 2021, 11, 581. [Google Scholar] [CrossRef]
  56. Fehr, W.R.; Caviness, C.E.; Burmood, D.T.; Pennington, J.S. Stage of development descriptions for soybeans, Glycine Max (L.) Merrill1. Crop Sci. 1971, 11, 929–931. [Google Scholar] [CrossRef]
  57. Doyle, J.; Doyle, J.L. Genomic plant DNA preparation from fresh tissue-CTAB method. Phytochem Bull 1987, 19, 11–15. [Google Scholar]
  58. Song, Q.; Yan, L.; Quigley, C.; Fickus, E.; Wei, H.; Chen, L.; Dong, F.; Araya, S.; Liu, J.; Hyten, D.; et al. Soybean BARCSoySNP6K: An assay for soybean genetics and breeding research. Plant J. 2020, 104, 800–811. [Google Scholar] [CrossRef] [PubMed]
  59. Song, Q.; Hyten, D.L.; Jia, G.; Quigley, C.V.; Fickus, E.W.; Nelson, R.L.; Cregan, P.B. Development and evaluation of SoySNP50K, a high-density genotyping array for soybean. PLoS ONE 2013, 8, e54985. [Google Scholar] [CrossRef] [PubMed] [Green Version]
  60. Bradbury, P.J.; Zhang, Z.; Kroon, D.E.; Casstevens, T.M.; Ramdoss, Y.; Buckler, E.S. TASSEL: Software for association mapping of complex traits in diverse samples. Bioinform 2007, 23, 2633–2635. [Google Scholar] [CrossRef] [PubMed]
  61. Zhang, Z.; Ersoz, E.; Lai, C.Q.; Todhunter, R.J.; Tiwari, H.K.; Gore, M.A.; Bradbury, P.J.; Yu, J.; Arnett, D.K.; Ordovas, J.M.; et al. Mixed linear model approach adapted for genome-wide association studies. Nat. Genet. 2010, 42, 355–360. [Google Scholar] [CrossRef] [PubMed] [Green Version]
  62. Yu, J.; Pressoir, G.; Briggs, W.H.; Bi, I.V.; Yamasaki, M.; Doebley, J.F.; McMullen, M.D.; Gaut, B.S.; Nielsen, D.M.; Holland, J.B.; et al. A unified mixed-model method for association mapping that accounts for multiple levels of relatedness. Nat. Genet. 2006, 38, 203–208. [Google Scholar] [CrossRef]
  63. Remington, D.L.; Thornsberry, J.M.; Matsuoka, Y.; Wilson, L.M.; Whitt, S.R.; Doebley, J.; Kresovich, S.; Goodman, M.M.; Buckler, E.S. Structure of linkage disequilibrium and phenotypic associations in the maize genome. Proc. Natl. Acad. Sci. USA 2001, 98, 11479–11484. [Google Scholar] [CrossRef] [Green Version]
  64. Huang, X.H.; Wei, X.H.; Sang, T.; Zhao, Q.A.; Feng, Q.; Zhao, Y.; Li, C.Y.; Zhu, C.R.; Lu, T.T.; Zhang, Z.W.; et al. Genome-wide association studies of 14 agronomic traits in rice landraces. Nat. Genet. 2010, 42, 961–976. [Google Scholar] [CrossRef]
  65. Soybean Allele Catalog. Available online: https://soykb.org/GenescapeAnalysis/search.php (accessed on 11 November 2021).
  66. GRIN Data Explorer. Available online: https://soybase.org/grindata/ (accessed on 11 November 2021).
  67. Do, M.H.; Lee, S.S.; Jung, P.J.; Lee, M.H. Intake of fruits, vegetables, and soy foods in relation to breast cancer risk in Korean women: A case-control study. Nutr. Cancer 2007, 57, 20–27. [Google Scholar] [CrossRef]
  68. Takahashi, R.; Ohmori, R.; Kiyose, C.; Momiyama, Y.; Ohsuzu, F.; Kondo, K. Antioxidant activities of black and yellow soybeans against low density lipoprotein oxidation. J. Agric. Food Chem. 2005, 53, 4578–4582. [Google Scholar] [CrossRef] [PubMed]
  69. Ganesan, K.; Xu, B. A critical review on polyphenols and health benefits of black soybeans. Nutrients 2017, 9, 455. [Google Scholar] [CrossRef] [PubMed] [Green Version]
  70. Jhan, J.K.; Chung, Y.C.; Chen, G.H.; Chang, C.H.; Lu, Y.C.; Hsu, C.K. Anthocyanin contents in the seed coat of black soya bean and their anti-human tyrosinase activity and antioxidative activity. Int. J. Cosmet. Sci. 2016, 38, 319–324. [Google Scholar] [CrossRef] [PubMed]
  71. Kim, Y.H.; Lee, J.H.; Lee, Y.S.; Yun, H.T. Antioxidant activity and extraction efficiency of anthocyanin pigments in black soybean. Korea Soybean Dig. 2006, 23, 1–9. [Google Scholar]
  72. Gibson, G. Rare and common variants: Twenty arguments. Nat. Rev. Genet. 2012, 13, 135–145. [Google Scholar] [CrossRef] [Green Version]
  73. Korte, A.; Farlow, A. The advantages and limitations of trait analysis with GWAS: A review. Plant Methods 2013, 9, 29. [Google Scholar] [CrossRef] [Green Version]
  74. Ping, J.; Liu, Y.; Sun, L.; Zhao, M.; Li, Y.; She, M.; Sui, Y.; Lin, F.; Liu, X.; Tang, Z.; et al. Dt2 is a gain-of-function MADS-domain factor gene that specifies semideterminacy in soybean. Plant Cell 2014, 26, 2831–2842. [Google Scholar] [CrossRef] [Green Version]
  75. Tian, Z.; Wang, X.; Lee, R.; Li, Y.; Specht, J.E.; Nelson, R.L.; McClean, P.E.; Qiu, L.; Ma, J. Artificial selection for determinate growth habit in soybean. Proc. Natl. Acad. Sci. USA 2010, 107, 8563–8568. [Google Scholar] [CrossRef] [Green Version]
  76. Bernard, R.L. Two genes affecting stem termination in soybeans. Crop Sci. 1972, 12, 235–239. [Google Scholar] [CrossRef]
  77. Heatherly, L.G.; Smith, J.R. Effect of soybean stem growth habit on height and node number after beginning bloom in the midsouthern USA. Crop Sci. 2004, 44, 1855–1858. [Google Scholar] [CrossRef]
  78. Specht, J.E.; Chase, K.; Macrander, M.; Graef, G.L.; Chung, J.; Markwell, J.P.; Germann, M.; Orf, J.H.; Lark, K.G. Soybean response to water: A QTL analysis of drought tolerance. Crop Sci. 2001, 41, 493–509. [Google Scholar] [CrossRef]
Figure 1. Manhattan plots, quantile-quantile (QQ) plot of MLM analysis and phenotypic distribution for plant height (A), number of node (B), and hundred seed weight (C). The horizontal green line indicates the genome-wide significance threshold (Bonferroni correction < 0.05).
Agronomy 12 00250 g001
Figure 2. Box plots of hundred-seed weight with BLG accessions. (A) Boxplot of two genotypic groups based on the most significant SNP on chromosome 2. (B) Boxplot of four genotypic groups showing the interaction of two SNPs on chromosome 2 and 16. Genotype “A” was represented as adenine base of Gm02_8896955, where “a” is guanin base of Gm02_8896955. Genotype “B” indicates the adenine base of Gm16_31822897 and “b” shows the guanine base of Gm16_31822897. Statistical analysis was conducted using the Student’s t-test (*** p < 0.001). Bars indicate standard deviation. LSD is the least square difference between genotypic classes in hundred-seed weight and different letters on bars are different at a 5% level of significance.
Agronomy 12 00250 g002
Figure 3. Linkage disequilibrium block of most significant SNPs on chromosome 2 in BLG accessions. The location in linkage disequilibrium (LD) block on chromosome 2 were shown by red solid lines. A total of 255 genes is in LD between two solid lines. The encoded genes are shown as arrows in the part of LD block between a dotted line (11,500,000 bp) and a solid line (12,414,985 bp). Glyma.02G119600 encoded CYP78A57 is indicated by the red arrow. Each pot represents the SNP. Red dots are the most significant SNPs for hundred seed weight.
Agronomy 12 00250 g003
Figure 4. Gene structure of GmCYP78A57 shown with its variants of sequenced soybean accessions. (A) Gene model of GmCYP78A57 (Glyma.02G119600) where black boxes indicate exon regions, grey boxes indicate untranslated region and black lines indicate intron region. Missense mutations and INDELs in the exon regions are marked with red and blue lines. Red lines are the variants from the cultivated soybean accessions, while blue lines are variants from wild soybean. (B) Eleven SNPs and one deletion were shown in exon 1 and 2 of GmCYP78A57 with sequenced soybean accessions. The table was generated with the soybean allele catalog [48]. On the right part of table, there are four categories, Glycine soja, cultivars, landraces and unknown, indicating the number of accessions in each category have a specific variant based on the sequencing information.
Agronomy 12 00250 g004
Figure 5. The frequency of hundred seed weight and a box plot of hundred seed weight with 45 cultivated accessions having the variant of GmCYP78A57. The phenotype of hundred seed weight from 45 accessions were obtained from the Germplasm Resources Information Network [49].
Agronomy 12 00250 g005
Table 1. Overlapped SNP loci associated with plant height, number of nodes and hundred seed weight over three years.
TraitSNPChromosomePositionlog10(p)R2 of Model without SNPR2 of Model without SNPMinor Allele FrequencyAllelic EffectLD Block
Plant heightGm19_450008271945,204,44110.80.740.760.06−22.244,481,150–46,730,263
Gm19_454412511945,557,7516.10.740.750.06−17.544,481,150–46,730,263
Number of nodesGm17_3252095173,244,3336.30.720.740.03−3.33,244,333–7,487,007
Gm18_2284997182,294,5545.80.720.740.02−2.6200,326–4,568,354
Gm19_450008271945,204,4419.40.720.750.06−2.644,481,150–46,730,263
Gm19_454412511945,557,7518.10.720.740.06−2.644,481,150–46,730,263
Gm19_458127481945,930,4475.90.720.740.01−2.744,481,150–46,730,263
Gm04_119302841,232,0556.10.720.740.01−2.9321,728–5,658,722
Hundred seed weightGm02_880759528,896,9557.30.830.840.055.38,487,794–12,414,985
Gm02_873019628,819,4946.80.830.840.045.18,487,794–12,414,985
Gm02_10302121210,381,3955.70.830.830.044.08,487,794–12,414,985
Gm16_314544231631,822,8975.80.830.840.053.831,454,423–32,838,190
Gm16_317102781632,078,5785.70.830.830.064.031,454,423–32,838,190
Gm16_322004411632,698,5425.60.830.830.183.031,454,423–32,838,190
Publisher’s Note: MDPI stays neutral with regard to jurisdictional claims in published maps and institutional affiliations.

