1. Introduction
Technical advances in information technologies have allowed a rapid spread of navigation systems in vehicles. The primary function of these systems is to provide information about unknown or unfamiliar environments and to support the drivers’ decision making and route planning [
1,
2]. As a positive side effect, the mental and physical workload of drivers should decrease, resulting in a safer and more careful driving style. Moreover, modern navigation systems additionally supply drivers with information about traffic jams or potentially dangerous situations in real-time, which should decrease the number of traffic holdups. The wide usability of navigation systems was also predicted to be beneficial for the ecological environment, resulting in a drastic reduction of pollution, driving time, and the cost and use of energy resources [
3].
A new era in transport navigation, and in the driving experience in general, is expected with the deployment of autopilots or autonomic driving systems in series vehicles. While the highest approved autonomous level that has been achieved by now is the level “2” (out of a possible six)
https://www.forbes.com/sites/jamesmorris/2021/03/13/why-is-teslas-full-self-driving-only-level-2-autonomous/ (accessed on 25 July 2021), the ambitious plan of leading car manufacturers is a full self-driving system in series vehicles that does not require any driver’s attention and intervention during the entire driving period. Thus, the vision of highly autonomous driving is a full exclusion of the driver from the driving loop, providing the entire control to the system.
However, the extended use of navigation aids and autonomous driving systems may come at the expense of reduced navigational competence in the driver. Highly automated navigation aids and autopilots can be expected to reduce mental workload in the short run, but they may be detrimental to fundamental spatial skills in the long term, for instance, in way-finding and homing behavior, route planning, distance estimation, and the general development of a cognitive map of the current environment [
1,
4,
5]. Such deficits could be of great practical importance when drivers have to switch to a non-automated vehicle, when an automated device fails, or when a detour becomes necessary that the automated system is not yet prepared for.
A central concept of spatial knowledge is the “cognitive map” [
6]—a mental representation of the physical environment. Cognitive maps incorporate a person’s spatial knowledge and their ability to navigate through physical environments. A well-built cognitive map allows drivers to use their internal spatial knowledge to drive from A to B without spending a lot of cognitive resources [
1]. As in the case of navigation systems, cognitive maps increase driving efficiency by allowing the drivers to rapidly respond to sudden traffic situations. In this manner, cognitive maps play a crucial role in navigation behavior and “spatial problem solving”. Extensive research in behavioral and navigational psychology revealed a wide range of factors affecting the development of cognitive maps including gender, age, familiarity with the environment [
7], characteristics of the environment itself (e.g., complexity) [
8,
9], environmental factors such as lighting and weather conditions [
10,
11,
12], physical activity, self-motion and sensory-motor experience [
13], mode of transportation [
14,
15,
16], working and long-term memory [
17], as well as attention and intention of the driver [
4,
18].
While the idea behind navigation systems was primarily to reduce the cognitive and physical workload of the drivers and to provide them support with decision making in route selection [
1,
2], significant detrimental effects on spatial knowledge were demonstrated as well. The availability of a navigation system in a driving task was associated with poor way-finding performance [
19] and less accurate scene recognition and scene ordering [
1] as compared to printed maps. Interestingly, navigation with a printed map was associated with the experienced increase of cognitive workload. This conclusion, however, was only based on a post-experimental interview and was not validated in the experimental task itself [
1]. Finally, people traveling in passive transportation mode were found to have a sparser environmental spatial knowledge [
16]. Taken together, these findings show that extensive use of navigation systems rather hinders the development of spatial knowledge, making unfamiliar areas remain longer unfamiliar [
5].
Despite the large number of studies investigating the effects of navigation systems on spatial knowledge, only a few of them examined participants in real driving conditions or highly immersive driving simulations [
1,
9,
14,
15,
20,
21,
22]. The exploration of spatial knowledge under an autonomous driving mode is still in its infancy, which could be attributed to the novelty and limited access to the technology. In this study, we compare the impact of different driving modes on the formation of cognitive maps of drivers in an unfamiliar environment (learning phase). Specifically, we compare passive transportation (autopilot) with driving assisted by a navigation system or by a printed map. In this way we can contrast learning by active navigation (learning from the map and subsequently driving with the map) and passive navigation. In a subsequent test phase where participants try to repeat the route from the learning phase, we then evaluate driving performance and spatial memory. To the best of our knowledge, the work presented here is the first of its kind where these three navigation aids are compared in the context of one study.
Hence, this work contributes as follow:
We investigate the impact of the autopilot, navigation system, and printed maps on spatial learning by evaluating landmark, route, and survey knowledge in an unfamiliar virtual environment. Compared to the previous studies where an online survey or a passengers’ experiences were evaluated, we used a driving simulator to imitate a highly immersive autonomous driving experience.
While the previous research assumed the differences in a driver’s cognitive workload depended on the state of spatial knowledge, we extend the body of research by investigating cognitive workload in the learning and active driving phases using printed maps, autopilot, and navigation systems. For this purpose, both self-reported cognitive workload using weighted NASA-TLX scores [
23], and physiological stress-related markers from electrodermal activity [
24] were evaluated.
2. Background and Related Work
According to the widely accepted theoretical framework proposed by Siegel and White, the development of spatial knowledge includes three successive stages: “landmark knowledge”, “route knowledge”, and “survey knowledge” [
22,
25]. Landmark knowledge relates to knowledge about distinct objects or scenes that are eye-catching or salient in the environment. Landmarks were found to play a significant role in way-finding strategies, spatial decision making, and orientation in space [
2,
9,
26,
27]. In contrast, route knowledge includes the sequences of view-action pairs, where individuals associate a certain action with a decision point [
28] (e.g., “turn right at the shopping mall”). The final stage, survey knowledge (or configurational knowledge), integrates the sequences of routes and landmarks into a common spatial reference system [
16,
29], resulting in a cognitive map. One of the main limitations of the Siegel and White framework is that it only provides a general description of the developmental stages of spatial knowledge. The framework does not consider the time and effort necessary to develop each of the stages [
22,
30]. Among various alternative frameworks and models attempting to elaborate the developmental steps of spatial knowledge (for the review see [
22]), the alternative framework proposed by Montello found wide support [
31]. This framework postulates that the configurational knowledge is developed continuously starting from the very first exposure to a new location, and not only after the landmark and route knowledge had been acquired. Furthermore, Montello’s framework excludes developmental stages at which only landmark or route knowledge would exist. Even though the Siegel and White framework has not found strong empirical support, landmark, route, and survey knowledge have still been widely used in research to evaluate spatial knowledge and remain under investigation [
8,
15,
20].
Previously, people gained spatial learning either through direct exploration of the environment or by using indirect methods such as maps, verbal instructions (e.g., lists of landmarks and turning points), and sketches [
1]. Of course, the active exploration of the environment is the historically oldest form of spatial learning. Active exploration involves idiothetic information (motor commands determining the path of locomotion and vestibular information for self-motion), decision making, attention to place-action, the interplay of working memory and long-term memory, and mental imagery [
13]. Maps are an alternative way to gain spatial knowledge. They represent the topographic properties of a particular environment, include the position of objects (or landmarks), global shapes of land features (including streets and bridges), and Euclidean distance between the objects [
4]. This information is difficult to access during physical exploration of the environment, but can easily be acquired from maps. Laboratory experiments found that learning from a map produces a “map-like” mental representation of the environment and differs from those gained through active exploration [
30]. Thus, map study is an excellent aid to support the development of survey knowledge [
1,
4].
2.1. Navigation Systems
In 1982 Thorndyke and Hayes-Roth demonstrated significant differences in spatial knowledge gained from printed maps as compared with guided navigation [
4]. Learning from a map was associated with a good acquisition of global relationships (survey knowledge). Their participants showed better performance in distance estimation and object localization. In contrast, participants in the guided navigation condition acquired memories of passed routes and were better in an orientation task.
Preceding studies from human factors and psychology strengthened the case for discrepancies in spatial learning acquisition from maps and navigation systems. A negative association was observed between the use of GPS (global positioning system) and the ability to draw maps to scale [
32]. The author presumed that GPS users have only a fragmented mental representation of the city and experience difficulties in connecting these fragments. Burnett and Lee [
1] investigated differences in navigation and driving using a paper map and turn-by-turn voice guidance. Prior to the driving tasks, all participants were shown a route map that outlined the route they had to drive. To access their spatial knowledge after the driving task, the authors used image recognition, image sorting, and map sketching tasks. Their results showed that participants who used a navigation system were significantly worse in scene recognition and image ordering. In addition, their self-drawn maps were simpler and included fewer landmarks compared to those of participants using maps. Similar results were shown in a study by Münzer and colleagues [
19]. Using a driving simulator, the researchers found that the participants in a navigation group developed good route knowledge but poor survey knowledge. In contrast, map users achieved better survey knowledge and almost error-free route knowledge. The authors explained this performance through the active encoding of the environmental information in the map condition. Parush et al. [
33] investigated the spatial knowledge development in a virtual building with a continuous or by-request position indication. They found that participants with continuous position indication showed significantly better way-finding performance. In contrast, the participants with by-request position indication required more trials to develop their spatial knowledge.
2.2. Autonomous Driving
According to the “Taxonomy and Definitions for Terms Related to Driving Automation Systems for On-Road Motor Vehicles” [
34], driving automation comprises six levels starting from “no driving automation” (level 0) to “full driving automation” (level 5). At the last level, the system autonomously operates the vehicle without expecting its driver to intervene. Despite the recent upswing of research in autonomous driving and human behavior, the main focus of the investigation has been on acceptance, reliance, attention [
35], trust, and stress induced by the use of the system [
36], but has rather neglected the spatial cognition of the driver.
One of the first studies explicitly addressing the differences between cognitive maps acquired through active and autonomous driving was performed by Qin and Karimi [
5]. In their study, they considered the experience of driving in autonomous mode as essentially the same as when driving as a passenger. In an online survey with 204 participants, they found that individuals who travel frequently as a passenger have difficulties in finding their way using their own cognitive maps. They are also more likely to get lost in the nearby neighborhood. The authors also suspected a possible degradation in spatial knowledge by drivers who change to autonomous driving. Further studies are in line with the idea of automotive driving as passive or “passenger-like”. Using a survey and a map driving task with 101 London residents, Minaei investigated the impact of different transportation modes on the cognitive map [
32]. The author found a positive association between the use of a car in active mode and the number of roads entered into self-drawn maps. Similar results were observed by Mondschein et al. [
16]. They compared active car drivers with adults with low car use but frequent public transport use. The car drivers were found to be significantly more accurate in estimation of travel distance compared to the public transport users. It was also shown that the car drivers were more likely to determine their home location by a landmark. In line with this, Stülpnagel and Steffens found that backseat drivers of a tandem bicycle in a passive navigation condition had better landmark recognition, compared to an active navigation condition [
14]. Similarly, traveling by bus through a city is presumed to allow passengers to observe more of the environment and to attend more to the landmarks [
21]. Bus drivers were observed to develop better survey knowledge of a city compared to their passengers, who could gain only route knowledge [
13,
37].
Unfortunately, with the exception of Stülpnagel and Steffens [
14], none of the aforementioned studies deployed a real or a simulated driving scenario. Instead, they evaluated surveys or compared the spatial knowledge of active drivers and passengers, who in principle have a different perception of the environment. Even taking into account the view that in autonomous driving the driver will change his or her role to that of a passenger, an examination of the possible changes in spatial learning under autonomous driving conditions in a more realistic situation is crucial.
2.3. Navigation Aids and Cognitive Workload
Navigation systems are developed to support drivers in way-finding and spatial decision-making tasks, which in turn should reduce drivers’ mental and physical workload [
1,
33,
38]. Similar effects are expected through the utilization of highly or fully autonomous driving systems. Not surprisingly, studies in human factors and ergonomics observed a reduction in the mental and physical workload of the human operator while using autonomous systems [
39,
40]. However, a number of negative changes were associated with the long-term use of such systems, including over-reliance on the system and a progressing lack of attention. In contrast to its electronic counterparts as mentioned in the “Introduction” section (see
Section 1), spatial learning from a map requires a wide spectrum of cognitive operations. Their activity can significantly impact cognitive workload. Still, surprisingly little is known about cognitive workload in the context of navigation and spatial learning. In a labor study, Evans et al. observed that stress can be beneficial for cognitive map formation [
2]. Based on this observation, Burnett and Lee hypothesized that the initial demand for cognitive map development using printed maps is high [
1]. With growing spatial knowledge, this demand significantly decreases. There are, however, to our best knowledge, no further studies that investigated and compared drivers’ cognitive workload among the traditional and highly automated navigation aids.
One of the most established techniques for the measurement of cognitive workload is the NASA-TLX test that captures a self-reported level of the experienced cognitive demand required to solve a particular task [
23,
41]. Along with this self-report method, physiological and neurological signatures can be used as indicators of increasing workload and stress levels. Together with the heart rate, electrodermal activity (EDA, also skin conductance response or galvanic skin response) is one of the most frequently employed physiological properties to track the driver’s stress level [
36,
42,
43]. In a nutshell, the EDA consists of alterations in the electrical properties of the skin mediated by the level of physiologically induced sweating [
44,
45]. Sweating has been found to be associated with increasing stress, pain, or fear levels [
24]. The EDA signal consists of two main components: skin conductance level (SCL) and skin conductance response (SCR). SCL relates to slowly drifting components; its common properties are a gradual decrease in conductance while participants are at rest, and a rapid increase when a new stimulus is presented. SCR relates to spontaneous activations or spikes superimposed on the SCL that are triggered by a sudden or startling stimulus [
46]. The SCL is assumed to be the more reliable indicator for changes occurring with long-lasting or continuous stimuli (i.e., workload, attention, information processing, and reading) [
47]. The EDA is measured in microsiemens units (
S).
2.4. Hypothesis
Based on the reviewed literature and taking all sections together, we hypothesize that:
Cognitive workload in the learning phase with the printed map will be significantly higher compared to driving with the autopilot or navigation system. Conversely, cognitive load in the testing phase should be lower for those drivers who studied with a printed map than for those who used the autopilot or navigation systems. Effects of cognitive workload should manifest in NASA-TLX scores as well as skin conductance responses.
Autonomous driving will give participants more freedom to explore the virtual environment and to learn the landmarks, resulting in better landmark knowledge compared to driving with the printed map or navigation system.
Learning of the environment with a printed map will result in the highest survey knowledge compared to the navigation system and autopilot.
3. Materials and Methods
3.1. Research Design
The experiment consisted of a learning phase and a test phase. In the learning phase, participants sat in a driving simulator and were either passively driven by autopilot through a simulated town or drove the car themselves using either a navigation system or a printed map. In the test phase, they were required to repeat the route from the learning phase by driving the car themselves without any navigation aids. The learning phase also consisted of a memory test requiring them to identify and order landmarks along the route.
To examine the impact of different assistant systems on the drivers’ spatial knowledge and cognitive workload, we varied two independent variables, assistant type (autopilot, navigation system, or printed map) and phase (learning or test) (see
Table 1). To characterize the behavioral performance in the test phase, five dependent variables were employed: proportion of correctly selected landmarks, or “hits”; proportion of selected foils, or “false alarms”; proportion of landmarks placed in the correct order; and number of wrong turns. Furthermore, the NASA-TLX score was measured during both the learning and test phases to trace cognitive workload. In addition to the behavioral data, skin conductance was recorded during both study phases and decomposed into two components, the tonic component (SCL) and phasic component (SCR). These components were derived from the EDA signal as a neurological marker of the induced stress level. In addition, we asked participants to draw a map of the virtual city, but this dependent measure is not the focus of the current paper because they are not related to the hypotheses described above. We used a repeated-measures within-subjects design where each participant underwent all experimental conditions. In such designs, statistical power depends jointly on the number of participants and the number of trials per participant and condition [
48], and we took care to consider both levels of data acquisition to ensure adequate statistical power [
49].
3.2. Participants
A total of 22 participants were recruited in the German Research Center for Artificial Intelligence (DFKI) from different departments via an employee mailing list. Recruitment occurred under the restrictions of the COVID-19 pandemic, which avoided bringing unnecessary visitors into the DFKI facilities. Inclusion criteria were the absence of motion sickness, a minimum of two years of driving experience, and a driving license valid in Germany. Despite being informed about the inclusion criteria, two participants reported severe symptoms of motion sickness. The experiment was then immediately stopped and their recorded data discarded from further analysis. The residual 20 participants (7 female) were between 22 and 50 years of age (mean = 29.9, SD = 6.5) and drove a car on average at least five times a week. All participants had a normal or corrected-to-normal vision. Participants were not informed about the goals of the study prior to the experimental session. Participation was voluntary and compensated through working hours.
3.3. Materials
3.3.1. Driving Simulator
Figure 1 shows a schematic representation of the technical setup of the driving simulator. The mounted driving simulator was assembled from a Jaguar XJ 4.2 V8 Executive cockpit and an integrated input controller set (Logitech G27 Driving Force), which includes a steering wheel and two pedals for throttle and brake but no clutch pedal. The transmission was set to automatic mode so that no gear-shift was necessary and the simulator could be operated without extensive training. A projector displayed the driving scene on a large screen about two meters in front of the participant. The experimenter’s place was set behind the driving simulator. The driving simulator setup resembled those of Feld et al. [
50].
3.3.2. Sensors
A wrist-worn Empatica E4 device (
https://www.empatica.com/research/e4/ (accessed on 25 July 2021)) was used to trace the participant’s electrodermal activity during the driving tasks. Besides sensors for skin conductance, the Empatica E4 wristband has three more integrated sensors: a photoplethysmography sensor, a 3-axis accelerometer, and an optical thermometer. By default, Empatica E4 transmits the data from all four sensors. The EDA signal is conducted through two snap-on silver (Ag) plated electrodes with a sampling frequency of 4 Hz. The wristband does not require any calibration procedure. It was placed on the volar surface of the wrist according to the manufacturer’s recommendations after the training phase in the driving simulator. The data recording continued over the entire experimental period.
Along with EDA data, we also recorded eye movement and EEG data. The gaming eye-tracker Tobii 4C was fixed to an adjustable holder mounted on the cockpit (see
Figure 1). The EEG data were recorded using a wearable device (Unicorn Hybrid) with 8 DC-coupled analog channels and 24-bit resolution, and two mastoid electrodes for the right and left sides. The electrodes were placed on the Unicorn’s EEG cap (standard M size) according to the manufacturer’s instruction and then put on the participants. In the last step, the mastoid electrodes were placed behind the ears of the participants. The EEG cap was worn during the entire experimental session. The eye-tracking and EEG measurements are not further considered in the current work because they are not in the scope of the defined hypotheses.
An Azure Kinect camera (
https://azure.microsoft.com/de-de/services/kinect-dk/ (accessed on 25 July 2021)) was placed in the middle of the cockpit to capture the participants while driving (see
Figure 1). The data from the Azure Kinect were used for a different project, and a separate informed consent sheet was used for recording permission. Hence, this sensor is not further discussed here.
3.3.3. Virtual Environment and Driving Assistants
To simulate the driving environment, the open-source simulation software OpenDS Pro Complete (
https://opends.dfki.de/ (accessed on 25 July 2021) was used. This application provides high flexibility for creating and customizing controlled driving environments including map creation and 3D model integration. OpenDS is based on jMonkeyEngine V3.2 (
https://jmonkeyengine.org/ (accessed on 25 July 2021) with a variety of supported features, open standards (openDrive, openSCENARIO, SCENIC), and supported hardware (VR glasses, motion platforms, input controllers, etc.). The system also supports gaming eye-trackers (e.g., Tobii X and Tobii 4C) and provides processed eye-tracking data, including fixations, saccades, and information related to the fixated objects in the virtual environment.
The city center of the German city of Saarbrücken was taken as a prototype for the virtual city. From the city plan, we created three maps with three driving routes of comparable length and complexity (see
Figure 2). It took on average three minutes and thirty seconds to finish each route using the autopilot. Apart from one route segment that was shared by two maps, the maps did not have any overlap with each other. The shared segment was passed in opposite directions in the different routes so that carryover effects should be minimal. The environment of each map consisted of buildings, traffic lights, road signs, road markers, and pavements with bus stops, trees, and small parkways, resulting in a fairly rich and complex environment. The driving environment did not contain any pedestrians or traffic. In all three maps, the lighting conditions corresponded to diffuse skylight at noon. The lighting gave some information about the orientation of buildings with respect to the sun, but no strong shadows were cast.
We created a Din A4 color print for each virtual map with a designated driving route, including start and finish points (see
Figure 2). In the learning phase, the respective map was placed on the cockpit’s dashboard where the participant could easily see and handle it (see
Figure 3b). The navigation system in the learning phase was represented as a blue, continuous line with red squares projected on the road and going from the start to the end of the entire driving route (see
Figure 3c). This projection was programmed separately for each route. Finally, the autopilot condition of the learning phase was designed as a passive drive on a coordinate-based pre-programmed route for all of the three virtual maps.
3.3.4. Landmarks
For each map, six unique virtual landmarks were selected. Several landmarks were downloaded from Sketchfab (
https://sketchfab.com/3d-models) and adopted to the virtual environment using jMonkeyEngine (
https://jmonkeyengine.org/) and Blender (
https://www.blender.org/ (all web links were accessed on 25 July 2021). The landmarks were selected to be eye-catching so that they would be noticed and recalled by participants independently of the context [
51] (see
Figure 4). The landmarks were placed either along the driving route on the left or right side or next to an intersection of the roads. In the participant’s instruction and test application (discussed below), we deliberately avoided the word “landmark”, using “object” instead to avoid biasing the participant with respect to landmark-based vs. route-based learning strategies. In the experimental instruction, we used the word “scene” to describe the virtual environment and to avoid any confusion with a printed map.
3.4. Procedure
The experiment was approved by the local ethics board (TU Kaiserslautern). To avoid any order or learning effects, the order of the driving assistants and maps was randomized within-subjects using the Balanced Latin Square method [
52].
The experiment took place in a quiet room under controlled lighting conditions. After arriving at the laboratory, participants received a written informed consent form containing general information about the purpose, possible risks, and benefits of the study, and also a sheet to give permission to the camera recording. After these forms were signed, we collected general information including age, gender, visual acuity, and the driving frequency per week. Subsequently, the participants received instruction about the experimental process. It was explained that they would drive three different routes twice: once using a driving assistant, such as a printed map, autopilot, or a navigation system (learning phase), and once without using the assistant (test phase). Importantly, participants were aware that they would later have to drive the same route themselves by memory.
After making sure the participants did not have any questions regarding the experimental procedure, the familiarization phase was started where participants learned to steer the driving simulator system in a training environment. The familiarization period lasted between ten and twelve minutes. The participants were instructed to follow general driving rules, including holding the proper traffic line, avoiding crashes with objects, and controlling their speed.
After the familiarization phase, the learning phase began. For the autopilot condition, we instructed the participants to not use the steering wheels and pedals, keeping the hands possibly on the knees. In the navigation system condition, participants were asked to follow the navigation projection as precisely as possible. In the map condition, participants were given unlimited time to learn the route from the map prior to driving. In the learning phase, they were also allowed to use the map for navigation. If participants had problems reading the map, the experimenter gave short hints to facilitate understanding. Deviations from the route while driving with the map were not counted as an error in the learning phase. As soon as the participants arrived at the destination, the map was removed from the cockpit. In the autopilot and navigation system conditions, the end of the route was indicated by the pop-up message “Destination”.
In the test phase, participants had to repeat the just driven route without the navigation aid (see
Figure 3a). At this point, each deviation from the original route (e.g., wrong turn or skipping the right turn) was counted as a “wrong turn”. If participants did not notice they were driving the wrong route within ten seconds, the experimenter shortly warned participants against the deviation and helped them to drive back to the position where the deviation from the right route had occurred. From that point, participants had to find the correct direction on their own.
Subsequently, we informed the participants about the NASA-TLX test conducted after every driving segment. The test was followed by the scene recognition and route knowledge tests after every first driving phase, and by the map drawing task after every second driving phase. For every driving segment, the scene recognition test included six real scenes with correctly placed objects in them and six fake scenes (foils) containing the objects in the wrong places, resulting in twelve scenes in total (see
Figure 4). The participants were informed about the number of foils and asked to select exactly six scenes. In the next step, route knowledge was tested by asking participants to put the selected scenes into the order they were encountered while driving. No feedback was provided either for the correctness of the selected scenes or for their order by the application.
The weighted NASA-TLX test, landmark recognition, and route knowledge task were programmed in JavaScript using the VUE framework and run on macOS Big Sur.
4. Data Analysis and Results
To investigate the possible effects of the assistant type and the driving phase, a two-way within-subjects analysis of variance (ANOVA) was conducted. All reported p-values for the main and contrast effects are Greenhouse–Geisser corrected to safeguard against underestimation of p-values when the statistical assumption of compound symmetry is violated. To analyze simple effects within each factor, planned pairwise t-tests were employed with Bonferroni correction. All significant results are reported. The data aggregation and signal processing were performed using Python; statistical analysis was run using R.
4.1. Cognitive Workload
Table 2 represents the descriptive statistics for reported cognitive workload among the assistant types and driving phases. The ANOVA showed neither a significant main effect of assistant type (
F(2, 38) = 1.38,
p = 0.61), nor of the driving phase (
F(1, 19) = 1.38,
p = 0.25). However, a highly significant interaction effect between these two variables was present (
F(2, 38) = 19.33,
p < 0.01). Whereas for the autopilot and navigation system cognitive load was lower in the learning phase than in the test phase (
t(119) = −6.05,
p < 0.01 and
t(119) = −7.10,
p < 0.01), the reverse effect was observed for the printed map (
t(119) = 9.69,
p < 0.01). This data pattern suggests that first investing cognitive effort when learning the environment by map lowers cognitive costs at retrieval, whereas the reduced cognitive effort when driving passively or by navigator comes at the expense of greater cognitive costs when those assistant systems become unavailable.
4.2. EDA
To extract underlying SCL and SCR components from the EDA signal, we applied the Convex Optimization Approach (cvxEDA) proposed by Greco and colleagues [
45]. This method is a reasonable choice when SCRs occur to multiple stimuli and overlap over the entire period of interest [
53].
The raw EDA signal was filtered with an 8th order Chebyshev Type I low-pass filter (0.1 Hz) for all participants. In the next step, a Z-score normalization was applied to the filtered data. Then, cvxEDA was run on filtered and normalized data for all driving segments (see
Figure 5). To avoid any residual motion artifacts in the signal, we deliberately excluded the first 30 and the last 10 s from the signal of each driving segment. After tonic and phasic components were extracted from the EDA data, an average value was calculated for each participant within each driving segment. The data of one participant were excluded from the analysis (and the correlation analysis discussed below) because of insufficient recording quality.
In the next step, we investigated possible influences of the driving phase, assistant type, and their interaction on the EDA components.
Table 3 represents descriptive statistics for the tonic and phasic components. For the tonic component, neither driving phase (
F(1, 18) = 0.95,
p = 0.34), nor assistant type,
F(2, 36) = 0.61,
p = 0.54), nor their interaction (
F(2, 36) = 1.54,
p = 0.23) were significant. In contrast, a statistically significant interaction effect between driving phase and assistant type was observed for the phasic component (
F(2, 36) = 5.38,
p < 0.05). There were no significant main effects of either driving phase or assistant type on the phasic component (
F(2, 36) = 0.17,
p = 0.80 and
F(1, 18) = 2.82,
p = 0.11 respectively).
The pattern of results was similar to that of the NASA-TLX scores. A pairwise
t-test yielded a significant difference between learning and test phases with the autopilot in the phasic component values,
t(18) = −3.19,
p = 0.005. The mean value of the phasic component was significantly lower in the learning phase with the autopilot, compared to the corresponding test phase (see
Table 3). In the map condition, this effect was reversed and of similar size, but failed to meet the significance criterion,
t(18) = 2.06,
p = 0.054. No difference between learning and test phases was detectable for the navigation system,
t(18) = −1.01,
p = 0.33.
4.3. Landmark Recognition, Route Knowledge, and Way-Finding
To investigate possible differences in scene and landmark recognition among the three types of driving assistants, the proportions of “hits” and “false alarms” were calculated for each subject and transformed by arcsin transformation to meet ANOVA requirements. Route knowledge was calculated as a proportion of landmarks placed in the correct order and also arcsin-transformed. One-way ANOVA with the single factor assistant type showed neither any significant influence on hit rate (F(2, 38) = 0.75, p = 0.48), nor on false alarm rate (F(2, 38) = 1.06, p = 0.36), nor on the number of landmarks placed in the correct order (F(2, 38) = 0.31, p = 0.74).
Finally, the way-finding performance was evaluated. Way-finding performance was assessed through the number of wrong turns within the test phase (
Figure 6). On average, each participant made a wrong turn 1.35 (
SD = 1.93) times after learning with the autopilot, 0.35 (
SD = 0.49) times after learning with the map, and 1.50 (
SD = 1.93) times after learning with the navigation system. Due to pronounced outliers in the number of wrong turns after learning with the autopilot or the navigation system, the normality assumption was violated (Shapiro–Wilk test
W = 0.67,
p < 0.01). Hence, the Friedman rank-sum test was employed to compare the group means. The results showed statistically significant changes in the frequency of making a wrong turn depending on the driving assistant in the learning phase,
= 6.23,
p = 0.05. Next, post-hoc Wilcoxon signed-rank tests with Bonferroni corrections were performed. The analysis confirmed a significantly lower number of wrong turns after learning with a printed map than after learning with the navigation system (
Z = 12,
p = 0.02). The difference between the autopilot and printed map conditions was not significant (
Z = 66,
p = 0.1). Similarly, there was no significant difference between autopilot and navigation system (
Z = 81.5,
p = 1.0).
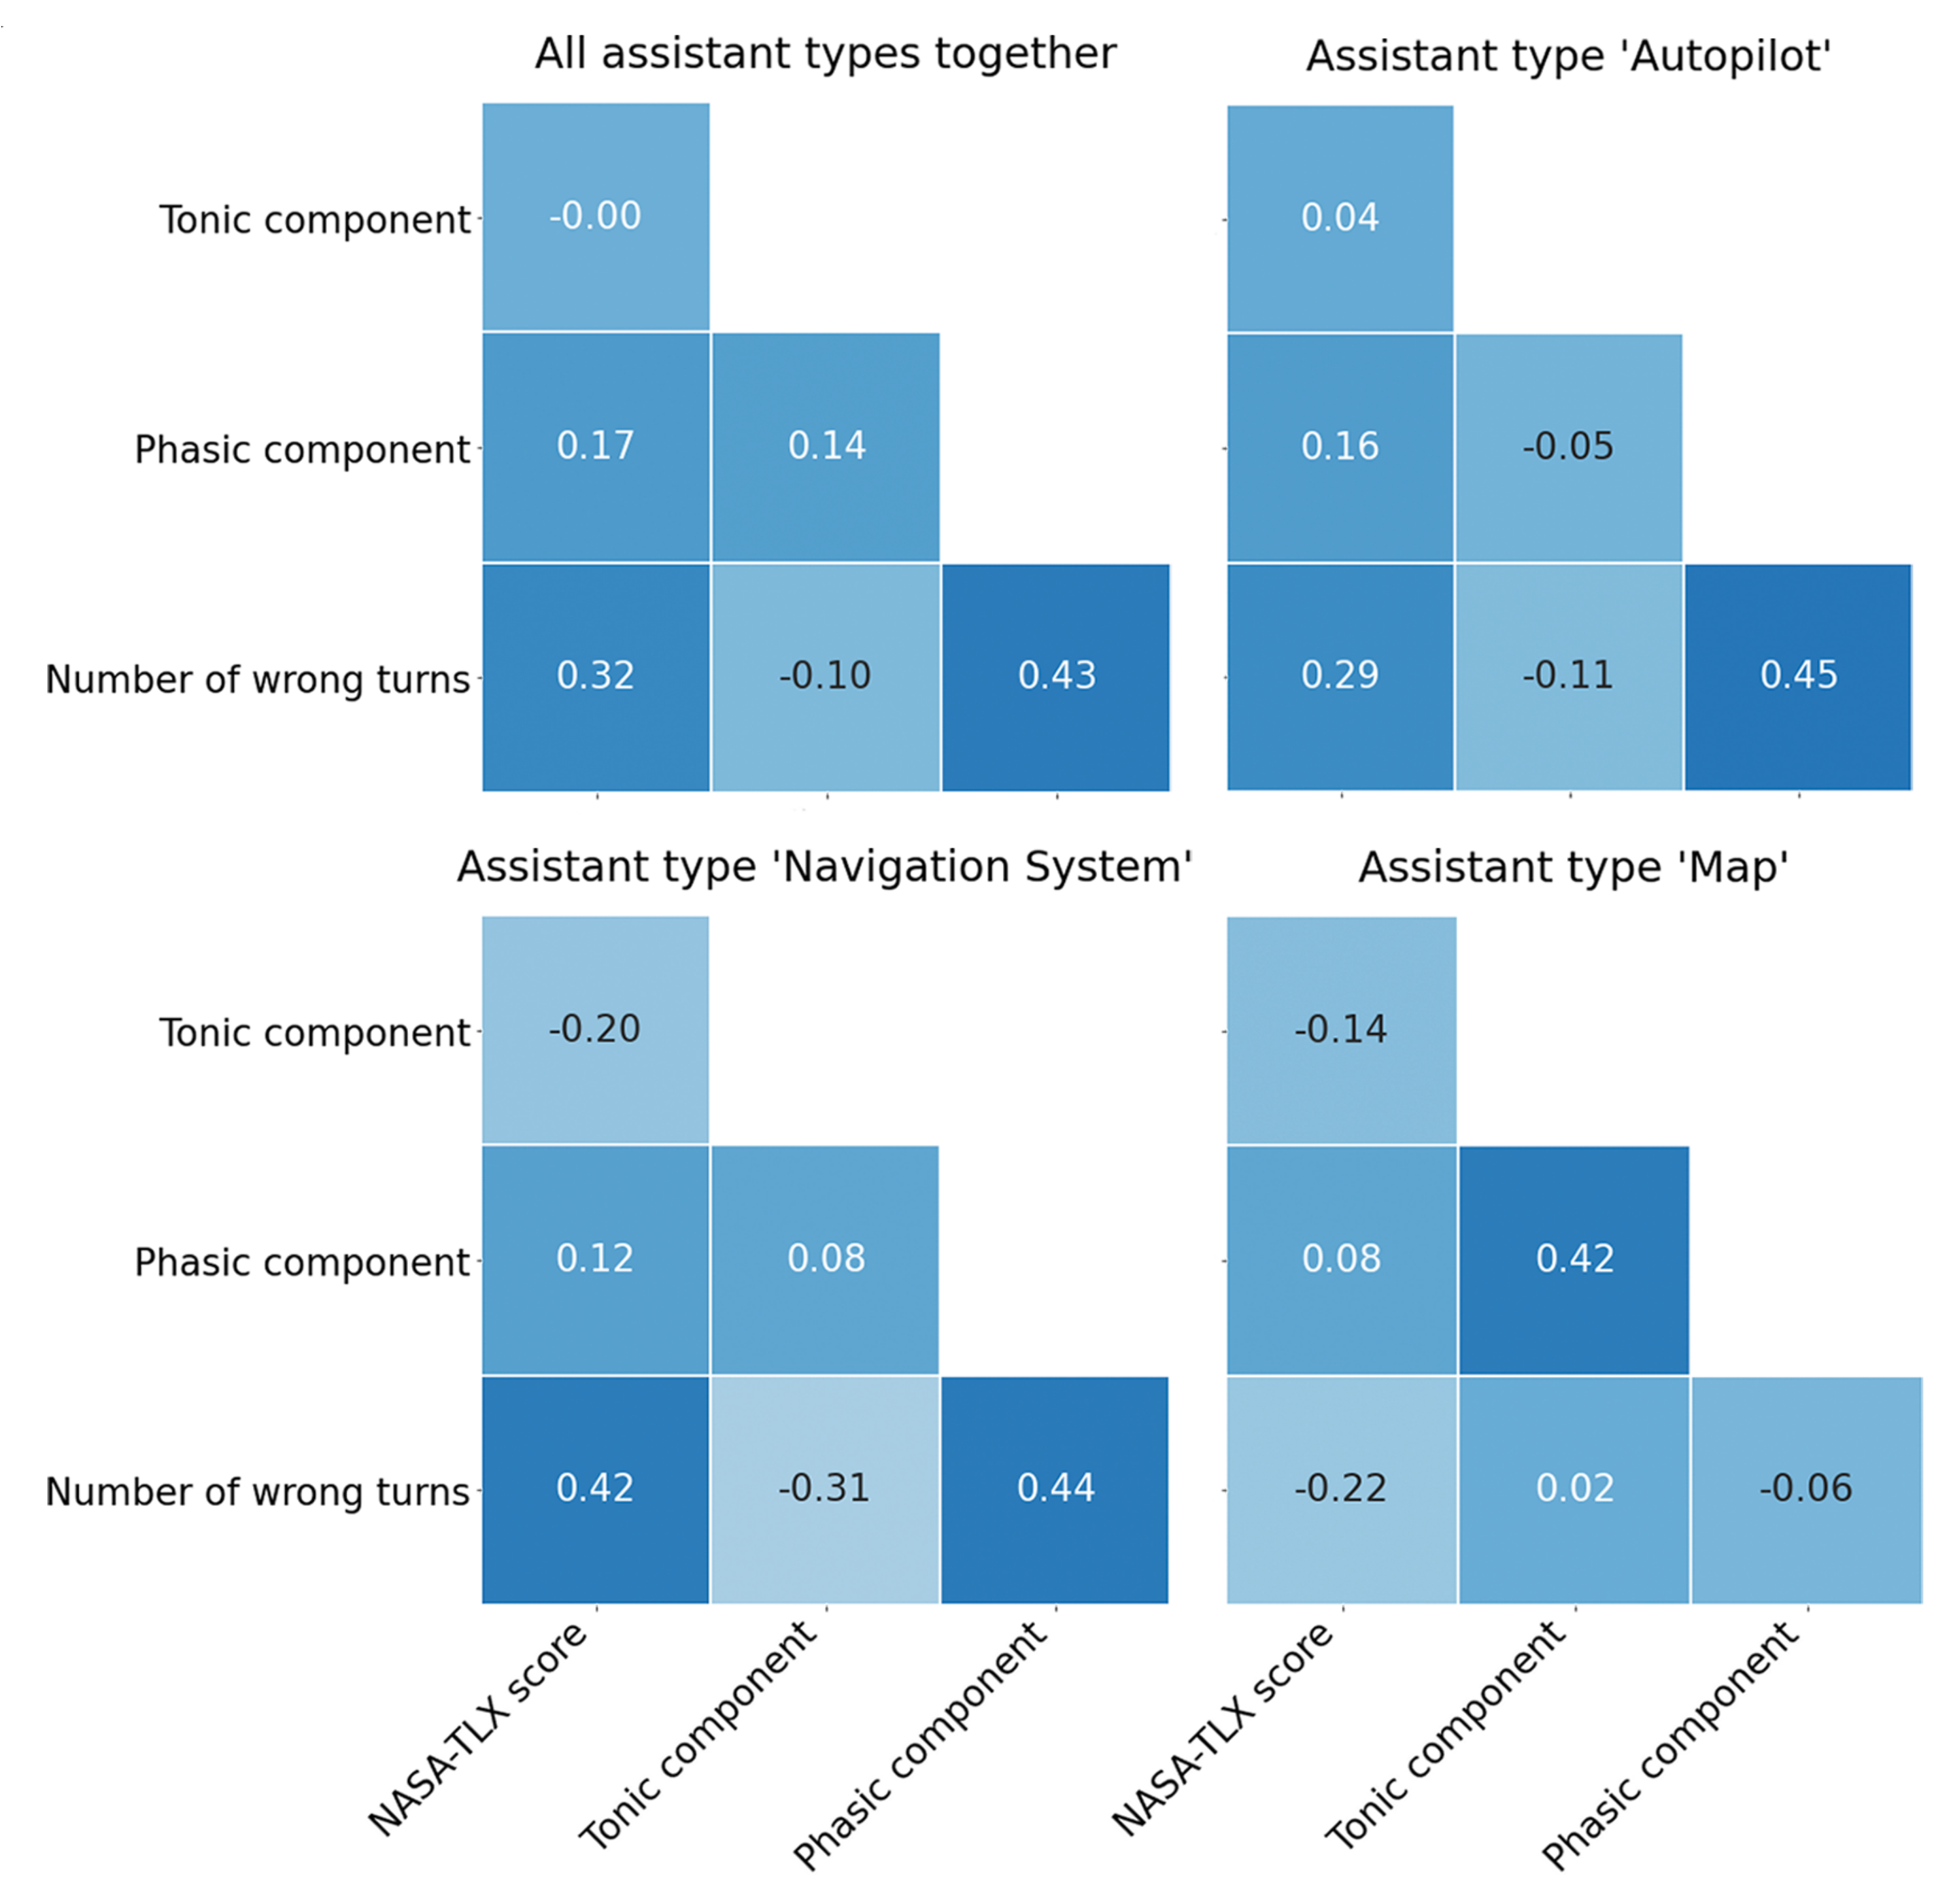
4.4. Correlation Analysis
To explore possible linear associations between cognitive workload, the number of wrong turns and the EDA components, a multivariate product-moment correlation analysis Pearson’s r was computed. Since the number of wrong turns was only recorded in the test phase, the NASA-TLX score and EDA components (tonic and phasic) from the learning phase were discarded from the correlation analysis. The correlation strength is reported following the classification by Dancey and Reaidy [
54,
55].
A significant, weak, and positive correlation was observed between the number of wrong turns and the NASA-TLX score (
r = 0.32,
p < 0.05) (see
Figure 7). Moreover, a highly significant, moderate, and positive correlation was obtained between the number of wrong turns and the phasic component (
r = 0.43,
p < 0.01). In the next phase, Pearson’s r correlation analysis was run separately for the autopilot, navigation system, and printed map driving assistants using the same variables as before (see
Figure 7). For the autopilot, a statistically significant, moderate, and positive correlation between number of wrong turns and the average value of the phasic component (
r = 0.45,
p = 0.05) was found. For the navigation system, a similar correlation pattern was observed between the number of wrong turns and the phasic component, resulting in
r = 0.44,
p < 0.06, yet slightly exceeding the 95% significance level. For the map assistant type, no significant correlations were observed.
6. Conclusions
In the present work, we explored the differences in spatial knowledge and cognitive workload by drivers assisted by an autopilot, a navigation system, and a printed map. We demonstrated that initial learning of a new environment with a printed map results in a higher cognitive demand that, however, significantly diminishes when driving the same route by memory. In contrast, this effect was the opposite for the navigation system and the autopilot, for which the initially low cognitive workload in the learning phase dramatically increased in the test phase. Moreover, after learning the printed map, participants tended to drive the route in the test phase with fewer errors. We also showed for the first time that the phasic component of the skin conductance response parallels behavioral measures so that EDA measurement may serve as a possible proxy for self-reported cognitive workload or stress. Despite our expectations, driving with the autopilot was not associated with benefits in landmark recognition.
This study has several limitations. First, the study design considered only a short-term impact of the driving assistants when a route was driven only twice. Thus, the long-term impact of the driving assistant types is still to be investigated. Second, we used a relatively small and simple environment without any complex turns, road forks, traffic, and pedestrians. The use of a more complex and dynamic environment could bring more insights into spatial learning and cognitive workload of drivers under different navigation modes.
Our final remark relates to the application of this study. The reduction in drivers’ mental workload through the utilization of the navigation system and the autonomous driving mode was shown to occur at costs of spatial learning. This should be considered in the future when designing novel navigation and transportation means as well as strategies to hand over vehicle control from the autonomous system to the driver, e.g., when a complex navigational decision has to be made, the technology fails, or a detour needs to be improvised that the navigation system is not prepared for. The goal of modern navigation aids should be, therefore, not only to enhance the driving and navigation experience but to avoid detrimental effects on the driver’s acquisition of spatial knowledge.
References yes


