
Bio-Mechanical and Bio-Rheological Aspects of Sickle Red Cells in Microcirculation: A Mathematical Modelling Approach


Abstract
: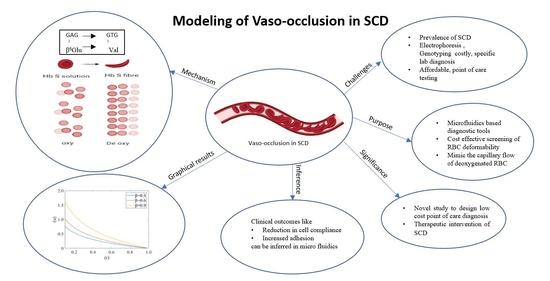
1. Introduction
2. Mathematical Formulation
2.1. Assumptions of the Model
2.2. Formulation of the Model
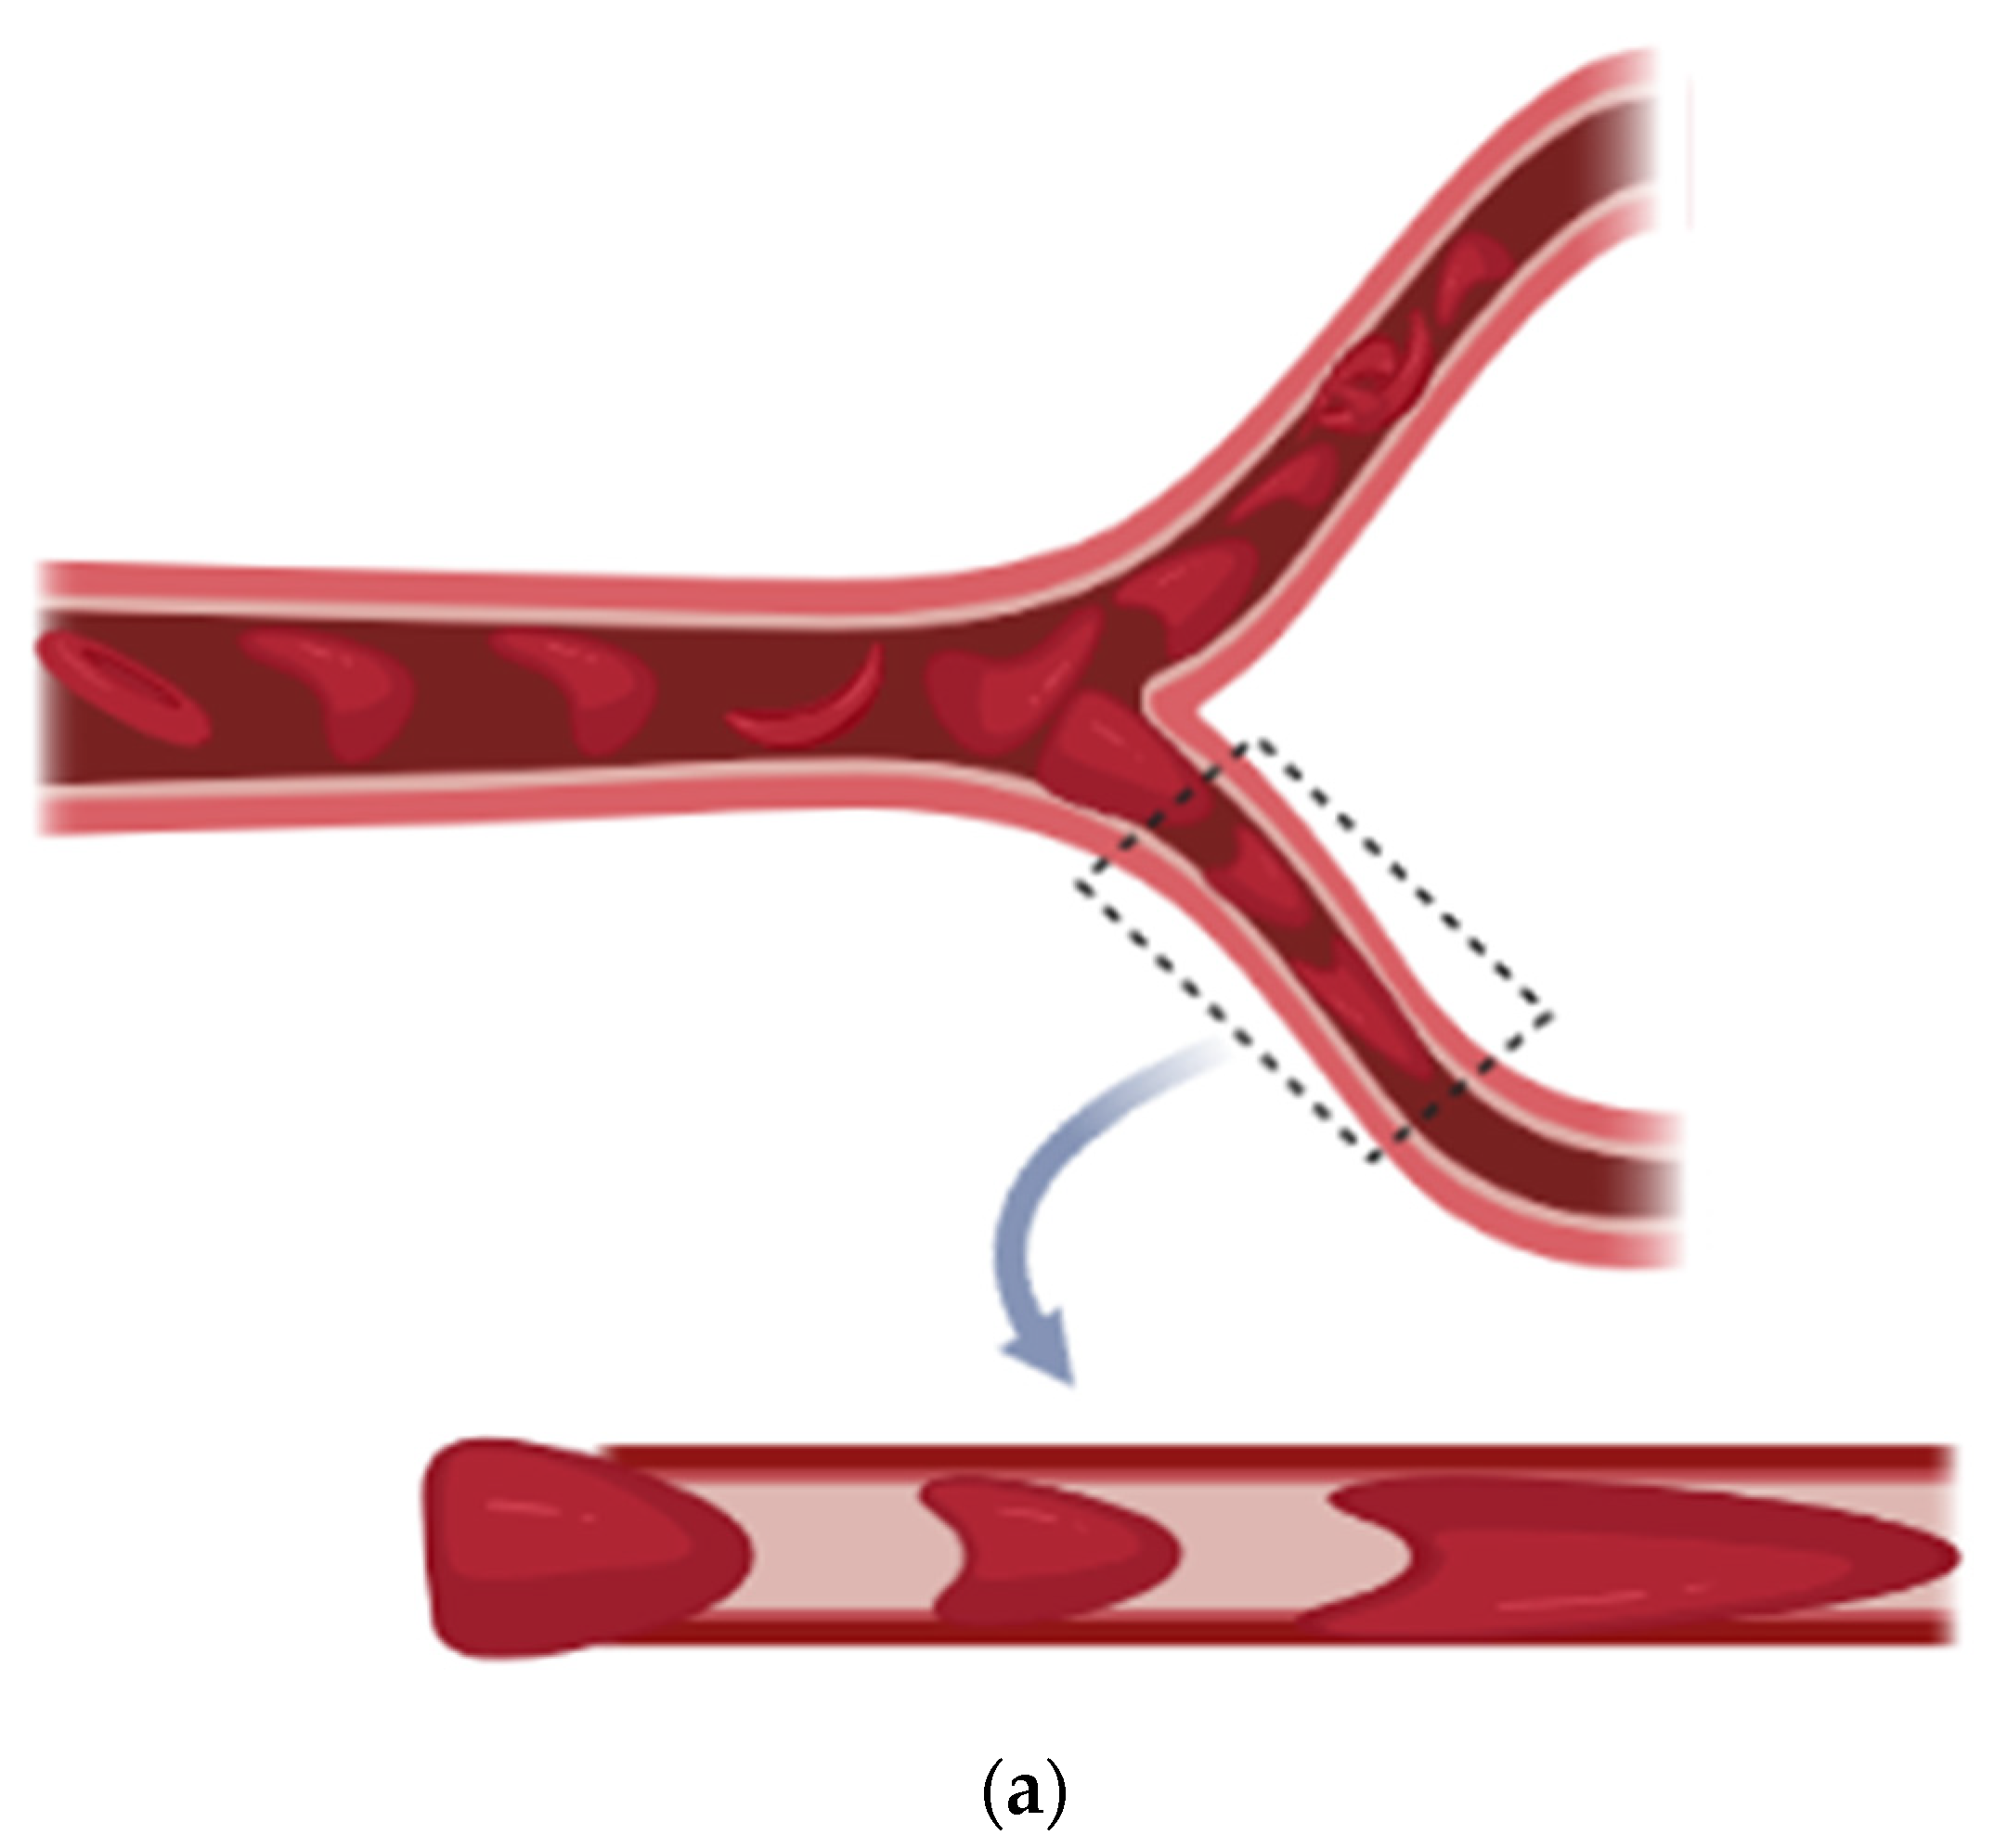
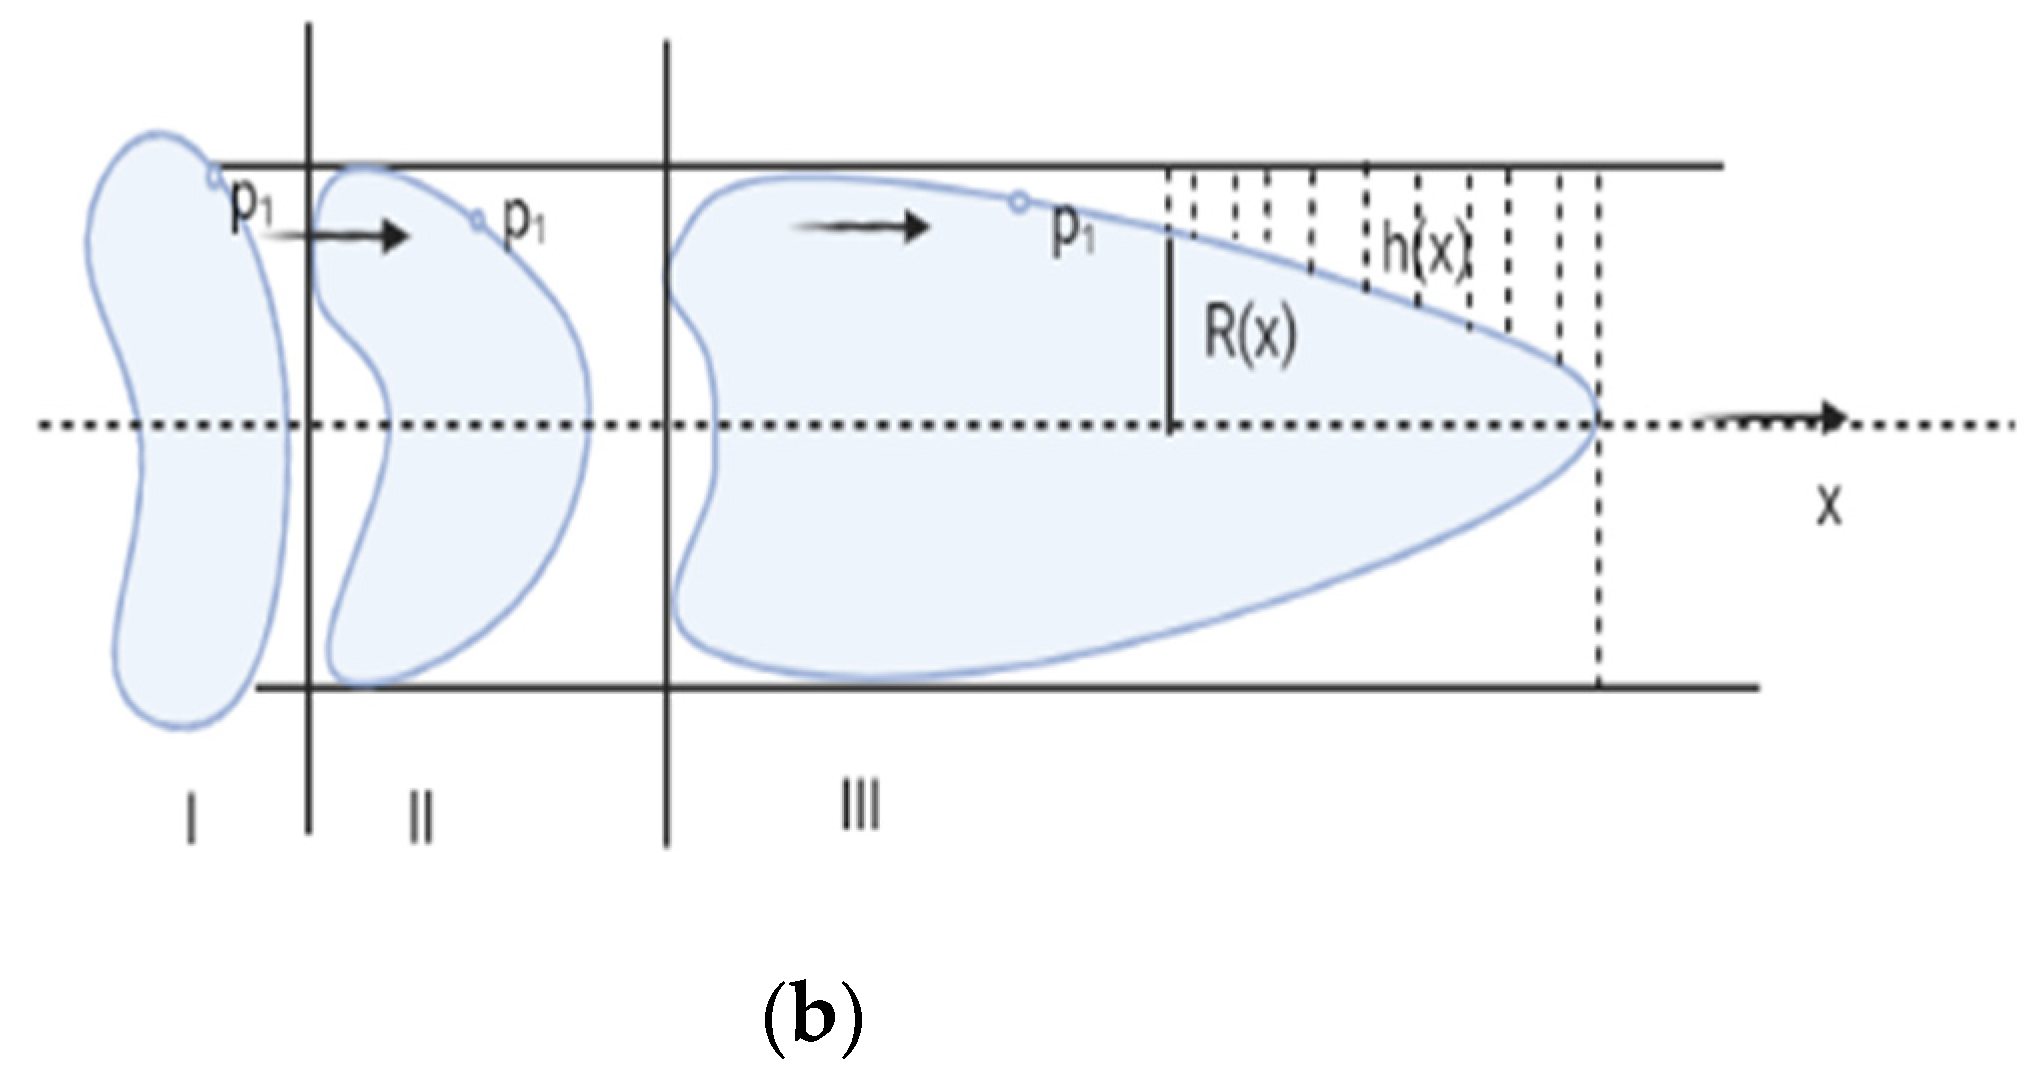
2.2.1. Red Blood Cell Mechanics
2.2.2. Plasma Flow Mechanics
2.3. Governing Equation
2.4. Solution
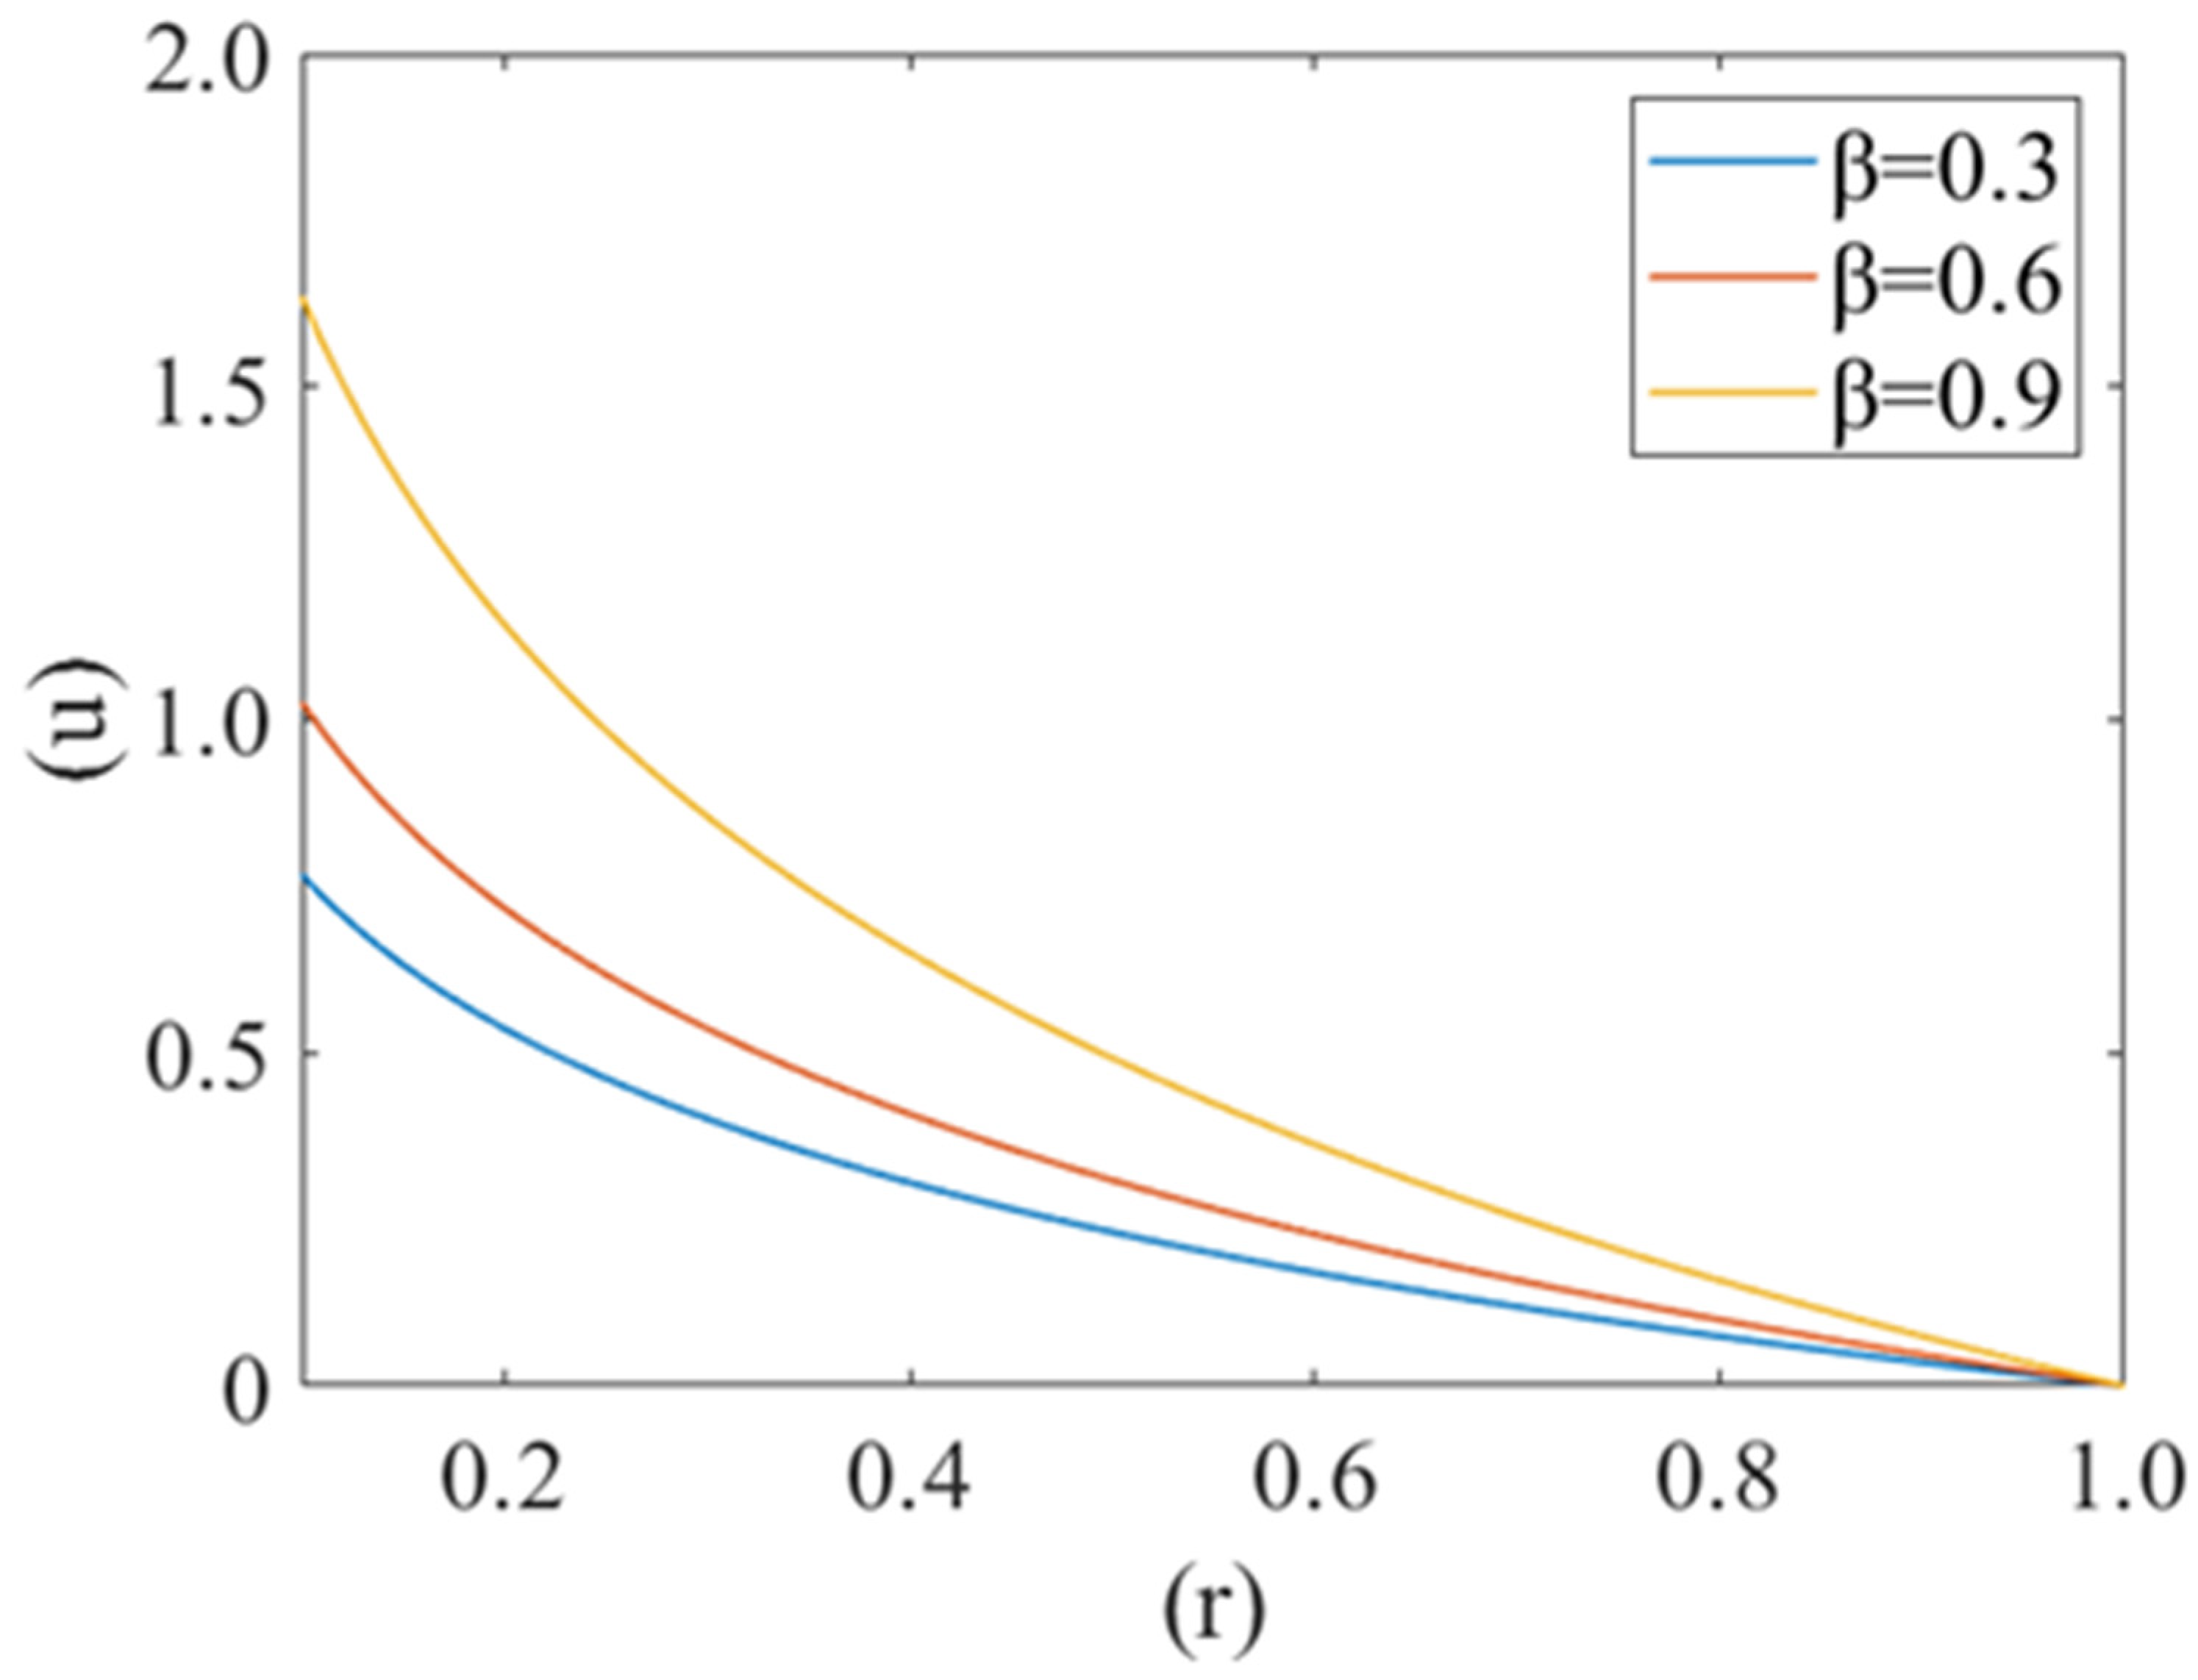
3. Results
4. Discussion
5. Conclusions
Author Contributions
Funding
Institutional Review Board Statement
Informed Consent Statement
Acknowledgments
Conflicts of Interest
References
- Herrick, J.B. Peculiar elongated and sickle-shaped red blood corpuscles in a case of severe anemia. Arch. Intern. Med. 1910, 6, 517–521. [Google Scholar] [CrossRef] [Green Version]
- Pauling, L.; Itano, H.A.; Singer, S.J.; Wells, I.C. Sickle cell anemia, a molecular disease. Science 1949, 110, 543–548. [Google Scholar] [CrossRef]
- Ingram, V.M. Gene mutations in human hæmoglobin: The chemical difference between normal and sickle cell hæmoglobin. Nature 1957, 180, 326–328. [Google Scholar] [CrossRef]
- Frenette, P.S. Sickle cell vaso-occlusion: Multistep and multicellular paradigm. Curr. Opin. Hematol. 2002, 9, 101–106. [Google Scholar] [CrossRef] [PubMed]
- Sorette, M.P.; Lavenant, M.G.; Clark, M.R. Ektacytometric measurement of sickle cell deformability as a continuous function of oxygen tension. Blood 1987, 69, 1272. [Google Scholar]
- Chien, S.; Usami, S.; Bertles, J.F. Abnormal rheology of oxygenated blood in sickle cell anemia. J. Clin. Investig. 1970, 49, 623–634. [Google Scholar] [CrossRef] [Green Version]
- Klug, P.P.; Lessin, L.S.; Radice, P. Rheological Aspects of Sickle Cell Disease. Arch. Intern. Med. 1974, 133, 577–590. [Google Scholar] [CrossRef]
- Chien, S.; King, R.G.; Kaperonis, A.A.; Usami, S. Viscoelastic properties of sickle cells and hemoglobin. Blood Cells 1982, 8, 53–64. [Google Scholar]
- Liu, Y.; Zhang, L.; Wang, X.; Liu, W.K. Coupling of Navier-Stokes equations with protein molecular dynamics and its application to hemodynamics. Int. J. Numer. Methods Fluids 2004, 46, 1237–1252. [Google Scholar] [CrossRef]
- Ballas, S.K.; Mohandas, N. Sickle red cell microrheology and sickle blood rheology. Microcirculation 2004, 11, 209–225. [Google Scholar] [CrossRef] [PubMed]
- Stuart, J.; Nash, G.B. Red cell deformability and haematological disorders. Blood Rev. 1990, 4, 141–147. [Google Scholar] [CrossRef]
- Evans, E.; Mohandas, N.; Leung, A. Static and dynamic rigidities of normal and sickle erythrocytes. Major influence of cell hemoglobin concentration. J. Clin. Investig. 1984, 73, 477–488. [Google Scholar] [CrossRef] [PubMed]
- Hebbel, R.P.; Yamada, O.; Moldow, C.F.; Jacob, H.S.; White, J.G.; Eaton, J.W. Abnormal adherence of sickle erythrocytes to cultured vascular endothelium. Possible mechanism for microvascular occlusion in sickle cell disease. J. Clin. Investig. 1980, 65, 154–160. [Google Scholar] [CrossRef]
- Mohandas, N.; Evans, E. Adherence of sickle erythrocytes to vascular endothelial cells: Requirement for both cell membrane changes and plasma factors. Blood 1984, 64, 282–287. [Google Scholar] [CrossRef] [PubMed] [Green Version]
- Higgins, J.M.; Eddington, D.T.; Bhatia, S.N.; Mahadevan, L. Sickle cell vasoocclusion and rescue in a microfluidic device. Proc. Natl. Acad. Sci. USA 2007, 104, 20496–20500. [Google Scholar] [CrossRef] [Green Version]
- Secomb, T.W. Red blood cell mechanics and capillary blood rheology. Cell Biophys. 1991, 18, 231–251. [Google Scholar] [CrossRef] [PubMed]
- Fåhræus, R.; Lindqvist, T. The viscosity of the blood in narrow capillary tubes. Am. J. Physiol. Leg. Content 1931, 96, 562–568. [Google Scholar] [CrossRef]
- Natarajan, M.; Udden, M.M.; McIntire, L.V. Adhesion of sickle red blood cells and damage to interleukin-1β stimulated endothelial cells under flow in vitro. Blood 1996, 87, 4845–4852. [Google Scholar] [CrossRef] [PubMed] [Green Version]
- Thomas, H.W. The wall effect in capillary instruments: An improved analysis suitable for application to blood and other particulate suspensions. Biorheology 2017, 1, 41–56. [Google Scholar] [CrossRef]
- Hou, H.W.; Bhagat, A.A.S.; Lee, W.C.; Huang, S.; Han, J.; Lim, C.T. Microfluidic devices for blood fractionation. Micromachines 2011, 2, 319–343. [Google Scholar] [CrossRef] [Green Version]
- Alapan, Y.; Kim, C.; Adhikari, A.; Gray, K.E.; Gurkan-Cavusoglu, E.; Little, J.A.; Gurkan, U.A. Sickle cell disease biochip: A functional red blood cell adhesion assay for monitoring sickle cell disease. Transl. Res. 2016, 173, 74–91. [Google Scholar] [CrossRef] [Green Version]
- Secomb, T.W.; Hsu, R.; Pries, A.R. Motion of red blood cells in a capillary with an endothelial surface layer: Effect of flow velocity. Am. J. Physiol. Hear. Circ. Physiol. 2001, 281, H629–H636. [Google Scholar] [CrossRef] [PubMed] [Green Version]
- Fung, Y.C. Blood flow in the capillary bed. J. Biomech. 1969, 2, 353–372. [Google Scholar] [CrossRef]
- Barnard, A.C.L.; Lopez, L.; Hellums, J.D. Basic theory of blood flow in capillaries. Microvasc. Res. 1968, 1, 23–24. [Google Scholar] [CrossRef]
- Fitzgerald, J.M. Mechanics of red-cell motion through very narrow capillaries. Proc. R. Soc. Lond. Ser. B Biol. Sci. 1969, 174, 193–227. [Google Scholar]
- Zarda, P.R.; Chien, S.; Skalak, R. Elastic deformations of red blood cells. J. Biomech. 1977, 10, 211–221. [Google Scholar] [CrossRef]
- Pedrizzetti, G. Fluid flow in a tube with an elastic membrane insertion. J. Fluid Mech. 1998, 375, 39–64. [Google Scholar] [CrossRef]
- Hsu, R.; Secomb, T.W. Motion of nonaxisymmetric red blood cells in cylindrical capillaries. J. Biomech. Eng. 1989, 111, 147–151. [Google Scholar] [CrossRef] [PubMed]
- Secomb, T.W. Blood Flow in the Microcirculation. Annu. Rev. Fluid Mech. 2017, 49, 443–461. [Google Scholar] [CrossRef]
- Secomb, T.W. Flow-dependent rheological properties of blood in capillaries. Microvasc. Res. 1987, 34, 46–58. [Google Scholar] [CrossRef]
- Secomb, T.W.; Hsu, R. Analysis of red blood cell motion through cylindrical micropores: Effects of cell properties. Biophys. J. 1996, 71, 1095–1101. [Google Scholar] [CrossRef] [Green Version]
- McWhirter, J.L.; Noguchi, H.; Gompper, G. Deformation and clustering of red blood cells in microcapillary flows. Soft Matter 2011, 7, 10967–10977. [Google Scholar] [CrossRef] [Green Version]
- Bali, R.; Mishra, S.; Mishra, M. Effect of Deformation of Red Cell on Nutritional Transport in Capillary-Tissue Exchange System. Appl. Math. 2011, 7, 10967–10977. [Google Scholar] [CrossRef] [Green Version]
- Bali, R.; Mishra, S.; Dubey, S. A mathematical model for red cell motion in narrow capillary surrounded by tissue. Appl. Math. Comput. 2008, 196, 193–199. [Google Scholar] [CrossRef]
- Gross, J.F.; Ozkaya, N. Flow of axisymmetric red blood cells in narrow capillaries. J. Fluid Mech. 1986, 163, 405–423. [Google Scholar]
- Lomen, D.O.; Gross, J.F. A mathematical model of the effect of oxygen consumption on the resistance to flow of sickle cell blood in capillaries. Math. Biosci. 1977, 37, 63–79. [Google Scholar] [CrossRef]
- Aprelev, A.; Stephenson, W.; Noh, H.; Meier, M.; Ferrone, F.A. The physical foundation of vasoocclusion in sickle cell disease. Biophys. J. 2012, 103, L38–L40. [Google Scholar] [CrossRef] [Green Version]
- Forsyth, A.M.; Wan, J.; Ristenpart, W.D.; Stone, H.A. The dynamic behavior of chemically ‘stiffened’ red blood cells in microchannel flows. Microvasc. Res. 2010, 80, 37–43. [Google Scholar] [CrossRef]
- Berger, S.A.; King, W.S. The flow of sickle-cell blood in the capillaries. Biophys. J. 1980, 29, 119–148. [Google Scholar] [CrossRef] [Green Version]
- Bransky, A.; Korin, N.; Nemirovski, Y.; Dinnar, U. Correlation between erythrocytes deformability and size: A study using a microchannel based cell analyzer. Microvasc. Res. 2007, 73, 7–13. [Google Scholar] [CrossRef]
- Greene, R.; Hughes, J.M.; Iliff, L.D.; Pineo, G.F. Red cell flexibility and pressure-flow relations in isolated lungs. J. Appl. Physiol. 1973, 34, 169–175. [Google Scholar] [CrossRef]
- Hariprasad, D.S.; Secomb, T.W. Motion of red blood cells near microvessel walls: Effects of a porous wall layer. J. Fluid Mech. 2012, 705, 195–212. [Google Scholar] [CrossRef] [Green Version]
- Chang, H.Y.; Li, X.; Li, H.; Karniadakis, G.E. MD/DPD Multiscale Framework for Predicting Morphology and Stresses of Red Blood Cells in Health and Disease. PLoS Comput. Biol. 2016, 12, e1005173. [Google Scholar] [CrossRef] [PubMed] [Green Version]
- Huber, D.; Oskooei, A.; Casadevall i Solvas, X.; Demello, A.; Kaigala, G.V. Hydrodynamics in Cell Studies. Chem. Rev. 2018, 118, 2042–2079. [Google Scholar] [CrossRef] [PubMed] [Green Version]
- Raj, A.; Sen, A.K. Entry and passage behavior of biological cells in a constricted compliant microchannel. RSC Adv. 2018, 8, 20884–20893. [Google Scholar] [CrossRef] [Green Version]
- Rupprecht, P.; Golé, L.; Rieu, J.P.; Vézy, C.; Ferrigno, R.; Mertani, H.C.; Riviere, C. A tapered channel microfluidic device for comprehensive cell adhesion analysis, using measurements of detachment kinetics and shear stress-dependent motion. Biomicrofluidics 2012, 6, 014107. [Google Scholar] [CrossRef] [Green Version]
- Chapman, G.B.; Cokelet, G.R. Flow resistance and drag forces due to multiple adherent leukocytes in postcapillary vessels. Biophys. J. 1998, 74, 3292–3301. [Google Scholar] [CrossRef] [Green Version]


| Sr. No. | Description | Value | Reference |
|---|---|---|---|
| 1. | Pressure drop, P1 | 4 | [24] |
| 2. | Ratio of the velocities of the cell to plasma, U0/V0 | 1.67 | [24] |
| 3. | Radial Compliance of the normal red blood cell | 0.06 | [33] |
| 4. | Reynolds number, Re | 0.25 | [34] |
| 5. | Ratio of local pressure in fluid region with reference pressure in capillary P2 | 6.877 | [35] |
Publisher’s Note: MDPI stays neutral with regard to jurisdictional claims in published maps and institutional affiliations. |
© 2021 by the authors. Licensee MDPI, Basel, Switzerland. This article is an open access article distributed under the terms and conditions of the Creative Commons Attribution (CC BY) license (https://creativecommons.org/licenses/by/4.0/).
Share and Cite
Chaturvedi, P.; Kumar, R.; Shah, S.R. Bio-Mechanical and Bio-Rheological Aspects of Sickle Red Cells in Microcirculation: A Mathematical Modelling Approach. Fluids 2021, 6, 322. https://doi.org/10.3390/fluids6090322
Chaturvedi P, Kumar R, Shah SR. Bio-Mechanical and Bio-Rheological Aspects of Sickle Red Cells in Microcirculation: A Mathematical Modelling Approach. Fluids. 2021; 6(9):322. https://doi.org/10.3390/fluids6090322
Chicago/Turabian StyleChaturvedi, Purnima, Rohit Kumar, and Sapna Ratan Shah. 2021. "Bio-Mechanical and Bio-Rheological Aspects of Sickle Red Cells in Microcirculation: A Mathematical Modelling Approach" Fluids 6, no. 9: 322. https://doi.org/10.3390/fluids6090322
APA StyleChaturvedi, P., Kumar, R., & Shah, S. R. (2021). Bio-Mechanical and Bio-Rheological Aspects of Sickle Red Cells in Microcirculation: A Mathematical Modelling Approach. Fluids, 6(9), 322. https://doi.org/10.3390/fluids6090322