
Entropy Cross-Efficiency Model for Decision Making Units with Interval Data

Abstract
:1. Introduction
2. Interval DEA Models
3. Cross-Efficiency Evaluation Method with Interval Data
4. The Cross-Efficiency Model Based on Shannon Entropy
5. Illustrations
5.1. The Case of Primary Schools
5.2. The Results and Compared with Other Models
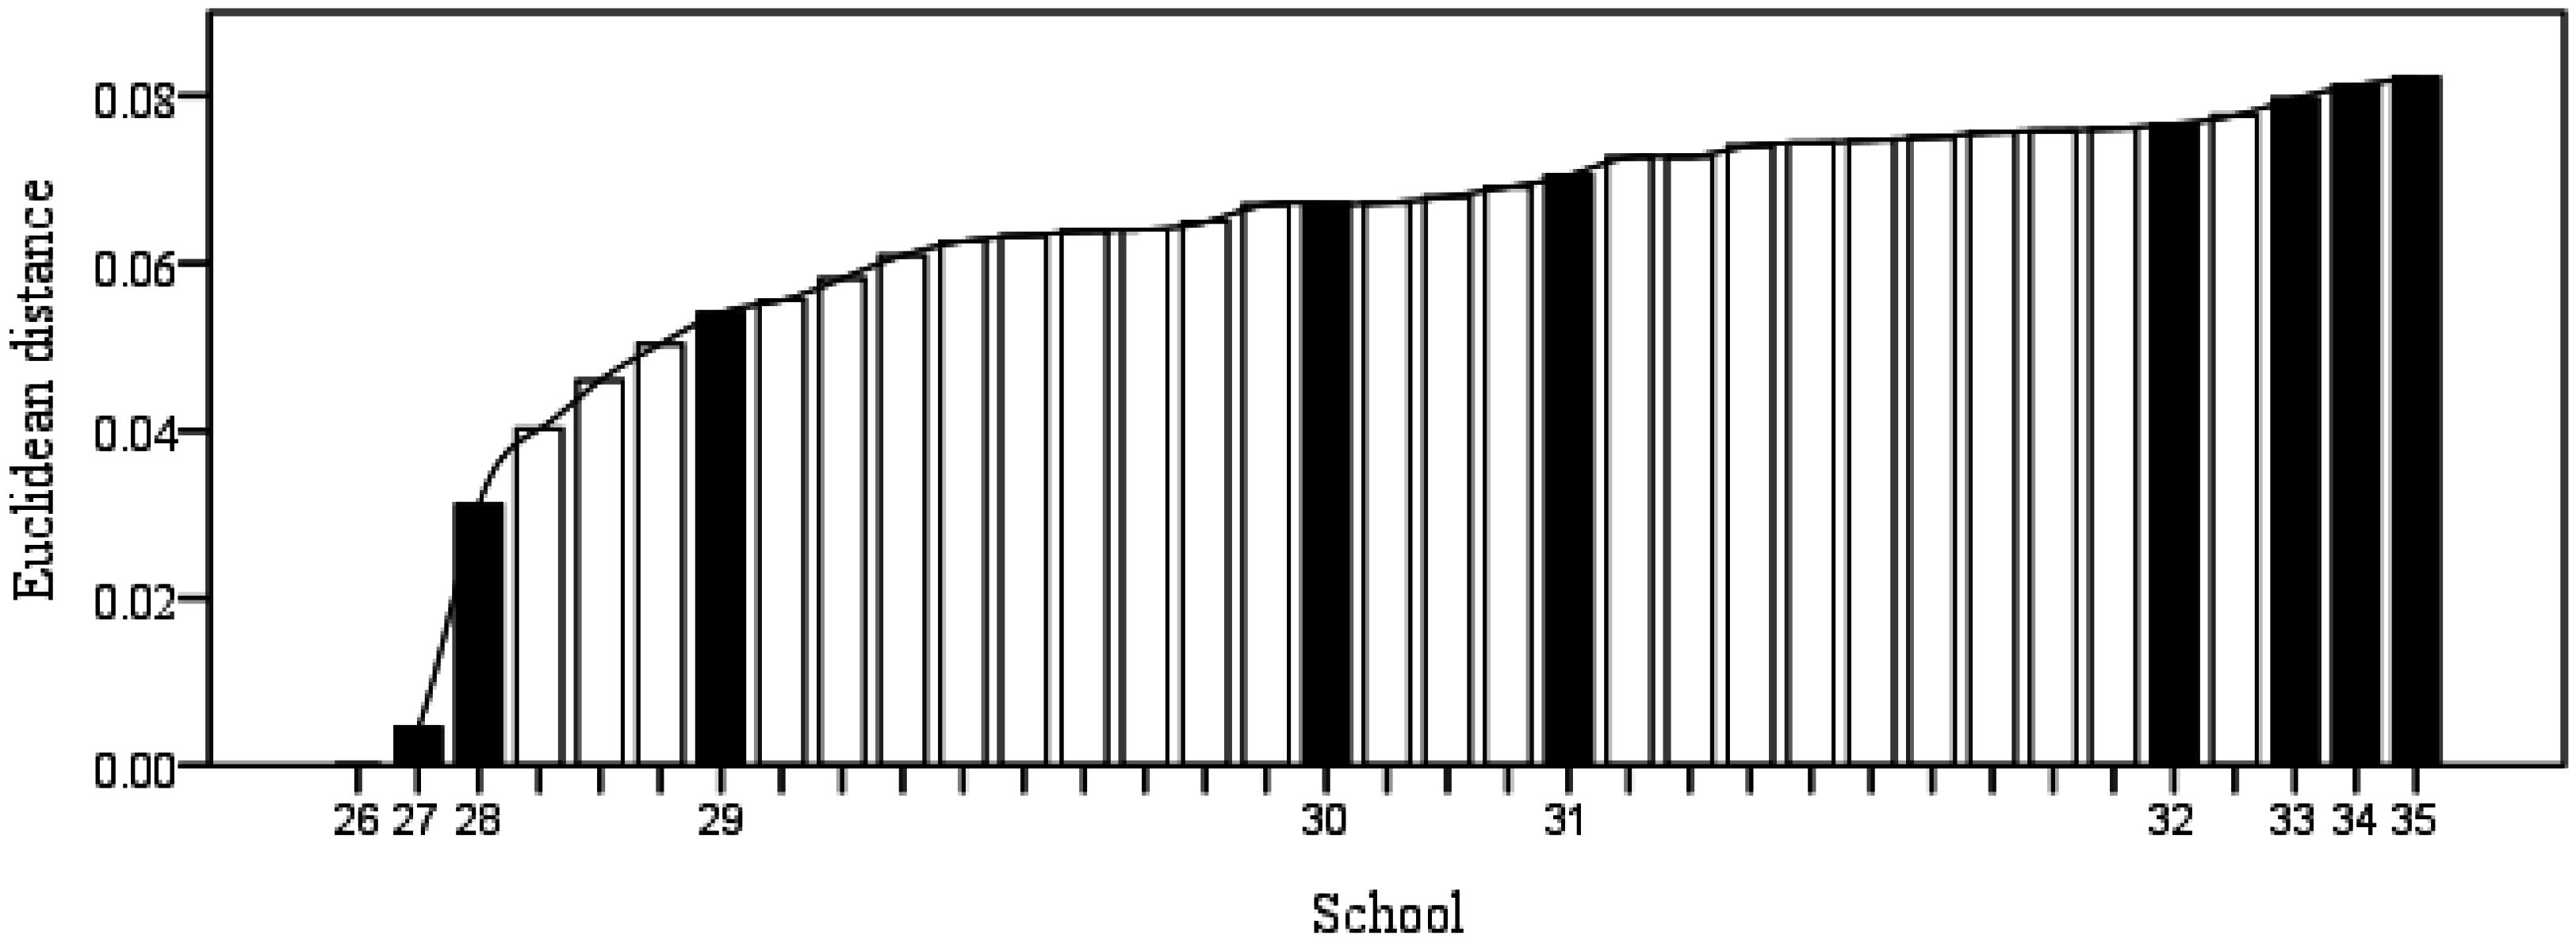
5.3. Validating the Model by Adding Simulated Schools
- (1)
- The performance ranking of 10 simulated schools are:.
- (2)
- School 26 uses the least education resources but educates the largest number of students. Therefore, its efficiency is the highest.
- (3)
- Compared with other schools, School 35 has the least number of students, but its educational resources are the largest. Thus, School 35 has the worst performance.
6. Conclusions
Acknowledgments
Author Contributions
Conflicts of Interest
References
- Charnes, A.; Cooper, W.W.; Rhodes, E. Measuring the efficiency of decision making units. Eur. J. Oper. Res. 1978, 2, 429–444. [Google Scholar] [CrossRef]
- Co, H.C.; Chew, K.S. Performance and R&D expenditures in American and Japanese manufacturing firms. Int. J. Prod. Res. 1997, 35, 3333–3348. [Google Scholar]
- Johns, N.; Howcroft, B.; Drake, L. The use of data envelopment analysis to monitor hotel productivity. Progress in tourism and hospitality research. Prog. Tour. Hosp. Res. 1997, 3, 119–127. [Google Scholar] [CrossRef]
- Braglia, M.; Petroni, A. Evaluating and selecting investments in industrial robots. Int. J. Prod. Res. 1999, 37, 4157–4178. [Google Scholar] [CrossRef]
- Sun, S. Assessing computer numerical control machines using data envelopment analysis. Int. J. Prod. Res. 2002, 40, 2011–2039. [Google Scholar] [CrossRef]
- Reichmann, G.; Sommersguter-Reichmann, M. University library benchmarking: An international comparison using DEA. Int. J. Prod. Econ. 2006, 100, 131–147. [Google Scholar] [CrossRef]
- Wang, R.T.; Ho, C.T.B.; Oh, K. Measuring production and marketing efficiency using grey relation analysis and data envelopment analysis. Int. J. Prod. Res. 2010, 48, 183–199. [Google Scholar] [CrossRef]
- Sinuany-Stern, Z.; Mehrez, A.; Hadad, Y. An AHP/DEA methodology for ranking decision making units. Int. Trans. Oper. Res. 2000, 7, 109–124. [Google Scholar] [CrossRef]
- Sexton, T.R.; Silkman, R.H.; Hogan, A.J. Dataenvelopment analysis: Critique and extensions. New Dir. Eval. 1986, 73–105. [Google Scholar] [CrossRef]
- Doyle, J.; Green, R. Efficiency and cross-efficiency in DEA: Derivations, meanings and uses. J. Oper. Res. Soc. 1994, 45, 567–578. [Google Scholar] [CrossRef]
- Anderson, T.R.; Hollingsworth, K.; Inman, L. The fixed weighting nature of a cross-evaluation model. J. Prod. Anal. 2002, 17, 249–255. [Google Scholar] [CrossRef]
- Wu, J.; Liang, L.; Chen, Y. DEA game cross-efficiency approach to Olympic rankings. Omega 2009, 37, 909–918. [Google Scholar] [CrossRef]
- Falagario, M.; Sciancalepore, F.; Costantino, N.; Pietroforte, R. Using a DEA-cross efficiency approach in public procurement tenders. Eur. J. Oper. Res. 2012, 218, 523–529. [Google Scholar] [CrossRef]
- Lim, S.; Oh, K.W.; Zhu, J. Use of DEA cross-efficiency evaluation in portfolio selection: An application to Korean stock market. Eur. J. Oper. Res. 2014, 236, 361–368. [Google Scholar] [CrossRef]
- Cui, Q.; Li, Y. Evaluating energy efficiency for airlines: An application of VFB-DEA. J. Air Transp. Manag. 2015, 44–45, 34–41. [Google Scholar] [CrossRef]
- Despotis, D.K. Improving the discriminating power of DEA: Focus on globally efficient units. J. Oper. Res. Soc. 2002, 53, 314–323. [Google Scholar] [CrossRef]
- Liang, L.; Wu, J.; Cook, W.D.; Zhu, J. Alternative secondary goals in DEA cross-efficiency evaluation. Int. J. Prod. Econ. 2008, 113, 1025–1030. [Google Scholar] [CrossRef]
- Wang, Y.-M.; Chin, K.-S. Some alternative models for DEA cross-efficiency evaluation. Int. J. Prod. Econ. 2010, 128, 332–338. [Google Scholar] [CrossRef]
- Jahanshahloo, G.R.; Lotfi, F.H.; Jafari, Y.; Maddahi, R. Selecting symmetric weights as a secondary goal in DEA cross-efficiency evaluation. Appl. Math. Model. 2011, 35, 544–549. [Google Scholar] [CrossRef]
- Wu, J.; Sun, J.; Zha, Y.; Liang, L. Ranking approach of cross-efficiency based on improved TOPSIS technique. J. Syst. Eng. Electron. 2011, 22, 604–608. [Google Scholar] [CrossRef]
- Contreras, I. Optimizing the rank position of the DMU as secondary goal in DEA cross-evaluation. Appl. Math. Model. 2012, 36, 2642–2648. [Google Scholar] [CrossRef]
- Lim, S. Minimax and maximin formulations of cross-efficiency in DEA. Comput. Ind. Eng. 2012, 62, 726–731. [Google Scholar] [CrossRef]
- Maddahi, R.; Jahanshahloo, G.R.; Lotfi, H.F.; Ebrahimnejad, A. Optimising proportional weights as a secondary goal in DEA cross-efficiency evaluation. Int. J. Oper. Res. 2014, 19, 234–245. [Google Scholar] [CrossRef]
- Cook, W.D.; Zhu, J. DEA Cobb–Douglas frontier and cross-efficiency. J. Oper. Res. Soc. 2014, 65, 265–268. [Google Scholar] [CrossRef]
- Wu, J.; Chu, J.; Sun, J.; Zhu, Q. DEA cross-efficiency evaluation based on Pareto improvement. Eur. J. Oper. Res. 2016, 248, 571–579. [Google Scholar] [CrossRef]
- Wu, J.; Liang, L.; Yang, F. Determination of the weights for the ultimate cross efficiency using Shapley value in cooperative game. Expert Syst. Appl. 2009, 36, 872–876. [Google Scholar] [CrossRef]
- Wang, Y.M.; Wang, S. Approaches to determining the relative importance weights for cross-efficiency aggregation in data envelopment analysis. J. Oper. Res. Soc. 2013, 64, 60–69. [Google Scholar] [CrossRef]
- Angiz, M.Z.; Mustafa, A.; Kamali, M.J. Cross-ranking of decision making units in data envelopment analysis. Appl. Math. Model. 2013, 37, 398–405. [Google Scholar] [CrossRef]
- Yang, G.-L.; Yang, J.-B.; Liu, W.-B.; Li, X.-X. Cross-efficiency aggregation in DEA models using the evidential-reasoning approach. Eur. J. Oper. Res. 2013, 231, 393–404. [Google Scholar] [CrossRef]
- Cooper, W.W.; Park, K.S.; Yu, G. An illustrative application of IDEA (imprecise data envelopment analysis) to a Korean mobile telecommunication company. Oper. Res. 2001, 49, 807–820. [Google Scholar] [CrossRef]
- Lee, Y.K.; Park, K.S.; Kim, S.H. Identification of inefficiencies in an additive model based IDEA (imprecise data envelopment analysis). Comput. Oper. Res. 2002, 29, 1661–1676. [Google Scholar] [CrossRef]
- Despotis, D.K.; Smirlis, Y.G. Data envelopment analysis with imprecise data. Eur. J. Oper. Res. 2002, 140, 24–36. [Google Scholar] [CrossRef]
- Wang, Y.-M.; Greatbanks, R.; Yang, J.-B. Interval efficiency assessment using data envelopment analysis. Fuzzy Sets Syst. 2005, 153, 347–370. [Google Scholar] [CrossRef]
- Azizi, H.; Jahed, R. An improvement for efficiency interval: Efficient and inefficient frontiers. Int. J. Appl. Oper. Res. 2011, 1, 49–63. [Google Scholar]
- Wang, Y.-M.; Chin, K.-S. Fuzzy data envelopment analysis: A fuzzy expected value approach. Expert Syst. Appl. 2011, 38, 11678–11685. [Google Scholar] [CrossRef]
- Dotoli, M.; Epicoco, N.; Falagario, M.; Sciancalepore, F. A cross-efficiency fuzzy Data Envelopment Analysis technique for the performance evaluation of Decision Making Units under uncertainty. Comput. Ind. Eng. 2015, 79, 103–114. [Google Scholar] [CrossRef]
- Wang, Y.-M.; Chin, K.-S. A neutral DEA model for cross-efficiency evaluation and its extension. Expert Syst. Appl. 2010, 37, 3666–3675. [Google Scholar] [CrossRef]
- Oukil, A.; Amin, G.R. Maximum appreciative cross-efficiency in DEA: A new ranking method. Comput. Ind. Eng. 2015, 81, 14–21. [Google Scholar] [CrossRef]
- Cook, W.D.; Zhu, J. DEA Cross Efficiency. In Data Envelopment Analysis: A Handbook of Models and Methods; Zhu, J., Ed.; Springer: Berlin/Heidelberg, Germany, 2015; pp. 23–43. [Google Scholar]
- Lim, S.; Zhu, J. DEA Cross efficiency under variable returns to scale. In Data Envelopment Analysis: A Handbook of Models and Methods; Zhu, J., Ed.; Springer: Berlin/ Heidelberg, Germany, 2015; pp. 45–66. [Google Scholar]
- Cooper, W.W.; Seiford, L.M.; Zhu, J. Data envelopment analysis: History, models, and interpretations. In Handbook on Data Envelopment Analysis; Springer: Berlin/ Heidelberg, Germany, 2004; pp. 1–39. [Google Scholar]
- Cook, W.D.; Bala, K. Performance measurement and classification data in DEA: Input-oriented model. Omega 2007, 35, 39–52. [Google Scholar] [CrossRef]
- Shannon, C.E. The mathematical theory of communication. Bell Syst. Tech. J. 1948, 27, 379–423, 623–656. [Google Scholar] [CrossRef]
- Lo Storto, C. Ecological Efficiency Based Ranking of Cities: A Combined DEA Cross-Efficiency and Shannon’s Entropy Method. Sustainability 2016, 8, 124. [Google Scholar] [CrossRef]
- Xie, Q.; Dai, Q.; Li, Y.; Jiang, A. Increasing the discriminatory power of DEA using Shannon’s entropy. Entropy 2014, 16, 1571–1585. [Google Scholar] [CrossRef]
- Qi, X.-G.; Guo, B. Determining common weights in data envelopment analysis with Shannon’s entropy. Entropy 2014, 16, 6394–6414. [Google Scholar] [CrossRef]
- Wang, Y.-M.; Parkan, C. A general multiple attribute decision-making approach for integrating subjective preferences and objective information. Fuzzy Sets Syst. 2006, 157, 1333–1345. [Google Scholar] [CrossRef]
- Wang, Y.-M.; Luo, Y. Integration of correlations with standard deviations for determining attribute weights in multiple attribute decision making. Math. Comput. Model. 2010, 51, 1–12. [Google Scholar] [CrossRef]
- Tzeng, G.H.; Huang, J.J. Multiple Attribute Decision Making: Methods and Applications; CRC Press: Boca Raton, FL, USA, 2011; p. 349. [Google Scholar]
- Sun, J.; Miao, Y.; Wu, J.; Cui, L.; Zhong, R. Improved interval DEA models with common weight. Kybernetika 2014, 50, 774–785. [Google Scholar] [CrossRef]
- Hadad, Y.; Hanani, M.Z. Combining the AHP and DEA methodologies for selecting the best alternative. Int. J. Logist. Syst. Manag. 2011, 9, 251–267. [Google Scholar] [CrossRef]
- Ganley, J.A.; Cubbin, S.J. Public Sector Efficiency Measurement: Applications of Data Envelopment Analysis; Elsevier: Amsterdam, The Netherlands, 1992. [Google Scholar]
- Friedman, L.; Sinuany-Stern, Z. Combining ranking scales and selecting variables in the DEA context. The case of industrial branches. Comput. Oper. Res. 1998, 25, 781–791. [Google Scholar] [CrossRef]
- Adler, N.; Friedman, L.; Sinuany-Stern, Z. Review of ranking methods in the DEA context. Eur. J. Oper. Res. 2002, 140, 249–265. [Google Scholar] [CrossRef]
- Wang, Y.M.; Chin, K.S.; Jiang, P. Weight determination in the cross-efficiency evaluation. Comput. Ind. Eng. 2011, 61, 497–502. [Google Scholar] [CrossRef]
- Ramón, N.; Ruiz, J.L.; Sirvent, I. Reducing differences between profiles of weights: A “peer-restricted” cross-efficiency evaluation. Omega 2011, 39, 634–641. [Google Scholar] [CrossRef]

| Rating | Rated | ||||
|---|---|---|---|---|---|
| 1 | 2 | 3 | … | n | |
| 1 | [,] | [,] | [,] | … | [,] |
| 2 | [,] | [,] | [,] | … | [,] |
| 3 | [,] | [,] | [,] | … | [,] |
| … | … | … | … | … | … |
| n | [,] | [,] | [,] | … | [,] |
| School | Number of Staff | School Building Area (Square meters) | Copies of Books | Fixed Asset (Million RMB) | School Budget (Million RMB) | Number of Students |
|---|---|---|---|---|---|---|
| 1 | [47,53] | 3964 | 8947 | 3.54 | 9.26 | [313,360] |
| 2 | [39,40] | 965 | 4247 | 2.04 | 3.41 | [102,110] |
| 3 | [65,70] | 2222 | 8543 | 2.23 | 12.07 | [263,300] |
| 4 | [43,54] | 2316 | 7560 | 2.42 | 5.70 | [261,274] |
| 5 | [47,49] | 3362 | 11,035 | 1.23 | 5.90 | [292,312] |
| 6 | [49,59] | 3273 | 6120 | 5.61 | 8.53 | [261,289] |
| 7 | [30,36] | 1534 | 7439 | 2.55 | 5.73 | [256,270] |
| 8 | [45,57] | 1130 | 4043 | 2.25 | 10.07 | [73,81] |
| 9 | [38,45] | 2278 | 7306 | 1.51 | 7.60 | [293,311] |
| 10 | [104,124] | 7321 | 25,218 | 16.91 | 15.73 | [1129,1195] |
| 11 | [92,110] | 6218 | 11,552 | 10.86 | 13.95 | [410,455] |
| 12 | [38,40] | 1878 | 4155 | 3.89 | 6.43 | [191,202] |
| 13 | [42,46] | 2649 | 6986 | 1.41 | 6.22 | [242,263] |
| 14 | [39,50] | 2402 | 8623 | 2.18 | 7.25 | [264,341] |
| 15 | [55,57] | 2359 | 7200 | 5.06 | 8.57 | [221,264] |
| 16 | [30,39] | 1328 | 6260 | 1.87 | 5.68 | [179,227] |
| 17 | [132,137] | 11,922 | 53,840 | 8.28 | 20.07 | [2672,3122] |
| 18 | [59,62] | 3552 | 11,674 | 6.76 | 8.20 | [417,505] |
| 19 | [17,19] | 1666 | 3926 | 2.98 | 2.83 | [125,147] |
| 20 | [173,180] | 23,200 | 40,000 | 23.09 | 25.18 | [3066,3122] |
| 21 | [73,74] | 3271 | 21,484 | 2.34 | 10.90 | [360,386] |
| 22 | [59,72] | 4301 | 10,300 | 2.26 | 10.14 | [290,363] |
| 23 | [99,112] | 21,175 | 47,060 | 7.34 | 14.35 | [1995,2317] |
| 24 | [35,41] | 1410 | 13,803 | 1.65 | 5.37 | [212,230] |
| 25 | [65,105] | 30,705 | 22,000 | 38.30 | 15.99 | [1252,1276] |
| Evaluated DMUs | ||||||||||||||
| DMU1 | DMU2 | DMU3 | DMU4 | DMU5 | DMU6 | DMU7 | DMU8 | DMU9 | DMU10 | DMU11 | DMU12 | DMU13 | ||
| Evaluating DMUs | DMU1 | [0.50,0.58] | [0.33,0.35] | [0.49,0.56] | [0.52,0.55] | [0.47,0.50] | [0.45,0.50] | [0.52,0.54] | [0.24,0.26] | [0.66,0.70] | [0.55,0.58] | [0.37,0.42] | [0.49,0.51] | [0.57,0.62] |
| DMU2 | [0.50,0.57] | [0.41,0.44] | [0.51,0.58] | [0.55,0.58] | [0.42,0.45] | [0.56,0.63] | [0.60,0.64] | [0.29,0.33] | [0.64,0.68] | [0.72,0.77] | [0.47,0.52] | [0.65,0.69] | [0.52,0.56] | |
| DMU3 | [0.50,0.57] | [0.41,0.44] | [0.51,0.58] | [0.55,0.58] | [0.42,0.45] | [0.56,0.63] | [0.60,0.64] | [0.29,0.33] | [0.64,0.68] | [0.72,0.77] | [0.47,0.52] | [0.65,0.69] | [0.52,0.56] | |
| DMU4 | [0.50,0.57] | [0.41,0.44] | [0.51,0.58] | [0.55,0.58] | [0.42,0.45] | [0.56,0.63] | [0.60,0.64] | [0.29,0.33] | [0.64,0.68] | [0.72,0.77] | [0.47,0.52] | [0.65,0.69] | [0.52,0.56] | |
| DMU5 | [0.24,0.27] | [0.13,0.14] | [0.31,0.36] | [0.29,0.30] | [0.63,0.67] | [0.13,0.14] | [0.27,0.28] | [0.09,0.10] | [0.52,0.55] | [0.20,0.21] | [0.11,0.12] | [0.13,0.14] | [0.46,0.50] | |
| DMU6 | [0.50,0.57] | [0.41,0.44] | [0.51,0.58] | [0.55,0.58] | [0.42,0.45] | [0.56,0.63] | [0.60,0.64] | [0.29,0.33] | [0.64,0.68] | [0.72,0.77] | [0.47,0.52] | [0.65,0.69] | [0.52,0.56] | |
| DMU7 | [0.30,0.35] | [0.40,0.44] | [0.45,0.52] | [0.43,0.45] | [0.33,0.36] | [0.31,0.34] | [0.64,0.67] | [0.25,0.27] | [0.49,0.52] | [0.59,0.63] | [0.26,0.28] | [0.39,0.41] | [0.35,0.38] | |
| DMU8 | [0.50,0.57] | [0.41,0.44] | [0.51,0.58] | [0.55,0.58] | [0.42,0.45] | [0.56,0.63] | [0.60,0.64] | [0.29,0.33] | [0.64,0.68] | [0.72,0.77] | [0.47,0.52] | [0.65,0.69] | [0.52,0.56] | |
| DMU9 | [0.50,0.58] | [0.33,0.35] | [0.49,0.56] | [0.52,0.55] | [0.47,0.50] | [0.45,0.50] | [0.51,0.54] | [0.23,0.26] | [0.66,0.70] | [0.55,0.58] | [0.37,0.42] | [0.48,0.51] | [0.57,0.62] | |
| DMU10 | [0.50,0.57] | [0.41,0.44] | [0.51,0.58] | [0.55,0.58] | [0.42,0.45] | [0.56,0.63] | [0.60,0.64] | [0.29,0.33] | [0.64,0.68] | [0.72,0.77] | [0.47,0.52] | [0.65,0.69] | [0.52,0.56] | |
| DMU11 | [0.50,0.57] | [0.41,0.44] | [0.51,0.58] | [0.55,0.58] | [0.42,0.45] | [0.56,0.63] | [0.60,0.64] | [0.29,0.33] | [0.64,0.68] | [0.72,0.77] | [0.47,0.52] | [0.65,0.69] | [0.52,0.56] | |
| DMU12 | [0.50,0.57] | [0.41,0.44] | [0.51,0.58] | [0.55,0.58] | [0.42,0.45] | [0.56,0.63] | [0.60,0.64] | [0.29,0.33] | [0.64,0.68] | [0.72,0.77] | [0.47,0.52] | [0.65,0.69] | [0.52,0.56] | |
| DMU13 | [0.50,0.58] | [0.33,0.35] | [0.49,0.56] | [0.52,0.55] | [0.47,0.50] | [0.45,0.50] | [0.51,0.54] | [0.23,0.26] | [0.66,0.70] | [0.55,0.58] | [0.37,0.42] | [0.48,0.51] | [0.57,0.62] | |
| DMU14 | [0.50,0.57] | [0.41,0.44] | [0.51,0.58] | [0.55,0.58] | [0.42,0.45] | [0.56,0.63] | [0.60,0.64] | [0.29,0.33] | [0.64,0.68] | [0.72,0.77] | [0.47,0.52] | [0.65,0.69] | [0.52,0.56] | |
| DMU15 | [0.50,0.57] | [0.41,0.44] | [0.51,0.58] | [0.55,0.58] | [0.42,0.45] | [0.56,0.63] | [0.60,0.64] | [0.29,0.33] | [0.64,0.68] | [0.72,0.77] | [0.47,0.52] | [0.65,0.69] | [0.52,0.56] | |
| DMU16 | [0.30,0.35] | [0.40,0.44] | [0.45,0.52] | [0.43,0.45] | [0.33,0.36] | [0.31,0.34] | [0.64,0.67] | [0.25,0.27] | [0.49,0.52] | [0.59,0.64] | [0.26,0.28] | [0.39,0.41] | [0.35,0.38] | |
| DMU17 | [0.50,0.58] | [0.41,0.44] | [0.51,0.58] | [0.55,0.58] | [0.63,0.67] | [0.56,0.63] | [0.64,0.67] | [0.29,0.33] | [0.66,0.70] | [0.72,0.77] | [0.47,0.52] | [0.65,0.69] | [0.57,0.62] | |
| DMU18 | [0.50,0.57] | [0.41,0.44] | [0.51,0.58] | [0.55,0.58] | [0.42,0.45] | [0.56,0.63] | [0.60,0.64] | [0.29,0.33] | [0.64,0.68] | [0.72,0.77] | [0.47,0.52] | [0.65,0.69] | [0.52,0.56] | |
| DMU19 | [0.50,0.57] | [0.41,0.44] | [0.51,0.58] | [0.55,0.58] | [0.42,0.45] | [0.56,0.63] | [0.60,0.64] | [0.29,0.33] | [0.64,0.68] | [0.72,0.77] | [0.47,0.52] | [0.65,0.69] | [0.52,0.56] | |
| DMU20 | [0.50,0.58] | [0.41,0.44] | [0.51,0.58] | [0.55,0.58] | [0.47,0.50] | [0.56,0.63] | [0.60,0.64] | [0.29,0.33] | [0.66,0.70] | [0.72,0.77] | [0.47,0.52] | [0.65,0.69] | [0.57,0.62] | |
| DMU21 | [0.30,0.35] | [0.40,0.44] | [0.45,0.52] | [0.43,0.45] | [0.33,0.36] | [0.31,0.34] | [0.64,0.67] | [0.25,0.27] | [0.49,0.52] | [0.59,0.63] | [0.26,0.28] | [0.39,0.41] | [0.35,0.39] | |
| DMU22 | [0.50,0.58] | [0.33,0.35] | [0.49,0.56] | [0.52,0.55] | [0.47,0.50] | [0.45,0.50] | [0.51,0.54] | [0.23,0.26] | [0.66,0.70] | [0.55,0.58] | [0.37,0.42] | [0.49,0.51] | [0.57,0.62] | |
| DMU23 | [0.24,0.29] | [0.21,0.23] | [0.16,0.18] | [0.32,0.33] | [0.34,0.36] | [0.22,0.24] | [0.31,0.35] | [0.05,0.06] | [0.27,0.31] | [0.48,0.51] | [0.21,0.23] | [0.22,0.23] | [0.27,0.30] | |
| DMU24 | [0.28,0.35] | [0.40,0.44] | [0.45,0.52] | [0.43,0.45] | [0.33,0.36] | [0.31,0.34] | [0.64,0.67] | [0.25,0.27] | [0.49,0.52] | [0.59,0.63] | [0.26,0.28] | [0.39,0.41] | [0.35,0.38] | |
| DMU25 | [0.45,0.46] | [0.21,0.31] | [0.32,0.40] | [0.40,0.45] | [0.34,0.37] | [0.41,0.55] | [0.44,0.49] | [0.14,0.23] | [0.49,0.52] | [0.58,0.62] | [0.34,0.46] | [0.39,0.59] | [0.40,0.45] | |
| Evaluated DMUs | ||||||||||||||
| DMU14 | DMU15 | DMU16 | DMU17 | DMU18 | DMU19 | DMU20 | DMU21 | DMU22 | DMU23 | DMU24 | DMU25 | - | ||
|---|---|---|---|---|---|---|---|---|---|---|---|---|---|---|
| Evaluating DMUs | DMU1 | [0.49,0.63] | [0.37,0.44] | [0.44,0.56] | [0.86,1.00] | [0.46,0.56] | [0.37,0.43] | [0.98,1.00] | [0.30,0.32] | [0.46,0.58] | [0.72,0.84] | [0.27,0.30] | [0.43,0.44] | - |
| DMU2 | [0.50,0.65] | [0.48,0.57] | [0.50,0.63] | [0.86,1.00] | [0.57,0.69] | [0.46,0.54] | [0.98,1.00] | [0.31,0.33] | [0.41,0.51] | [0.60,0.70] | [0.30,0.33] | [0.46,0.47] | - | |
| DMU3 | [0.50,0.65] | [0.48,0.57] | [0.50,0.63] | [0.86,1.00] | [0.57,0.69] | [0.46,0.54] | [0.98,1.00] | [0.31,0.33] | [0.41,0.51] | [0.60,0.70] | [0.30,0.32] | [0.46,0.47] | - | |
| DMU4 | [0.50,0.65] | [0.48,0.57] | [0.50,0.63] | [0.86,1.00] | [0.57,0.69] | [0.46,0.54] | [0.98,1.00] | [0.31,0.33] | [0.41,0.51] | [0.60,0.70] | [0.30,0.32] | [0.46,0.47] | - | |
| DMU5 | [0.32,0.42] | [0.12,0.14] | [0.26,0.32] | [0.86,1.00] | [0.17,0.21] | [0.11,0.13] | [0.39,0.40] | [0.40,0.43] | [0.34,0.43] | [0.73,0.83] | [0.34,0.37] | [0.11,0.11] | - | |
| DMU6 | [0.50,0.65] | [0.48,0.57] | [0.50,0.63] | [0.86,1.00] | [0.57,0.69] | [0.46,0.54] | [0.98,1.00] | [0.31,0.33] | [0.41,0.51] | [0.60,0.70] | [0.30,0.32] | [0.46,0.47] | - | |
| DMU7 | [0.42,0.54] | [0.36,0.43] | [0.51,0.65] | [0.86,1.00] | [0.45,0.55] | [0.29,0.34] | [0.54,0.54] | [0.42,0.45] | [0.26,0.33] | [0.38,0.44] | [0.57,0.62] | [0.17,0.18] | - | |
| DMU8 | [0.50,0.65] | [0.48,0.57] | [0.50,0.63] | [0.86,1.00] | [0.57,0.69] | [0.46,0.54] | [0.98,1.00] | [0.31,0.33] | [0.41,0.51] | [0.60,0.70] | [0.30,0.32] | [0.46,0.47] | - | |
| DMU9 | [0.49,0.63] | [0.37,0.44] | [0.44,0.56] | [0.86,1.00] | [0.46,0.56] | [0.37,0.43] | [0.99,1.00] | [0.30,0.32] | [0.46,0.58] | [0.72,0.84] | [0.27,0.30] | [0.43,0.44] | - | |
| DMU10 | [0.50,0.65] | [0.48,0.57] | [0.50,0.63] | [0.86,1.00] | [0.57,0.69] | [0.46,0.54] | [0.98,1.00] | [0.31,0.33] | [0.41,0.51] | [0.60,0.70] | [0.30,0.32] | [0.46,0.47] | - | |
| DMU11 | [0.50,0.65] | [0.48,0.57] | [0.50,0.63] | [0.86,1.00] | [0.57,0.69] | [0.46,0.54] | [0.98,1.00] | [0.31,0.33] | [0.41,0.51] | [0.60,0.70] | [0.30,0.32] | [0.46,0.47] | - | |
| DMU12 | [0.50,0.65] | [0.48,0.57] | [0.50,0.63] | [0.86,1.00] | [0.57,0.69] | [0.46,0.54] | [0.98,1.00] | [0.31,0.33] | [0.41,0.51] | [0.60,0.70] | [0.30,0.32] | [0.46,0.47] | - | |
| DMU13 | [0.49,0.63] | [0.37,0.44] | [0.44,0.56] | [0.86,1.00] | [0.46,0.56] | [0.37,0.43] | [0.99,1.01] | [0.29,0.32] | [0.46,0.58] | [0.73,0.85] | [0.27,0.30] | [0.44,0.44] | - | |
| DMU14 | [0.50,0.65] | [0.48,0.57] | [0.50,0.63] | [0.86,1.00] | [0.57,0.69] | [0.46,0.54] | [0.98,1.00] | [0.31,0.33] | [0.41,0.51] | [0.60,0.70] | [0.30,0.32] | [0.46,0.47] | - | |
| DMU15 | [0.50,0.65] | [0.48,0.57] | [0.50,0.63] | [0.86,1.00] | [0.57,0.69] | [0.46,0.54] | [0.98,1.00] | [0.31,0.33] | [0.41,0.51] | [0.60,0.70] | [0.30,0.32] | [0.46,0.47] | - | |
| DMU16 | [0.42,0.54] | [0.36,0.43] | [0.51,0.65] | [0.86,1.00] | [0.45,0.55] | [0.29,0.34] | [0.54,0.55] | [0.42,0.45] | [0.26,0.33] | [0.38,0.44] | [0.57,0.62] | [0.17,0.18] | - | |
| DMU17 | [0.50,0.65] | [0.48,0.57] | [0.51,0.65] | [0.86,1.00] | [0.57,0.69] | [0.46,0.54] | [0.98,1.00] | [0.42,0.45] | [0.46,0.58] | [0.86,1.00] | [0.57,0.62] | [0.65,0.89] | - | |
| DMU18 | [0.50,0.65] | [0.48,0.57] | [0.50,0.63] | [0.86,1.00] | [0.57,0.69] | [0.46,0.54] | [0.98,1.00] | [0.31,0.33] | [0.41,0.51] | [0.60,0.70] | [0.30,0.32] | [0.46,0.47] | - | |
| DMU19 | [0.50,0.65] | [0.48,0.57] | [0.50,0.63] | [0.86,1.00] | [0.57,0.69] | [0.46,0.54] | [0.98,1.00] | [0.31,0.33] | [0.41,0.51] | [0.60,0.70] | [0.30,0.32] | [0.46,0.47] | - | |
| DMU20 | [0.50,0.65] | [0.48,0.57] | [0.50,0.63] | [0.86,1.00] | [0.57,0.69] | [0.46,0.54] | [0.98,1.00] | [0.31,0.33] | [0.46,0.58] | [0.79,0.92] | [0.30,0.32] | [0.72,0.89] | - | |
| DMU21 | [0.42,0.54] | [0.36,0.43] | [0.51,0.65] | [0.86,1.00] | [0.45,0.55] | [0.29,0.34] | [0.52,0.55] | [0.42,0.45] | [0.26,0.33] | [0.38,0.44] | [0.57,0.62] | [0.16,0.18] | - | |
| DMU22 | [0.49,0.63] | [0.37,0.44] | [0.44,0.56] | [0.86,1.00] | [0.46,0.56] | [0.37,0.43] | [0.98,1.00] | [0.30,0.32] | [0.46,0.58] | [0.73,0.85] | [0.27,0.30] | [0.43,0.44] | - | |
| DMU23 | [0.26,0.34] | [0.18,0.22] | [0.22,0.60] | [0.86,1.00] | [0.35,0.42] | [0.31,0.36] | [0.80,0.81] | [0.22,0.24] | [0.20,0.25] | [0.86,1.00] | [0.26,0.29] | [0.52,0.59] | - | |
| DMU24 | [0.42,0.54] | [0.36,0.43] | [0.51,0.65] | [1.24,1.00] | [0.46,0.55] | [0.29,0.34] | [0.52,0.55] | [0.42,0.45] | [0.29,0.33] | [0.37,0.44] | [0.57,0.62] | [0.05,0.18] | - | |
| DMU25 | [0.39,0.50] | [0.33,0.40] | [0.37,0.44] | [0.65,1.00] | [0.46,0.51] | [0.41,0.48] | [0.98,0.99] | [0.22,0.27] | [0.36,0.38] | [0.55,0.90] | [0.20,0.28] | [0.72,0.89] | - | |
| DMU | The Proposed Model | The Model of Sun et al. [50] | ||||||||
|---|---|---|---|---|---|---|---|---|---|---|
| , | , | , | , | |||||||
| Distance | Ranking | Efficiency | Ranking | Efficiency | Ranking | Efficiency | Ranking | Efficiency | Ranking | |
| 1 | 0.3445 | 18 | 0.5718 | 18 | 0.5643 | 18 | 0.5567 | 18 | 0.5491 | 18 |
| 2 | 0.5383 | 24 | 0.4410 | 24 | 0.4377 | 24 | 0.4345 | 24 | 0.4313 | 24 |
| 3 | 0.3348 | 17 | 0.5766 | 16 | 0.5694 | 17 | 0.5622 | 17 | 0.5550 | 17 |
| 4 | 0.3097 | 16 | 0.5750 | 17 | 0.5722 | 16 | 0.5695 | 16 | 0.5667 | 16 |
| 5 | 0.2000 | 9 | 0.6684 | 10 | 0.6641 | 10 | 0.6598 | 9 | 0.6555 | 9 |
| 6 | 0.2671 | 12 | 0.6192 | 14 | 0.6132 | 14 | 0.6071 | 14 | 0.6011 | 13 |
| 7 | 0.1926 | 8 | 0.6686 | 9 | 0.6652 | 9 | 0.6617 | 8 | 0.6582 | 8 |
| 8 | 0.7852 | 25 | 0.3239 | 25 | 0.3207 | 25 | 0.3175 | 25 | 0.3142 | 25 |
| 9 | 0.1612 | 6 | 0.6996 | 6 | 0.6955 | 6 | 0.6915 | 6 | 0.6874 | 6 |
| 10 | 0.1030 | 5 | 0.7620 | 4 | 0.7578 | 4 | 0.7536 | 4 | 0.7493 | 4 |
| 11 | 0.4191 | 22 | 0.5151 | 22 | 0.5099 | 22 | 0.5048 | 22 | 0.4996 | 22 |
| 12 | 0.1783 | 7 | 0.6821 | 7 | 0.6784 | 7 | 0.6746 | 7 | 0.6709 | 7 |
| 13 | 0.2610 | 11 | 0.6197 | 13 | 0.6147 | 13 | 0.6097 | 12 | 0.6048 | 11 |
| 14 | 0.3031 | 15 | 0.6318 | 12 | 0.6172 | 12 | 0.6026 | 15 | 0.5880 | 15 |
| 15 | 0.3683 | 19 | 0.5642 | 20 | 0.5549 | 19 | 0.5455 | 19 | 0.5362 | 19 |
| 16 | 0.2880 | 14 | 0.6389 | 11 | 0.6251 | 11 | 0.6113 | 11 | 0.5975 | 14 |
| 17 | 0.0135 | 3 | 0.9856 | 3 | 0.9712 | 3 | 0.9568 | 3 | 0.9423 | 3 |
| 18 | 0.2250 | 10 | 0.6788 | 8 | 0.6667 | 8 | 0.6547 | 10 | 0.6426 | 10 |
| 19 | 0.4118 | 21 | 0.5319 | 21 | 0.5238 | 21 | 0.5157 | 21 | 0.5077 | 21 |
| 20 | 0.0000 | 1 | 0.9982 | 1 | 0.9964 | 1 | 0.9946 | 1 | 0.9928 | 1 |
| 21 | 0.5298 | 23 | 0.4476 | 23 | 0.4446 | 23 | 0.4415 | 23 | 0.4385 | 23 |
| 22 | 0.3839 | 20 | 0.5652 | 19 | 0.5536 | 20 | 0.5420 | 20 | 0.5304 | 20 |
| 23 | 0.0125 | 2 | 0.9861 | 2 | 0.9722 | 2 | 0.9583 | 2 | 0.9444 | 2 |
| 24 | 0.2681 | 13 | 0.6180 | 15 | 0.6132 | 15 | 0.6083 | 13 | 0.6034 | 12 |
| 25 | 0.1009 | 4 | 0.7417 | 5 | 0.7403 | 5 | 0.7389 | 5 | 0.7375 | 5 |
| DMU | Input 1 | Input 2 | Input 3 | Input 4 | Input 5 | Output 1 |
|---|---|---|---|---|---|---|
| 1 | 0.000000 | 0.000000 | 0.000082 | 0.000000 | 0.076254 | 0.001609 |
| 2 | 0.000000 | 0.000226 | 0.000184 | 0.000000 | 0.000000 | 0.004038 |
| 3 | 0.000000 | 0.000109 | 0.000089 | 0.000000 | 0.000000 | 0.001946 |
| 4 | 0.000000 | 0.000118 | 0.000096 | 0.000000 | 0.000000 | 0.002108 |
| 5 | 0.000000 | 0.000000 | 0.000000 | 0.000000 | 0.813008 | 0.002156 |
| 6 | 0.000000 | 0.000121 | 0.000099 | 0.000000 | 0.000000 | 0.002164 |
| 7 | 0.000000 | 0.000652 | 0.000000 | 0.000000 | 0.000000 | 0.002489 |
| 8 | 0.000000 | 0.000226 | 0.000184 | 0.000000 | 0.000000 | 0.004039 |
| 9 | 0.000000 | 0.000000 | 0.000115 | 0.000000 | 0.107204 | 0.002263 |
| 10 | 0.000000 | 0.000036 | 0.000029 | 0.000000 | 0.000000 | 0.000641 |
| 11 | 0.000000 | 0.000064 | 0.000052 | 0.000000 | 0.000000 | 0.001143 |
| 12 | 0.000000 | 0.000190 | 0.000155 | 0.000000 | 0.000000 | 0.003395 |
| 13 | 0.000000 | 0.000000 | 0.000120 | 0.000000 | 0.112541 | 0.002375 |
| 14 | 0.000000 | 0.000106 | 0.000086 | 0.000000 | 0.000000 | 0.001895 |
| 15 | 0.000000 | 0.000122 | 0.000099 | 0.000000 | 0.000000 | 0.002173 |
| 16 | 0.000000 | 0.000753 | 0.000000 | 0.000000 | 0.000000 | 0.002876 |
| 17 | 0.000000 | 0.000004 | 0.000005 | 0.004922 | 0.072459 | 0.000320 |
| 18 | 0.000000 | 0.000077 | 0.000062 | 0.000000 | 0.000000 | 0.001368 |
| 19 | 0.000000 | 0.000206 | 0.000167 | 0.000000 | 0.000000 | 0.003673 |
| 20 | 0.000000 | 0.000006 | 0.000013 | 0.012582 | 0.000862 | 0.000320 |
| 21 | 0.000000 | 0.000306 | 0.000000 | 0.000000 | 0.000000 | 0.001167 |
| 22 | 0.000000 | 0.000000 | 0.000081 | 0.000000 | 0.075290 | 0.001589 |
| 23 | 0.000000 | 0.000001 | 0.000000 | 0.060539 | 0.014946 | 0.000432 |
| 24 | 0.000000 | 0.000709 | 0.000000 | 0.000000 | 0.000000 | 0.002708 |
| 25 | 0.000000 | 0.000000 | 0.000045 | 0.000000 | 0.000000 | 0.000582 |
| School | Number of Staff | School Building Area (Square Meters) | Copies of Book | Fixed Asset (Million RMB) | School Budget (Million RMB) | Number of Students |
|---|---|---|---|---|---|---|
| 26 | [17,19] | 965 | 3926 | 1.23 | 2.83 | [3066,3122] |
| 27 | [20,24] | 1098 | 4053 | 3.56 | 2.90 | [2233,2678] |
| 28 | [40,46] | 2031 | 9083 | 9.73 | 4.51 | [1865,1964] |
| 29 | [49,66] | 3066 | 10,101 | 10.06 | 6.73 | [1360,1461] |
| 30 | [80,97] | 9678 | 15,352 | 11.73 | 9.11 | [921,1076] |
| 31 | [116,143] | 10,666 | 25,453 | 19.64 | 10.15 | [831,910] |
| 32 | [147,154] | 15,732 | 36,436 | 20.13 | 15.63 | [506,783] |
| 33 | [163,170] | 25,932 | 47,538 | 29.64 | 17.98 | [365,393] |
| 34 | [171,172] | 28,162 | 50,684 | 36.03 | 19.07 | [161,232] |
| 35 | [173,180] | 30,705 | 53,840 | 38.30 | 20.07 | [73,81] |
© 2016 by the authors; licensee MDPI, Basel, Switzerland. This article is an open access article distributed under the terms and conditions of the Creative Commons Attribution (CC-BY) license (http://creativecommons.org/licenses/by/4.0/).
Share and Cite
Wang, L.; Li, L.; Hong, N. Entropy Cross-Efficiency Model for Decision Making Units with Interval Data. Entropy 2016, 18, 358. https://doi.org/10.3390/e18100358
Wang L, Li L, Hong N. Entropy Cross-Efficiency Model for Decision Making Units with Interval Data. Entropy. 2016; 18(10):358. https://doi.org/10.3390/e18100358
Chicago/Turabian StyleWang, Lupei, Lei Li, and Ningxi Hong. 2016. "Entropy Cross-Efficiency Model for Decision Making Units with Interval Data" Entropy 18, no. 10: 358. https://doi.org/10.3390/e18100358
APA StyleWang, L., Li, L., & Hong, N. (2016). Entropy Cross-Efficiency Model for Decision Making Units with Interval Data. Entropy, 18(10), 358. https://doi.org/10.3390/e18100358