Article

Normalized Difference Vegetation Index and Chlorophyll Content for Precision Nitrogen Management in Durum Wheat Cultivars under Semi-Arid Conditions

by
Ferhat Kizilgeci
1,*,
Mehmet Yildirim
2,
Mohammad Sohidul Islam
3,
Disna Ratnasekera
4,
Muhammad Aamir Iqbal
5 and
Ayman EL Sabagh
6,7,*
1
Department of Plant and Animal Production, Kiziltepe Vocational School, Mardin Artuklu University, 47060 Mardin, Turkey
2
Department of Field Crop, Faculty of Agriculture, Dicle University, 21280 Diyarbakir, Turkey
3
Department of Agronomy, Hajee Mohammad Danesh Science and Technology University, Dinjapur 5200, Bangladesh
4
Department of Agricultural Biology, Faculty of Agriculture, University of Ruhuna, Peradeniya 20400, Sri Lanka
5
Department of Agronomy, Faculty of Agriculture, University of Poonch Rawalakot, Rawalakot 12350, Pakistan
6
Department of Field Crops, Faculty of Agriculture, Siirt University, 56001 Siirt, Turkey
7
Department of Agronomy, Faculty of Agriculture, University of Kafrelsheikh, 33516 Kafrelsheikh, Egypt
*
Authors to whom correspondence should be addressed.
Sustainability 2021, 13(7), 3725; https://doi.org/10.3390/su13073725
Submission received: 21 February 2021 / Revised: 22 March 2021 / Accepted: 23 March 2021 / Published: 26 March 2021
(This article belongs to the Special Issue Sustainable Agricultural Production of Crop Plants)

Abstract

:
To impart sustainability to modern intensive farming systems, environmental pollution caused by nitrogenous fertilizers in needs to be reduced by optimizing their doses. To estimate the grain yield and nutrtional quallity of wheat, the normalized difference vegetation index (NDVI) and chlorophyll content (SPAD) are potential screening tools to identify the N deficiency and screen out the promising cultivars. The two-year field study was comprised with five levels of nitrogen (N) (control, 50, 100, 150 and 200 kg N ha−1) and two durum wheat genotypes (Sena and Svevo). The experimental design was split-plot, in which N levels were placed in the main plots, while wheat genotypes were arranged in sub-plots. To predict the yield and quality traits, the NDVI and SPAD values recorded at heading, anthesis and milky growth stages were taken as response variables. The results revealed that N fertilization significantly influenced the SPAD and NDVI attributed traits of durum wheat, except NDVI at milky stage (NDVI-M) during the first year. The maximum value of NDVI was recorded by 150 kg N ha−1, while control treatment gave the minimum value. The grain yield was increased with the increasing dose of the N up to 100 kg N ha−1 (4121 kg ha−1), and thereafter, it was declined with further increased of N levels. However, the variation between the genotypes was not significant, except NDVI and SPAD values at the milky stage. The genotype Svevo had the highest NDVI values at all growth stages, while the genotype Sena recorded the maximum SPAD values during both years. Similarly, the N levels significantly influenced the quality traits (protein, wet gluten, starch test weight and Zeleny sedimentation) of both genotypes. The highly significant relationship of SPAD and NDVI with the grain yield and yield attributes showed their reliability as indicators for determining the N deficiency and selection of superior wheat genotypes for ensuring food security under climate change scenario.

1. Introduction

Globally, wheat (Triticum aestivum L.) production is needed to be boosted by over 40% in next two decades for fulfilling the food demand of growing population [1,2,3]. Since cultivable land area under wheat is difficult to be increased owing to expanding urbanization, thus increasing grain production per unit area constitutes the best way for meeting the food and nutritional security [4,5,6]. Wheat along with corn and rice, contributes over 51% of caloric intake across the globe [7]. Therefore, wheat is the third largest cereal after the maize and rice. Wheat is being grown in all habitatable continents because of its adaptation to vast range of climate, elevation and soil characteristics. Durum wheat is a distinct type of tetraploid wheat which is broadly utilized to make pasta, couscous, bourghul, puddings and bread [8].
Durum wheat is more adaptable to semi-arid climate compared to bread wheat. Despite its versatile use and adaptability to various agro-environments, considerable research gap exists regarding identification of most promising genotypes of durum wheat. In addition, research-based adoption of genetic and agronomic modifications could be a good option to exploit the full yield potential of the crop. To develop the most productive technology package for durum wheat, the interactive relationship of genotype, soil characteristics and climate must be investigated in cohesion [9].
In addition to genotypes, soil fertility is one of the key factors which determines the grain yield and nutritional quality of wheat under varying agro-ecological conditions. Primary mineral nutrients (nitrogen, phosphorous and potassium) are the most vital components of soil fertility and their deficiency causes serious decline in grain yield leading to jeopardizing the food security and diminishing the economic turnouts of growers [10]. Nitrogen (N) is one of the important plant nutrients which plays a crucial role in vegetative growth and grain yield of wheat [11,12,13,14]. The N fertilizer has been recorded as the largest input cost owing to higher plant needs and increasing prices [15], thus optimization of N fertilization is of great importance in order to reduce cost of production and increase profitability. In semi-arid regions, wheat is adversely influenced by the N deficiency causing nutritional stress, reduced leaf chlorophyll content and grain yield [16]. In order to achieve higher yield of wheat, optimal quantity of N must be supplied to ensure vigorous yield attributes including number of tillers and grains per spike along with number and grain weight per spike [17,18].
The use of spectral reflectance indices (SRI) such as normalized difference vegetation index (NDVI) and chlorophyll index (SPAD) are reliable indicators to determine N status of crop plants [19,20]. The SRI are numerical indicators that use either specific wavelengths or electromagnetic spectrum bands to quantitatively link changes in reflected spectrum with respect to physiological variables of plants [21]. The NDVI data have been used to track crop conditions and predict grain yield under varying agro-climatic conditions [22,23,24,25,26]. Total dry matter (TDM) and leaf area index (LAI) estimations in the red and near-infrared spectral regions can be effectively evaluated by vegetative indices such as NDVI and simple ratio. The NDVI measures the amount of green vegetation in an area [27]. However, the improvement of algorithms that determine the N dose to be applied at variable rates based on different vegetation indices assessed by the canopy sensors, such as the NDVI, which requires these sensors as a tool in N management. Some wavelengths of reflection are used to determine the chlorophyll content. The chlorophyll content of the leaf can be directly measured by several reliable instruments. The most popular of which is the portable SPAD meter because it is user-friendly and non-destructive. The SPAD and Green-Seeker have integrated light sources (active sensors), which are used in all conditions.
Along with grain yield, N fertilization acquires pivotal position in boosting the quality traits of wheat [28,29]. consequently, improving N management through dose optimization by increasing N use efficiency directing to better productivity, while minimizing environmental pollution has to be handled smartly [30]. The NDVI value has been established as reliable indicator to determine N status of various cereal crop plants [31] and grains [32]. The SPAD chlorophyll meter was largely used in rice and wheat to identify crop N status [33,34]. Thus, the NDVI and SPAD indices have great potential to optimize N use efficiency leading to enhance the productivity of wheat.
Unfortunately, no specific research regarding the NDVI and SPAD indices for nitrogen use efficiency and increase wheat yield has been conducted and discussed elaborately. Hence, we hypothesized that wheat cultivars respond differently to various N levels and N dose optimization may be done using NDVI and SPAD values. Therefore, the study was carried out to determine the correlation between the NDVI and the chlorophyll content (SPAD) with yield and quality parameters of durum wheat cultivars at different N levels with dual objectives to determine the best performing wheat cultivar and N dose.

2. Materials and Methods

2.1. Location of the Experiment

Experiments have been performed in the field area of Dicle University, Diyarbakir, Turkey (37.53′ N, 40.1′ E, 670 m above sea level) under rain-fed conditions during two consecutive wheat growing seasons (2016–2017 and 2017–2018).

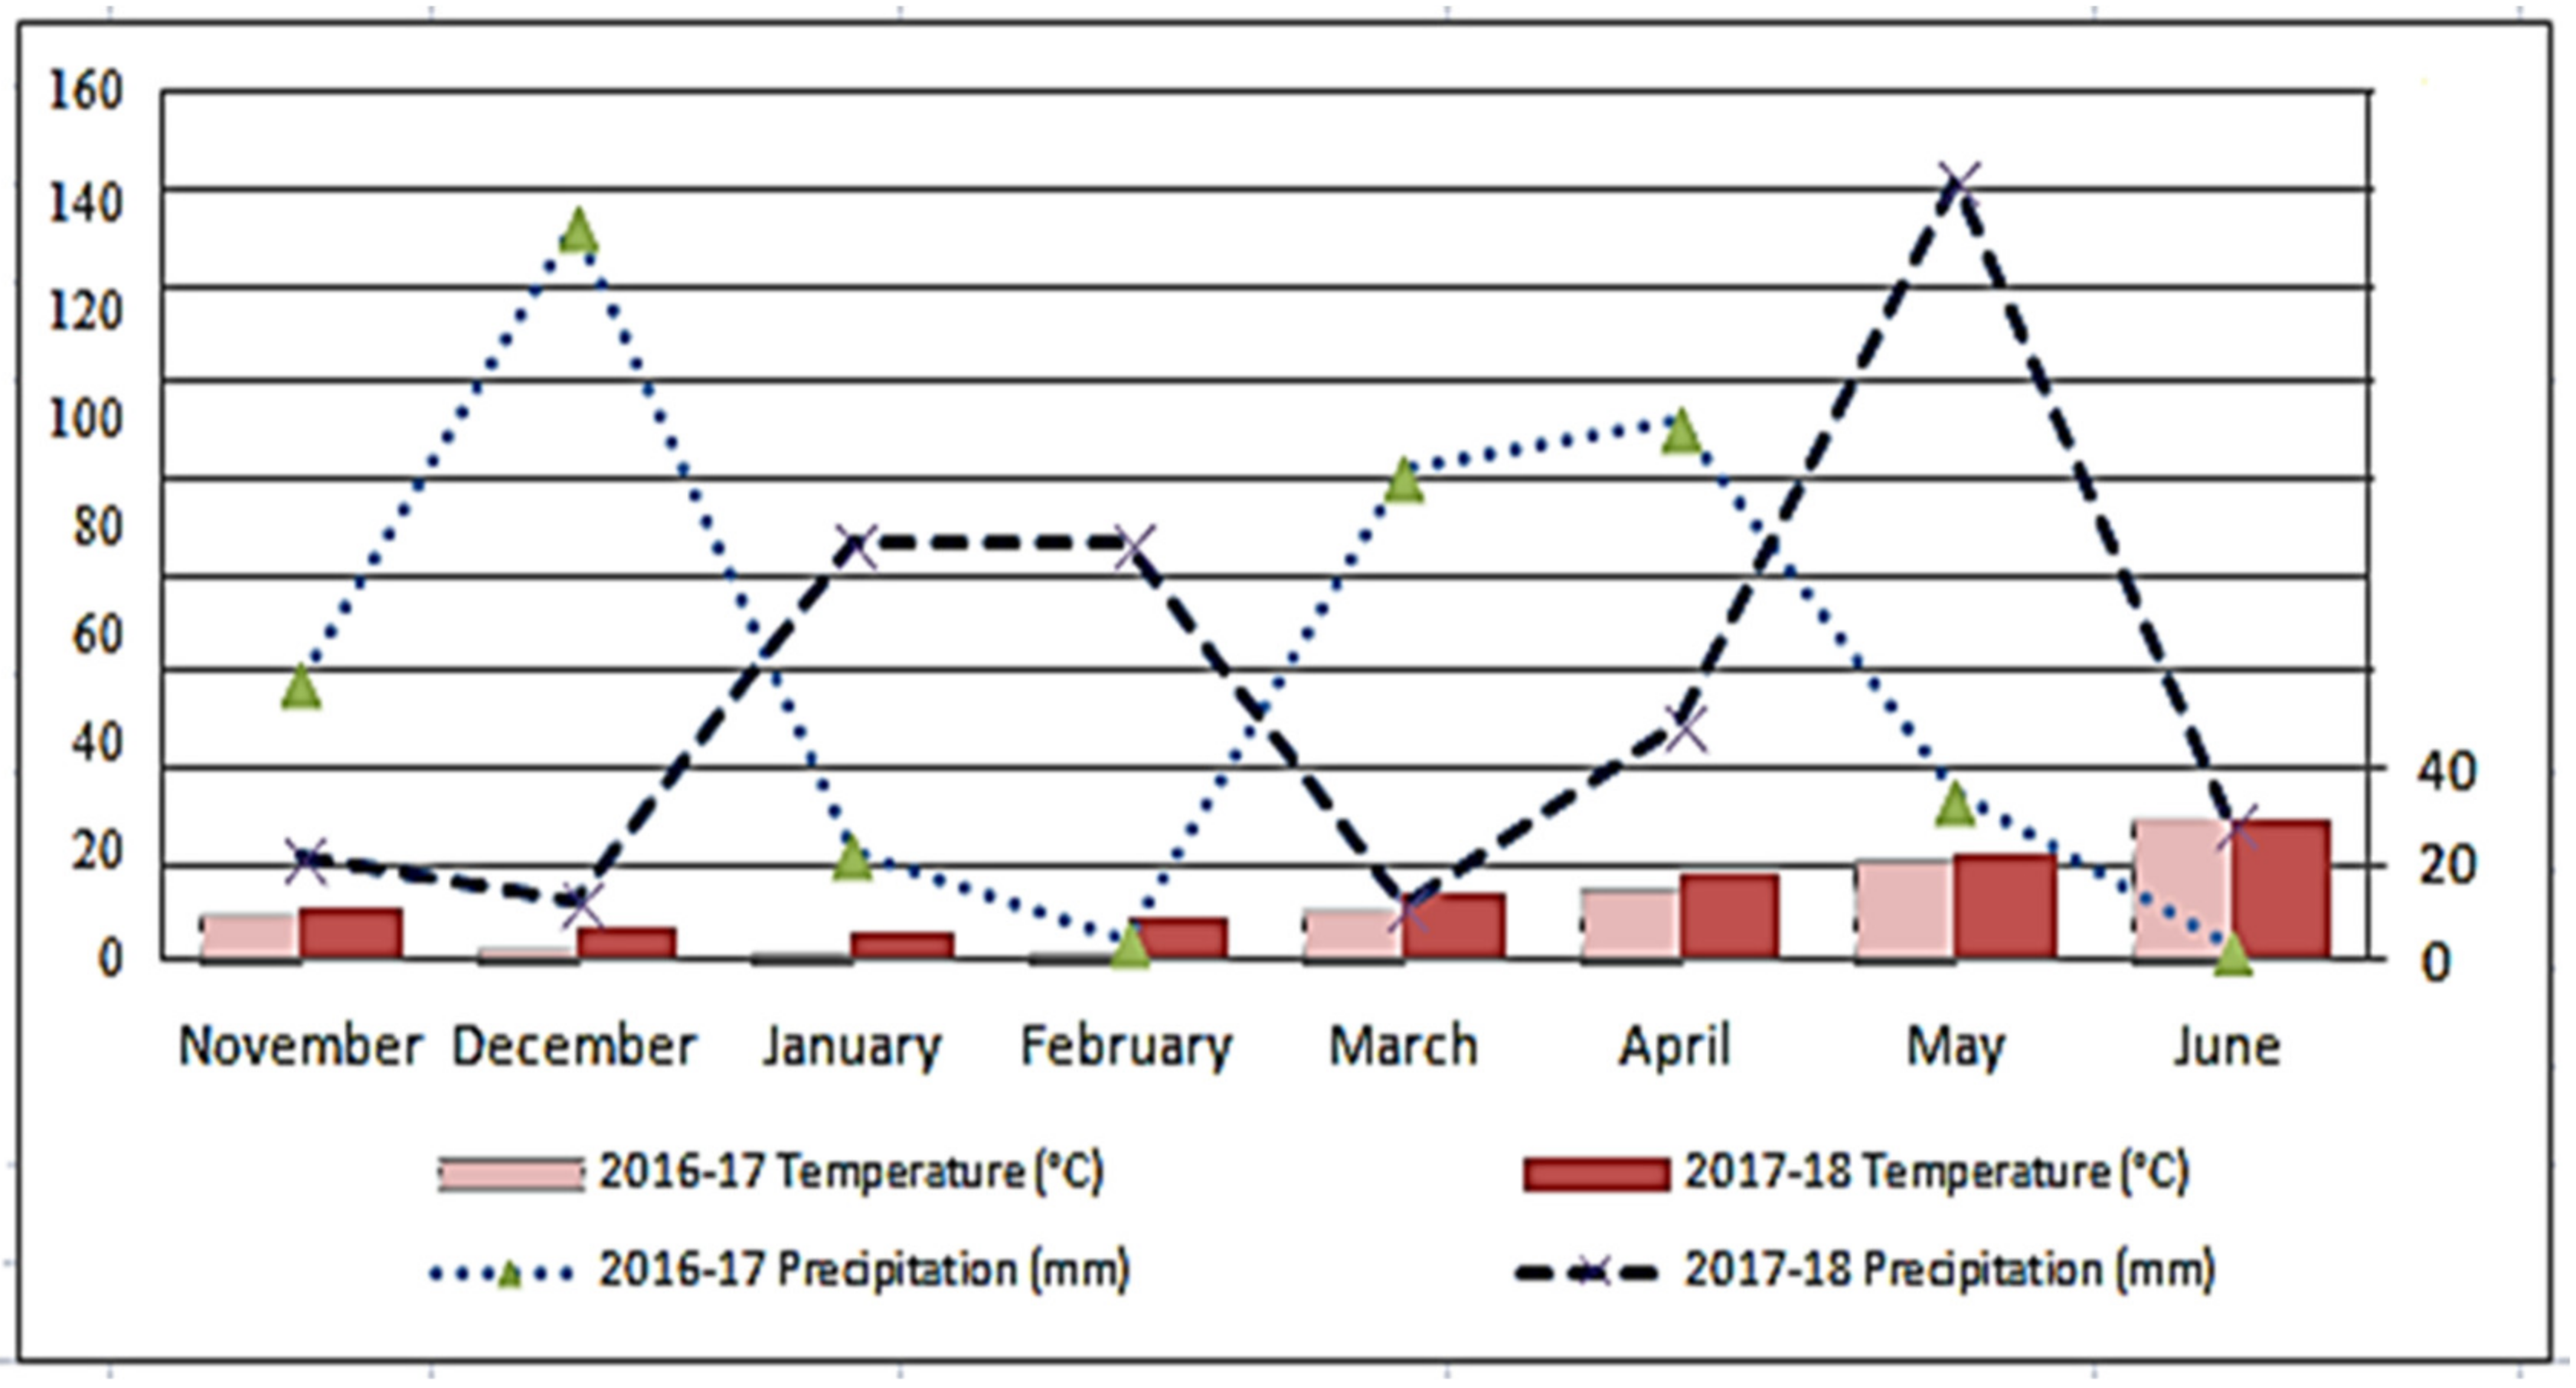
2.2. Agro-Climatic Conditions of Growing Seasons

The weather data (temperature and precipitation) were recorded during crop growth periods in both years (Figure 1). The total amount of precipitation was found similar during both wheat growing seasons. However, precipitation decreased in March (11.6 mm) and April (48.8 mm) in the second year compared to the first year, which is important for plant growth and development. Physical and chemical soil properties of the experimental field are shown in Table 1.

2.3. Experimental Treatments and Design

Treatments included five levels of nitrogen (N) viz., control (no N applied), 50 kg N ha−1, 100 kg N ha−1, 150 kg N ha−1 and 200 kg N ha−1, and two durum wheat genotypes viz., “Sena” and “Svevo” were used as planting materials. The factors were arranged in a split-plot design and repeated four times, where N doses and genotypes were represented in main plots, sub-plots, respectively.

2.4. Experimental Procedures

The plot size was adjusted as 4.8 m2 (4 m × 1.2 m) for each treatment. The plots were separated by 1m bunds, and the treatment block-to-block distance was 2 m. Seed of two durum wheat genotypes were sown at the rate of 500 seed m−2. Phosphorus (as triple superphosphate) was applied 60 kg ha−1. Whole N according to the treatment specification and phosphorus fertilizer were applied at sowing time.

2.5. Data Ccollection and Analysis

Plant height, spike length, spikelets spike−1, kernels spike−1, 1000-kernel weight, and grain yield were recorded for each plot. Grain yield (kg ha−1) was determined after harvesting of plots by Hege 140 plot combine. Some grain quality parameters such as protein, wet gluten, starch, test weight, and Zeleny sedimentation of both genotypes were determined indirectly using NIT System Infratec 1241 Grain Analyzer (Foss, Hillerod, Denmark).
Minolta 502 SPAD chlorophyll meter was used to determine the leaf chlorophyll contents at heading stage. The NDVI was measured using a portable N tech “Trimple Greenseeker” NDVI meter at three different stages (heading, anthesis and milky stages). Measurements were taken horizontally across the plot for at least 5 s to see the middle row in the plot to avoid border effects. NDVI and SPAD readings were taken from 11:00 h to 14:00 h at still environment (without wind) under stable and clear sky to prevent data fluctuation in leaf and within canopy.

2.6. Data Analysis

The data obtained from all investigated traits were subjected to ANOVA using JMP 10 package program. All data were analyzed according to randomized split plot design. The differences among nitrogen levels and genotypes were tested by the Least Significant Differences (LSD) method at 5% probability level to determine their significance.

3. Results and Discussion

3.1. Effects of N Fertilization on SPAD and NDVI Values

Nitrogen fertilization levels significantly influenced the NDVI and SPAD values of durum wheat, except for NDVI at milky stages (NDVI-M) in the first year (Table 2). Overall, better results were observed for 150 and 200 N kg ha−1 treatments. The tested cultivars showed significant differences in SPAD values during both years, and NDVI-M in the first year (Table 3). The highest values of NDVI were in 150 N kg ha−1, while 50 N kg ha−1 recorded the minimum values of NDVI-H during first season and NDVI-M during both seasons and control treatment gave the least values of NDVI-A during both seasons (Table 2). The genotype “Sena” produced higher SPAD during both years, whereas “Svevo” produced higher NDVI-M in the first year. Furthermore, N rates x cultivar interaction effect was not significant for SPAD and NDVI of durum wheat (Table 3).
In the second year of the study, inadequate precipitation during the heading stage triggered a decrease in leaf chlorophyll resulting lower NDVI and SPAD values. Similar to our findings, decreased NDVI values to 0.3 units and decreased absorption rates of photosynthetically active radiation during the grain filling stage under drought stress have been previously reported [35]. The NDVI score reached up to 0.4 units, showing the robust crop canopy as greenleaves under optimal environments led to higher vegetative growth as well as dry matter accumulation [36]. The relationship between the biomass production and NDVI at the reproductive stage has been reported but with less details at the early growth stages of the crop. The progression of the NDVI score showed improved values at before grain filling initiation and the maximum NDVI at milky-grain stage and then decreased with progression to maturity [37]. Biomass and grain production have been closely related to each other. Bands of low N and low chlorophyll have higher reflection in the visible electromagnetic spectrum region (400–700 nm), and a lower reflectance in the near-infrared region, resulting a decreased NDVI values [18,38].

3.2. Effects of N Fertilization on the Growth, Grain Yield and Yield

Due to N fertilization, spikelets per spike (SS), thousand kernel weight (TKW), test weight (TW) and grain yield (GY) showed a significant difference in the first year, whereas only the plant height (PH) and TW exhibited a significant change in the second year (Table 4 and Table 5). Interaction of cultivar and N treatment had no significant effect on durum wheat growth and yield characteristics except TKW in the first year (Table 6 and Table 7).
The high TWK and TW in the control during the first year may be due to the low SS, SL and KNS. In addition, the low number of spikes per square meter in the control may have caused a decrease in the total number of grains by affecting the decrease in yield and caused an increase in TWK and TW.
The results revealed that genotype “Svevo” produced taller plant during both years, whereas “Sena” produced the longer spikes and greater spikelets per spike in the first year. During both years, the highest thousand kernel weight and test weight values were registered for 50 kg N ha−1. N applications substantially increased the grain yield in the first year. However, the grain yield increased along with the increase of N application up to 100 kg N ha−1, and thereafter yield declined with increasing N doses for both cultivars. The highest grain yield (4121 kg ha−1) was recorded by 100 kg N ha−1 treatment while other treatments remained suboptimal during both seasons. This might be due to more N application caused more vegetative growth (more succulent leaves and taller stems), which delayed the reproductive growth and ultimately led to suboptimal reproductive yield attributes. However, this trend was not significant in the second year. In earlier study, Wysocki et al. [39] concluded that N supplement increased the protein content cells, and increased the size of the plant cell which led to higher photosynthesis rate and ultimately taller plants were witnessed. Nourmohammadi et al. [40] indicated that more N absorption in the plants caused high spike production per unit area, enhanced vegetative growth and tiller improvement. The application of N fertilizer in higher doses decreased the chance of grain development deteriorating number of spikes leading to lower grain yield [41]. The suboptimally higher doses of N rate (240 kg ha−1) influenced reproductive yield characteristics adversely, resulting in decline of grain yield. When 240 kg N ha−1 was applied over vegetative growth stages, the maximum grain yield was achieved compared to other higher N doses [29]. Similarly, N doses of 240–360 kg ha−1 had no significant impact on yield attributes and grain yield indicating the need of N dose optimization as per genetic potential of the specific cultivars [42]. Belete et al. [43] reported that N use efficiency was decreased with the increasing rate of N beyond 120 kg ha−1, and it was suggested that different genotypes responded differently to varying levels of N fertilizers. Moreover, N fertilization levels influenced tillering and grain filling capacity of wheat genotypes under semi-arid climate [29]. The doses of N fertilizer significantly increased the N use efficiency, agronomic and physiological efficiency in wheat [44] showing overall impacts on the growth, yield and yeild attributed characteristics.

3.3. Effects of N Fertilization on the Quality Traits of Durum Wheat

All the quality characteristics of durum wheat were greatly influenced by the N application rate in both years (Table 8). Increased protein content due to increased doses of N can result from the accumulation of excess N in the grain. The lowest grain protein content was estimated in control plot with no N fertilization, which might be due to the less N present in soil and thereby less N take by the grain. A similar pattern observed in the second year (Table 8). The highest wet gluten and Zeleny sedimentation were obtained in 200 N kg ha−1 treatment, while the highest starch content was obtained in 50 N kg ha−1 treatment in both years (Table 8). With respect to quality characteristics, there was no major interaction between the cultivar and the N application rate except for wet gluten and Zeleny sedimentation in the first year (Table 9). Nitrogen application improved wheat grain yield with higher carbohydrate contents in high yielding wheat cultivars while quality characteristics such as grain minerals, gluten fractions, and polyphenols were recorded in low yielding cultivars [45] showing genotype dependent quality characteristics.
In this experiment, the wheat protein content increased with the rise in N rates from 50–200 kg N ha−1 which might be attributed to higher accumulation of dry matter and amino acids, which led to the increment of protein content. Our findings are consistent with the results of Zhang et al. [46], who reported that adequate application of N significantly increased the protein content in winter wheat and also inferred that grain protein content was dependent on the genotype. However, N application rates with environmental considisions such as access to water and temperature occurring primarily at grain filling period have also been described as pivotal factors for boosting quality of wheat [47,48]. In the current study, the seed gluten followed a similar development as of protein content (Table 8), showing all N levels significantly improved the seed gluten content in wheat. Thus, application of N is vital in improving the seed quality parameters of wheat. The protein structure of wheat grain is influenced by the genotypes and plays a key role in quality characteristics of bakery products [49]. Previous research has shown that the late application of N improves the grain protein content in wheat [50]. Thus, it is obvious that N application at late season can efficiently boost the seed quality.

3.4. Correlation Analyses

The positive and useful relationship between the SPAD values at the heading time and the properties of PH, SL, SS, KNS, GY and SC has been found (Table 10). While determining a positive and significant relationship between the NDVI, which was measured at the heading period, with PH, SL, SS, KNS, TWK, GY, SC features, a significant negative relationship was determined between the PC and ZS. Positive and significant relationship was found between NDVI, which was measured at the anthesis period, with PH, SL, SS, KNS, GY, SC features. A positive and significant relationship was determined between the TWK and NDVI-M.

4. Conclusions

Our findings are in line with the postulated hypothesis and objectives pertaining to optimization of N doses and screening most promising wheat genotype were adequately achieved. It is inferred that management of the N application offers the possibility of improving wheat production and grain nutritional quality. Our findings also indicated that the highest grain production could be achieved with the application of N up to 100 kg ha−1, and other levels of N were not economically viable and environmentally friendly as N can be easily lost by leaching and evaporation leading to environmental pollution. In the first year of this study, the dose of N applied at once increased the yield and quality of the grain due to sufficient rainfall inferring importance of environmental interaction with these indices. The results obtained for all N doses indicate that the healthy canopy growth and high yield, which are correlated with the spectral reflection indices used in the analysis. There has been a clear association between the SPAD and NDVI with the grain yield and agronomic traits, suggesting that these indices can be used in the identification of plant N deficiency, and the selection of superior wheat genotypes through the breeding process. The research was conducted at a specific region and prior to making final decisions, it should be carried out in a multilocation trial for final recommendation.

Author Contributions

Conceptualization, F.K., M.Y.; methodology, F.K., M.Y.; software, F.K., M.Y., A.E.S.; validation, F.K., M.Y., A.E.S.; formal analysis, F.K., M.Y.; investigation, F.K., M.Y.; data curation, F.K., M.Y. and A.S.E.; writing—original draft preparation, F.K., M.Y., A.E.E.,; writing—review and editing, M.S.I., D.R., M.A.I., A.E.S., and funding acquisition, F.K., M.Y., A.E.S. All authors have read and agreed to the published version of the manuscript.

Funding

This research was financially supported by the Sirnak University Research Project Council (Grant Number: 2017.04.09.01).

Institutional Review Board Statement

Not applicable.

Informed Consent Statement

Not applicable.

Conflicts of Interest

The authors declare no conflict of interest. The funders had no role in the design of the study; in the collection, analyses, or interpretation of data; in the writing of the manuscript, or in the decision to publish the results.

References

  1. Gilland, B. World population and food supply: Can food production keep pace with population growth in the next half-century? Food Policy 2002, 27, 47–63. [Google Scholar] [CrossRef]
  2. Ray, D.K.; Mueller, N.D.; West, P.C.; Foley, J.A. Yield trends are insufficient to double global crop production by 2050. PLoS ONE 2013, 8, e66428. [Google Scholar] [CrossRef] [PubMed] [Green Version]
  3. Iqbal, M.A.; Junaid, R.; Wajid, N.; Sabry, H.; Yassir, K.; Ayman, S. Rainfed winter wheat cultivars respond differently to integrated fertilization in Azad Kashmir, Pakistan. Fres. Environ. Bullet. 2021, 30, 3115–3121. [Google Scholar]
  4. Borlaug, N.E.; Dowswell, C.R. The acid lands: One of agriculture’s last frontiers. In Plant-Soil Interactions at Low pH; Brazilian Soil Science Society: Rio de Janeiro, Brazil, 1997; pp. 5–15. [Google Scholar]
  5. Tilman, D.; Balzer, C.; Hill, J.; Befort, B.L. Global food demand and the sustainable intensification of agriculture. Proc. Natl. Acad. Sci. USA 2011, 108, 20260–20264. [Google Scholar] [CrossRef] [PubMed] [Green Version]
  6. Siddiqui, M.H.; Iqbal, M.A.; Naeem, W.; Hussain, I.; Abdul, K. Bio-economic viability of rainfed wheat (Triticum aestivum L.) cultivars under integrated fertilization regimes in Pakistan. Custos Agronegocio 2019, 15, 81–96. [Google Scholar]
  7. World Atlas. What Are the World’s Most Important Staple Foods? Published on 7 June 2019. Available online: https://www.worldatlas.com/articles/most-important-staple-foods-in-the-world.html (accessed on 2 March 2021).
  8. Kizilgeci, F.; Albayrak, O.; Yildirim, M. Evaluation of thirteen durum wheat (Triticium durum Desf.) genotypes suitable for multiple environments using GGE biplot analysis. Fresenius Environ. Bull. 2019, 28, 6873–6882. [Google Scholar]
  9. Asseng, S.; Martre, P.; Maiorano, A.; Rötter, R.P.; O’Leary, G.J.; Fitzgerald, G.; Girousse, C.; Motzo, R.; Giunta, F.; Babar, M.A.; et al. Climate change impact and adaptation for wheat protein. Glob. Chang. Biol. 2019, 25, 155–173. [Google Scholar] [CrossRef] [Green Version]
  10. Lu, C.; Tian, H. Global nitrogen and phosphorus fertilizer use for agriculture production in the past half century: Shifted hot spots and nutrient imbalance. Earth Syst. Sci. Data 2017, 9, 181–192. [Google Scholar] [CrossRef] [Green Version]
  11. Yildirim, M.; Yakut, Z.; Akinci, C.; Kurt, F.; Kizilgeci, F. Nitrogen rate and timing implementation on durum wheat in a bed planting system. Sains Malays. 2016, 45, 221–228. [Google Scholar]
  12. Kizilgeçi, F.; Yildirim, M.; Akinci, C. Nitrogen Use Efficiency (NUE) Changes in durum wheat parents and their F2 progenies under different nitrogen conditions. J. Agric. Fac. Gaziosmanpasa Univ. 2016, 33, 96–102. [Google Scholar] [CrossRef]
  13. Iqbal, M.A.; Imtiaz, H.; Muzammil, H.S.; Essa, A.; Zahoor, A. Probing profitability of irrigated and rainfed bread wheat (Triticum aestivum L.) crops under foliage applied sorghum and moringa extracts in Pakistan. Custos Agronegocio 2018, 14, 2–16. [Google Scholar]
  14. Kizilgeci, F.; Akinci, C.; Yildirim, M. Improving grain yield, protein ratio and nitrogen use efficiency of durum wheat (Triticum durum Desf.) hybrids using spad meter as a selection criterion. Int. J. Agric. Environ. Food Sci. 2019, 3, 112–120. [Google Scholar] [CrossRef] [Green Version]
  15. Ladha, J.K.; Tirol-Padre, A.; Reddy, C.K.; Cassman, K.G.; Verma, S.; Powlson, D.S.; Pathak, H. Global nitrogen budgets in cereals: A 50-year assessment for maize, rice and wheat production systems. Sci. Rep. 2016, 6, 1–9. [Google Scholar] [CrossRef] [Green Version]
  16. Karimpour, M.; Siosemardeh, A.; Fateh, H.; Badakhshan, H.; Heidari, G. Effect of nitrogen fertilizer on yield and some physiological charachteristics on two drought resistance and susceptible wheat (Triticum aestivum L.) cultivars in response to water stress. Int. J. Farm. Alli. Sci. 2013, 2, 311–324. [Google Scholar]
  17. Mantai, R.D.; da Silva, J.A.G.; Arenhardt, E.G.; Sausen, A.T.Z.R.; Binello, M.O.; Bianchi, V.; Rodrigues da Silva, D.; Bandeira, L.M. The dynamics of relation oat panicle with grain yield by nitrogen. Am. J. Plant Sci. 2016, 7, 17. [Google Scholar] [CrossRef] [Green Version]
  18. Vian, A.L.; Bredemeier, C.; Turra, M.A.; Giordano, C.P.D.S.; Fochesatto, E.; Silva, J.A.D.; Drum, M.A. Nitrogen management in wheat based on the normalized difference vegetation index (NDVI). Ciência Rural 2018, 48, 9. [Google Scholar] [CrossRef]
  19. Gitelson, A.A.; Gritz, Y.; Merzlyak, M.N. Relationships between leaf chlorophyll content and spectral reflectance and algorithms for non-destructive chlorophyll assessment in higher plant leaves. J. Plant Physiol. 2003, 160, 271–282. [Google Scholar] [CrossRef]
  20. Qi, H.; Zhu, B.; Kong, L.; Yang, W.; Zou, J.; Lan, Y.; Zhang, L. Hyperspectral Inversion Model of Chlorophyll Content in Peanut Leaves. Appl. Sci. 2020, 10, 2259. [Google Scholar] [CrossRef] [Green Version]
  21. Lee, Y.J.; Yang, C.M.; Chang, K.W.; Shen, Y. A simple spectral index using reflectance of 735 nm to assess nitrogen status of rice canopy. Agron. J. 2008, 100, 205–212. [Google Scholar] [CrossRef]
  22. Mkhabela, M.S.; Mkhabela, M.S. Exploring the possibilities of using noaa, vhrr data to forecast cotton yield in swaziland. UNISWA J. Agric. 2000, 9, 13–21. [Google Scholar] [CrossRef]
  23. Freeman, K.W.; Raun, W.R.; Johnson, G.V.; Mullen, R.W.; Stone, M.L.; Solie, J.B. Late-season prediction of wheat grain yield and grain protein. Commun. Soil Sci. Plant Anal. 2003, 34, 1837–1852. [Google Scholar] [CrossRef]
  24. Wall, L.; Larocque, D.; Léger, P.M. The early explanatory power of NDVI in crop yield modelling. Int. J. Remote Sens. 2008, 29, 2211–2225. [Google Scholar] [CrossRef]
  25. Sharma, L.K.; Bu, H.; Denton, A.; Franzen, D.W. Active-optical sensors using red NDVI compared to red edge NDVI for prediction of corn grain yield in North Dakota, USA. Sensors 2015, 15, 27832–27853. [Google Scholar] [CrossRef] [PubMed]
  26. Kizilgeci, F.; Yildirim, M. The relationship of some physiological traits measured at heading stage with yield and quality properties of durum wheat. Turk. J. Agric. Nat. Sci. 2019, 6, 777–785. [Google Scholar]
  27. Liu, H.Q.; Huete, A.A. feedback based modification of the NDVI to minimize canopy background and atmospheric noise. IEEE Trans. Geosci. Remote Sens. 1995, 33, 457–465. [Google Scholar] [CrossRef]
  28. López-Bellido, L.; López-Bellido, R.J.; Castillo, J.E.; López-Bellido, F.J. Effects of long-term tillage, crop rotation and nitrogen fertilization on bread-making quality of hard red spring wheat. Field Crop. Res. 2001, 72, 197–210. [Google Scholar] [CrossRef]
  29. Abedi, T.; Alemzadeh, A.; Kazemeini, S.A. Wheat yield and grain protein response to nitrogen amount and timing. Aust. J. Crop Sci. 2011, 5, 330–336. [Google Scholar]
  30. Karki, T.B. Yield prediction and nitrogen recommendation in maize using normalized difference vegetation index. Agron. J. Nepal 2013, 3, 82–88. [Google Scholar] [CrossRef] [Green Version]
  31. Rambo, L.; Ma, B.L.; Xiong, Y.; Regis Ferreira da Silvia, P. Leaf and canopy optical characteristics as crop-N-status indicators for field nitrogen management in corn. J. Plant Nutr. Soil Sci. 2010, 173, 434–443. [Google Scholar] [CrossRef]
  32. Inman, D.; Khosla, R.; Reich, R.; Westfall, D.G. Normalized difference vegetation index and soil color-based management zones in irrigated maize. Agron. J. 2008, 100, 60–66. [Google Scholar] [CrossRef]
  33. Singh, B.; Singh, Y.; Ladha, J.K.; Bronson, K.F.; Balasubramanian, V.; Singh, J.; Khind, C.S. Chlorophyll meter–and leaf color chart–based nitrogen management for rice and wheat in Northwestern India. Agron. J. 2002, 94, 821–829. [Google Scholar] [CrossRef]
  34. Akhter, M.M.; Hossain, A.; Timsina, J.; Teixeira da Silva, J.A.; Islam, M.S. Chlorophyll meter-a decision-making tool for nitrogen application in wheat under light soils. Int. J. Plant Prod. 2016, 10, 289–302. [Google Scholar]
  35. Gamon, J.A.; Field, C.B.; Goulden, M.L.; Griffin, K.L.; Hartley, A.E.; Joel, G.; Peñuelas, J.; Valentini, R. Relationships between NDVI, canopy structure, and photosynthesis in three Californian vegetation types. Ecol. Appl. 1995, 5, 28–41. [Google Scholar] [CrossRef] [Green Version]
  36. Fernandez, S.; Vidal, D.; Simon, E.; Sole-Sugranes, L. Radiometric characteristics of Triticum aestivum cv, Astral under water and nitrogen stress. Int. J. Remote Sens. 1994, 15, 1867–1884. [Google Scholar] [CrossRef]
  37. Babar, M.A.; Reynolds, M.P.; Van Ginkel, M.; Klatt, A.R.; Raun, W.R.; Stone, M.L. Spectral reflectance to estimate genetic variation for in season biomass, leaf chlorophyll, and canopy temperature in wheat. Crop Sci. 2006, 46, 1046–1057. [Google Scholar] [CrossRef]
  38. Diacono, M.; Rubino, P.; Montemurro, F. Precision nitrogen management of wheat. A review. Agron. Sustain. Dev. 2013, 33, 219–241. [Google Scholar] [CrossRef]
  39. Wysocki, D.J.; Corp, M.; Horneck, D.A.; Lutcher, L.K. Irrigated and Dryland Canola. Nutrient Management Guide; Published EM 8943-E; Oregon State University Extension: Corvallis, OR, USA, 2007. [Google Scholar]
  40. Nourmohammadi, G.H.; Siadat, A.; Kashani, A. Cereal Crops, Ninth Printing; Chamran University Press: Ahvaz, Iran, 2010; p. 48. [Google Scholar]
  41. Sieling, K. Growth stage specific application of slurry and mineral N to oilseed rape, wheat and barley. J. Agric. Sci. 2005, 142, 495–502. [Google Scholar] [CrossRef] [Green Version]
  42. Marino, S.; Tognetti, R.; Alvino, A. Crop yield and grain quality of emmer populations grown in central Italy, as affected by nitrogen fertilization. Eur. J. Agron. 2009, 31, 233–240. [Google Scholar] [CrossRef]
  43. Belete, F.; Dechassa, N.; Molla, A.; Tana, T. Effect of nitrogen fertilizer rates on grain yield and nitrogen uptake and use efficiency of bread wheat (Triticum aestivum L.) varieties on the Vertisols of central highlands of Ethiopia. Agric. Food Secur. 2018, 7, 78. [Google Scholar] [CrossRef]
  44. Tabak, M.; Lepiarczyk, A.; Filipek-Mazur, B.; Aneta Lisowska, A. Efficiency of Nitrogen Fertilization ofWinter Wheat Depending on Sulfur Fertilization. Agronomy 2020, 10, 1304. [Google Scholar] [CrossRef]
  45. Mariem, S.B.; González-Torralba, J.; Concha, C.; Iker Aranjuelo, I.; Fermín Morales, F. Durum Wheat Grain Yield and Quality under Low and High Nitrogen Conditions: Insights into Natural Variation in Low- and High-Yielding Genotypes. Plants 2020, 9, 1636. [Google Scholar] [CrossRef]
  46. Zhang, P.; Ma, G.; Wang, C.; Lu, H.; Li, S.; Xie, Y.; Ma, D.; Zhu, Y.; Guo, T. Effect of irrigation and nitrogen application on grain amino acid composition and protein quality in winter wheat. PLoS ONE 2017, 12, e0178494. [Google Scholar] [CrossRef]
  47. Tea, I.; Genter, T.; Naulet, N.; Boyer, V.; Lummerzheim, M.; Kleiber, D. Effect of foliar sulfur and nitrogen fertilization on wheat storage protein composition and dough mixing properties. Cereal Chem. 2004, 81, 759–766. [Google Scholar] [CrossRef]
  48. Colecchia, S.A.; Basso, B.; Cammarano, D.; Gallo, A.; Mastrangelo, A.M.; Pontieri, P.; Del Giudice, L.; Pignone, D.; De Vita, P. On the relationship between N management and grain protein content in six durum wheat cultivars in Mediterranean environment. J. Plant Interact. 2013, 8, 271–279. [Google Scholar] [CrossRef]
  49. Kizilgeci, F. Physiological, agronomical and quality response of bread wheat to phosphorus application under dryland condition. Appl. Ecol. Environ. Res. 2019, 17, 1979–1987. [Google Scholar] [CrossRef]
  50. Weber, E.A.; Graeff, S.; Koller, W.D.; Hermann, W.; Merkt, N.; Claupein, W. Impact of nitrogen amount and timing on the potential of acrylamide formation in winter wheat (Triticum aestivum L.). Field Crop. Res. 2008, 106, 44–52. [Google Scholar] [CrossRef]
Figure 1. Meteorological variables during the wheat growing seasons during 2016–2017 and 2017–2018.
Sustainability 13 03725 g001
Table 1. Physical and chemical properties in rooting depth of experimental soils.
Depth (cm)Saturation (%)Soil TexturepHEC
(ds/m)
CaCO3 (%)Organic Matter Content (%)Total N Contents (kg ha−1)K2O
(kg ha−1)
P2O5
(kg ha−1)
0–2066Clayey7.50.11410.040.63111.9144020
20–4065Clayey7.60.12811.020.8178.3166012.6
Table 2. Significant interactions and means of SPAD and NDVI traits of durum wheat influenced by N rates in two years (2016–2017 to 2017–2018).
Rates of Nitrogen
(kg ha−1)
2016–20172017–2018
SPADNDVIHNDVI-ANDVI-MSPADNDVI-HNDVI-ANDVI-M
Control52.30.630.490.3844.90.480.360.30
5050.50.590.510.3349.00.510.450.34
10052.30.640.520.3350.10.490.420.33
15052.80.660.560.3450.90.590.490.38
20054.90.660.560.3450.80.560.470.35
CV (%)5.167.178.5121.245.5410.1910.4110.04
Prob. levels***ns******
LSD (5%)2.800.050.05ns2.790.080.040.03
* 5% level of significance; ** 1% level of significance; ns: not significant. SPAD (Chlorophyll content) NDVI-H: NDVI at heading stage, NDVI-A: NDVI at anthesis stage, NDVI-M: NDVI at milky stage, CV: coefficient of variation, LSD: least significant differences.
Table 3. Significant interactions and means of SPAD and NDVI traits of durum wheat as influenced by the interaction of cultivars and N rates in two years (2016–2017 to 2017–2018).
Rates of Nitrogen
(kg ha−1)
2016–20172017–2018
SPADNDVI-HNDVI-ANDVI-MSPADNDVI-HNDVI-ANDVI-M
G1G2G1G2G1G2G1G2G1G2G1G2G1G2G1G2
Control53.551.20.610.640.460.520.330.4346.143.80.470.500.370.370.280.31
5051.149.90.590.590.480.530.280.3850.048.00.510.500.430.470.340.35
10053.451.20.610.650.490.540.310.3550.449.90.440.540.410.430.310.35
15053.951.50.650.670.570.540.310.3752.449.30.580.600.490.480.360.39
20055.454.30.650.660.550.560.280.3952.349.20.600.530.500.440.360.34
Mean53.5 a51.6 b0.630.650.510.540.30 a0.38 b50.2 a48.0 b0.520.530.440.440.330.35
CV (%)4.926.578.1314.34.1210.1510.47.76
Prob. levelsnsnsnsnsnsnsnsns
LSD (5%)nsnsnsnsnsnsnsns
G1: “Sena”; G2: “Svevo”; NDVI-H: NDVI at the heading stage, NDVI-A: NDVI at anthesis stage, NDVI-M: NDVI at milky stage; ns: non-significant, CV: coefficient of variation, LSD: least significant differences. Between genotype means followed by the same letter are not significantly different.
Table 4. Significant interactions and means of growth and yield contributing traits of durum wheat influenced by N rates in two years (2016–2017 to 2017–2018).
Rates of Nitrogen
(kg ha−1)
2016–20172017–2018
PH (cm)SL (cm)SSKNSPH (cm)SL (cm)SSKNS
Control83.26.2416.840.545.65.0314.420.9
5083.76.3317.339.044.55.2514.319.1
10086.66.7217.641.046.15.4114.119.6
15084.96.5017.639.148.25.2814.717.5
20085.26.751841.247.75.3714.821.7
CV (%)3.716.624.2312.424.9210.734.7419.6
Prob. levelsnsns*ns*nsnsns
LSD (5%)nsns0.76ns2.35nsnsns
PH: plant height, SL: spike length, SS: spikelets per spike, KNS: kernel number per spike; * 5% level of significance; ** 1% level of significance; ns: not significant, CV: coefficient of variation, LSD: least significant differences.
Table 5. Significant interactions and means of thousand kernel weight (TKW), test weight (TW) and grain yield (GY) of durum wheat influenced by N rates in two years (2016–2017 to 2017–2018).
Rates of Nitrogen
(kg ha−1)
2016–20172017–2018
TKW(g)TW (kg)GY (kg/ha)TWK (g)TW (kg)GY (kg ha−1)
Control37.783.4339432.479.51891
5035.582.6374432.578.71642
10033.782.0412132.778.21739
15032.880.8391732.577.81758
20031.979.9374732.477.21830
CV (%)5.932.1214.114.970.79.64
Prob. levels******ns***ns
LSD (5%)2.101.7854.42ns0.57ns
* 5% level of significance; ** 1% level of significance; *** 0.1% level of significance. ns: not significant, CV: coefficient of variation, LSD: least significant differences.
Table 6. Significant interactions and means of growth and yield contributing traits of durum as influenced by cultivars and N rate interaction in two years (2016–2017 to 2017–2018).
Rates of Nitrogen
(kg ha−1)
2016–20172017–2018
PH (cm)SL (cm)SSKNSPH (cm)SL (cm)SSKNS
G1G2G1G2G1G2G1G2G1G2G1G2G1G2G1G2
Control77.389.06.75.817.416.341.539.442.248.95.15.014.114.720.721.1
5080.486.96.46.317.517.138.839.242.546.55.45.114.414.219.019.1
10082.990.26.86.717.817.442.839.143.448.75.95.014.313.918.620.5
15082.187.77.15.918.616.743.638.944.552.05.45.214.914.515.819.2
20084.286.37.06.518.317.734.643.544.451.05.65.215.014.520.423.0
Mean81.4 b88.0 a6.8 a6.2 b17.9 a17.0 b40.340.043.4 b49.4 a5.55.114.514.318.9 b20.6 a
CV (%)4.63 5.96 5 10.5 3.92 10.6 4.0 17.8
Prob. levelsns ns ns ns ns ns ns ns
LSD(5%)ns ns ns ns ns ns ns ns
G1—“Sena”; G2—"Svevo”; PH: plant height, SL: spike length, SS: spikelets per spike, KNS: kernel number per spike; ns: not significant. CV: coefficient of variation, LSD: least significant differences. Between genotype means followed by the same letter are not significantly different.
Table 7. Significant interactions and means of thousand kernel weight (TKW), test weight (TW) and grain yield (GY) of durum wheat grains influenced by cultivars and Cultivar × N Rate interaction.
Rates of Nitrogen
(kg ha−1)
2016–20172017–2018
TKW (g)TW (kg)GY (kg ha−1)TWK (g)TW (kg)GY (kg ha−1)
G1G2G1G2G1G2G1G2G1G2G1G2
Control35.240.283.383.53525326332.032.878.380.719291852
5034.136.983.282.03724376430.734.378.179.315371746
10033.434.181.582.54335390731.433.977.778.817111767
15031.134.680.081.64027380630.434.677.478.216241892
20030.932.879.780.14253324130.83476.777.817941865
Mean32.9 b35.7 a81.582.03972 a3596 b31.1 b34.0 a77.6 b79.0 a17201825
CV (%)6.72 2.46 15.6 3.7 1.0 9.3
Prob. levels* ns ns ns ns ns
LSD (5%)2.1 ns ns ns ns ns
* 5% level of significance. G1—"Sena”; G2—"Svevo”; ns: non-significant, CV: coefficient of variation, LSD: least significant differences. Between genotype means followed by the same letter are not significantly different.
Table 8. Significant interactions and means of quality traits of durum wheat influenced by N rates in two years (2016–2017 to 2017–2018).
Rates of Nitrogen.
(kg ha−1)
2016–20172017–2018
PC (%)SC (%)WG (%)ZS (mL)PC (%)SC (%)WG (%)ZS (mL)
Control13.063.028.743.116.660.640.959.1
5014.062.730.545.818.059.344.867.5
10015.262.332.149.718.358.646.469.4
15016.362.233.450.918.458.646.469.9
20017.162.034.151.218.758.347.170.8
CV (%)8.020.854.818.811.8711.442.213.45
Prob. levels***********************
LSD (5%)1.250.321.584.380.350.691.032.40
PC: protein content, SC: starch content, WG: wet gluten, ZS: Zeleny sedimentation; ** 1% level of significance; *** 0.1% level of significant, CV: coefficient of variation, LSD: least significant differences.
Table 9. Significant interactions and means of quality traits of durum wheat grains influenced by cultivars and N rate interaction in two years (2016–2017 to 2017–2018).
Rates of Nitrogen
(kg ha−1)
2016–20172017–2018
PC (%)SC (%)WG (%)ZS (mL)PC (%)SC (%)WG (%)ZS (mL)
G1G2G1G2G1G2G1G2G1G2G1G2G1G2G1G2
Control12.613.463.462.728.029.440.845.315.917.360.860.438.942.853.165.2
5013.015.063.262.329.331.741.949.816.919.060.058.741.847.861.873.2
10014.016.462.961.730.433.748.251.217.319.359.258.044.648.364.873.9
15016.016.762.561.933.533.351.150.717.519.458.558.844.548.365.674.1
20016.917.362.161.84.134.251.251.217.919.658.957.745.748.567.574.1
Mean14.515.762.8 a62.1 b31.132.546.649.617.1 b18.9 a59.5 a58.7 b43.1 b47.1 a62.6 b72.1 a
CV (%)5.50.043.655.691.712.421.020.1
Prob. levelsnsns**nsnsnsns
LSD (5%)nsns1.242.93nsnsnsns
* 5% level of significance. G1—“Sena”; G2—”Svevo”; PC: protein content, SC: starch content, WG: wet gluten, ZS: Zeleny sedimentation, ns: non-significant, CV: coefficient of variation, LSD: least significant differences. Between genotype means followed by the same letter are not significantly different.
Table 10. The correlation coefficient between SPAD at heading stage and NDVI at different growth stages with all investigated traits.
ParametersPHSLSSKNSTWKTWGYPCSCWGZS
SPAD0.497 ***0.461 ***0.486 ***0.463 ***0.0910.140.439 ***−0.1790.354 **−0.382 **−0.333 **
NDVI-H0.706 ***0.487 ***0.647 ***0.625 ***0.244 **0.3860.442 ***−0.230 **0.484 ***−0.514−0.405 **
NDVI-A0.611 ***0.538 ***0.648 ***0.559 ***0.0580.2070.313 **−0.1780.409 ***−0.421−0.362
NDVI-M0.1370.033−0.0950.0670.390 **0.1−0.0660.169−0.1040.0510.163
** 1% level of significance; *** 0.1% level of significant, PH: plant height, SL: spike length, SS: spikelets per spike, KNS: kernel number per spike, TKW: thousand kernel weight, TW: test weight, GY: grain yield, PC: protein content, SC: starch content, WG: wet gluten, ZS: Zeleny sedimentation.
Publisher’s Note: MDPI stays neutral with regard to jurisdictional claims in published maps and institutional affiliations.

