Article

HVDC Converter Cooling System with a Phase Change Dispersion

1
Competence Centre Thermal Energy Storage (TES), Lucerne University of Applied Sciences and Arts, 6048 Horw, Switzerland
2
Global Energy Interconnection Research Institute Europe GmbH, 10623 Berlin, Germany
3
School of Chemical Engineering, University of Birmingham, Birmingham B15 2TT, UK
*
Author to whom correspondence should be addressed.
Fluids 2021, 6(3), 117; https://doi.org/10.3390/fluids6030117
Submission received: 18 February 2021 / Revised: 5 March 2021 / Accepted: 6 March 2021 / Published: 12 March 2021
(This article belongs to the Special Issue Heat Transfer and Fluid Dynamics in Energy Systems)

Abstract

:
High voltage direct current converters require efficient cooling of thyristors via heat sinks. Currently, infrastructures use deionised water as a means of cooling the high voltage direct current converters; however, recent research has shown that other fluids have potential to offer more efficient cooling. Phase change dispersions are a new class of heat transfer fluids that employ the latent heat of phase change, thus offering isothermal cooling during melting. For cooling applications, the temperature increase during operation is thus lowered when using phase change dispersions (compared to water) and consequently, the heat sink and thyristors surface temperatures are reduced. In this investigation, a phase change dispersion with non-conductive components, high stability, high capacity and low viscosity has been developed and tested. An experimental setup of a real size heat sink has been installed and the heat transfer behaviour of both the formulated phase change dispersion and water have been investigated and a comparison has been presented. Using water as the heat transfer fluid, the temperature increase from inlet to outlet of the heat sink was 4 K and with the formulated phase change dispersion (at the same mass flow rate and heat input) the temperature increase was 2 K. The phase change dispersion caused a 50% reduction in the heat sink surface temperature. Furthermore, the global heat transfer coefficients obtained for the phase change dispersion were found to be independent of the heating input applied, unlike the trend found for water, additionally, the global heat transfer coefficients were found to be similar to those obtained for water at the same mass flow rates and reached a maximum value of 6100 W m 2 K 1 . Despite this, the pressure drops and viscosities obtained for the phase change dispersion were higher than for water. Overall, the current investigation demonstrates the ability of using a phase change dispersion as a cooling fluid for the cooling of electronic components, which thus far is limited to using air and water cooling and cannot reach the cooling capacity achieved by phase change dispersions.

1. Introduction

For the generation of electricity from renewable sources, such as wind and photovoltaics, two technical topics need to be addressed: the time shifted production and the consumption, which can be diurnal or seasonal [1]. This issue will be part of seasonal storages, Power-to-X and multi energy grid scenarios. The availability of renewables in secluded regions demands electrical energy to be transported over potentially thousands of kilometres. Future, long-distance electrical grids will use high voltage direct current (HVDC) transmission to minimise the energy losses as discussed by May et al. [2] and Nguyen and Saha [3]. Nguyen and Saha discuss the benefits of using HVDC, particularly at the power transfer level and as the interconnection length increases [3]. Usually, however, the production of renewable energies at remote locations, such as wind farms in the North Sea or in Northern China, is performed using alternating current (AC) and therefore thyristors and high voltages are required for the alternating current/direct current ACDC conversion [4]. On top of this, transformers are required for the high voltage, and the working of thyristor devices leads to a high heat generation rate and if the heat cannot be dissipated then the thyristor will accelerate ageing. As discussed by Bhandari et al. [5], the thermal management of thyristors is of the essence.
Oftentimes the cooling of sensitive components in power electronics is performed with air [6,7,8]; however, in cases that have higher heat loads to dissipate and smaller sized geometries, the cooling is generally done by liquids [9]. The intrinsic compactness, the reduced noise and the low power consumption has made liquid cooling the most suitable solution in a large number of cases [10]. Sparrow et al. [11] extensively studied the thermal management of electronic equipment using thermal fluids with cold plates. The authors found that a proper design of a compact cold plate is achieved by solving the combined problem of fluid flow, convective heat transfer and wall heat conduction [11]. The interaction of these three problems is solved in regards to the number of sequential fins in a periodic structure showing the heat transfer benefits of a periodically deviated flow [11]. The presence of fins and pore geometries, although beneficial for improving the cooling performances, present the draw back of being difficult and costly to manufacture (machining and brazing) and structural issues when the cold plate is clamped at high force in an array [11,12].
New cooling fluids, with enhanced heat densities, have also been proposed, but they might present difficulties on the design of a real implementation [12]. The Slatt-Buckley 500 kV line used a water/glycol mixture to cool the thyristor valves and the 500 kV line used in Fengtun, Northeast China Grid Co. Ltd., used a pure water cooling system with ethylene glycol mixed in to improve the cooling efficiency of the controller [13]. Whilst deionised water offers good heat dissipation and electrical insulation, its cooling ability relies on sensible heat storage, and thus large quantities of water are needed for effective cooling. Recently, the direction of two-phase fluids using the liquid-vapour phase change has been looked into for the cooling of electronics [14]. In the report by Darin et al. [14], different thermal management fluids for use in electrical component cooling are compared. Amongst the best are ethylene glycol, propylene glycol and water. Whilst water can exhibit the best cooling ability, the evaporation and boiling of water can render it unviable for many applications. An alternative class of heat transfer fluids, which have gained recent traction in cooling systems and use phase change materials incorporated into a base fluid, exploit the latent heat of phase change and thus offer high cooling capacities around a narrow temperature range [15,16,17,18]. These fluids are called phase change slurries (or phase change dispersions (PCD)) and to the author’s knowledge have not previously been used in the cooling of HVDC components. Despite this, over recent years, PCD have been extensively studied in terms of their heat transfer performance [19,20,21,22], rheological performance [23,24], thermophysical properties [25,26].
In this work, an investigation will be performed into the heat transfer and rheological performance of a PCD for application into the cooling of thyristor converter valves. The temperature level of the system is determined by the re-cooling system and therefore by the local climate conditions and in this experimental investigation, the application for operation in Southern China has been chosen. In Southern China, the summers are warm, and free cooling with ambient air, or with hybrid cooling systems, is performed at about 40 C. The temperature level of the converter valves is approximately 10 K higher than this, at approximately 50 C. The aim of this paper is to propose a large increment of the heat transfer in the cooling of a sensitive component of HVDC converters such as the thyristor, by proposing a new cooling fluid that can be implemented without any structural change of the cooling system. This cooling fluid consists of a PCD, which is discussed in [27]. In this investigation, the PCD’s heat transfer and rheological behaviour is compared to water, which is the current industrial standard for cooling such components, at different mass flow rates and electrical heating inputs.

2. Technical Requirements

2.1. Phase Change Dispersion Requirements

Currently, deionised water is the standard in the cooling of HVDC thyristors, and for it to be replaced with another HTF (e.g., PCD) the following requirements need to be fulfilled:
  • The PCD needs to be stable against phase separation. Generally, this is achieved through a good surfactant system and a small particle size.
  • The PCD needs to have a small degree of supercooling as the heat absorption within the heat sink needs to be considered. The heat needs to be removed from the system by the re-cooling system and supercooling would mean that the temperature difference within the re-cooling unit would decrease and consequently so would the cooling power. To reduce the degree of supercooling, nucleating agents need to be added to the PCD. The PCD used in this investigation had nucleating agents added to it and the supercooling degree was lowered to 2 K. For further details, see the discussion in [27].
  • Since the HVDC system operates at 800 kV it is required that the PCD has a low electrical conductivity of approximately 0.3 S cm 1 , this low electrical conductivity needs to be continually maintained through deionising. The PCD therefore needs to be compatible with ion exchange resins, meaning that there cannot be surface wetting of the resin surface by the organic PCM dispersed phase. Furthermore, no ionic surfactants and no electrically conductive PCM can be accepted.
  • From the PCD known in the literature, most use paraffin as the PCM dispersed phase due to existing know-how of the interactions between paraffin and classical surfactant systems. However, on the industrial-scale, paraffin show partial freezing out, which forms thin layers of the PCM on the surface of heat exchangers and piping. Additionally, removal, maintenance and cleaning of paraffin systems requires very strong solvents at high temperatures. Therefore, it is necessary for the PCM to be from another organic class other than paraffin. The PCD used in this investigation has two fatty acid esters as the PCM, as described in [27].
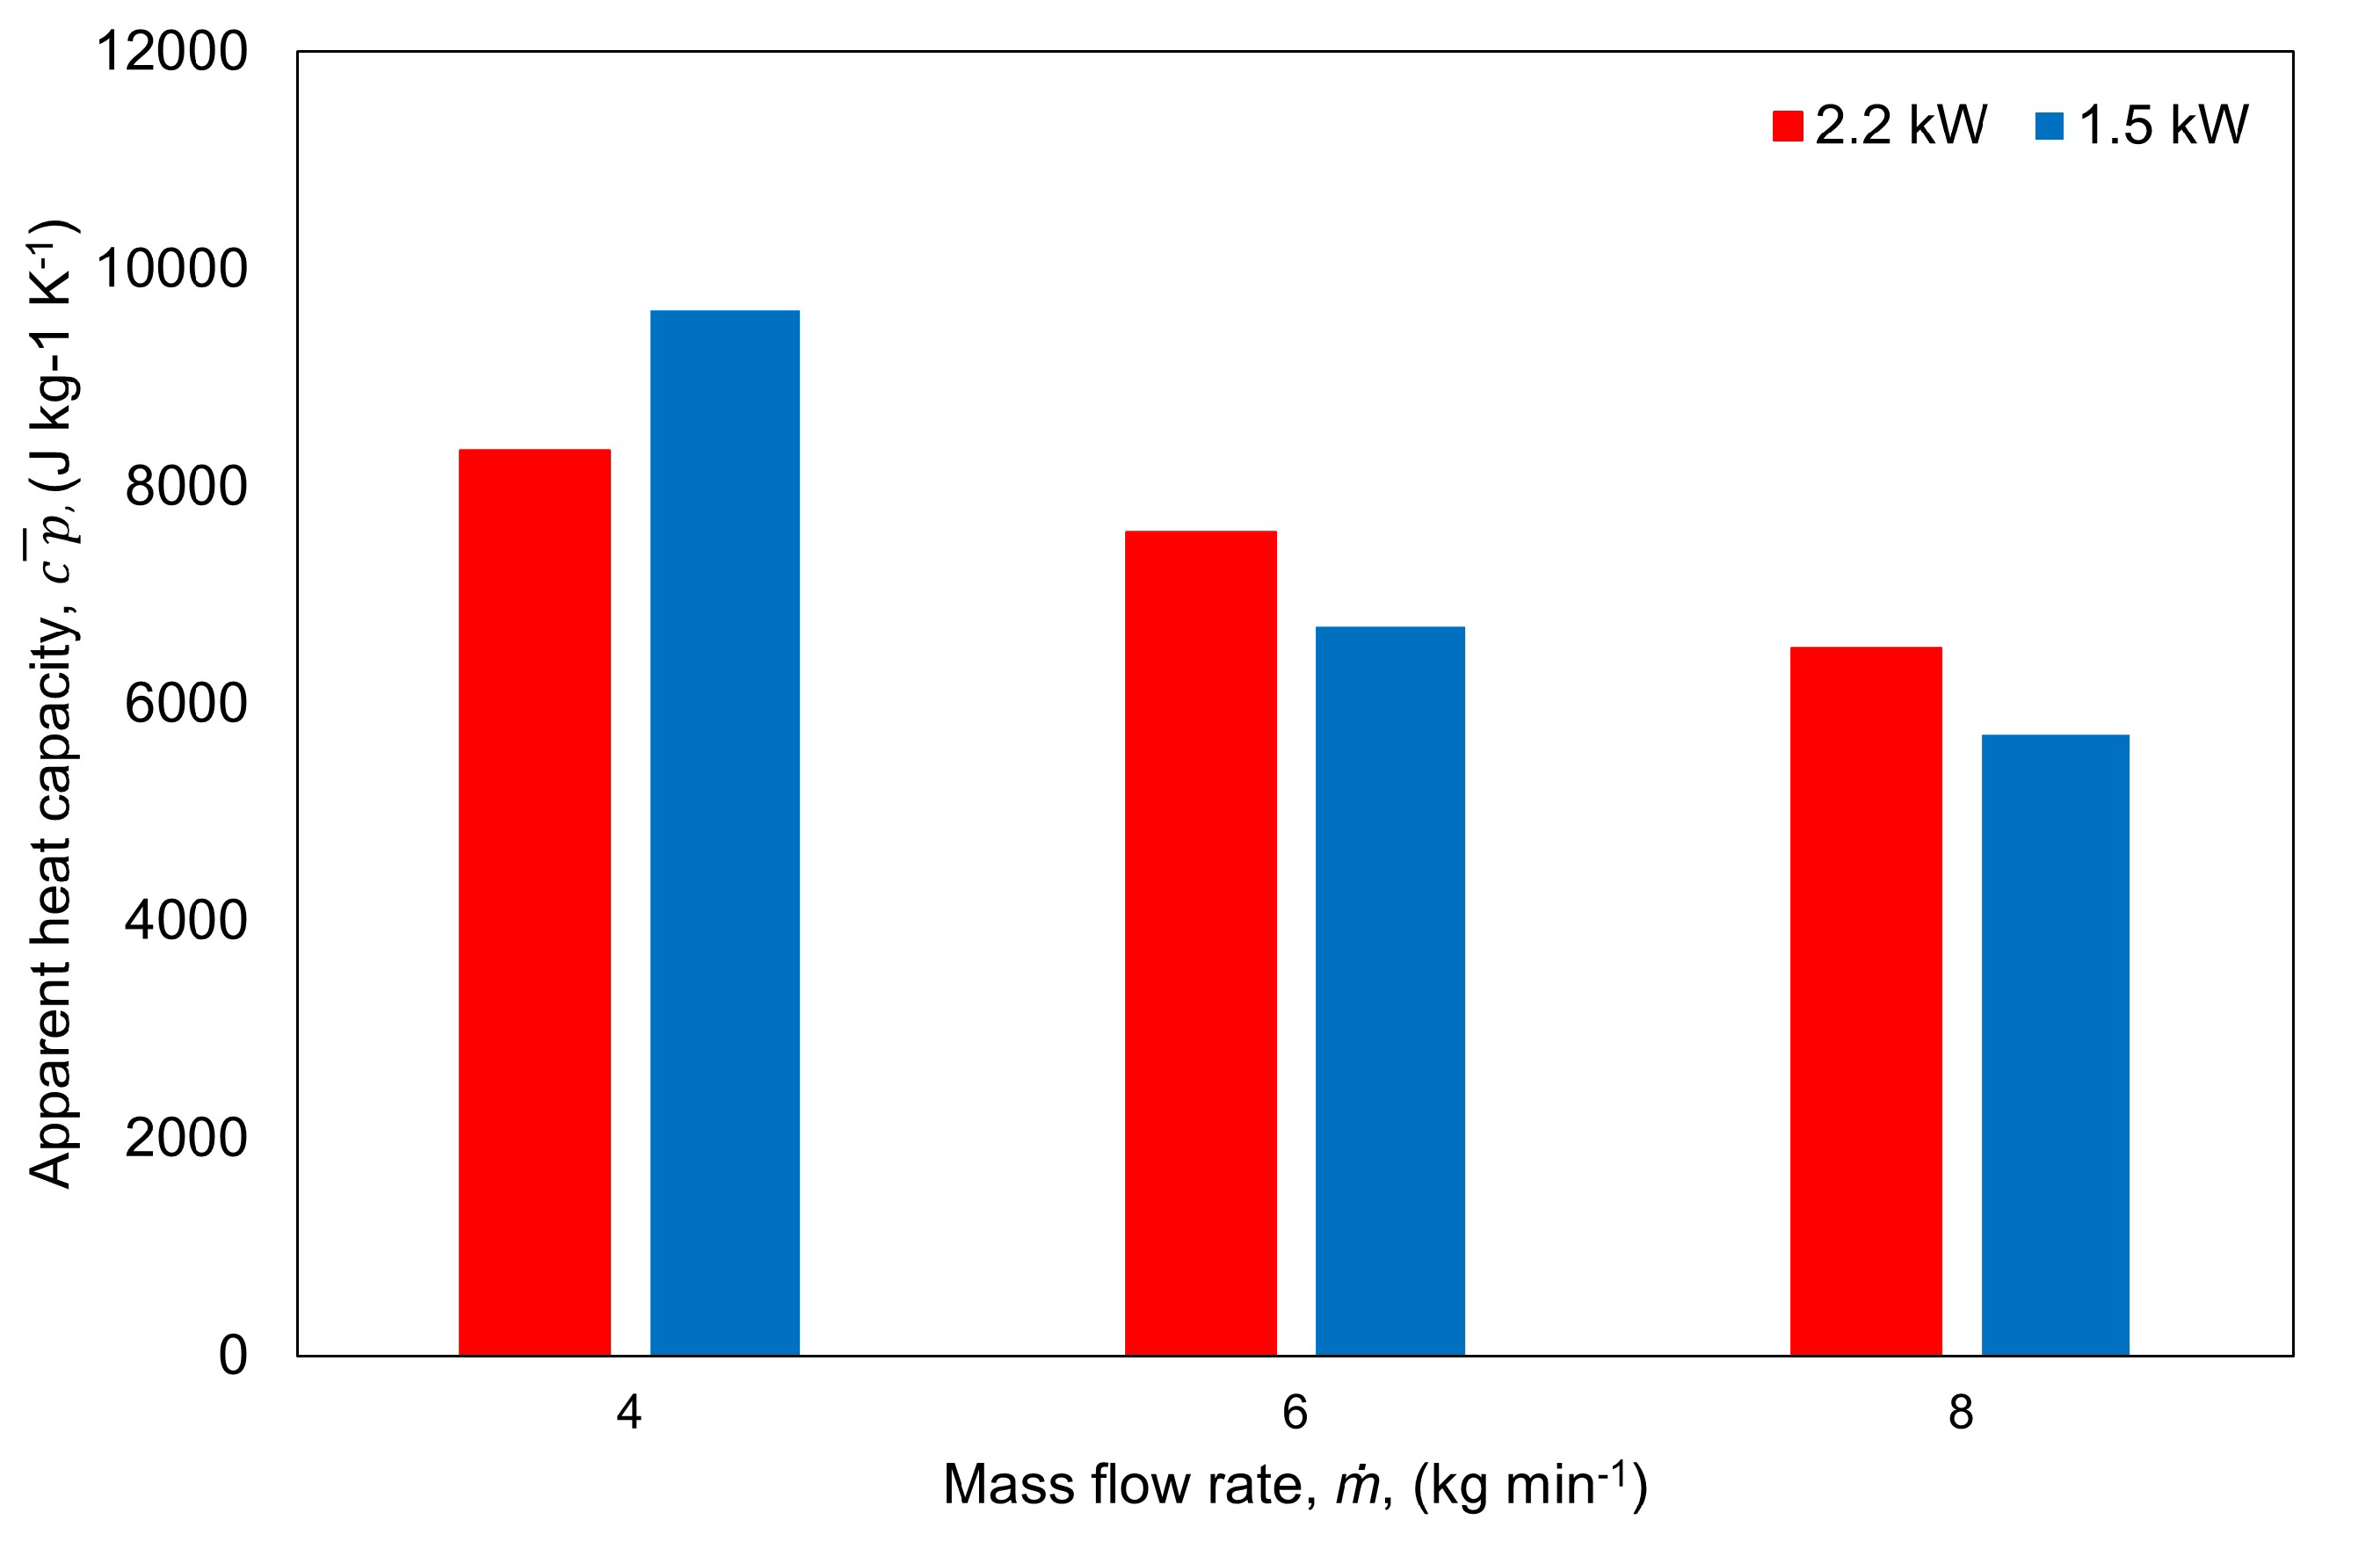
  • PCD are known for their high specific heat capacities within the desired melting range. In [28], it is shown that this may be up to a factor of two or three compared to water at the same pressure drop.
  • The PCD needs to have a low pressure drop and low viscosity to ensure that it is pumpable. However, low pressure drops (low viscosities) will make it technically unfeasible to make a PCD that can last for years in such a system (small particle sizes ensure greater stability, but also increases the viscosity). Therefore, a re-dispersing step will need to be inserted. This re-dispersion will occur when the PCD is flowing and ensure a small and narrow particle size is continuously achieved.
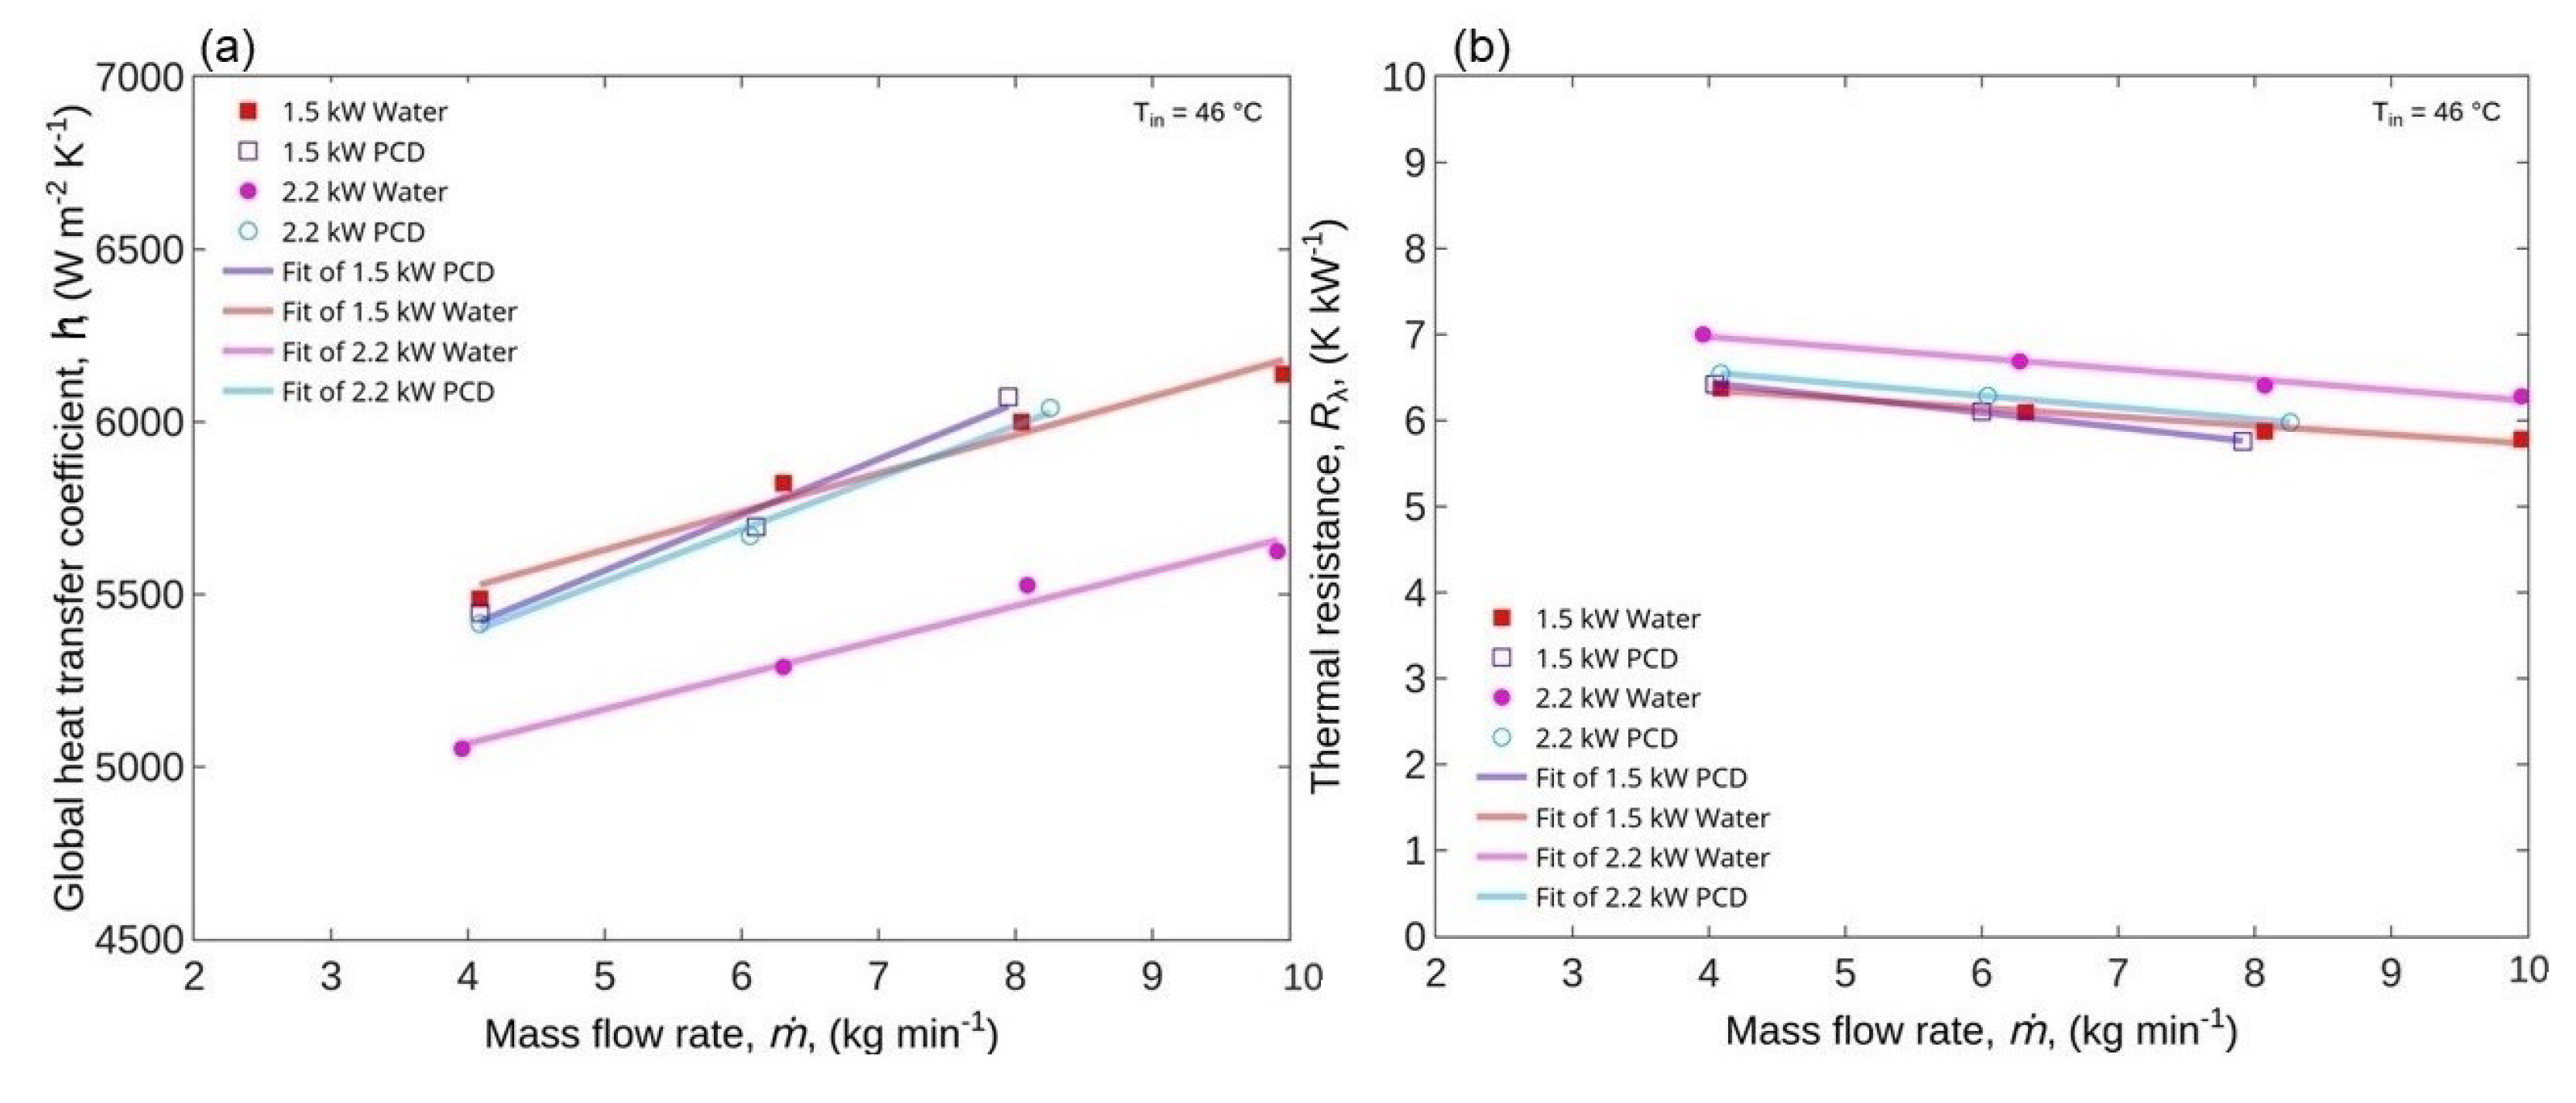
  • The global heat transfer coefficients (h) for the PCD should be at least the same as those for water under the same operational conditions.
    The requirements 1–5 were discussed in the first paper of the series [27] and this paper will focus on requirements 6 and 7; investigating the heat transfer behaviour and the pressure drop of the PCD in comparison to water.

2.2. Standard HVDC Cooling System Requirements

Large varieties of HVDC systems exist worldwide and some general assumptions need to be made for an experimental investigation. In this investigation, the authors have defined specific requirements for a set of two heat sinks in series, which are shown in Figure 1. Figure 1 shows a typical heat sink and thyristor stack with the inlet and outlet of the cooling fluid highlighted. Whilst the schematic in Figure 1 shows a stack of heat sinks and thyristors, for the experiments presented in this work, only one heat sink was considered, with a calculated temperature increase of 3.94 K with water at standard flow-rates, as shown in Table 1. In this investigation, different experimental conditions were conducted by variation of the mass flow rate and electrical power inputs to cover the desired total temperature range and the optimum range for the phase change of the PCM within the PCD. Table 1 shows the requirements in terms of typical operating conditions for a standard thyristor cooling system.

3. Materials and Methods

3.1. Phase Change Dispersion

The PCD used in this investigation is made from a 50:50 ratio of two fatty acid esters, Crodatherm-47 and Crodatherm-53, as the phase change material (PCM), dispersed into deionised water. The PCM mixture is stabilised in the water with the aid of ethoxylated fatty alcohols as emulsifiers. The formulation details and choosing of appropriate surfactants can be found in [27]. The measured thermophysical properties can be observed in Table 2.

3.2. Heat Sink Design

The investigated heat sink was produced from the company M e r s e n and an explosion model of the heat sink and heating blocks used as the measuring section in this investigation can be seen in Figure 2a, and a photograph can be seen in Figure 2b. Internally, the heat sink has a corrugated fin structure and the technical and geometrical data of the heat sink can be seen in Table 3, which shows the technical and geometrical data for the heat sink used in this experimental investigation.

3.3. Experimental Setup
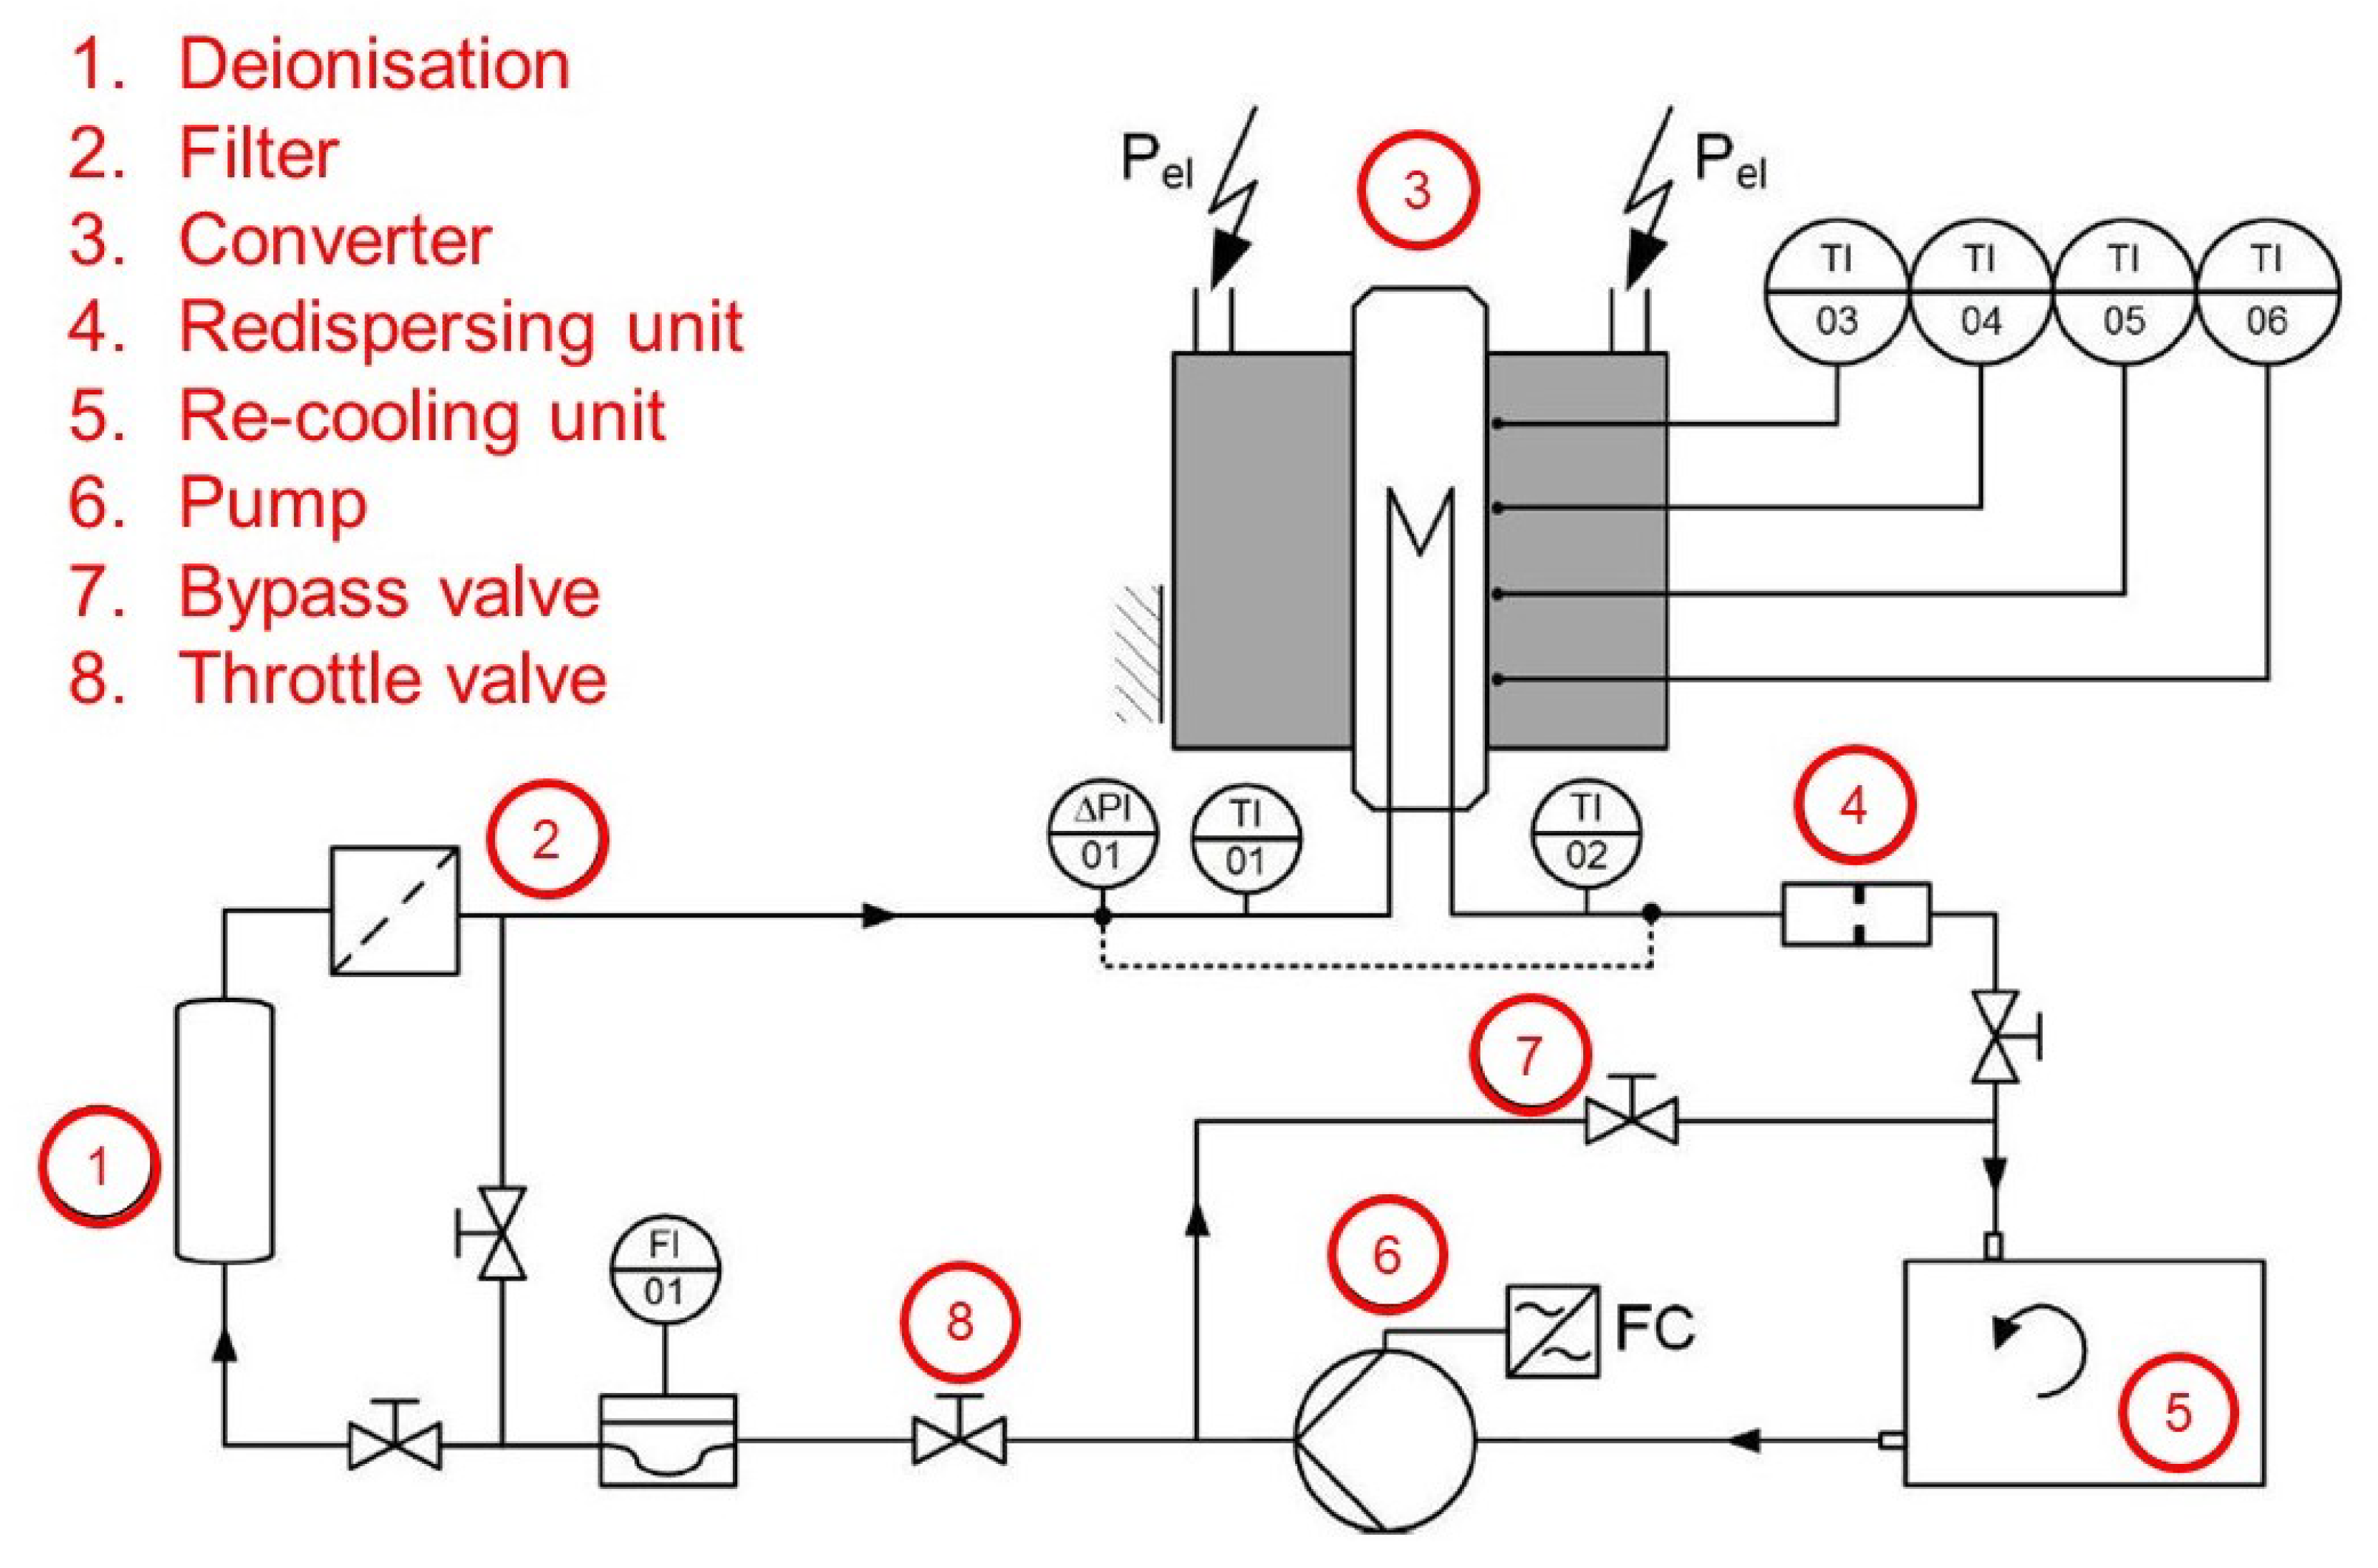
3.3.1. Test-Rig

To measure the heat transfer characteristics within the heat sink, electrical heating of the surface has been chosen. Figure 3 shows the schematic of the experimental setup. Figure 3 highlights the relative components used in this experimental investigation for measuring the heat transfer characteristics of the PCD cooling the converter valve and the necessary components to ensure the fluid is not electrically conductive (deionisation) and kept stable (re-dispersing unit). The overall goal of this project is to reduce the temperature within the thyristor. The specifications of the measuring section used in this investigation (the thyristor), including the geometrical data, are illustrated in Table 4. Therefore, temperature profiles close to the heat sink surface were measured within the heating block. A drawing of the heat sink with the two electrical heating blocks, including the framework, is shown in Figure 2. The heating blocks are made from copper. Electric heating cartridges (6 on each side) were installed to obtain the boundary condition of constant heat flux, similar to the real situation of a thyristor. One of the two blocks is equipped with 4 temperature sensors, PT100 to measure the temperature at 2.5 mm distance to the surface of the heat sink. The heat sink and heating block are attached by a strong framework and bolts are used. The clamping force was secured by a torque wrench and was 150 kN. The whole measuring section is thermally insulated with PIR shells (Swisspor) and with a thermal conductivity of 0.027 W m 1 K 1 at 273 K. The heat losses at conditions of 50 C were determined by energy balances to be lower than 20 W. All 12 heating cartridges are powered in parallel by one single-phase thyristor power controller, which allows a precise regulation of the heat input to copper blocks. An impeller pump (Zuwa, Type NIROSTAR/V 2000-B/PT) with a frequency converter as well as a bypass valve enables the fine control of the mass flow rate. The filter has a mesh size of 200 micron. The deionisation unit was filled with the resin Amberjet UP 6150 from Rohm and Haas.
Table 4. Specifications of the measuring section (heating block as shown in the picture in Figure 4) used in the experimental investigation.
Block materialCopper EN CW004A
Thermal conductivity @ 50 ( λ )390 W m 1 K 1
Diameter of the heat transfer area (d)135 mm
Thickness of the block (e)65 mm
Number of heating cartridges6 per side (12 in total)
Dimensions of heating cartridgesx = 10 mm L = 40 mm, 230 V
Maximum heating power (P e l , m a x )250 W per cartridge, 1.5 kW per side, 3 kW in total
Temperature sensor position from inlet ( 1 / L )0 = inlet, 0.07, 0.36, 0.64, 0.93 and 1 = outlet

3.3.2. Sensors and Data Acquisition

Detailed information of the used sensors are summarised in Table 5 and a schematic of the placement of the temperature sensors is illustrated in Figure 5. The fluid (T101 and T102) and wall temperatures (T103, T104, T105 and T106) were measured with PT100 four-wire sensors. The four wires are directly attached to the sensor and thus prevent any measurement error due to temperature variations. The mass flow of the pumped fluid was measured with a Coriolis flow meter (Type Promass F 83). The electrical heating power input was measured with thyristor power controller (JUMO, Type TYA-201). Temperatures, pressures and mass flow rate were recorded by NI 9216, module. The electrical power input was captured by the proprietary software of the power controller.

3.3.3. Quantities of Interest

The temperature difference between the inlet, T101 and the outlet, T102 allow for measurements with water to validate the energy balance of the system, to calculate the heat losses, and allow for the comparison of temperature increase along the flow when using PCD and water. The heat losses are calculated according to:
Q ˙ l o s s e s = P e l m ˙ c p ( T o u t T i n )
The temperatures T103, T104, T105 and T106 represent the wall temperatures within the heating block in the direction of the flow through the heat sink. The six heating cartridges and the high thermal conductivity of the copper ensured a good temperature distribution throughout the heat sink. The HTF (either water or PCD) has high radial mixing within the heat sink due to the corrugated arrangement of the webs, which act as thermal fins. To understand the temperature difference between the position of the sensors, T103 to T106 and the interface, an assumption of equal heat flux is helpful. For example, at a heating power of 1.1 kW (on each side), with an interface surface area of 0.0141 m 2 , the specific heat flux is, q ˙ = 78,000 W m 2 . The temperature difference, Δ T , between the measured position (T103 to T106) and to the interface on the heating block side T s can be calculated according to Equation (2):
Δ T = T T 103 / T 104 / T 105 / T 106 T s = q ˙ h λ
where s = 2.4 mm, λ = 390 W m 1 K 1 . This results in Δ T being 0.5 K, which is small enough that it is possible to detect the influence of position on temperature if there is one.
The heat flux depends on the driving temperature difference between the heat sink (centre) and the heat source (surface). It is defined as:
Q ˙ = h A Δ T m
where Δ T is calculated according to:
Δ T m = Δ T l n = Δ T a Δ T b l n Δ T a Δ T b
where Δ T a is the temperature difference between the heat sink and heating block surface at the inlet and Δ T b is the temperature difference between the heat sink and heating block surface at the outlet.
The thermal resistances were also calculated with varying mass flow rates and heating power inputs. The thermal resistance, R t h , is defined as:
R λ = Δ T l n Q ˙ = 1 h A
Finally, for analysing the rheological behaviour of the PCD in the geometry, the pressure drop was calculated according to:
Δ p = p i n p o u t

3.3.4. Experimental Procedure

All measurements are recorded at steady state conditions. To ensure the validity of PCD measurements, and for comparison, the setup was first tested with water at different mass flow rates and electrical power inputs. After that, the PCD measurements were conducted under the same conditions. For all experiments, the inlet temperature to the measurement section was kept around T101 = 46 C, which is slightly below the point where the PCM starts to melt. Each measurement is the average of 100 samples recorded at 1 Hz after steady state operation was reached.

4. Results and Discussion

4.1. Heat Losses

Since all experiments were performed at 50 C, the heat losses at 50 C were calculated to be less than 20 W according to Equation (3).

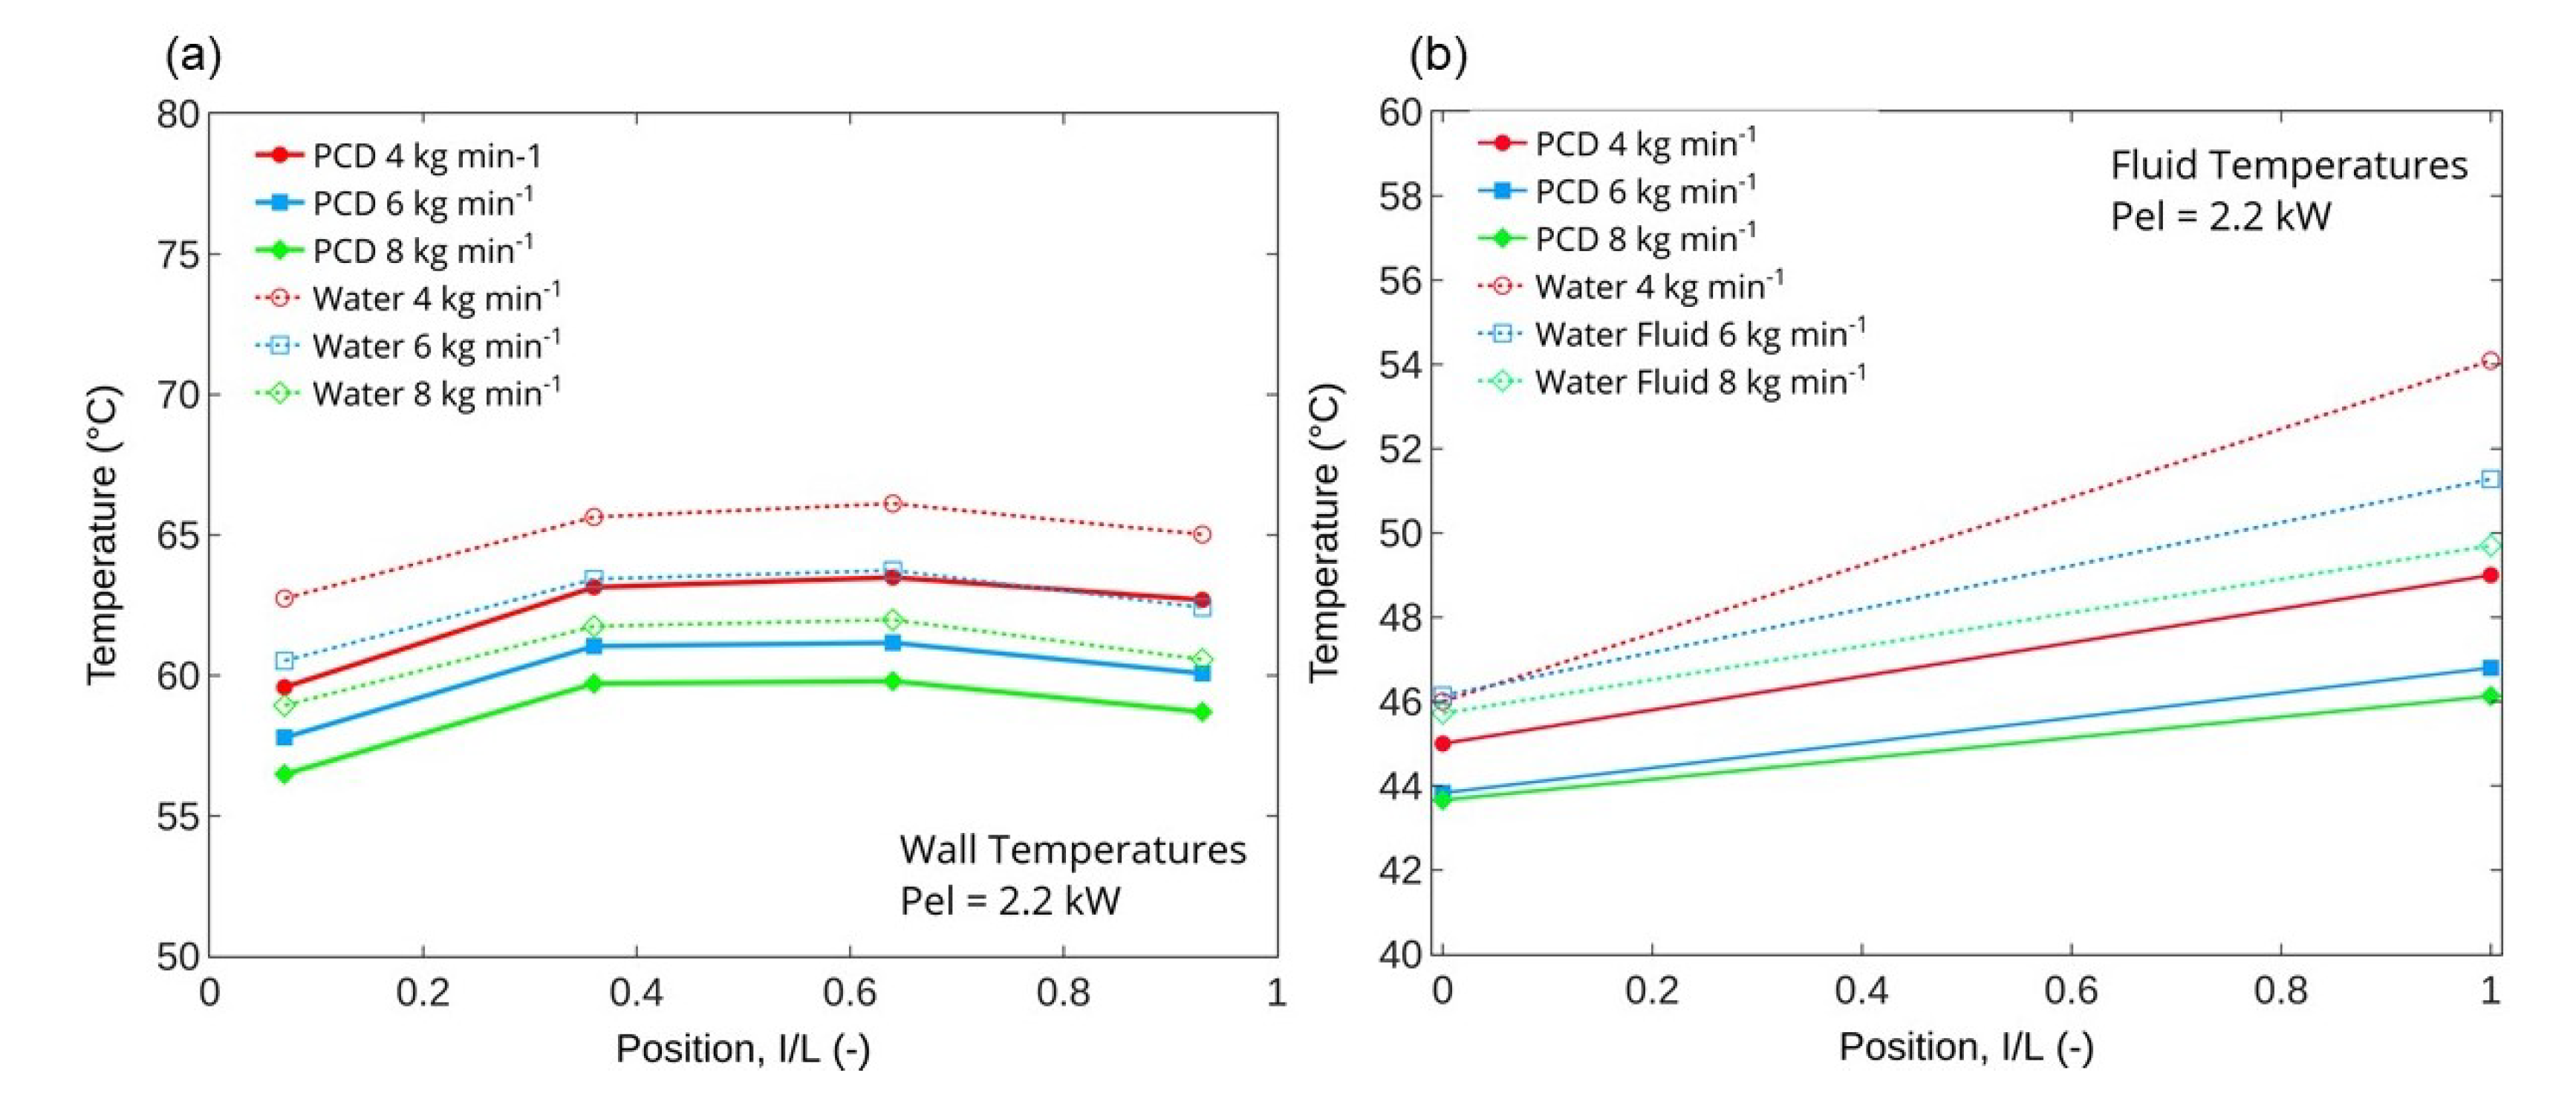
4.2. Heat Transfer Performance
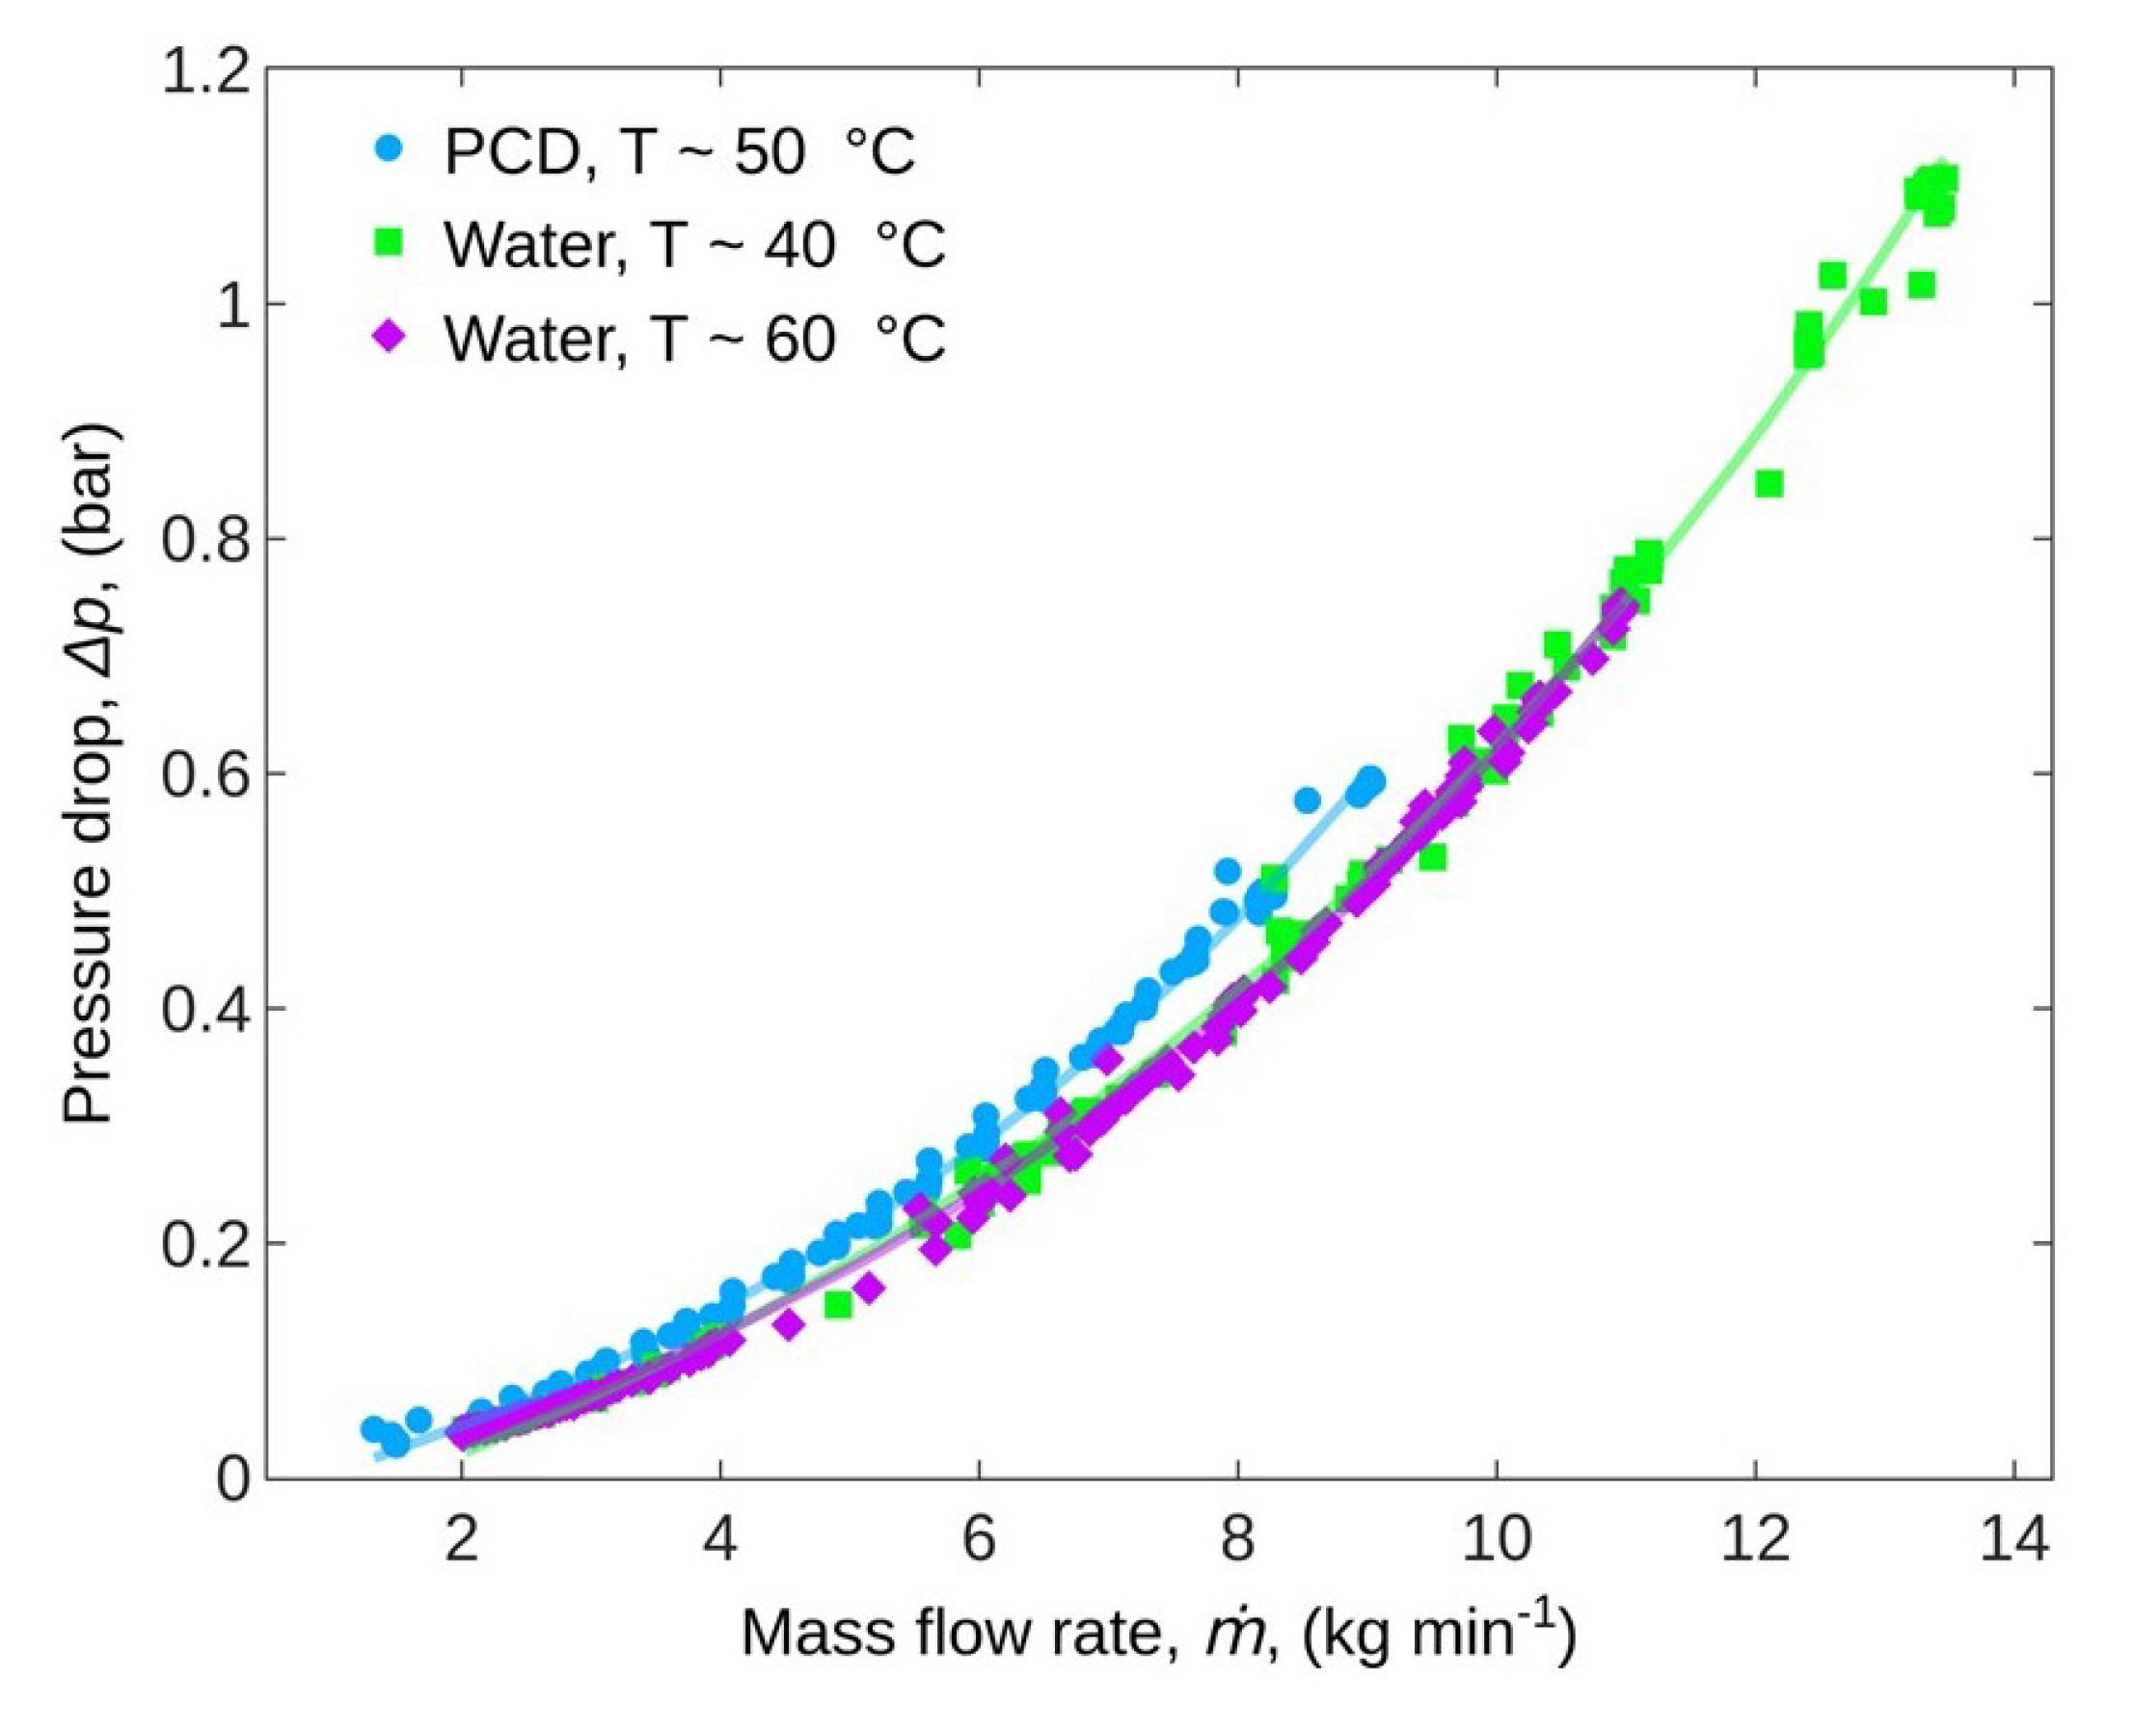
Figure 4 and Figure 5 show the temperature versus dimensionless position for the wall temperatures ( T w = T103, T104, T105 and T106) (Figure 4a and Figure 5a) and the bulk temperatures ( T b =T101 and T102) (Figure 4b and Figure 5b) for water and the PCD with a heating input of 1.5 and 2.2 kW and mass flow rates of 4, 6 and 8 kg min 1 . From Figure 4 and Figure 5 it is evident that the temperature distribution along the heating block was the same for water and for the PCD. In Figure 4, where an electrical heat input of 2.2 kW was used, the bulk fluid outlet temperatures were higher for both the PCD and water than in Figure 5, where a heating input of 1.5 kW was used. Furthermore, from Figure 4 and Figure 5, it is evident that for both the PCD and for water, at both electrical heating inputs, that a higher mass flow rate resulted in a lower bulk outlet temperature than when a lower mass flow rate was used.
When comparing the temperature profiles between water and PCD it is obvious to see that in all cases the temperature difference between the bulk inlet and outlet temperatures for PCD is more than 50% less than for water. For example, in Figure 4b, at 4 kg min 1 , the temperature difference from the inlet to the outlet for water is over 8 K, but for the PCD it is approximately 2 K. This is because of the larger storage capacity of the PCD than water. The storage capacity or the apparent heat capacity ( c ¯ p ) can be calculated in accordance with:
c ¯ p = Q ˙ m ˙ Δ T
The apparent heat capacity for each experiment for the PCD can be seen in Figure 6. The apparent heat capacity increases with the increasing degree of melting that occurred in the PCD, and therefore as discussed by Fischer et al. [28] it can be used to qualitatively distinguish how much melting occurred under different operational parameters. As the apparent specific heat capacity of water is 4200, in all cases the apparent specific heat is higher for the PCD, but it is twice the value at 4 kg min 1 at both electrical heat inputs.
The global heat transfer coefficients, h, according to Equation (3) are illustrated in Figure 7a for both water and the PCD at 1.5 and 2.2 kW for the three different mass flow rates (4, 6 and 8). Firstly, it is evident to see that the evolution of h with the mass flow rate is the same for water and for the PCD; and that is that h increases with an increase in the mass flow rate. The rate of this increase is different, however, for both the PCD and for water with the PCD showing a higher rate of increase with an increase in mass flow rate than water. Interestingly, the global heat transfer coefficient for water appears to be heavily dependent on the electrical heat input, with a larger electrical heat input resulting in a lower h, but for PCD the values of h are almost identical for both 1.5 and 2.2 kW heat inputs. The global heat transfer coefficients for the PCD for both heat inputs are approximately the same as water at 1.5 kW reaching a maximum of approximately 6000 W m 2 K 1 .
The thermal resistances, as calculated using Equation (5), for both water and PCD at 1.5 and 2.2 kW for the three different mass flow rates (4, 6 and 8) can be seen in Figure 7b. For both water and the PCD, the thermal resistance decreases with an increase in the mass flow rate. As with the global heat transfer coefficient, the thermal resistances for water shows a dependence on the electrical heating input, with a higher electrical heating input (2.2 kW) showing larger thermal resistances. This is not the case for the PCD. Furthermore, as with h, the thermal resistances for the PCD are approximately the same value as for water at a heating input of 1.5 kW for all mass flow rates.

4.3. Pressure Drop

The aforementioned positive results obtained for the PCD, reduced temperature increases and higher heat transfer coefficients and lower thermal resistances, need to be evaluated against the potential increase of the pressure drop. The pressure drop depends on the geometry of the structure and the effective viscosity of the fluid used. From Table 2, the viscosity of the PCD is five times higher than for water when the PCM within the PCD is fully crystallised and 4.4 times higher when fully melted. Figure 8 shows the pressure drop measurements for water and for the PCD. From Figure 8, it is evident that the pressure drop is higher for the PCD than for water at all mass flow rates, which becomes more noticeable at higher mass flow rates.

5. Conclusions

Overall, the test setup was deemed appropriate for testing and evaluating the effects of PCD in thyristor cooling. This was demonstrated through validation and comparison with water testing using energy balances. The results highlight that the use of the PCD in the system reduced the temperature increase in comparison to water by 50%. This was found to be due to the increased apparent heat capacity of the phase change dispersion compared to water, as at certain mass flow rates it reached almost twice that of water. Additionally, global heat transfer coefficients of up to 6100 W m 2 K 1 , were achieved for mass flow rates of 8 kg min 1 . Furthermore, it is interesting to note that the global heat transfer coefficients were the same, or higher than water at the same mass flow rates and electrical heating input. Additionally, it was found that the global heat transfer coefficients of water were dependent on the electrical heat input applied at the wall, but this was not the case for the phase change dispersion, which appeared to be independent of the wall electrical heat input. However, due to an increased viscosity of the PCD compared to water, higher pressure drops were found for the PCD than for water. This higher viscosity of the PCD could possibly lead to excessive heating of the HVDC thyristor, due to higher pumping power requirements. Additionally, further investigation should be carried out in determining whether the PCD is Newtonian or non-Newtonian. Whilst still at the initial testing phase, it is acknowledged that future testing would involve verification of stress-testing and longer term cycling to demonstrate the feasibility of introducing PCD into HVDC cooling technologies. Furthermore, numerical testing is ongoing to obtain models of pressure drop and rheology of the PCD in the system. Overall, the investigation highlights the application of cooling of electrical components with phase change dispersions in a real application, which to the author’s knowledge has not previously been done.

Author Contributions

Conceptualisation, L.F., E.M. and G.Q.; methodology, S.v.A.; formal analysis, P.O. and S.v.A.; investigation, S.v.A.; resources, Q.L., L.F., Y.D.; writing—original draft preparation, P.O.; writing—review and editing, P.O.; supervision, L.F., E.M., Y.D.; project administration, L.F., E.M., G.Q., Y.D.; funding acquisition, L.F. All authors have read and agreed to the published version of the manuscript.

Funding

This research was funded by the ‘Cooling of converters by using phase change materials project’ from the State Grid Corporation of China and Global Energy Interconnection Research Institute Europe GmbH No. SGRIWLZXQT[2017]882.

Institutional Review Board Statement

Not applicable.

Informed Consent Statement

Not applicable.

Data Availability Statement

Not applicable.

Acknowledgments

The authors gratefully acknowledge the financial supports from the above-mentioned funding body. Additionally, the paper was a collaboration between three research groups; Lucerne University of Applied Sciences, the University of Birmingham and Global Energy Interconnection Research Institute Europe.

Conflicts of Interest

The authors declare no conflict of interest.

Abbreviations

The following abbreviations are used in this manuscript:
H V D C High Voltage Direct Current
A C Alternating Current
H V High Voltage
M O S F E T Metal Oxide Semiconductor Field Effect Transistor
I G B T Insulated-gate Bipolar Transistor
C F D Computational fluid dynamics
D C Direct Current
H T F Heat transfer fluid
P V D F Polyvinylidene fluoride
P T F E Polytetrafluoroethylene
P C D Phase Change Dispersion
P C M Phase Change Material
PCMPhase Change Material
PCDPhase Change Dispersion
TotalTotal
WaterWater
MeltingMelting
elElectrical
maxMaximum
lossesLosses
inInlet
outOutlet
PCMPhase Change Material
wallWall
bulkBulk
calcCalculated
expExperimentally obtained
aTemperature difference at the inlet between heat sink and source
bTemperature difference at the outlet between heat sink and source
hGlobal heat transfer coefficient (W m 2 K 1 )
c p Specific heat capacity (J kg 1 K 1 )
aThermal diffusvitiy (m 2 )
mMass (g)
dDiameter (m)
PHeat input (W)
LLength (m)
eThickness (m)
xHeight (m)
R λ Thermal resistance (K W 1 )
AArea (m 2 )
m ˙ Mass flow rate (kg s 1 )
q ˙ Heat flux (W m 2 )
Q ˙ Heat transfer rate (W)
Ω Electrical conductivity (S m 1 )
ρ Density (kg m 3 )
λ Thermal conductivity (W m 1 K 1 )
μ Viscosity (Pa s)
Δ T Temperature difference (K)
Δ p Pressure drop (Pa)
Δ H Phase change enthalpy (kJ kg 1 )
ψ Mass content (-)

References

  1. IEA. Global Energy Review 2020; IEA: Paris, France, 2020. [Google Scholar]
  2. May, T.W.; Yeap, Y.M.; Ukil, A. Comparative evaluation of power loss in HVAC and HVDC transmission systems. In Proceedings of the 2016 IEEE Region 10 Conference (TENCON), Singapore, 22–25 November 2016; IEEE: New York, NY, USA, 2016; pp. 637–641. [Google Scholar]
  3. Nguyen, M.H.; Saha, T.K. Power loss evaluations for long distance transmission lines. In Proceedings of the Australian Geothermal Energy Conference, Brisbane, Australia, 11–13 November 2009; pp. 307–312. [Google Scholar]
  4. Fernández-Guillamón, A.; Das, K.; Cutululis, N.; Molina-Garcia, A. Offshore Wind Power Integration into Future Power Systems: Overview and Trends. J. Mar. Sci. Eng. 2019, 7, 399. [Google Scholar] [CrossRef] [Green Version]
  5. Bhandari, V.S.; Kulkarni, S.H. Optimization of heat sink for thyristor using particle swarm optimization. Results Eng. 2019, 4, 100034. [Google Scholar] [CrossRef]
  6. Kwon, B.; Foulkes, T.; Yang, T.; Miljkovic, N.; King, W.P. Air jet impingement cooling of electronic devices using additively manufactured nozzles. IEEE Trans. Compon. Packag. Manuf. Technol. 2019, 10, 220–229. [Google Scholar] [CrossRef]
  7. Meghdir, A.; Benabdallah, T.; Dellil, A.Z. Impact of geometry of electronic components on cooling improvement. Int. J. Heat Transf. 2019, 37, 167–178. [Google Scholar] [CrossRef] [Green Version]
  8. Wiriyasart, S.; Hommalee, C.; Naphon, P. Thermal cooling enhancement of dual processors computer with thermoelectric air cooler module. Case Stud. Therm. Eng. 2019, 14, 100445. [Google Scholar] [CrossRef]
  9. Murshed, S.M.S.; Nieto de Castro, C. A critical review of traditional and emerging techniques and fluids for electronics cooling. Renew. Sustain. Energy Rev. 2017, 78, 821–833. [Google Scholar] [CrossRef]
  10. Khalaj, A.H.; Halgamuge, S.K. A Review on efficient thermal management of air-and liquid-cooled data centers: From chip to the cooling system. Appl. Energy 2017, 205, 1165–1188. [Google Scholar] [CrossRef]
  11. Sparrow, E.M.; Chevalier, P.W.; Abraham, J.P. The design of cold plates for the thermal management of electronic equipment. Heat Transf. Eng. 2006, 27, 6–16. [Google Scholar] [CrossRef]
  12. Kandlikar, S.G.; Hayner, C.N. Liquid cooled cold plates for industrial high-power electronic devices—Thermal design and manufacturing considerations. Heat Transf. Eng. 2009, 30, 918–930. [Google Scholar] [CrossRef]
  13. Nilsson, S.; de Mattos Tenório, A.R.; Sen, S.; Taylor, A.; Xu, S.; Zhao, G.; Song, Q.; Lei, B. Application Examples of the Thyristor Controlled Series Capacitor. In Flexible AC Transmission Systems: FACTS; Springer International Publishing: Cham, Switzerland, 2019; pp. 1–59. [Google Scholar]
  14. Darin, S.; Jankowski, N.; Bar-Cohen, A. Two-Phase Fluid Selection for High-temperature Automotive Platforms; Technical Report; Army Research Laboratory: Adelphi, MD, USA, 2012. [Google Scholar]
  15. Ghoghaei, M.S.; Mahmoudian, A.; Mohammadi, O.; Shafii, M.B.; Mosleh, H.J.; Zandieh, M.; Ahmadi, M.H. A review on the applications of micro-/nano-encapsulated phase change material slurry in heat transfer and thermal storage systems. J. Therm. Anal. Calorim. 2020, 1–24. [Google Scholar] [CrossRef]
  16. Chai, L.; Shaukat, R.; Wang, L.; Wang, H.S. A review on heat transfer and hydrodynamic characteristics of nano/microencapsulated phase change slurry (N/MPCS) in mini/microchannel heat sinks. Appl. Therm. Eng. 2018, 135, 334–349. [Google Scholar] [CrossRef] [Green Version]
  17. Alva, G.; Lin, Y.; Liu, L.; Fang, G. Synthesis, characterization and applications of microencapsulated phase change materials in thermal energy storage: A review. Energy Build. 2017, 144, 276–294. [Google Scholar] [CrossRef]
  18. Wang, F.; Lin, W.; Ling, Z.; Fang, X. A comprehensive review on phase change material emulsions: Fabrication, characteristics, and heat transfer performance. Sol. Energy Mater. Sol. Cells 2019, 191, 218–234. [Google Scholar] [CrossRef]
  19. Morimoto, T.; Kumano, H. Flow and heat transfer characteristics of phase change emulsions in a circular tube: Part 1. Laminar flow. Int. J. Heat Mass Transf. 2018, 117, 887–895. [Google Scholar] [CrossRef]
  20. Morimoto, T.; Sugiyama, M.; Kumano, H. Experimental study of heat transfer characteristics of phase change material emulsions in a horizontal circular tube. Appl. Therm. Eng. 2021, 188, 116634. [Google Scholar] [CrossRef]
  21. Ma, F.; Chen, J.; Zhang, P. Experimental study of the hydraulic and thermal performances of nano-sized phase change emulsion in horizontal mini-tubes. Energy 2018, 149, 944–953. [Google Scholar] [CrossRef]
  22. Vasile, V.; Necula, H.; Badea, A.; Revellin, R.; Bonjour, J.; Haberschill, P. Experimental study of the heat transfer characteristics of a paraffin-in-water emulsion used as a secondary refrigerant. Int. J. Refrig. 2018, 88, 1–7. [Google Scholar] [CrossRef]
  23. Chen, J.; Zhang, P. Preparation and characterization of nano-sized phase change emulsions as thermal energy storage and transport media. Appl. Energy 2017, 190, 868–879. [Google Scholar] [CrossRef]
  24. Wang, F.; Fang, X.; Zhang, Z. Preparation of phase change material emulsions with good stability and little supercooling by using a mixed polymeric emulsifier for thermal energy storage. Sol. Energy Mater. Sol. Cells 2018, 176, 381–390. [Google Scholar] [CrossRef]
  25. Ho, C.; Lin, K.H.; Rashidi, S.; Toghraie, D.; Yan, W.M. Experimental study on thermophysical properties of water-based nanoemulsion of n-eicosane PCM. J. Mol. Liq. 2021, 321, 114760. [Google Scholar] [CrossRef]
  26. Yang, L.; Huang, J.N.; Zhou, F. Thermophysical properties and applications of nano-enhanced PCMs: An update review. Energy Convers. Manag. 2020, 214, 112876. [Google Scholar] [CrossRef]
  27. Fischer, L.; Mura, E.; O’Neill, P.; von Arx, S.; Worlitschek, J.; Qiao, G.; Li, Q.; Ding, Y. Thermophysical properties of a phase change dispersion for cooling around 50 °C. Int. J. Refrig. 2020, 119, 410–419. [Google Scholar] [CrossRef]
  28. Fischer, L.; Maranda, S.; Stamatiou, A.; von Arx, S.; Worlitschek, J. Experimental investigation on heat transfer with a Phase Change Dispersion. Appl. Therm. Eng. 2019, 147, 61–73. [Google Scholar] [CrossRef]
Figure 1. Schematic of a typical thyristor and heat sink stack.
Fluids 06 00117 g001
Figure 2. (a) An explosion view of the heat sink and heating blocks used in this investigation and (b) a photograph of the heat sink and heating blocks used in the experimental investigation.
Fluids 06 00117 g002
Figure 3. Flow sheet and instrumentation diagram of the experimental test setup used in the investigation.
Fluids 06 00117 g003
Figure 4. Comparing the temperatures of the PCD and water for an electrical heating input of 2.2 kW and at three different mass flow rates (4, 6 and 8 kg min 1 ) as a function of the dimensionless position for (a) the wall temperatures and (b) the bulk fluid inlet and outlet temperatures.
Fluids 06 00117 g004
Figure 5. Comparing the temperatures of the PCD and water for an electrical heating input of 1.5 kW and at three different mass flow rates (4, 6 and 8 kg min 1 ) as a function of the dimensionless position for (a) the wall temperatures and (b) the bulk fluid inlet and outlet temperatures.
Fluids 06 00117 g005
Figure 6. The calculated apparent heat capacities of the PCD at the three different mass flow rates (4, 6 and 8 kg min 1 ) and the two heating inputs (2.2 and 1.5 kW).
Fluids 06 00117 g006
Figure 7. (a) The global heat transfer coefficients for water and the PCD against the mass flow rate, calculated with Equation (5) for electrical heating inputs of 1.5 and 2.2 kW, (b) the thermal resistances for water and the PCD against the mass flow rate as calculated by Equation (8) for electrical heating inputs of 1.5 and 2.2 kW.
Fluids 06 00117 g007
Figure 8. The pressure drop versus mass flow rate for the investigated PCD at 50 C, and for water at 40 and 60 C.
Fluids 06 00117 g008
Table 1. Specifications for standard industrial high voltage direct current (HVDC) cooling system requirements.
Specification of Industrial InstallationUnitValue
Inlet temperature of the cooling liquid into the heat sink C46
Specified outlet temperature of the cooling liquid from the entire converter valve C55.3
Temperature increase of water as HTFK9.3
Definition of optimum temperature for the phase change C47.5–50
Considered flow rate of the cooling liquid waterL min 1 8
Pressure drop of water (8 L min 1 , 25 C)mbar390
Thyristor core temperature C90
Thyristor surface temperature C65
Heat sink surface temperature C62
Diameter of the heat exchange surface at the heat sink (cylindrical)m0.134
Thyristor dimensioninch5
Heat transfer surface area (both sides together)m 2 0.0282
Thyristor heat sourceW1700–2200
Specific heat flux (for 2200 W, 1100 W from each side)W m 2 78,000
Mass of the heat sinkkg3.2
Temperature increase with 8 L min 1 and 1100 W from each side (2.2 kW in total)K3.94
Table 2. Thermophysical properties of the phase change material (PCM), water and the phase change dispersion (PCD) used in this investigation from [27].
Property and ConditionsSymbolUnitPCMWaterPCD
Specific heat capacity @ 25 C c p kJ kg 1 K 1 1.174.1853.69
Specific heat capacity @ 60 C c p kJ kg 1 K 1 2.24.1833.78
Density @ 25 C ρ kg m 3 902997988
Density @ 60 C ρ kg m 3 830983980
Phase change enthalpy during melting Δ H kJ kg 1 20233334
Thermal conductivity @ 25 C λ W m 1 K 1 0.2310.6080.529
Thermal conductivity @ 60 C λ W m 1 K 1 0.2060.6510.561
Viscosity at 100 1/s and @ 25 C μ mPa s-0.894.2
Viscosity at 100 1/s and @ 60 C μ mPa s-0.472.1
Thermal diffusivity @ 25 Cam 2 s 1 1.50 × 10 7 1.46 × 10 7 1.50 × 10 7
Thermal diffusivity @ 60 Cam 2 s 1 1.10 × 10 7 1.58 × 10 7 1.50 × 10 7
Table 3. Technical and geometric data for the heat sink used in this experimental investigation.
Material of the Heat SinkAlMgSiO 5
Thermal conductivity of the heat sink material ( λ )185 W m 1 K 1
Electrical conductivity of the heat sink material ( Ω )28.6 × 6 S m 1
Web thickness2.65 mm
Channel width3.6 mm
Angle of the webs to the side75
Angle of the webs with respect to each other30
Channel height of the centre side1.6 mm
Channel height of the surface side2.4 mm
Length of the cooling field (inlet to outlet)118 mm
Width of the cooling field130 mm
Porosity0.576
Free cross sectional area299.5 mm 2
Table 5. Specifications and details of all the sensors used in the experimental investigation.
EquipmentManufacturerTypeRangeUncertainty
Fluid temperature sensor (T101, T102)Roth + Co AGPT100 1/3 DIN−50–+200 C±0.03 C
Wall temperature sensor (T103, T104, T105 and T106)Roth + Co AGPT100 1/3 DIN−50–+200 C±0.03 C
Differential pressure ( Δ p )Endress + HauserDeltabar S PMD750–40 bar±0.0025 bar
Coriolis flowmeter (Fl01)Endress + HauserPromass F 83, Type 4x0–6500 kg h 1 ±9.0 kg h 1
Electrical power (P e l )Jumo GmbHTYA 2010–4 kW±0.02 kW
Data acquisitionNational instrumentsNI 9126Sampling rate: 1 Hz14 bit precision
Publisher’s Note: MDPI stays neutral with regard to jurisdictional claims in published maps and institutional affiliations.

