Article

Identifying the Impact of Cross-Border E-Commerce on Urban Entrepreneurship: New Insights from China’s Cross-Border E-Commerce Comprehensive Pilot Zone

School of Business, Xiangtan University, Xiangtan 411105, China
*
Author to whom correspondence should be addressed.
J. Theor. Appl. Electron. Commer. Res. 2026, 21(2), 42; https://doi.org/10.3390/jtaer21020042
Submission received: 16 December 2025 / Revised: 12 January 2026 / Accepted: 20 January 2026 / Published: 26 January 2026
(This article belongs to the Section Entrepreneurship, Innovation, and Digital Business Models)

Abstract

Cross-border e-commerce, as an emerging trade format, offers new chances for optimizing industrial chains’ layout, enhancing economic resilience, and attaining high-quality development at the city level. In this context, treating the execution of the cross-border e-commerce comprehensive pilot zone (CBEC) as a quasi-natural experiment, this study subtly attests to how the CBEC affects urban entrepreneurship by using a difference-in-differences (DID) technique. The results exhibit that the CBEC greatly promotes urban entrepreneurship, which is supported by some robustness tests, including instrumental variable testing and placebo testing. Heterogeneity analysis reveals that in cities with more developed economies, stronger digitalization, richer cultures, sounder law rules, and better business environments, the benefit for the CBEC on entrepreneurship is more significant. Mechanism testing argues that the CBEC promotes urban entrepreneurship through talent aggregation and industrial upgrading. Precisely, the more concentrated high-quality talents are and the more advanced the industrial structure is, the higher the urban entrepreneurship. More importantly, the CBEC exhibits a spatial spillover effect on entrepreneurship, promoting local entrepreneurship while stimulating the motivation to imitate and learn in neighboring areas, thereby driving their entrepreneurship. The findings offer a viable decision-making guide for building a unified factor market and achieving regional coordinated development.

1. Introduction

Cities act as vital spatial carriers of economic development, and a nation’s or region’s overall economic strength, to a greater extent, can be gauged by their development level [1]. Employment is vital to people’s livelihood and closely related to urban development and economic vitality [2,3]. As one of the core engines driving employment, entrepreneurship plays a prominent role in energizing the job market [4], being particularly significant for large developing countries. To the best of our knowledge, the key to addressing employment issues lies greatly in cities. Since reforms and opening up in 1978, in a finer way, China’s economy has expanded rapidly, spurred by advancing urbanization and industrialization. Given the records issued by the China National Bureau of Statistics (CNBS), the Chinese urbanization rate, to be more precise, has climbed from 17.92% to 66.89% during 1978–2025, with population continuing to flow into urban areas, especially converging in large and coastal cities. However, rapid urbanization has brought problems like mismatches between employment structures and population mobility and inadequate coordination between public service supply and urban expansion. As early as 2014, in a finer way, the Chinese authority firmly outlined a strategy, which aims at mass entrepreneurship and innovation at the city level, to create more jobs by stimulating entrepreneurial activities. Particularly, the 20th Chinese National Congress (CNC), held with solemnity in October 2022, also emphasized the need to advance the employment-first strategy, enriched the rules for promoting employment, and eventually facilitated high-quality employment. That being the case, entrepreneurship greatly exhibits an increasingly crucial strategic position. Academics have also conducted studies from multiple dimensions, including urban entrepreneurial ecosystem building [5], entrepreneurial support systems [6], industry-entrepreneurship sharing networks [7], and talent attraction enhancement [8], notably offering theoretical support for optimizing the urban employment ecosystem. And yet, there remains insufficient understanding of the intrinsic motivations behind different entrepreneurial behaviors, variations in influencing factors, and how these differences affect employment. Exploring these issues is crucial for promoting employment through guiding entrepreneurship.
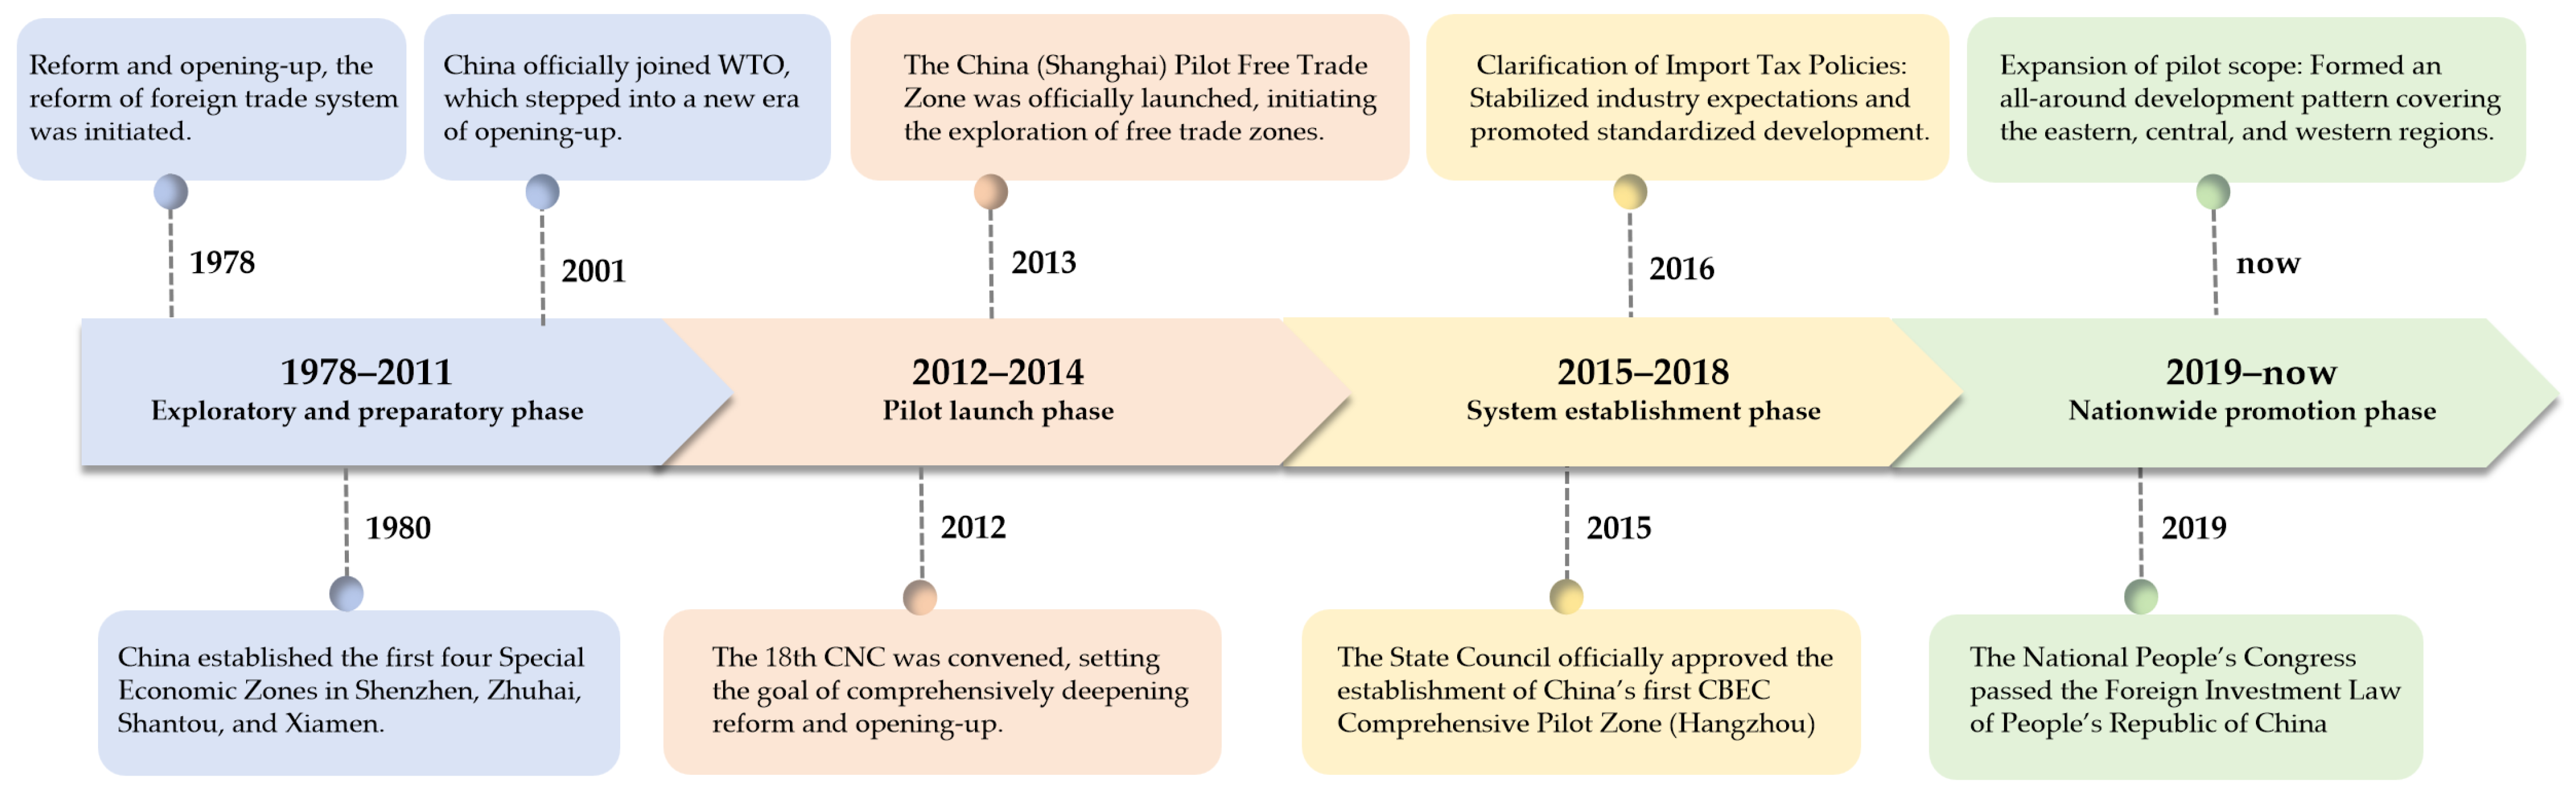
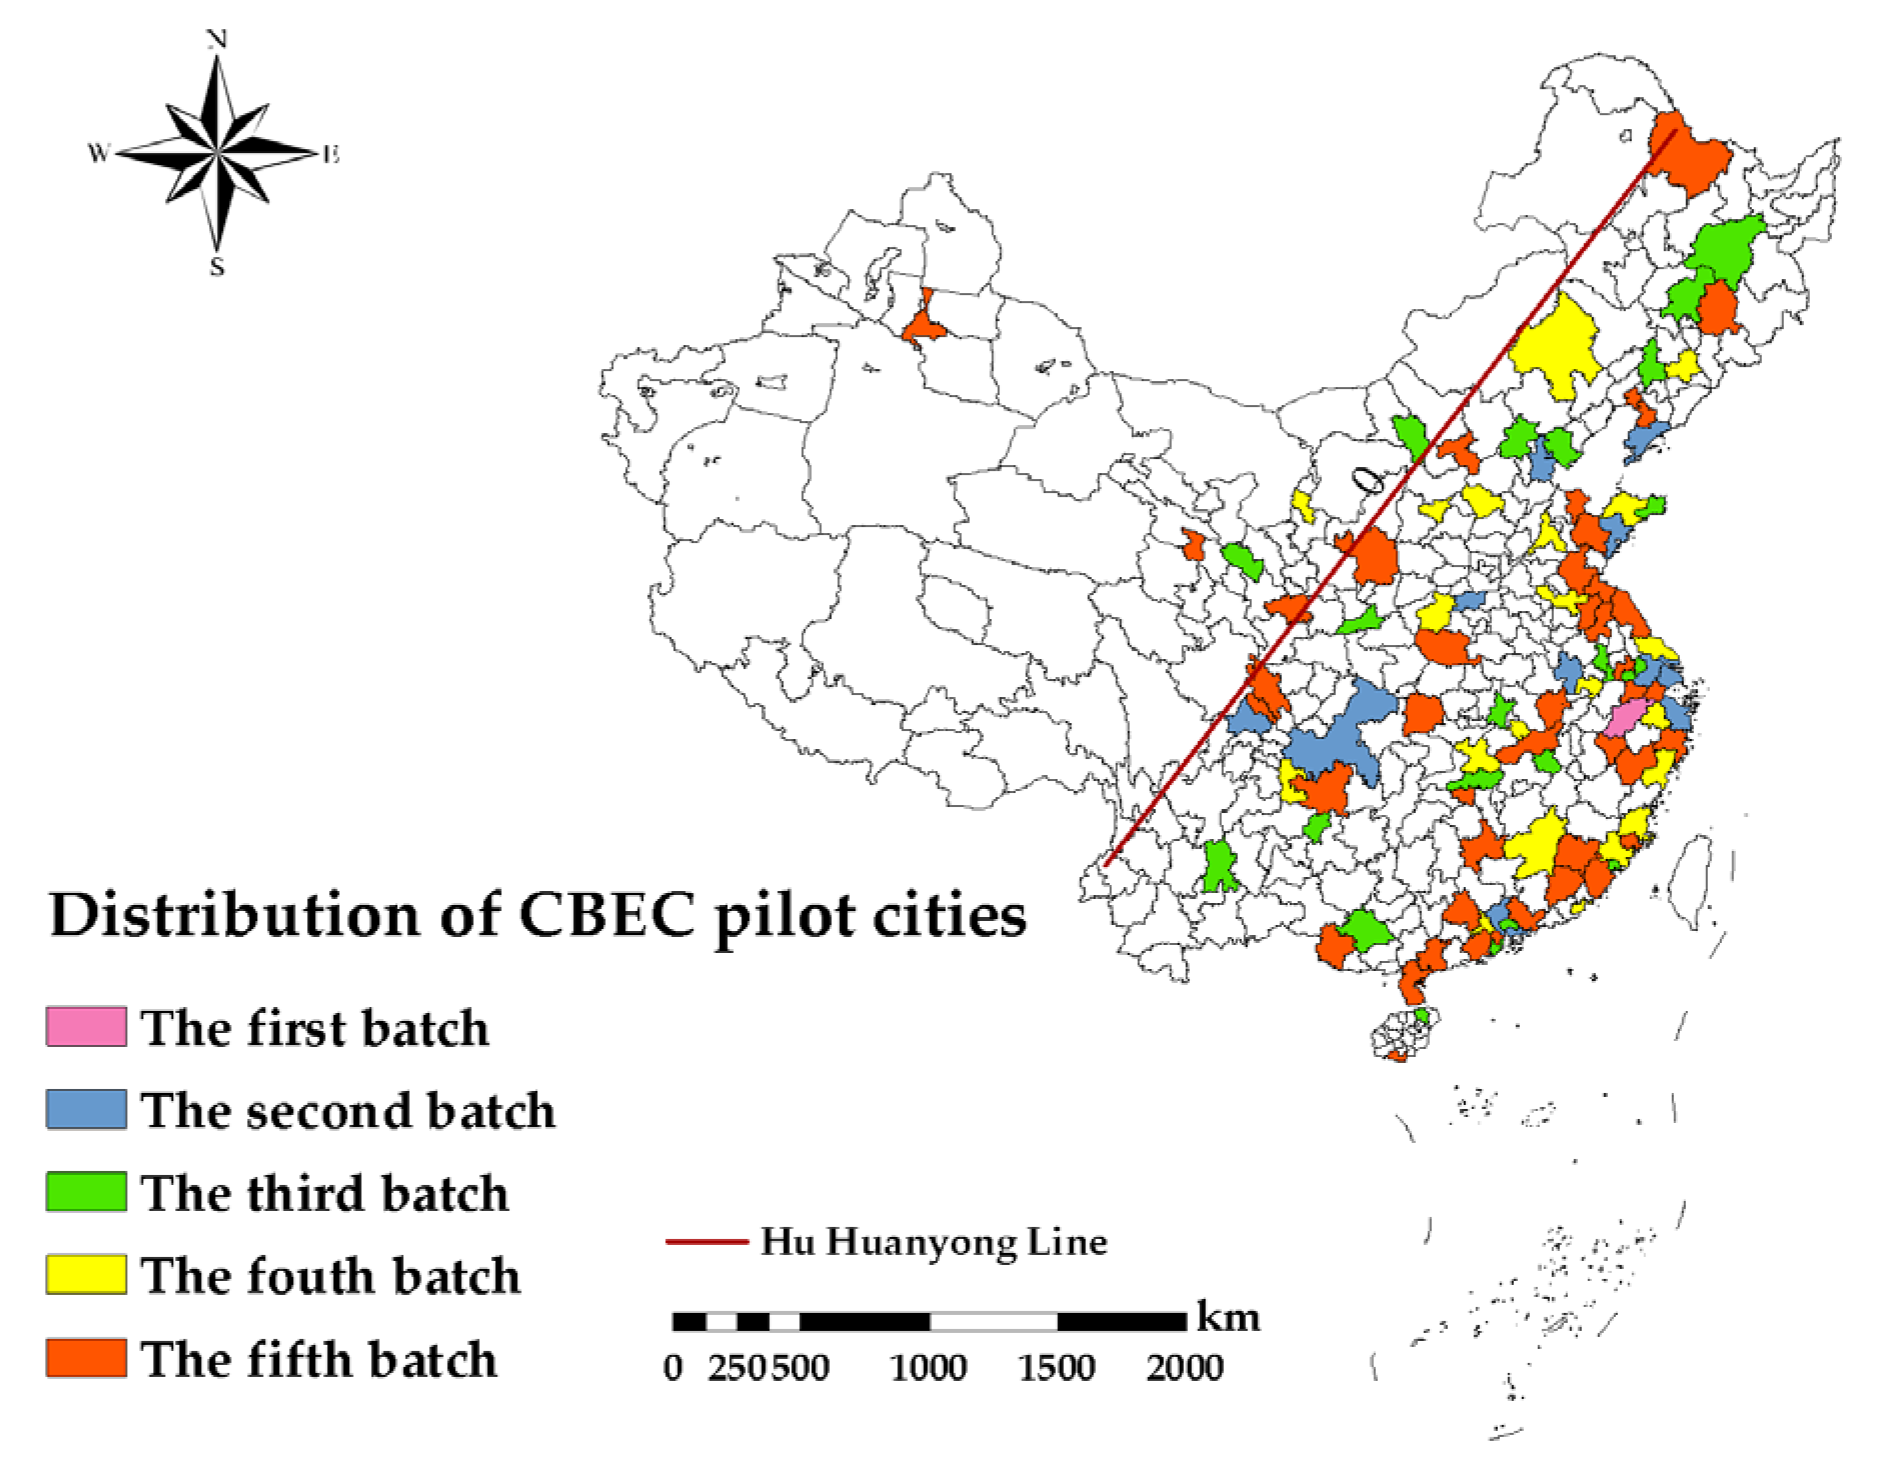
To be fair, there are many factors affecting employment, of which institutional openness serves as a vital element [9]. Theoretically, it greatly fosters the optimization of employment composition via improving the business environment and lowering market access thresholds [10]. For China, the pace of opening up has witnessed immense progress recently. To be specific, in 1980, the authorities declared four coastal cities—Zhuhai, Xiamen, Shantou, and Shenzhen—as economic zones, formulating some favorable terms for other nations to invest in China. In 2001, it entered a new stage upon joining the World Trade Organization (WTO). Since the 18th CNC held in 2012, efforts stretching from the creation of pilot free trade zones and the formulation of import tax policies to declaring foreign investment law have demonstrated its determination to further boost opening up. In that case, the CBEC, as an important initiative for system-based liberalization, is on the agenda in the new era. In 2015, the State Council formally granted the creation of the first China CBEC (Hangzhou). Since then, the pilot scope for the CBEC, batch by batch, has set up 165 pilot cities nationwide, forming a pattern covering the East, Central, and West, as exhibited in Figure 1. In recent years, the CBEC has also attracted extensive attention from academics, with related studies focusing on its economic, ecological, and social effects [11]. Existing studies have shown that the CBEC can greatly optimize economic systems [12], foster the progress of green ecology [13], and improve residents’ quality of life [14]. However, as a vital force spurring urban development, whether entrepreneurship has an inherent connection with the CBEC deserves in-depth exploration. That being the case, does the CBEC exhibit a substantial impact on entrepreneurship at the city level? Does such an impact show heterogeneity due to factors like economy and culture? What is the internal mechanism through which it acts on entrepreneurship? Clarifying these key issues, to some extent, can offer vital decision-making references for promoting high-quality entrepreneurship in the new development stage.
The study subtly employs a 2006–2021 panel dataset from 282 Chinese cities, and a multi-phase DID strategy to statistically disclose how the CBEC affects entrepreneurship at the city level. Unlike current studies, the novelties in this paper are exhibited as follows: First, we adopt a novel dataset for quantifying urban entrepreneurship. This paper obtains the underlying data of industrial and commercial registered firms, which includes statistics such as corporate code, registered addresses, date of establishment, and company capital, from the State Administration for Market Regulation (SAMR). After cleaning and matching the dataset, the total number of newly founded firms across each city during the same period is derived. This figure is then standardized using the population-based method, offering a database for clarifying the spatial distribution. Second, we probe how digital trade affects entrepreneurship from the perspective of institutional opening-up at an urban scale. This paper, the CBEC being acted as a shock, deeply detects the influence path and mechanism of urban entrepreneurship and provides decision-making reference for strengthening institutional openness. Third, we subtly employ a multi-phase DID strategy to deeply disclose how the CBEC scheme affects urban entrepreneurship. Through some robustness tests, such as a placebo test dual machine learning (DML), coupled with a parallel trend test, the baseline outcomes are verified. In particular, the spatial autocorrelation econometric model, with two spatial weighting matrices, is applied to better assess the effects for the CBEC and provide empirical evidence for accurately understanding their relationship. Fourth, the study closely reveals the impact processes for the CBEC on urban entrepreneurship from population mobility and industrial shifts. To be specific, we detect the influence mechanisms for the CBEC on urban entrepreneurship from the aspects of talent concentration and industrial upgrading, which, to a certain degree, offer theoretical and data support to foster regional entrepreneurship synergistic development.
The remaining part of the study is outlined below. To be more exact, Section 2 fully states the literature related to the CBEC and urban entrepreneurship. Section 3 inspects the execution setting for the CBEC scheme and its impact on entrepreneurship at the city level. Section 4 outlines the framework, variables, and data for the multi-stage DID strategy. Section 5 analyzes the regression findings at length. Lastly, this study is concluded wholly.

2. Literature Review

By fully reviewing existing literature, academia has conducted extensive research on the CBEC and urban entrepreneurship. This paper summarizes the literature from three aspects: the assessment and influencing elements for urban entrepreneurship, the economic and ecological benefits of the CBEC scheme, and the usage of the DID strategy. The overall overview of the literature is as follows.

2.1. Assessment of Urban Entrepreneurship and Its Influencing Elements

Up until now, despite the backdrop of global economic development and intensified competition, cities, as key carriers of entrepreneurial activities, have drawn attention to their vitality [15]. Urban entrepreneurship is crucial for stimulating endogenous economic momentum and boosting employment [16,17], serving as a vital path for high-quality urban development. Academia has conducted in-depth research on two aspects of urban entrepreneurship: measurement and influencing factors. Among them, fair measurement forms the foundation of urban entrepreneurship research. To be specific, we summarize three methods for measuring entrepreneurial activities. First, it is reflected by the number of newly founded firms during the observation period [4]. Jiang et al. [18] used the number of newly established firms for citizens across each city to gauge urban entrepreneurial activities. Second, it is measured by comprehensive indices compiled by professional institutions. Lan et al. [19] measure the level of urban entrepreneurship using Chinese Local Innovation and Entrepreneurship Scores created via Peking University, which, to a certain extent, acts as a prevailing dataset for identifying Chinese entrepreneurship at the city level. Third, it is also measured by comprehensive indices [20,21]. Entrepreneurial activities are core to economic growth [22], and their development greatly relies on multiple elements such as institutional environment, economic conditions, and infrastructure. In terms of institutional environment, institutional arrangements exert an impact on urban entrepreneurial activities through a dual mechanism of incentives and constraints. On the one hand, the effectiveness of institutions is reflected in the adaptability of policy supply to urban development. Local government location-oriented policies have differential impacts on the city’s entrepreneurial activities with different sizes [10,20]. On the other hand, the synergy of institutions directly determines the cost of entrepreneurship. For instance, He et al. [5] proposed that integrating local governance with entrepreneurial support can form distinctive incentive systems and reduce institutional transaction costs for entrepreneurs. In contrast, deficiencies in the institutional system can inhibit the release of urban entrepreneurial vitality by raising market access thresholds and weakening rights protection [9]. In terms of economic conditions, they offer resource support and market space for urban entrepreneurship. Phelps and Miao [4] emphasized a two-way interaction between economic growth and entrepreneurial activities. Prieger et al. [7] noted that excessive or insufficient entrepreneurial activities may affect the quality of economic growth. Additionally, some scholars have researched infrastructure-related aspects. Ren et al. [23] proposed that the interconnection of infrastructure, such as transportation and communication, can significantly reduce entrepreneurial costs, which is congruent with the findings of Barnett et al. [24]. Similarly, the case study in Portugal case from Morton and Iglesias [25] attests that infrastructure greatly fosters social entrepreneurial projects.

2.2. Studies on the Implications for the CBEC Scheme on the Economy and Environment

Thus far, the economic and eco-environmental effects of institutional opening have long been a focus of academic attention. Institutional opening improves global resource allocation efficiency and enhances economic resilience [25]. As an important institutional arrangement, the related effects for the CBEC scheme have also attracted significant attention. From economic effects, some scholars mainly focused on CBEC’s impact on export trade, regional economy, and industrial structure [12]. The CBEC provides enterprises with access to global markets by simplifying customs clearance procedures and reducing information asymmetry [26]. To be specific, Chen and Yang [11] found that network structural embeddedness enhances customer experience and influences purchasing decisions, driving the expansion of cross-border trade, which echoes the study from Baggs et al. [27]. In industrial structure upgrading, Kim and Lim [28] found that the digital economy driven by the CBEC scheme, in a finer way, notably promotes the reform for industrial structures from labor-intensive to technology-intensive. Mazzucchelli et al. [29] found that CBEC platforms greatly create affirming benefits for facilitating industrial upgrading. In regional growth, the enabling effect of the CBEC is reflected through two pathways. First, it indirectly promotes regional economic growth by increasing logistics density and improving the supporting facilities of regional infrastructure [30]. Second, it directly drives economic growth by relying on the digitalization process to facilitate the efficient flow of factors such as technology and data [31]. From environmental effects, academia has begun to focus on CBEC’s impacts on carbon emission efficiency, resource utilization, and environmental pollution. In carbon emission efficiency, the CBEC improves it by integrating logistics resources and shortening transportation distances [32]. Wang et al. [33] found that carbon sink sharing in the CBEC can reduce transportation carbon emissions, which was further proved by Ballerini et al. [26]. Larch and Wanner [34] further proposed that imposing carbon tariffs on CBEC goods could indirectly promote low-carbon production transformation. In resource utilization efficiency, Viglia et al. [35] detected that, to a greater extent, the popularity of digital technologies notably reduces resource waste from paper use and sample transportation, in line with the concept of green development. Meanwhile, synergy between the CBEC and logistics infrastructure can reduce resource consumption per unit of exports and improve overall utilization efficiency [30,36]. In environmental pollution, Xu et al. [37] subtly detected how environmental regulation affects green development, pointing out that CBEC development can promote the improvement of environmental regulations, thereby strengthening emission reduction effects. Li et al. [38] found that international environmental protection requirements brought by the CBEC encourage enterprises to optimize production processes and reduce emission intensity, which, to a greater extent, was verified by Ghazy et al. [39]. In summary, existing research generally believes that the CBEC has positive economic effects and environmental benefits, but attention should be paid to the heterogeneity of effects and long-term impacts.

2.3. Studies on the Usage of the Difference-in-Differences Strategy

As a classic econometric method for evaluating the effects of policy interventions, the DID model is widely applied in social science. To be specific, with the deepening of research needs, single-period DID, multi-period DID, and spatial DID models have gradually developed, each applicable to different policy scenarios. The following sorts out the application progress of these three models in the fields of economics, ecology, and sociology. From economics, the usage of the DID model to some extent depends on how policy interventions affect economic growth and resource allocation. The single-period DID is suitable for scenarios where policies are implemented in a concentrated manner and can effectively verify the promotional effect of policies on specific economic variables [27]. For example, Wang [10] subtly adopted a single-period DID technique to verify the policy’s role in promoting entrepreneurship. Zheng and Du [8] used a multi-phase DID model to fully reveal how policy implementation timing affects economic integration effects. Moreover, Karolyi and Liao [40] applied the spatial DID to capture the siphon effect of the policy on foreign capital inflows in surrounding areas. In the field of ecological environment, the application of DID focuses on how environmental regulations and technological innovation affect ecological indicators. In particular, the single-period DID is widely used to evaluate the emission reduction benefits of sudden environmental policies [41]. For example, Xu and Yi [42] finely used a single-period DID to detect carbon emission performance before and after anti-corruption measures. Li et al. [38] used the multi-phase DID strategy, in a finer way, to capture the effect differences in phased policy execution. Moreover, the spatial DID technique is particularly important in ecological research due to the strong spatial correlation of environmental pollution [43]. To be specific, Yang and Kang [44] took the reduction in speed limits as the entry point of policy intervention and adopted a combined method of propensity score matching and spatial DID regression to systematically identify the causal effect of this policy on urban air quality. Larch and Wanner [34] introduced the spatial DID technique and attested to how trade policy affects carbon emissions in surrounding countries. In the field of sociology, the application of DID focuses on the benefits for distinct systems of social structure and resource allocation. Likewise, the single-period DID is adopted to assess the short-term benefits of social policies on specific groups [45]. For example, Blennerhassett et al. [15] used the single-period DID to compare the income changes in immigrant entrepreneurs before and after the renovation. The multi-period DID is suitable for scenarios, in a finer way, where social policies are promoted in a gradient manner [3]. Barnett et al. [24] greatly confirmed the positive implications for policy implementation on the entrepreneurship rate through the multi-period DID technique. He et al. [5] applied the spatial DID to verify the radiation effect of policies on surrounding counties. Zhao et al. [46] took the low-altitude airspace opening policy as the key variable and used the Double Machine Learning (DML) technique to subtly detect the implications of the policy on aviation manufacturing innovation. In brief, the usage of the DID strategy covers multiple fields, which notably exhibit an evolutionary feature from single-period to multi-period and from non-spatial paradigm to spatial paradigm, greatly providing reliable support for policy effect evaluation.
To sum up, the academics have fully detected the assessment and affecting elements for entrepreneurship at an urban scale, the economic and eco-environmental benefits for the CBEC scheme, and the application of the DID model, with rich outcomes. However, four limitations remain. First, there is no unified standard for measuring entrepreneurship, as researchers use different indicators, methods, and definitions, which may lead to biases in formulating entrepreneurship support policies if overlooked. Second, studies on urban entrepreneurship from the perspective of institutional opening are scarce, and neglecting this perspective hinders a comprehensive understanding of institutional driving forces behind entrepreneurship and their inherent connections. Third, due to the complexity of policy implementation environments and policy diversity, traditional DID models struggle to accurately identify CBEC effects, making it crucial to adopt multi-period DID models combined with robustness tests and spatial weight matrices for evaluation. Fourth, research on CBEC’s impact on urban entrepreneurship is limited, especially regarding the use of mathematical models to analyze influencing mechanisms, and ignoring such in-depth analysis makes it difficult to clarify the core paths through which the CBEC fosters entrepreneurship.

3. Theoretical Analysis

3.1. Institutional Historical Setting for the CBEC Scheme

Thus far, to boost economic development and trade facilitation, countries worldwide have rolled out CBEC-friendly policies to foster a sound development environment. Internationally, leading platforms like Amazon have emerged, forming a CBEC landscape with diversified competition and regional collaboration. During this time, China launched its CBEC exploration in 2015, establishing the first CBEC pilot zone in Hangzhou to develop replicable and promotable experiences for national CBEC growth. Since then, the scope of CBEC has expanded steadily. To be specific, in 2016, 12 cities, including Tianjin, Dalian, Guangzhou, Ningbo, Shenzhen, Chongqing, and Shanghai, etc., further became the 2nd group of pilot areas for the CBEC scheme. As of April 2025, China has approved over 160 CBEC comprehensive pilot zones, covering coastal, border, and inland regions and forming a three-dimensional trade network, as shown in Figure 2. Visually speaking, eastern coastal areas serve as the frontier, while central and western regions see rapid growth. All pilot zones, focusing on institutional innovation, service innovation, and coordinated development, actively explore new CBEC development models. CBEC advancement is led by the Ministry of Commerce, with multi-departmental collaboration in policy-making, financial support, and infrastructure construction to create a favorable environment for CBEC. For example, preferential policies such as verified collection of CBEC income tax have been introduced, and the inspection-before-shipment model for CBEC export less than container load has been promoted to improve customs clearance efficiency and cut enterprise costs. Leveraging industrial, location, and policy advantages, Shenzhen has built a 1 + 2 + 6 + N system, promoting compliant operations and supporting overseas warehouse and independent site construction. In 2024, its import and export volume reached CNY 372 billion, ranking first in China for three consecutive years and making it a pioneering model for CBEC. After years of development, China’s CBEC has evolved from initial pilot exploration to the stage of in-depth development. Its share in China’s goods trade imports and exports has risen from 1% in 2015 to 7.8% in 2024. Playing an increasingly vital role, it has become a key driver for the vigorous growth of the urban entrepreneurial ecosystem.

3.2. Research Hypothesis

Theoretically, being an outlet for opening up, the CBEC has created extensive pilot zones, provided policy preferences to pilot cities, reduced the institutional costs of entrepreneurship, and attracted numerous entrepreneurs to engage in it. The CBEC has promoted the integration of CBEC and industrial clusters, greatly facilitated the transition of traditional foreign trade, and subtly enhanced cities’ appeal to new foreign trade formats, forming a positive cycle of policy dividends, talent agglomeration, and industrial upgrading at length. By leveraging policy empowerment to lower the entrepreneurship threshold, fostering an industrial ecosystem to expand entrepreneurial scenarios, the CBEC has formed a two-way cycle with urban entrepreneurial activities, ultimately exerting a notable improvement in entrepreneurship at an urban scale [2]. To be specific, by steadily reducing the entrepreneurship threshold, cultivating the industrial ecosystem, and aggregating innovative factors, the CBEC has greatly stimulated urban entrepreneurial activities, to some extent creating diversified market entities and innovative formats. In the meantime, the advancement of urban entrepreneurship has, in turn, fed back into the upgrading of the CBEC industry, driving the formation of differentiated competitive advantages and sustainable development capabilities. More importantly, the open entrepreneurial ecosystem built by the comprehensive pilot zones exhibits a self-reinforcing feature. Market opportunities brought by policy pilots have attracted the inflow of professional talents, and the integration of talents and industries has further improved the entrepreneurial environment. This positive feedback continuously stimulates urban entrepreneurial activities in CBEC-related fields. Yet, amid its rapid expansion, the CBEC has inevitably generated a suite of negative externalities, imposing potential strains on regional economic ecosystems, social welfare, and environmental sustainability. First, the competitive crowding-out effect on local brick-and-mortar enterprises. Second, the substitution effect on traditional shopping paradigms and the disruptive impact on physical commercial formats. Third, environmental pressures stemming from the scaling-up of logistics networks. Fourth, transition costs associated with structural adjustments in the labor market. Recognizing the negative externalities of the CBEC does not amount to a negation of its positive contributions to economic and social development; instead, it serves to underpin a more comprehensive and objective evaluation of the holistic implications of its advancement. In summary, the CBEC can effectively activate local entrepreneurial potential, and the prosperity of the entrepreneurial ecosystem further strengthens cities’ competitiveness in the CBEC sector, ultimately achieving the synergistic resonance between policy dividends and market vitality. Therefore, we state that the assertion that follows should be further inspected:
Hypothesis 1 (H1).
The CBEC scheme exhibits a positive benefit on urban entrepreneurship.
The CBEC not only directly boosts entrepreneurship but also propels entrepreneurial development through the dual wheels of talent agglomeration and industrial structure upgrading by virtue of policy advantages. The specific manifestations are as follows:
First, by improving the talent policy system, strengthening talent cultivation and introduction, and building entrepreneurial incubation platforms, the CBEC has effectively promoted talent agglomeration and entrepreneurial development. Through optimizing talent policies, the CBEC attracts domestic and foreign CBEC professionals. These talents, with rich industry experience, advanced technical knowledge, and keen market insight, provide intellectual support for entrepreneurship. Relying on policy dividends such as tax incentives and customs clearance facilitation, the CBEC significantly reduces the institutional costs for entrepreneurship, attracting the accelerated inflow of talents, funds, and technologies [8]. Meanwhile, through the linkage of government-enterprise-university, it builds a closed-loop training system for CBEC talents to cultivate professionals meeting market demands. In addition, pilot zones actively build entrepreneurial incubation platforms, providing spaces for talent practice and innovation and stimulating entrepreneurial enthusiasm. Various exchange activities and forums are held to create a strong entrepreneurial atmosphere and promote communication and cooperation among talents. Talent agglomeration directly provides key support for entrepreneurial activities. To be specific, entrepreneurs quickly form professional teams, reducing the trial-and-error costs of entrepreneurship caused by talent shortage. In addition, communication and collaboration among talents will spawn new entrepreneurial models. These measures not only provide strong intellectual support for the CBEC industry but also drive the coordinated development of related industries, to some extent enhance economic vitality and competitiveness, and then attain high-quality development for the CBEC at an urban scale.
Hypothesis 2 (H2).
The CBEC promotes entrepreneurship through talent agglomeration.
Second, by advancing industrial structure upgrading, the CBEC creates a favorable ecosystem for entrepreneurship, thereby lifting entrepreneurial activities. With the CBEC as the core, pilot zones direct the evolution of conventional sectors regarding digitalization and intelligentization, offering broader development space for entrepreneurs. To be more precise, through policy guidance and resource integration, pilot zones promote the upgrading of traditional trade firms, adapting to CBEC requirements, helping them expand international markets. Meanwhile, they actively foster service industrial chains covering logistics, finance, big data, and other fields. Then, entrepreneurs can rely on these supporting services to lower the threshold for entrepreneurship [21]. At the industrial level, pilot zones propel in-depth integration of traditional industries with the CBEC, expanding entrepreneurial tracks, and improving industrial chains. They also promote the agglomeration of emerging formats like live-streaming, e-commerce, and cross-border logistics, forming an industrial ecosystem with upstream-downstream linkage. More importantly, industrial structure upgrading to some extent brings diversification. By building innovation and entrepreneurship platforms, pilot zones encourage entrepreneurs to launch innovative firms along the CBEC industrial chain’s upstream and downstream. That being the case, it not only meets the diverse market demands but also provides new opportunities and tracks for entrepreneurs. Through industrial structure upgrading, pilot zones achieve industrial coordinated development, greatly optimize resource allocation, offering abundant application scenarios and broad market space for entrepreneurs eventually. Then, it spurs the solid development of CBEC entrepreneurship and contributes to the high-quality growth of regional economies.
Hypothesis 3 (H3).
The CBEC promotes entrepreneurship through industrial structure upgrading.
Pilot cities take the lead in trials, developing mature models in optimizing customs clearance processes and facilitating cross-border payments. These replicable experiences spread to neighboring cities through inter-governmental exchanges and cross-regional business layout. Neighboring cities can directly draw on the institutional innovations and operational experiences from pilot cities, greatly reducing the policy adaptation costs and market access thresholds for entrepreneurship. Meanwhile, key resources aggregated in pilot cities due to the CBEC extend to surrounding areas based on geographical proximity, creating a radiating effect [18]. To be specific, large cross-border logistics hubs in pilot cities may expand services to neighboring cities, lowering warehousing and distribution costs. Until then, the CBEC platform resources in pilot cities may also enable entrepreneurs in adjacent areas to connect with overseas markets more conveniently. In addition, overseas market demand data and product selection experience accumulated by pilot cities flow to surrounding regions through industrial chain collaboration, helping local entrepreneurs better grasp market opportunities accurately. From the perspective of entrepreneurial ecosystem linkage, the entrepreneurial ecosystem formed by the CBEC in pilot cities generates cluster spillover through geographical proximity. This linkage reduces information gaps in entrepreneurship in neighboring areas, allowing more entrepreneurs to launch ventures in proper fields by leveraging the core advantages of pilot cities. Driven by the dual effects of resource sharing and experience emulation, the entrepreneurial ecosystems of neighboring cities improve rapidly, ultimately forming a pattern where pilot cities lead and surrounding cities follow in enhancing entrepreneurial activities.
Hypothesis 4 (H4).
The benefit of the CBEC scheme on entrepreneurship exhibits a spatial spillover effect. It not only promotes entrepreneurship in the local region but also stimulates the motivation of imitation and research linking nearby regions, further enhancing the entrepreneurial level of adjacent cities.
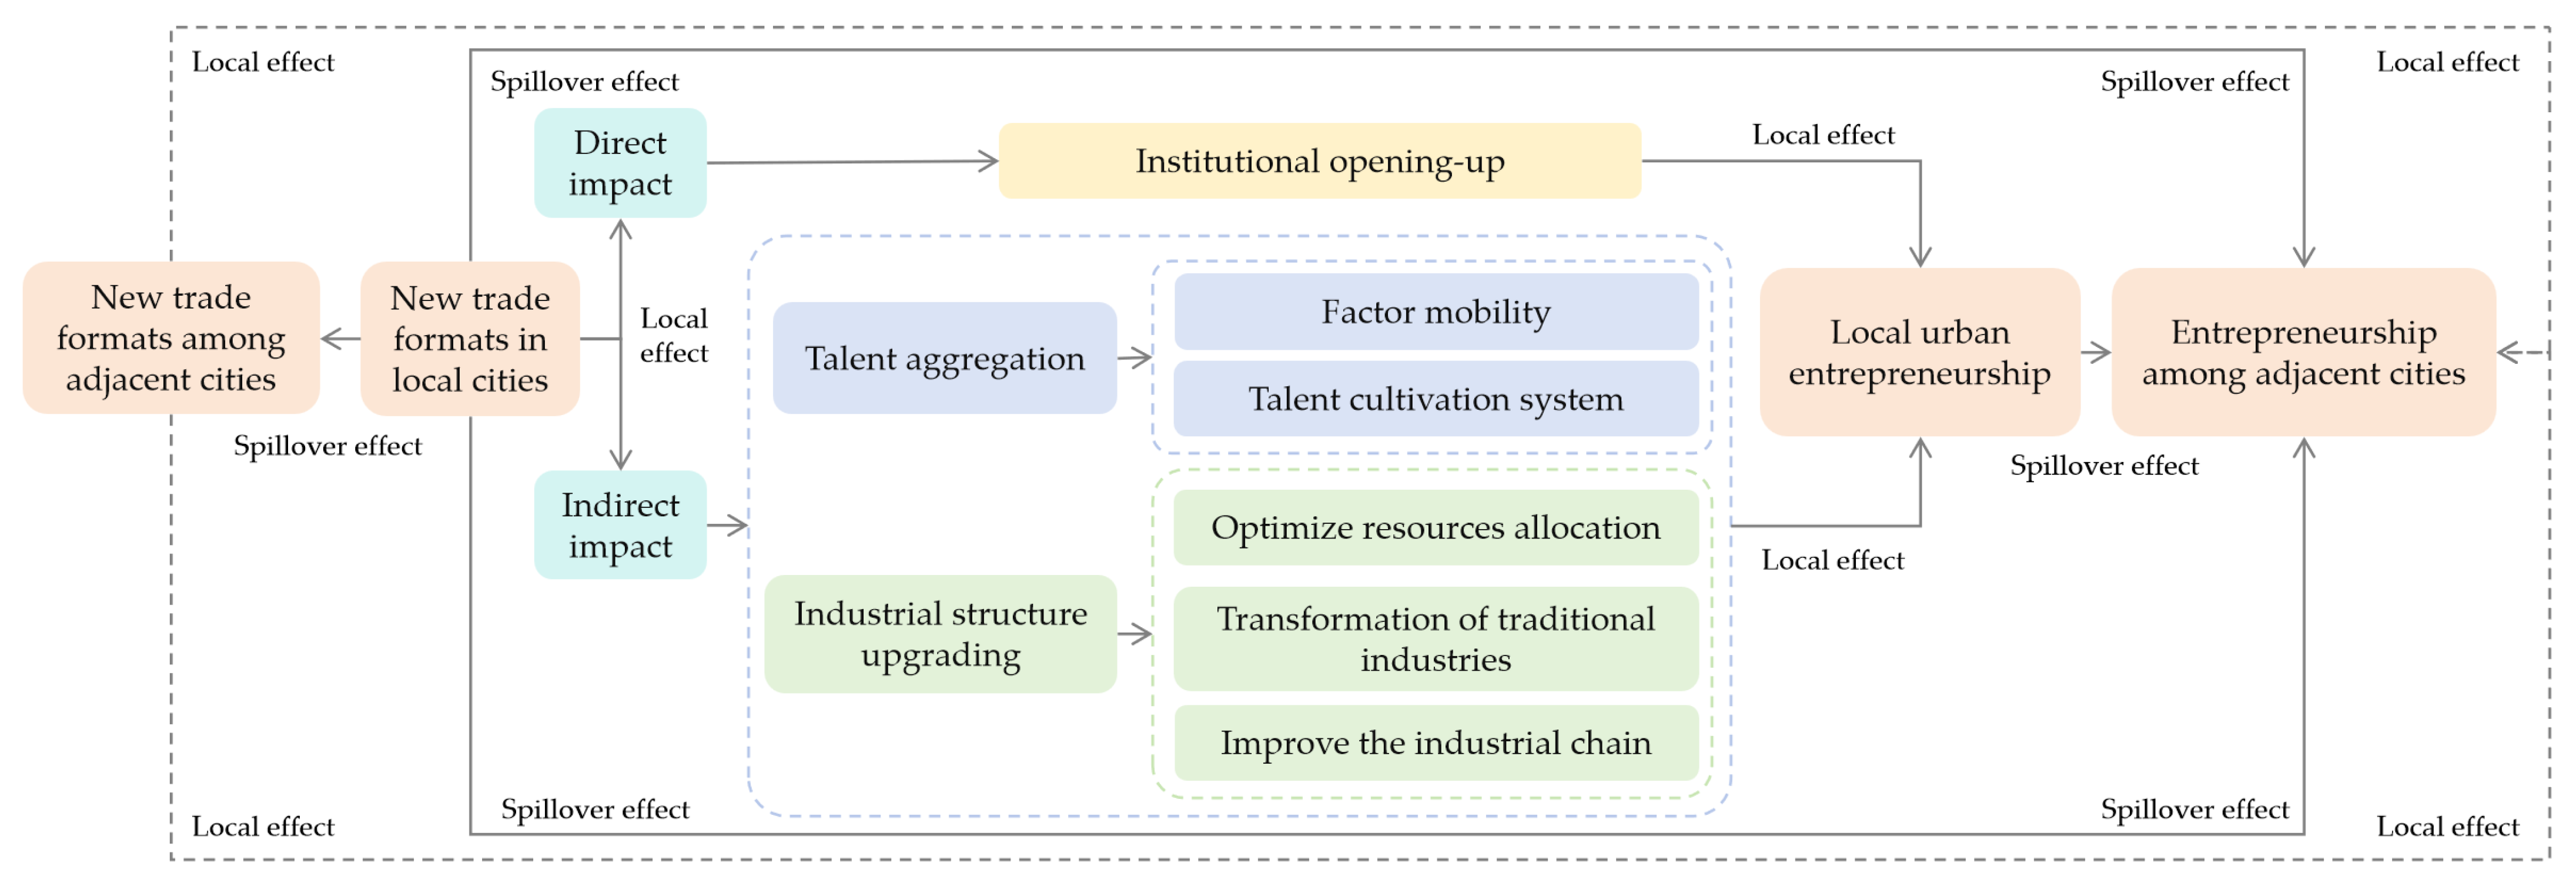
To sum up, following the theoretical analysis stated above, the analytical framework of how the CBEC affects urban entrepreneurship can be exhibited in Figure 3.

4. Research Design

4.1. The Basic Econometric Framework for Pilot Policy Evaluation

On the whole, this paper chiefly exhibits how the CBEC scheme affects Entrep at the prefecture level. Given the diversities in the launch times for the CBEC pilot cities, we specify the starting years for five CBEC batches as 2015, 2016, 2018, 2019, and 2020, respectively. It must be stated that the traditional DID estimation method for the CBEC may lead to regression bias [47]. Therefore, noticing the quasi-natural experiment features for the CBEC, we employ a multi-stage DID strategy, in a finer way, to reveal the benefits for the CBEC on Entrep at an urban scale. The particular model structure can be expressed below:
Entrepit = α + β × E_didit + θ × Controlit + δi + ηt + εit
As noted in Model (1), the variables t and i are the year and the area, respectively. Meanwhile, all variables, as specified in Model (1), are defined as follows: First, the dependent variable, Entrepit, represents entrepreneurial activity at an urban scale, which is obtained by counting the number of newly established firms across each city. Second, the main independent variable related to the CBEC is E_didit, which is derived by combining policy indicators with specific time indicators. Third, the symbol for Control denotes some control variables at an urban scale, such as industrial composition (Indus), population density (Midu), financial development level (Finan), scientific and technological progress (Tech), human capital level (Hum), and fiscal expenditure (Fiscal). For clarity, the coefficients α, β, and θ correspond to the regression parameters specified in Model (1). Specifically, the coefficient β exhibits the benefit for the CBEC on entrepreneurial activities in urban areas. To be specific, a positive β means that the CBEC promotes urban entrepreneurial activities to a certain extent, while a negative β implies that the CBEC may hinder entrepreneurial activities. In addition, δi captures the individual fixed effect (City FE), while ηt explains the effect over time (Year FE). More importantly, εit corresponds to the random error term declared in Model (1).

4.2. Variable Selection and Description

4.2.1. Explained Variable: Urban Entrepreneurship (Entrep)

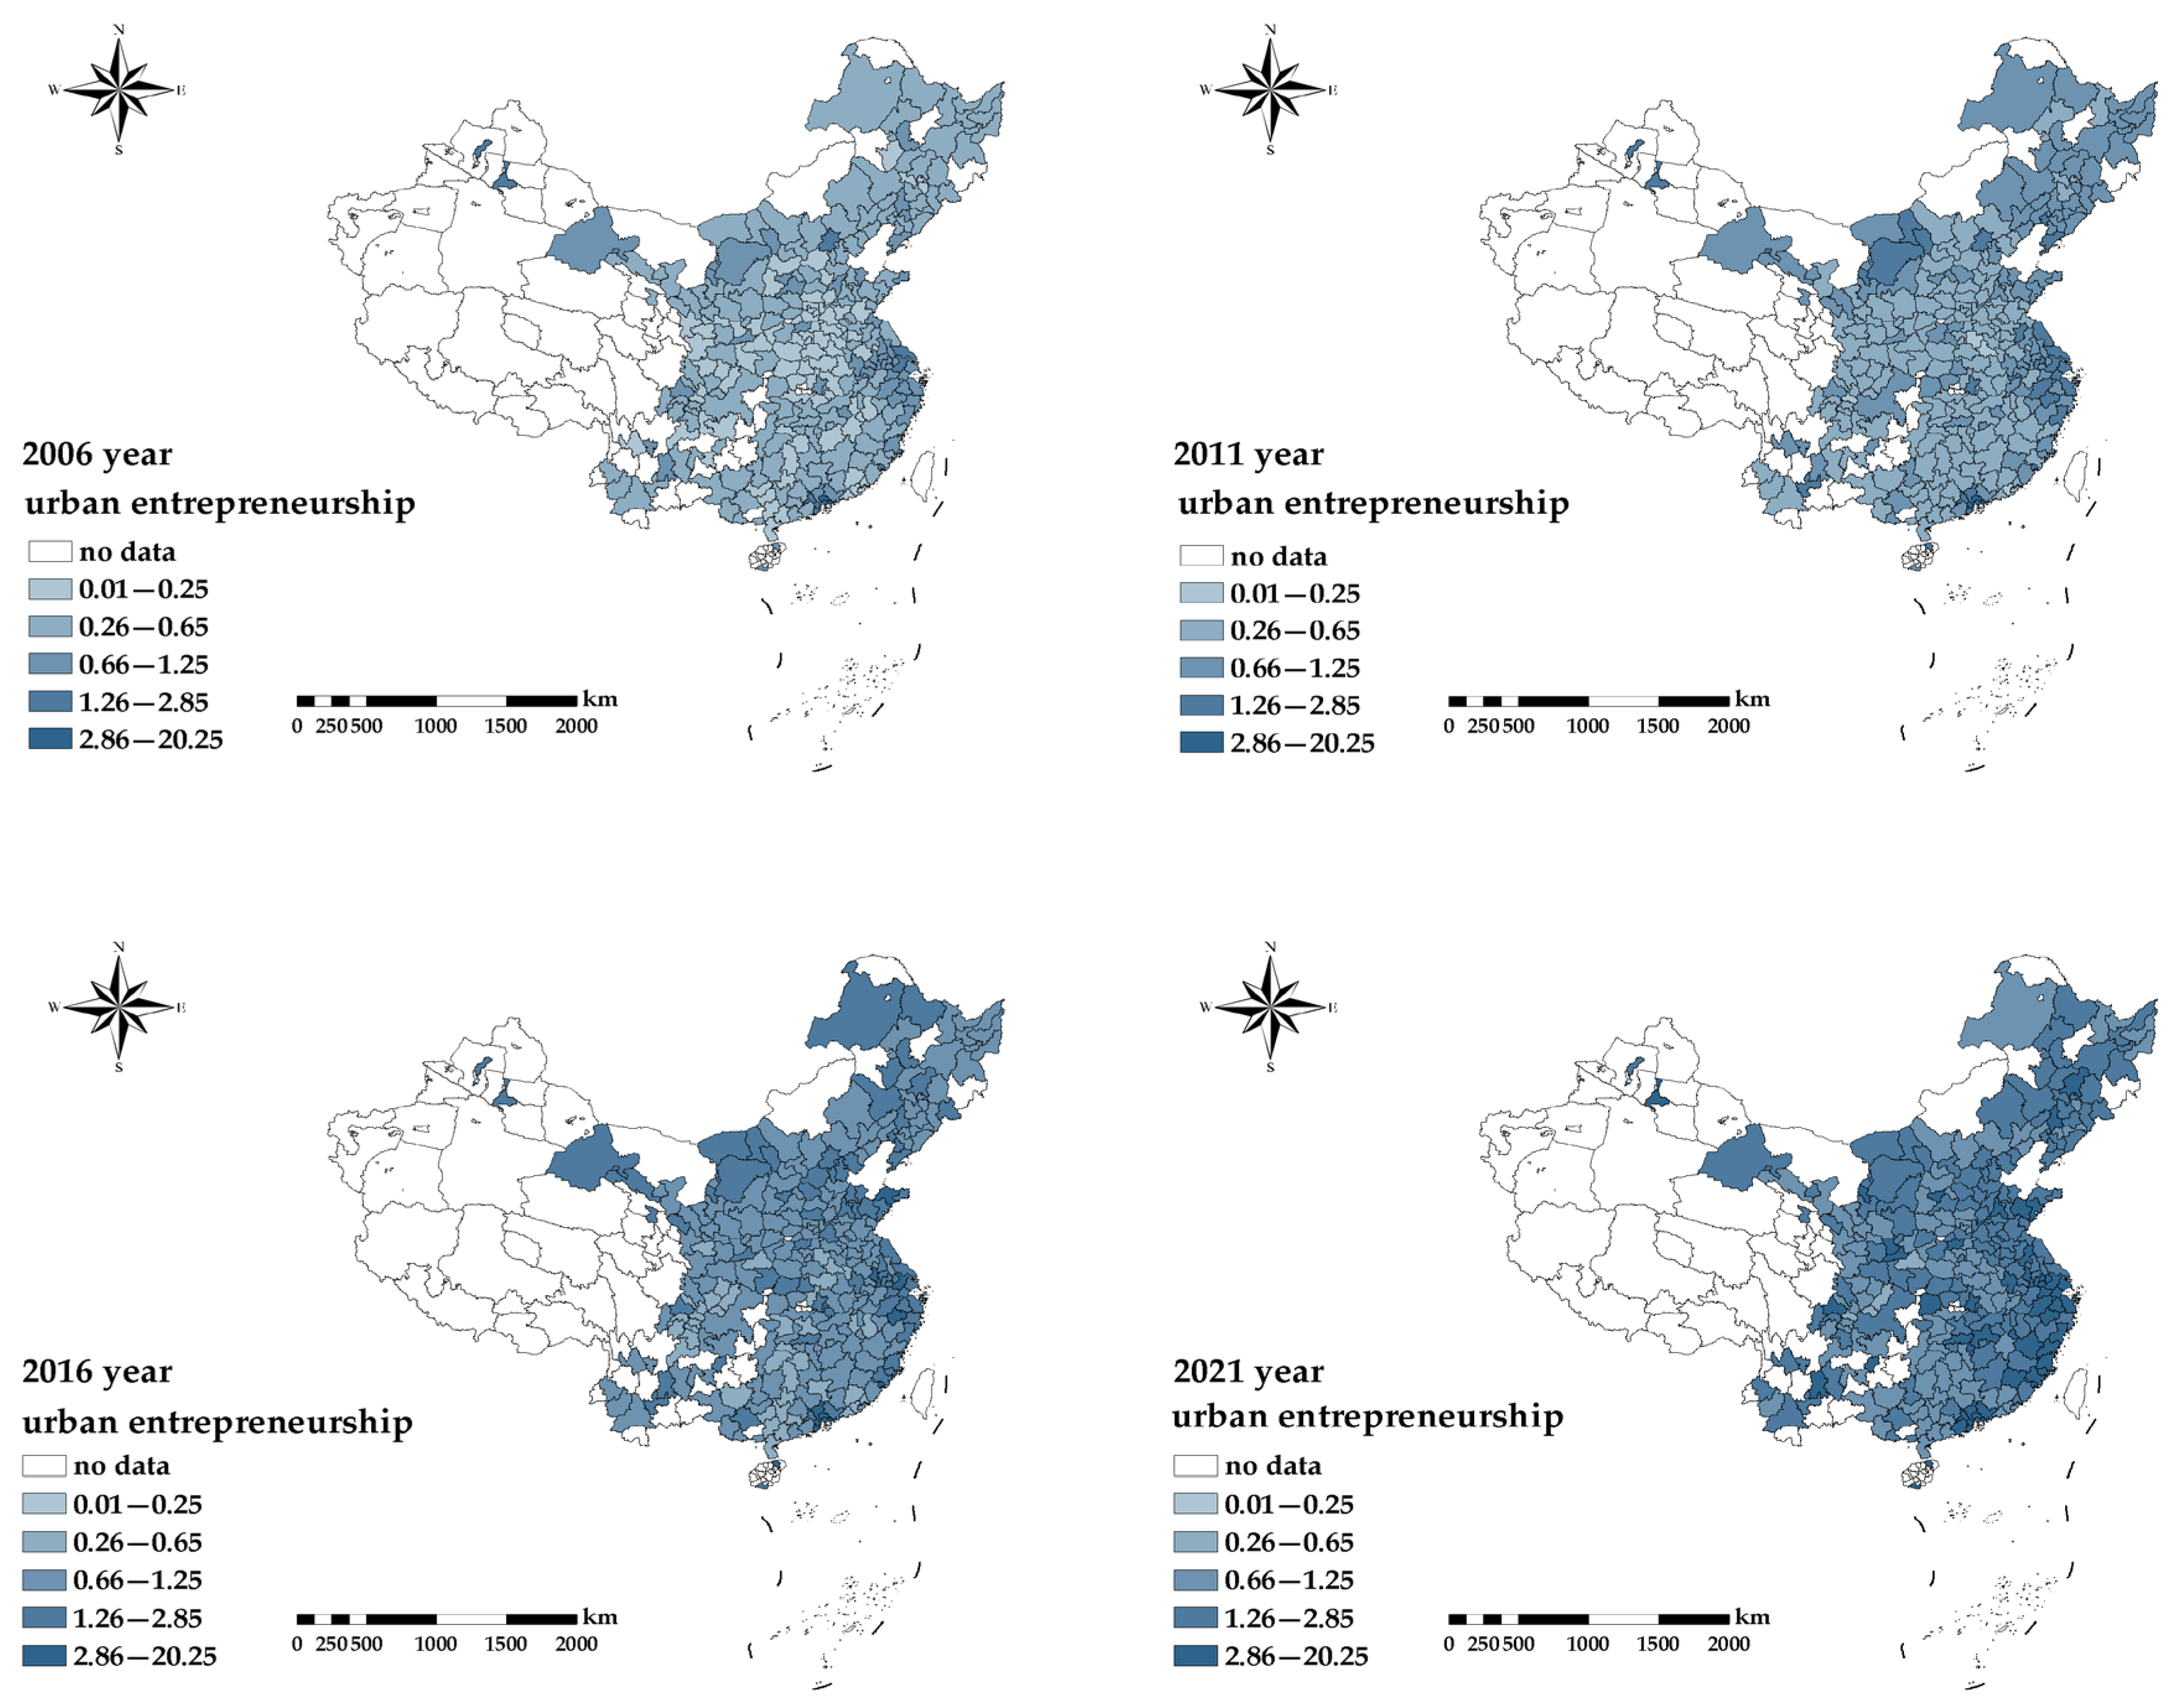
It is well known that empirical analysis requires similar, accessible, and reliable data. There are many ways to reflect the entrepreneurial activities at an urban scale, and in this paper, the number of newly established firms across each area is selected as the indicator for urban entrepreneurship (Entrep). To be specific, we obtained the original underlying data of industrial and commercial registered firms released by the bureau SAMR in China. This dataset covers detailed statistics about newly established firms, such as corporate code, industry type, registered address, date of establishment, and company capital. Using the information for these firms mentioned above, we cleaned and matched the data and obtained the total amount of newly established firms across 282 cities spanning 2006–2021, as exhibited in Figure 4. To enhance the robustness of the study, by converting the original dependent variable to the count of start-ups per kilometer (Entrep-km) and the count of start-ups per 100 people (Entrep-100), we conduct a re-estimation of the regression. Specifically, all absolute indicators presented in Model (1) have been subjected to logarithmic transformation [18]. This indicator offers an empirical data basis for detecting the spatial distribution characteristics of urban entrepreneurship.

4.2.2. Key Explanatory Variable: Cross-Border E-Commerce Policy (CBEC)

Up until now, the Chinese State Council has established seven batches of the CBEC pilot cities. Given that the sample noted in Model (1) spans the years 2006–2021, this paper selects the first five batches of pilot cities for empirical analysis. To be precise, we define the implementation periods of the first five bunches for the CBEC scheme as 2015, 2016, 2018, 2019, and 2020, respectively. For the full sample, to a greater extent, it notably exhibits a challenge to differentiate the control set noted in Model (1) from the trial set when applying a conventional DID technique, thus failing to disclose the real effects for the CBEC. Therefore, we use a multi-period DID strategy, even more so, to properly detect the benefits for the CBEC on entrepreneurship at an urban scale [38]. First, a policy dummy variable (PD) is set according to the implementation time of the CBEC. Specifically, if a city has implemented the CBEC, it is classified into the treatment set, and then its value for PD is defined as 1 accordingly; otherwise, the city is classified into the control set, with a zero for PD. Second, the policy execution year serves as the base year when creating the time dummy variable (TD) for the CBEC scheme. At an urban scale, the value of TD is defined as 1 for the base year and any following periods; if not, its value is defined as 0. Further, we create an interaction term at a local scale between PD and TD, which to some extent reflects the variable E_did, as depicted in Model (1).

4.2.3. Control Variables

It must be admitted that urban entrepreneurial activities will be impacted not just by the CBEC but also by population variations and economic conditions at a municipal level. To fully consider these possible impacts and reduce estimation errors, we included several control variables in Model (1), including industrial structure (Indus), population density (Midu), financial sector development (Finan), scientific and technological progress (Tech), human capital stock (Hum), and fiscal expenditure level (Fiscal). To be more precise, the industrial structure (Indus), in a finer way, is reflected primarily through the degree of the secondary sector in GDP across each city. The population density (Midu) is mainly expressed by dividing the number of permanent residents at the city scale by the area of the administrative zone (unit: square kilometer) across each city. The financial development (Finan), to be precise, is exhibited by the loan balance of financial institutions. More notably, the degree of science and technology spending (Tech), to a great extent, is ideally reflected by the proportion of fiscal science and technology costs to total fiscal expenses. At an urban scale, human capital (Hum) is more accurately quantified by the number of enrolled university students across each city. Fiscal expenditure level (Fiscal), in a finer way, is mainly exhibited by the fraction of total fiscal expenses against the city’s GDP.

4.3. Source and Handling of Data

As all noticed, testing empirically desires similar, accessible, and reliable data. Therefore, to build a complete dataset covering 2006 to 2021, we carefully matched CBEC data with prefecture-level area datasets based on the verification of Model (1) and finally obtained a list of 282 cities across 29 provinces in mainland China, with some cities lacking data. Specifically, China Statistical Yearbooks at an area scale, China City Statistical Yearbooks at a city scale, and the EPS Database are the primary origins of our dataset applied for empirical testing. The number of newly founded firms is obtained from the industrial and commercial registration database (ICRD). To a great extent, the ICRD, including basic records such as corporate name, industry type, registration address, date of establishment, and company capital across each newly registered firm, is acquired from the State Administration for Market Regulation. After cleaning and matching the dataset, the number of newly founded firms across 282 prefectural cities spanning 2006–2021 is obtained, which is then standardized using the population method. Notably, we used linear interpolation to complete some missing data, and all absolute variables presented in Model (1) are log-transformed. As noted in Table 1, we obtained 4512 observations at the city level used for regression.

5. Research Findings and Discussion

5.1. The Temporal Evolution Trend of Urban Entrepreneurship in China

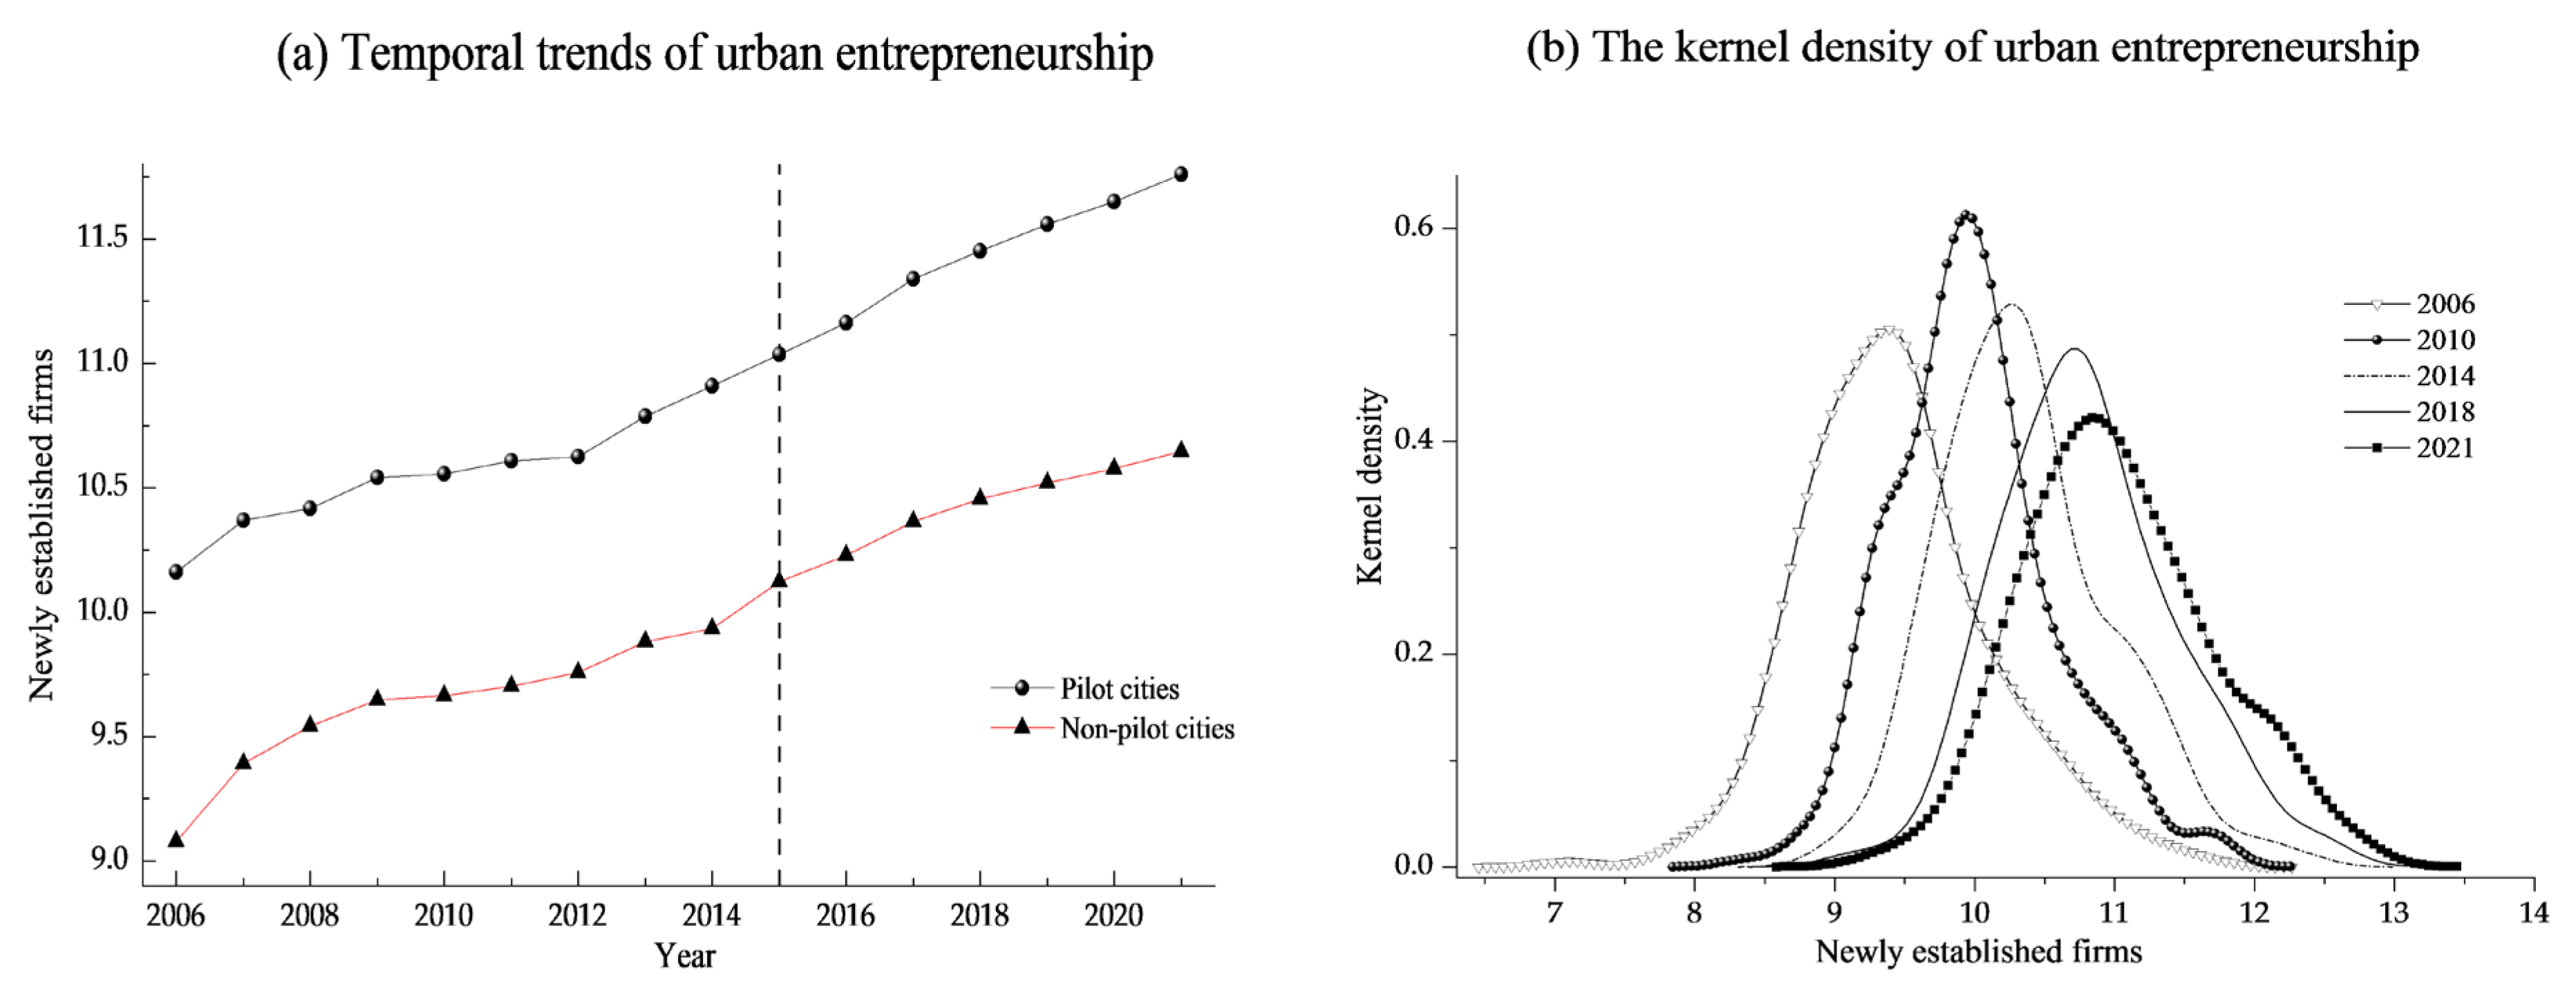
To deeply detect the discrepancies in urban entrepreneurial activities in China during 2006–2021, the paper visually demonstrates the temporal tendencies and dynamic evolutionary characteristics of such activities by constructing an entrepreneurial change trend graph and a kernel density graph. The trend data presented in Figure 5a reveal that the entrepreneurial scale in both pilot and non-pilot regions has maintained a steady upward momentum over time. This phenomenon implies that as policy dividends are continuously unleashed, the resource elements essential to urban entrepreneurship have been increasingly concentrated, the entrepreneurial ecosystem has been refined on a constant basis, and thus the robust development of entrepreneurial practices has been effectively boosted. Furthermore, the kernel density graph in Figure 5b sheds light on the evolutionary patterns of urban entrepreneurial activities. The yearly kernel density curves move rightward progressively, which signals a steady rise in entrepreneurial activities—a finding that aligns well with the tendency reflected in Figure 5a. Collectively, these results offer solid empirical evidence for clarifying the dynamic variation trends governing urban entrepreneurial activities.

5.2. Benchmark Regression Analysis

Considering the theoretical framework, the CBEC effectively fosters entrepreneurship on an urban scale. To verify the premise stated above, as illustrated in Table 2, we empirically detect how the CBEC scheme affects urban entrepreneurship by sequentially adding control variables. Among them, Columns (1) and (2) briefly exhibit the outcomes for the pooled ordinary least squares (OLS) strategy coupled with the two-way fixed effects technique noted in Model (1) without control variables, respectively. The treatment variable for the CBEC (E_did) shows a positive regression coefficient at the 1% level, subtly suggesting the CBEC notably enhances entrepreneurial activities. Considering the influence of economic, technological, and other characteristics on entrepreneurial activities at an urban scale, the study further adds all control variables listed in Model (1), including industrial structure, population density, financial level, technological expenditure level, human capital stock level, and fiscal expenditure level. As noted in Column (3), at the 1% level, the CBEC treatment variable’s coefficient remains significantly positive. More notably, Columns (4) to (6) present the fixed effects models with only time effects, only city effects, and two-way fixed effects incorporating both city and year, respectively. The regression outcomes reveal that, from a statistical view, the coefficient for the CBEC (E_did) stays still considerably positive and greatly echoes the insights from Penco et al. [21], which confirmed that cross-border business ecosystems notably stimulate entrepreneurship at the city level. To be brief, the findings subtly reveal that urban entrepreneurship is notably enhanced by the CBEC, thereby validating Hypothesis 1 (H1).

5.3. Parallel Trend and Placebo Tests

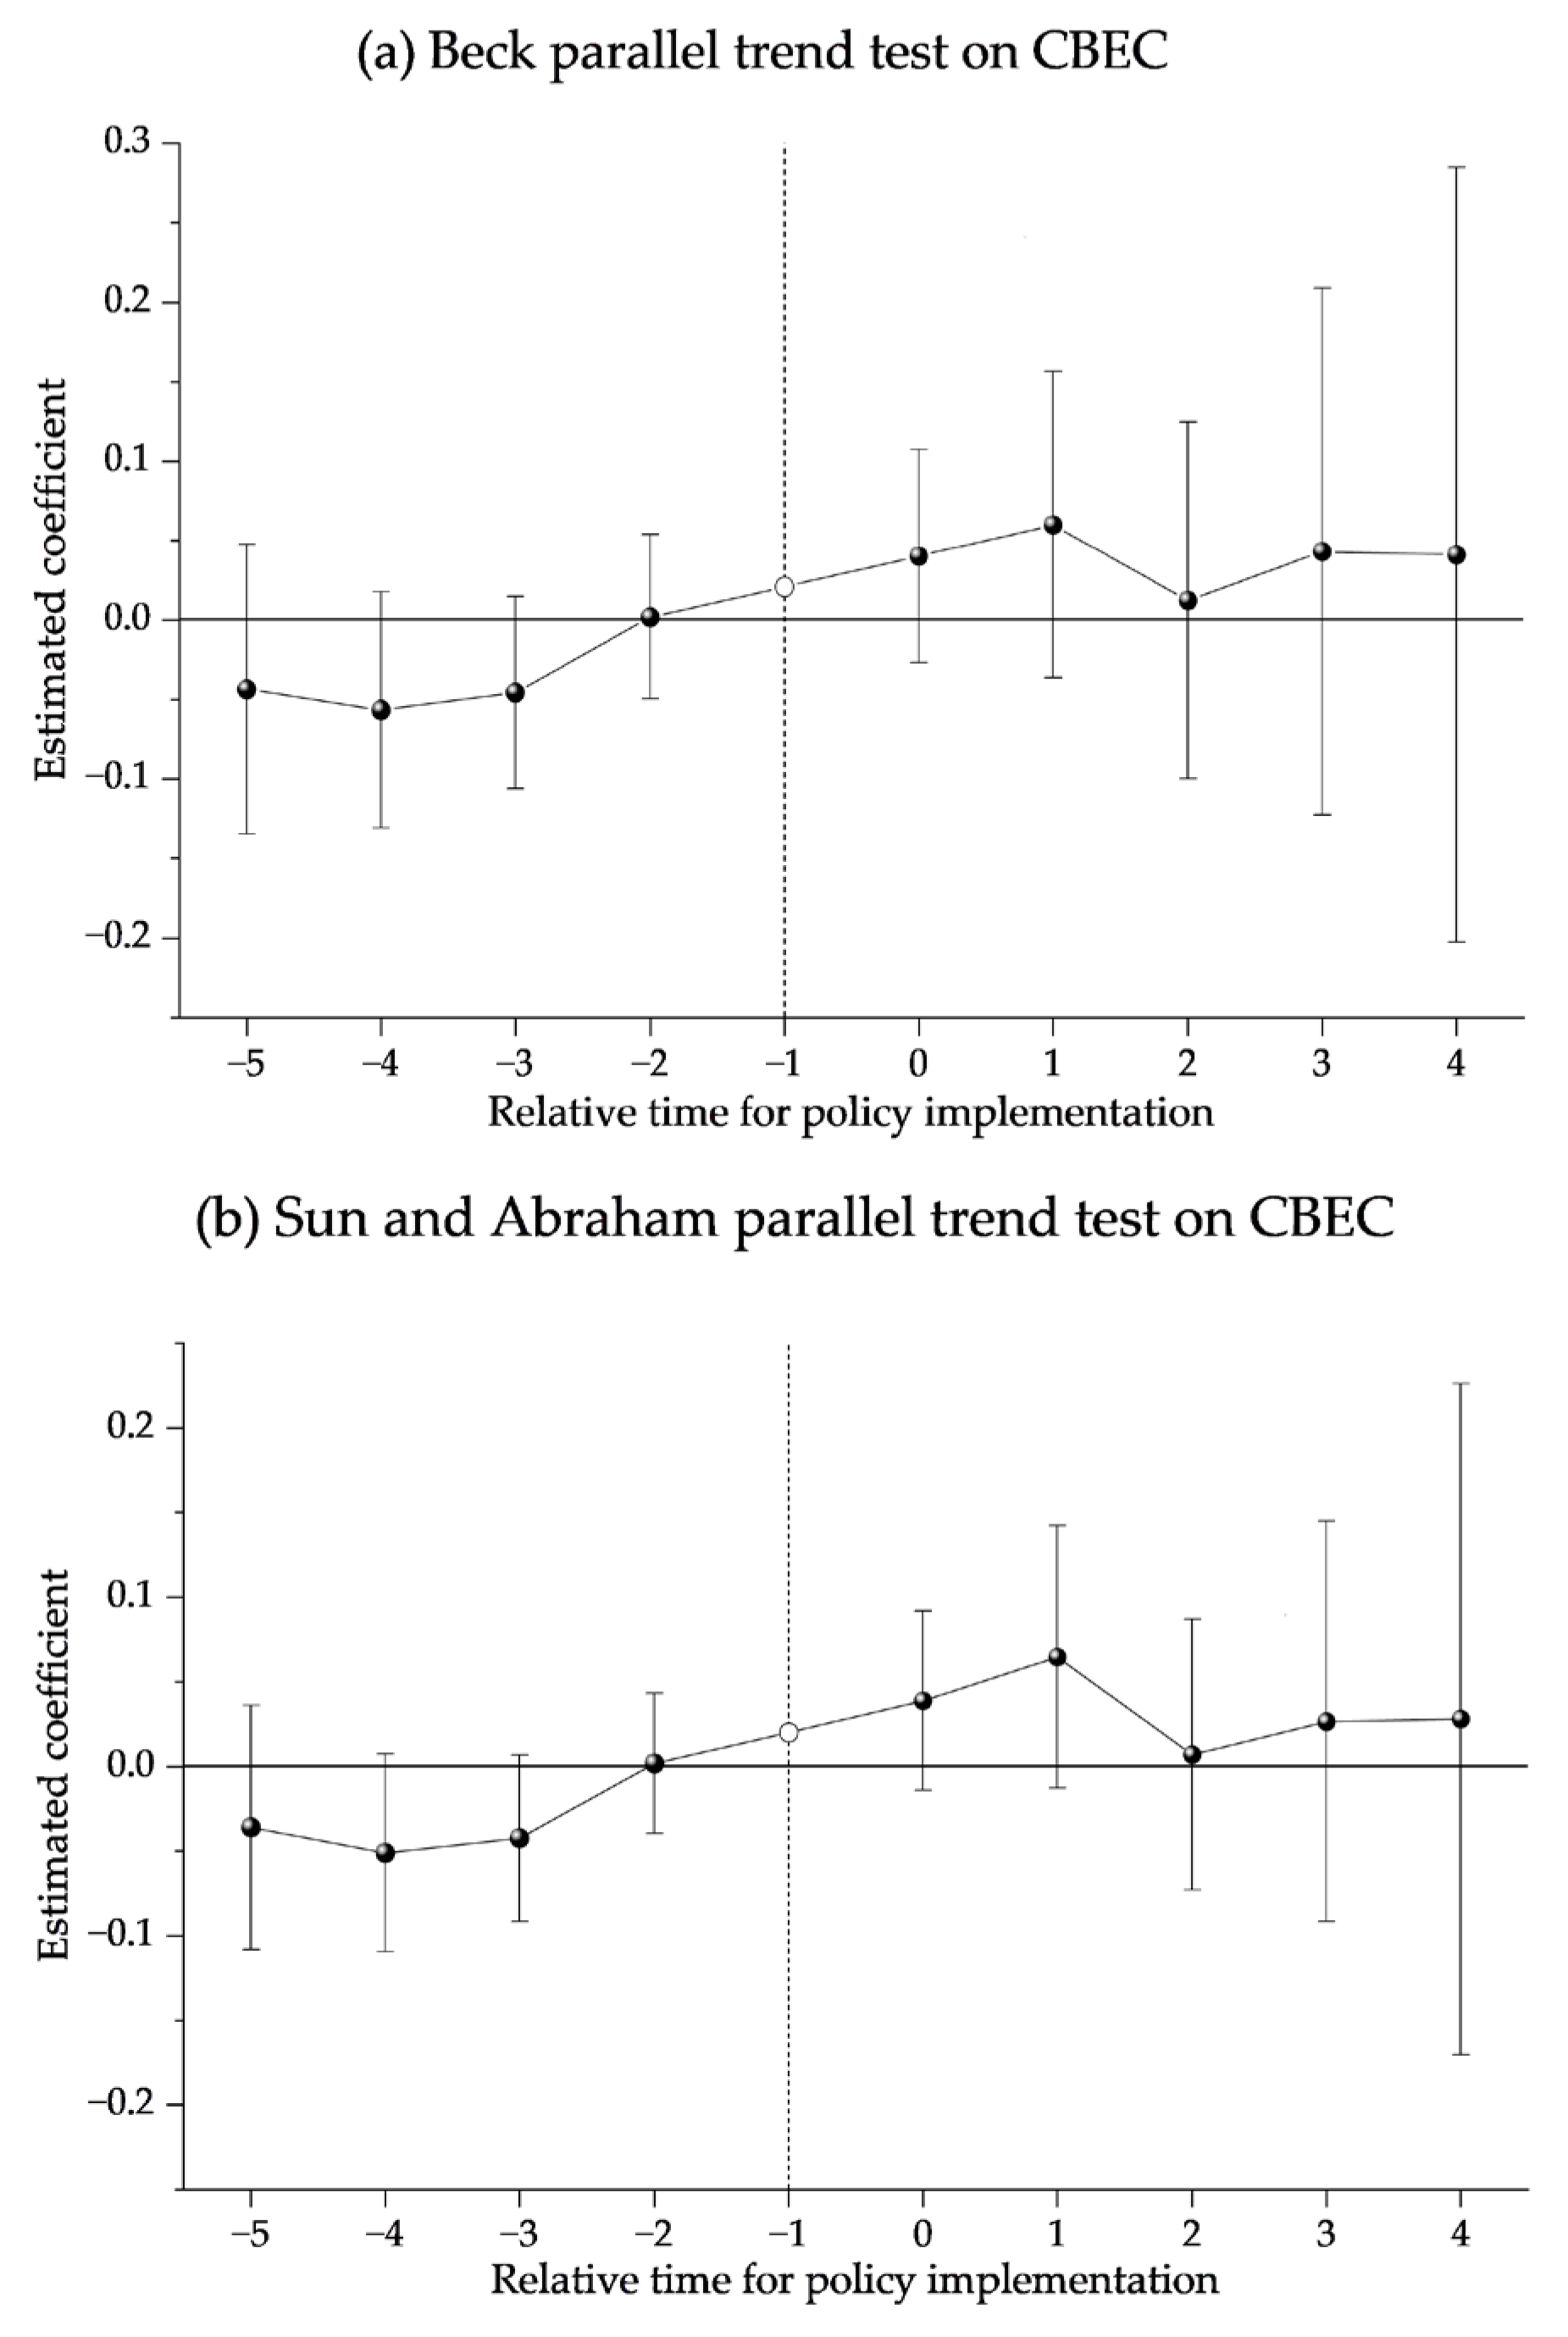
All the more so, to subtly prove the results of basic estimation clearly stated in Table 2, we perform in-depth inquiry via parallel trend and placebo tests, with findings presented in Figure 6 and Figure 7.
In theory, the parallel trend testing for CBEC policy treatment effects is robust and reliable as long as no substantial difference is detected between the matched and pilot bunches before the CBEC plan execution. Hence, following Beck et al. [47], in a superior way, we apply the event study technique to explore the CBEC’s dynamic effects, as shown in Figure 6a. All coefficients of time dummy variables before CBEC implementation are insignificant, indicating no discernible change in the trends of entrepreneurship between the two groups pre-policy intervention—thus validating the assumption of parallel trend. Given the policy’s multi-phase implementation, potential persistence of prior effects may contaminate the parallel trend test results. To enhance test validity, this study further conducts a robustness test using Sun and Abraham’s technique [48], and the outcomes are illustrated in Figure 6b. To be specific, it is observed that estimated coefficients are insignificant in the five periods before the pilot policy, and estimators still fluctuate around zero. Moreover, the post-policy effect magnitude is largely consistent with the estimator in Figure 6a. Regardless of the method used, no significant pre-policy coefficient differences are detected. That being the case, it discloses a stronger common trend between the two bunches (matched and trial), further confirming the parallel trend assumption.
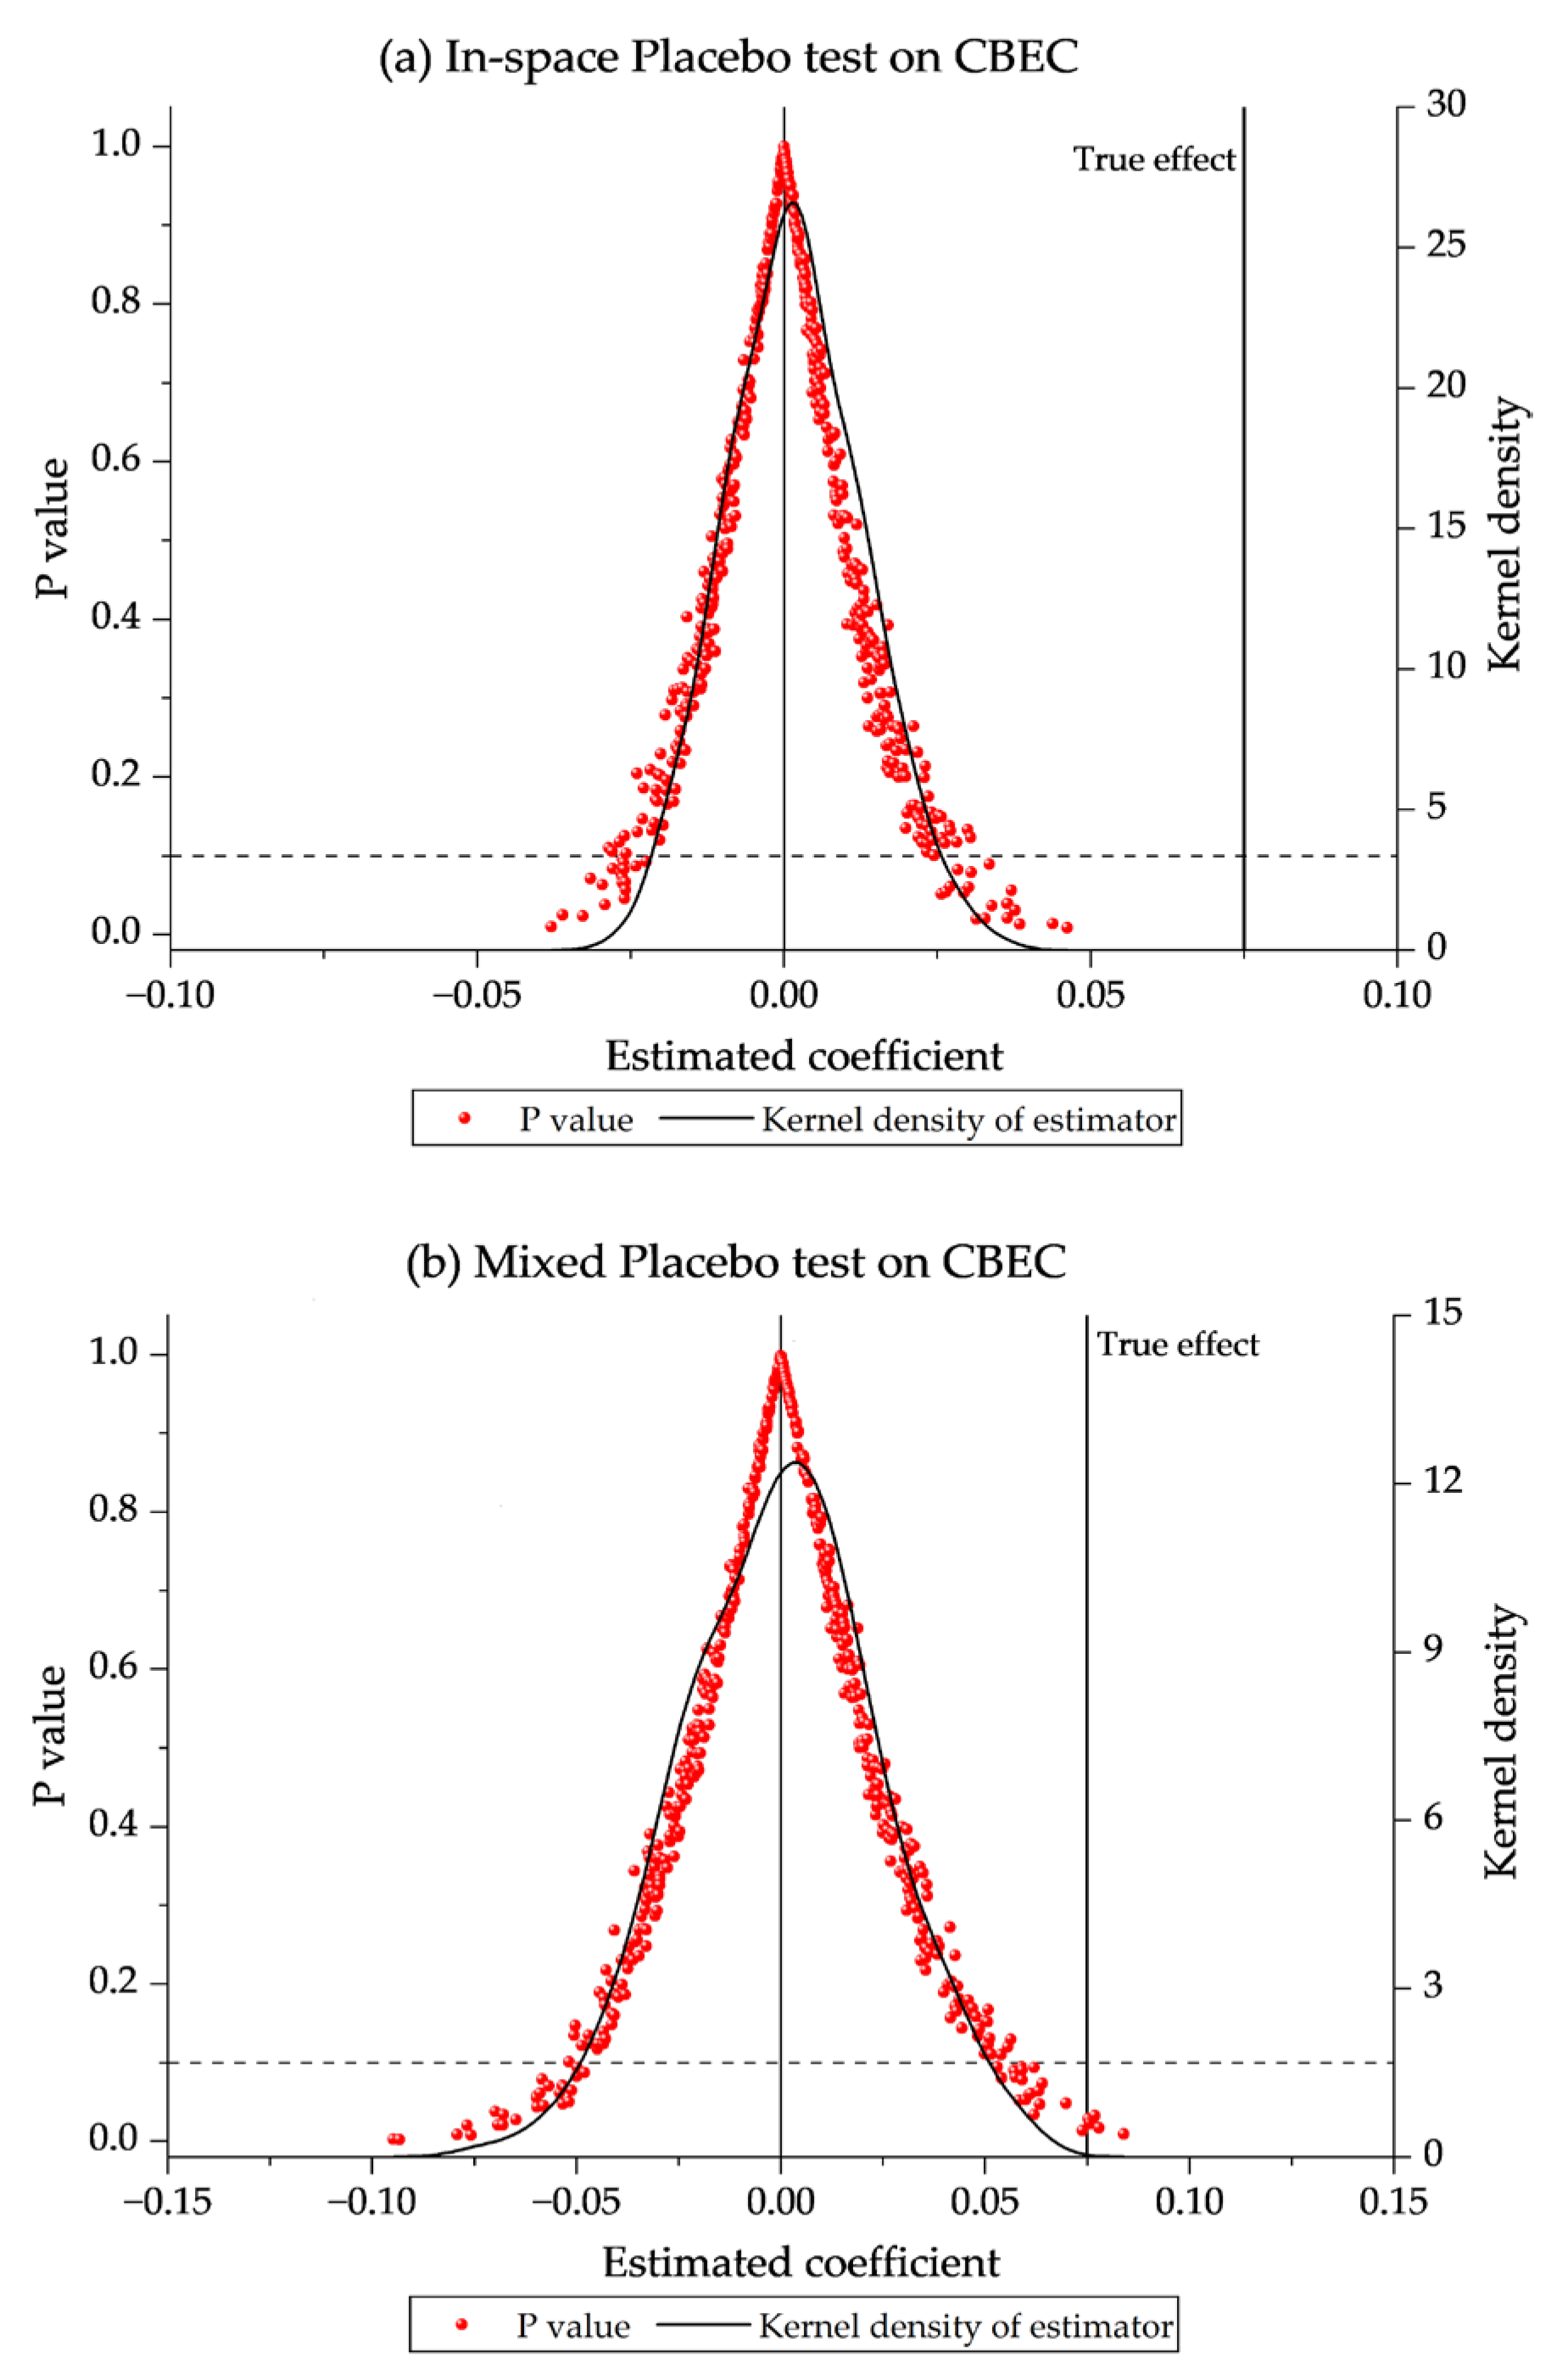
To mitigate the interference of omitted variables or other policies on the true effect of the target policy, consistent with Gross’s method [49], we perform a placebo test. To improve the test’s validity, 500 samplings are performed on the original sample in this research, with results displayed in Figure 7a. To further strengthen the reliability and precision of conclusions and ensure that the outcomes are not spurious correlations caused by time trends, sample selection, or other unobservable factors, this study carries out a mixed placebo test with reference to the method proposed by Eggers [50]. By randomly assigning both individual units and time periods simultaneously, we construct a more stringent counterfactual scenario. We also perform 500 samplings on the original sample under this scenario, with relevant results displayed in Figure 7b. To be specific, as evidenced by the results disclosed in Figure 7a,b, from a statistical view, the effects for pseudo-treatment groups differ substantially from the true effects. More importantly, most coefficients for pseudo-treatment groups are statistically insignificant and generally tend to follow a normal distribution around the zero line. Based on these findings, the outcomes derived from the baseline regression are further validated.

5.4. Robustness Analysis

For the sake of addressing possible flaws in the models, data, and findings utilized during the study process, as well as boosting the credibility of the policy treatment effect, six strategies are applied to validate the robustness of CBEC’s effects referred to in the baseline testing. To be more precise, Table 3 presents the details of these methods and the corresponding results.
Firstly, adjust the estimation strategy. Specifically, to further demonstrate the distinction between the CBEC pilot areas and non-pilot areas, we apply a propensity score matching strategy in a finer way, combined with the DID technique (PSM-DID), to jointly attain a robustness check for the basic results detected above [51]. Meanwhile, with control variables minutely stated by Equation (1) being designated as matching covariates, we subtly employ the nearest neighbor matching method to match the trial bunch with a better-fitted control bunch, thereby addressing issues caused by sample selection bias. After re-matching the control and trial bunches, we conduct the regression analysis again with the matched data. That being the case, the results yield a positive coefficient of 0.060 from a statistical view, in a finer way, which further corroborates the robustness of baseline conclusions disclosed by Model (1).
Secondly, substitute the dependent variable (Entrep). To be more precise, by converting the original dependent variable listed in Model (1) with the count of start-ups per kilometer (Entrep-km) and the count of start-ups per 100 people (Entrep-100), we conduct a re-estimation of the regression. At the 1% level, even more so, the estimated findings for the CBEC scheme notably stay positive, as illustrated in Column (2) and Column (3). As is plainly evident, the benefit for the CBEC on entrepreneurship at an urban scale remains significant after substituting the original dependent variable.
Thirdly, modify the duration of the sample. Generally speaking, extreme events may interfere with the regression results. Since the 2008 financial crisis, as well as the 2020 COVID-19 pandemic to a greater extent, may weaken the benefits for the CBEC on entrepreneurship, we excluded samples from 2006 to 2008 and 2020 to 2021 for further regression testing. From a statistical view, as revealed in Column (4), in a superior way, the findings for the CBEC stay still substantially positive, fairly declaring that the baseline results are stable.
Fourthly, lag the control variables by one period. Since all original control variables presented in Model (1) above are current-period indicators, their effect on entrepreneurial activities might present a time lag feature. To effectively eliminate interference from time factors and ensure the credibility of research conclusions, we re-perform regression estimation after imposing a one-period lag on all control variables. To be exact, the benefits for the CBEC scheme on urban entrepreneurship remain significant after excluding the impact of time lag, as illustrated in Column (5). This finding fully verifies the validity of our core research results in a finer way, declaring that the CBEC’s promotional effect on urban entrepreneurship is persistent and stable.
Fifthly, adjust the regression sample. Sub-provincial cities, provincial capitals, as well as municipalities immediately under the central authority have more resources and policy encouragement, as well as more autonomy in developing and implementing trade policies. These particularities might cause biases in estimation results. Therefore, we remove these cities from the dataset displayed in Equation (1) and re-run the regression analysis to better evaluate the model’s applicability and the entrepreneurial results. The reliability of the aforementioned baseline results is further confirmed by the fact that the coefficient for the CBEC plan (E_did) stays still highly positive, as illustrated in Column (6).
Sixthly, adopt the instrumental variable (IV) technique. Following Pan et al. [52], we use the interaction term of two factors as the IV: the minimum distance between each city and fiber-optic backbone cities and the length of fiber optics per 100 people. First, cities close to fiber-optic backbone cities exhibit distinct benefits in network communication, offering a solid network foundation for CBEC firms, thus satisfying the relevance requisite. Second, there is currently no direct evidence that entrepreneurship across each city is driven by its minimum distance to fiber-optic backbones, thus meeting the exogeneity requirement. As exhibited in Column (7), it demonstrates that the value for the CBEC scheme (E_did) stays 0.266 after applying the IV technique at the 5% level, which exhibits notable positivity, to some extent, verifying the robustness of baseline results. By the same token, this paper further incorporates terrain relief and the length of fiber optics per 100 people to conduct the instrumental variable test. As shown in Column (8), the results remain statistically significant. In addition, the results of the CD-Wald-F test and the KP-Wald-LM test both verify the aforementioned hypotheses regarding correlation and exogeneity.
Seventhly, employ a dual machine learning (DML) strategy. In essence, DML to some extent integrates the merits of the traditional DID technique and machine learning techniques. It is capable of addressing complex nonlinear nexus and high-dimensional data, greatly mitigating the risk of model misspecification, capturing heterogeneous treatment effects, and enhancing the accuracy and robustness of basic estimation results. These distinctive features endow DML with notable advantages in policy evaluation and causal inference. Therefore, following a sample splitting proportion of 1:4, we employ the DML technique and Lasso-CV algorithm to attain predictive modeling. As exhibited in Column (9), from a statistical view, the coefficient for the CBEC (E_did) remains notably positive, thus providing robust evidence to validate our baseline findings.
Finally, in order to investigate the bias magnitude of multi-period DID estimates under the two-way fixed effects framework, this paper, in accordance with Goodman-Bacon’s methodology, breaks down the two-way fixed effects estimator into three 2 × 2 DID combinations: (1) early versus late CBEC pilot cities; (2) late versus early CBEC pilot cities; and (3) pilot versus non-pilot cities. Table 4 presents the findings. The predicted coefficient for the late-versus-early pilot city comparison is −1.048, with a weight of only 6%, according to decomposition analysis. The pilot-versus-non-pilot comparison, on the other hand, has a dominant weight of 82.3%, suggesting that even after adjusting for varied treatment effects, the baseline regression results also stay reliable.

5.5. Exclude the Interference of Other Policies

In essence, the interplay across many factors can partially create disturbance and confusion during the study process, which applies to the policy rating in a DID model as well [53,54]. In view of this, we further confirm the benefits of the CBEC scheme on urban entrepreneurship by taking into account how other pilot policies exerted influence over 2006–2021. To be more precise, five policies at an urban scale closely linked with urban entrepreneurship are merged into Model (1) exhibited above. For example, the National E-commerce (NEC) program was launched in 2009; the Information for the People policy (IFP) and Broadband China Strategy (BDC) were implemented in 2014; in 2012, the Public Data Opening policy (PDO) was rolled out; in 2016, the Big Data Pilot Zone policy (BDPZ) was presented; in 2012, the Smart City Pilot project (SCP) was initiated. That being so, we steadily integrate these policies into Model (1) for empirical testing to subtly detect how these policies affect entrepreneurship at an urban scale. Table 5 displays the outcomes.
The estimation outcomes after incorporating the six pilot policies are reported in Table 5. By introducing the aforementioned six policies, the results of the policy uniqueness test further confirm that the CBEC scheme notably enhanced entrepreneurship at the city level during 2006–2021. Specifically, we first incorporated the pilot program for the NEC pilot policy (National_did) into Model (1). As noted in Column (1), the impact of the CBEC scheme on entrepreneurship at the city level seems effective, notably at the 1% degree, with a 0.068 for the CBEC. Furthermore, in a finer way, as illustrated in Columns (2) to (6), we sequentially integrate IFP pilot policy (Inform_did), PDO pilot policy (Pub_did), BDPZ pilot policy (BigData_did), SCP pilot policy (SmrtCity_did), and BDC pilot policy (Bdchina_did) into the model to conduct testing. As is plainly evident, the implications for the CBEC still remain quite favorable. In particular, Column (7) reports the results of including the six policies together, stating that the CBEC exhibits an estimated value of 0.071 and appears favorably effective at the 1% level. That being the case, the implications for the CBEC on entrepreneurial activities at an urban scale are not affected by these pilot programs listed above, which notably enhance the authenticity and dependability of the aforementioned baseline results.

5.6. Heterogeneity Analysis

China is a large country. Due to sharp distinctions in internal and external conditions, the effects for the CBEC vary across different cities. To facilitate more rational policy implementation for diverse city types, we conduct a heterogeneity test across five aspects: cultural environment (culture), digitalization level (digitalization), economic development level (economy), legal environment (laws), and business environment (business) [37,55]. Table 6 displays the findings.
First, regarding the cultural environment—a core element of a city’s soft power—it influences entrepreneurs’ motivation and behavioral patterns through dimensions such as values and social atmosphere. We classify the sample into two subgroups in accordance with the number of books per 100 people in public libraries: cities with a favorable cultural environment and those with an unfavorable one. Results in Columns (1) and (2) show that cities with a better cultural environment notably promote entrepreneurship, while those with a poorer one have no discernible effect. As is plainly evident, the argument for it exhibits that cities with a stronger cultural environment foster an atmosphere that encourages innovation and values collaboration, thereby forming a more mature entrepreneurial ecosystem.
Second, according to the Index for Digital Finance fully shared by Peking University, more ably, we divide the sample into low- and high-digitalization cities in terms of urban digitalization—a core driver of urban entrepreneurship growth. As shown in Columns (3) and (4), cities with higher digitalization significantly boost entrepreneurship, whereas those with lower digitalization have no significant effect. This is likely because cities with advanced digitalization have well-developed digital infrastructure, which offers huge success chances for entrepreneurs and drives entrepreneurship at the city level.
Third, according to GDP per capita, the sample is split into economically undeveloped and developed cities from the perspective of economic development, which has a major impact on entrepreneurship. Columns (5) and (6) indicate that economically developed cities significantly promote entrepreneurship, while underdeveloped ones do not. This may stem from the fact that economically developed cities have robust capital accumulation, advanced industrial chains, and broad consumer markets, which stimulate entrepreneurs’ enthusiasm.
Fourth, regarding the legal environment, a stable, fair, and healthy institutional environment provides sustained impetus for urban entrepreneurship. The sample is divided into cities with strong and weak legal environments based on provincial crime rates. Columns (7) and (8) reveal that cities with a stronger legal environment exert a more pronounced facilitative impact on entrepreneurship than those with a weaker one. Such cities offer more stable, fair, and predictable institutional guarantees for entrepreneurial activities, thereby attracting the agglomeration of talents and capital and increasing entrepreneurial density and dynamism.
Fifth, this study splits the sample into cities with a good business environment and those with a poor business environment, depending on the comprehensive scores from the China Urban Business Environment Database. Cities with a positive business climate significantly promote urban entrepreneurship, while those with a substandard business environment exhibit a negative effect, as revealed in Columns (9) and (10). This could be explained by the fact that a stable business climate is more favorable to lowering institutional costs and uncertainties associated with urban entrepreneurship, as well as enhancing the quality of urban entrepreneurship and startup enterprise survival rates.

5.7. Transmission Mechanism Analysis

Following the results mentioned above, the CBEC scheme promotes urban entrepreneurship to a certain extent. However, how does the CBEC impact the activities of urban entrepreneurship? Drawing on the aforementioned theoretical analysis, this paper conducts an empirical test through two channels: talent agglomeration level (Tal_con) and industrial structure upgrading (Ind_up). In a superior way, we adopt the number of practitioners in the sectors of geological exploration, technical services, scientific research, and information and computer software as indicators of talent agglomeration. For industrial upgrading, we adopt the output ratio of the tertiary industry to primary and secondary industries at an urban scale as the indicator. The results for our initial regression analysis on Tal_con with and without control variables are displayed in Columns (1) and (2). That being the case, regression studies are executed for Ind_up with and without control variables, with those outcomes displayed in Columns (4) and (5). More importantly, to subtly verify the stability of the impact mechanism in a finer way, we further divide the CBEC variable into two groups based on the percentiles of each mechanism variable: the low group (below the 40th percentile) and the high group (above the 60th percentile), and fully detect how the CBEC scheme affects entrepreneurship at an urban scale. It further confirms that the effects of talent agglomeration and industrial upgrading are statistically robust.
The regression results for testing the mechanisms through which the CBEC influences entrepreneurial dynamism are presented in Table 7. To be more specific, first, regarding the talent agglomeration effect, as illustrated in Columns (1) to (2), from a statistical view, the value for the CBEC scheme (E_did) greatly exhibits positive, to some extent, revealing that the CBEC notably spurs talent agglomeration. More importantly, as noted in Column (3), examining the CBEC’s impact on city-level entrepreneurship reveals that the coefficient for entrepreneurship is 0.071 and remains notably beneficial from a statistical view for the high-talent agglomeration group (E_did_high). However, it exhibits a positive value in the low-talent agglomeration group (E_did_low). This indicates the higher levels of talent agglomeration at the city level amplify the CBEC’s promotional effect on urban entrepreneurship [56], thereby validating Hypothesis 2 (H2) stated in the theoretical analysis. Concerning the effect of industrial structure upgrading, at the 1% level, Columns (4) to (5) demonstrate that the coefficient for how the CBEC affects industrial structure upgrading is positively significant. Similarly, this greatly indicates that the CBEC significantly promotes industrial structure upgrading, effectively enhancing urban entrepreneurship and improving the entrepreneurial environment. Furthermore, Column (6) shows that the coefficient for the CBEC in the high industrial structure group (E_did_high) reaches a value of 0.072, while the result for the low industrial structure group (E_did_low) is insignificant. This indicates that the CBEC is more effective in promoting urban entrepreneurship when facing service sector growth and industrial structure optimization [57], thereby verifying Hypothesis 3 (H3).

5.8. Spatial Spillover Effects Analysis

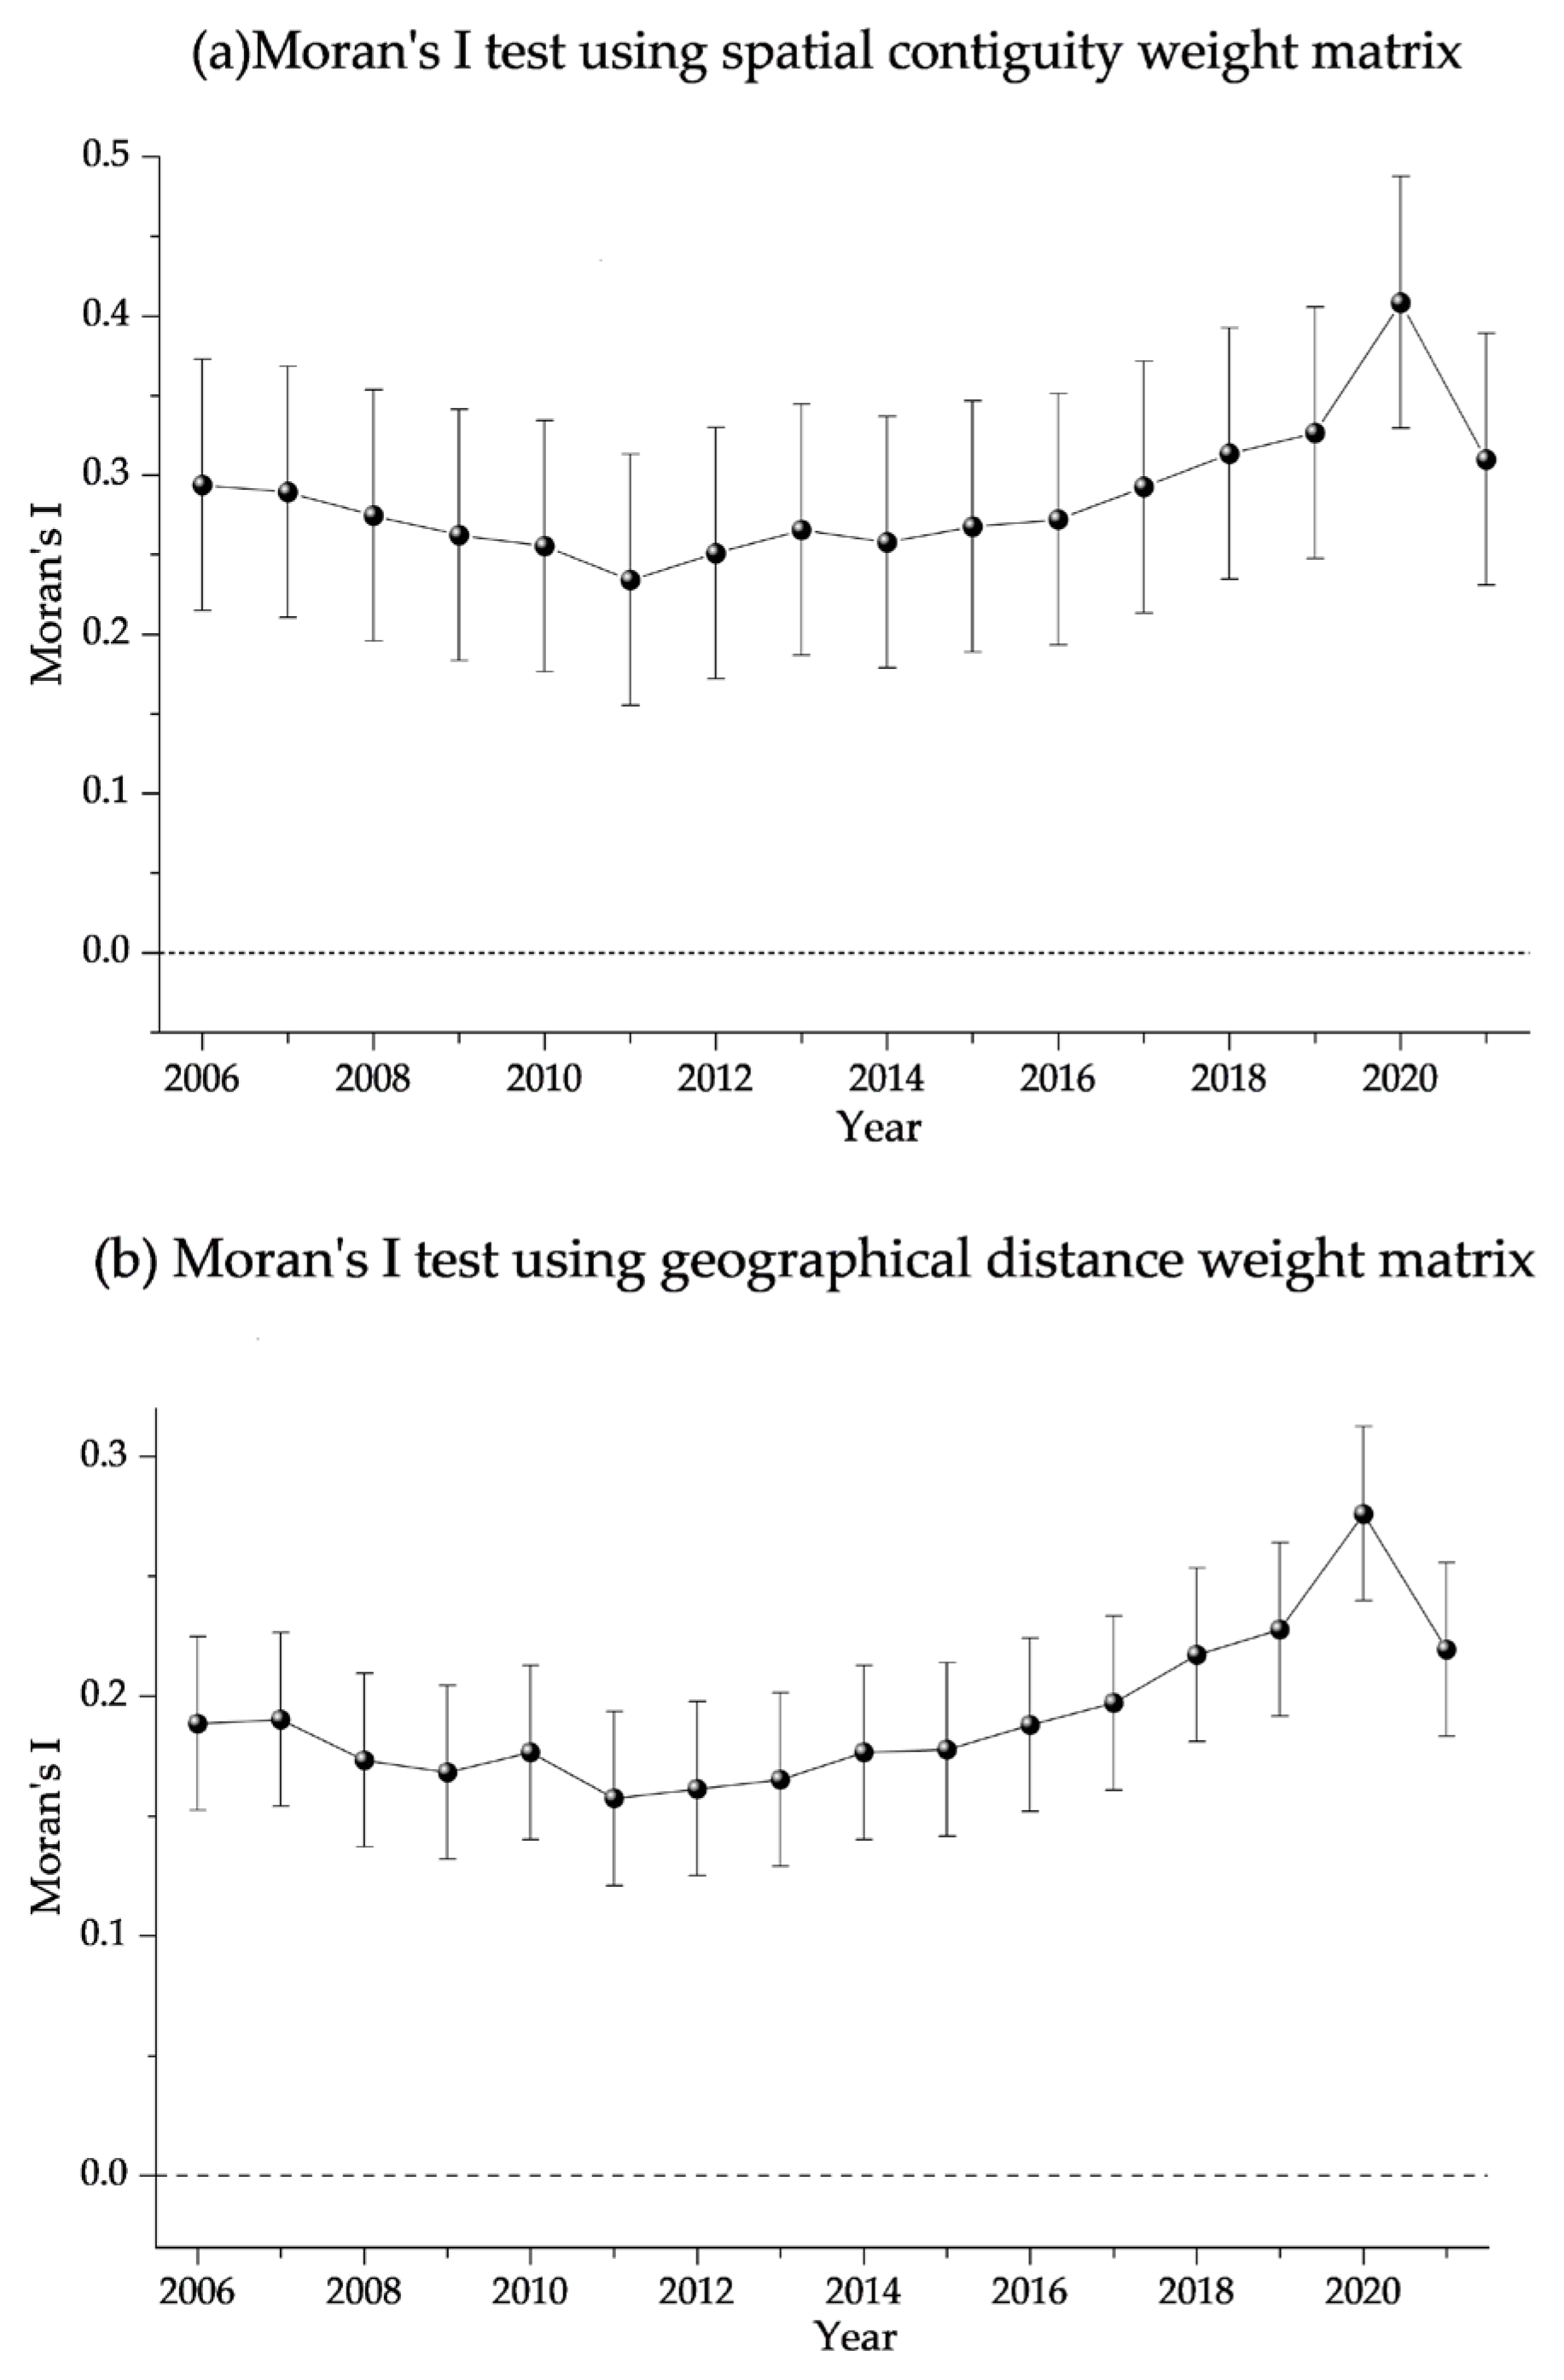
As noted above, the CBEC to some extent lowers market access thresholds through policies such as market facilitation and tax incentives, thereby stimulating urban entrepreneurship. This effect then spreads to surrounding areas via various mechanisms, forming a pattern of coordinated development, which in turn stimulates the entrepreneurship of these surrounding areas and creates a spatial spillover effect for the CBEC. However, the traditional DID technique cannot identify the spatial connection among areas nor accurately explain spatial effects. In this regard, we embed spatial effects into the DID strategy for further analysis. Specifically, to subtly disclose how entrepreneurship is correlated spatially across regions, we create a contiguity matrix (W1) and an inverse distance squared matrix (W2) according to cities’ adjacency relationships and geographic distance, respectively, and assess urban entrepreneurship using Moran’s I index. To be precise, Figure 8 presents these findings for spatial autocorrelation testing. It can be observed that from 2006 to 2021, Moran’s I indices of urban entrepreneurship under the inverse distance squared matrix, as well as the contiguity matrix, remain greatly positive from a statistical view. More importantly, it reveals that from 2006 to 2021, there is a notable spatial spillover impact for entrepreneurship among 282 prefecture-level cities, and Chinese entrepreneurship at the city level greatly exhibits a strong positive agglomeration trend.
From spatial autocorrelation results, the level of urban entrepreneurship in various locations tends to exhibit a certain degree of similarity. For regression testing, we use a spatial autoregressive (SAR) strategy with two-way fixed effects. To be specific, Table 8, Columns (1) and (5), illustrate the findings. Regardless of whether the contiguity matrix (W1) or the inverse distance squared matrix (W2) is used, urban entrepreneurship is enhanced by the CBEC, indicating that it plays a noticeable role in promoting entrepreneurship at the city level. In addition, from a statistical view, the model’s spatial correlation coefficient (ρ), in a finer way, remains notably positive, exposing a clear positive spillover impact of one region’s entrepreneurship on adjacent regions. We decompose the spatial effects argued in the SAR model into three effects: indirect effects, direct effects, and total effects to better detect the spatial spillover effects exerted by CBEC implementation on urban entrepreneurship, as noted in Table 8. In greater detail, the indirect, direct, and total effects fully exhibit a discernible upward trend, with significance at the 1% level, regardless of whether W1 or W2 is used. To some degree, it admits that, once policy spillover effects are taken into consideration, the execution of the CBEC scheme not only enhances the region’s urban entrepreneurship but also brings about a cascading influence on neighboring cities’ entrepreneurship, thereby exerting a distinct promoting effect on urban entrepreneurship across the nation, which notably confirms Hypothesis 4 (H4).

5.9. Further Discussion

The CBEC, as an emerging trade format, offers new chances for optimizing industrial chains’ layout, enhancing economic resilience, and attaining high-quality development at the city level, thus verifying Hypothesis 1. The CBEC has promoted the integration of the CBEC and industrial clusters, greatly facilitated the transition of traditional foreign trade, subtly enhanced cities’ appeal to new foreign trade formats, and formed a positive cycle of policy dividends, talent agglomeration, and industrial upgrading at length. More importantly, the open entrepreneurial ecosystem built by the comprehensive pilot zones exhibits a self-reinforcing feature. Market opportunities brought by policy pilots have attracted the inflow of professional talents, and the integration of talents and industries has further improved the entrepreneurial environment. This positive feedback continuously stimulates urban entrepreneurial activities in CBEC-related fields.
This study reveals that the CBEC promotes urban entrepreneurship through channels including talent agglomeration (Hypothesis 2) and industrial structure upgrading (Hypothesis 3), hence confirming the theoretical approach. From the perspective of talent agglomeration, by improving the talent policy system, strengthening talent cultivation and introduction, and building entrepreneurial incubation platforms, the CBEC has effectively promoted talent agglomeration and entrepreneurial development. Through optimizing talent policies, the CBEC attracts domestic and foreign CBEC professionals. These talents provide intellectual support for entrepreneurship. From the perspective of industrial structure upgrading, through policy guidance and resource integration, pilot zones promote the upgrading of traditional trade firms, adapting to CBEC requirements, helping them expand international markets. Meanwhile, pilot zones propel in-depth integration of traditional industries with the CBEC, expanding entrepreneurial tracks, and improving industrial chains. Through industrial structure upgrading, pilot zones achieve industrial coordinated development, greatly optimize resource allocation, and offer abundant application scenarios and broad market space for entrepreneurs. The identification of these two transmission channels provides a theoretical basis for urban entrepreneurship research.
This study reveals the heterogeneous impacts of the CBEC on urban entrepreneurship, where its policy effects vary with cultural environment, digitalization levels, economic development levels, legal environments, and business environments. About the cultural environment, cities with a stronger cultural environment foster an atmosphere that encourages innovation and values collaboration, thereby forming a more mature entrepreneurial ecosystem. About the digitalization level, cities with higher digitalization have well-developed digital infrastructure, which offers huge success chances for entrepreneurs and drives entrepreneurship at the city level. About the economic development level, economically developed cities have robust capital accumulation, advanced industrial chains, and broad consumer markets, which stimulate entrepreneurs’ enthusiasm. About the legal environment, cities with a stronger legal environment offer more stable, fair, and predictable institutional guarantees for entrepreneurial activities, thereby attracting the agglomeration of talents and capital and increasing entrepreneurial density and dynamism. About the business environment, a stable business climate is more favorable to lowering institutional costs and uncertainties associated with urban entrepreneurship, as well as enhancing the caliber of urban entrepreneurship and startup enterprise survival rates.
This paper also finds that the CBEC exerts a spatial spillover effect on urban entrepreneurship. To be specific, while boosting local entrepreneurial activities, it stimulates the motivation of neighboring regions to imitate and learn, thereby driving their entrepreneurship and verifying Hypothesis 4. Pilot cities take the lead in trials, developing mature models in optimizing customs clearance processes and facilitating cross-border payments. These replicable experiences spread to neighboring cities through inter-governmental exchanges and cross-regional business layout. Neighboring cities can directly draw on the institutional innovations and operational experiences from pilot cities, greatly reducing the policy adaptation costs and market access thresholds for entrepreneurship. Meanwhile, key resources and the entrepreneurial ecosystem aggregated in pilot cities due to the CBEC extend to surrounding areas based on geographical proximity, creating a radiating effect. This approach helps to identify the facilitating effect of the CBEC on urban entrepreneurship and provides empirical support to a certain extent.

6. Conclusions and Policy Recommendations

Institutional opening-up to some extent generates substantial entrepreneurial opportunities and employment positions, thus serving as a key underpinning for boosting employment. By taking a panel dataset at an urban scale from 282 Chinese areas spanning 2006–2021, in a finer way, we apply a multi-stage DID strategy to deeply detect how the CBEC affects urban entrepreneurship. The findings reveal that the CBEC significantly promotes urban entrepreneurial activities, with a sequence of robustness testing confirming the promotion effect is both genuine and reliable. Heterogeneity testing reveals that the CBEC subtly enhances urban entrepreneurial activities in areas with favorable cultural environments, perfect digital infrastructure, robust economic development, sound legal frameworks, and a better business environment. From mechanism analysis, the CBEC greatly affects urban entrepreneurial activities through talent agglomeration and industrial upgrading. To be more specific, talent agglomeration to a greater extent is reflected by the total volume of people working in the information technology (IT) sector, along with scientific research and technical service sectors. Meanwhile, the ratio that the tertiary sector output at an urban scale is divided by the total output in the primary and secondary sectors is used to reflect industrial upgrading. The findings indicate that the development of the CBEC greatly attracts the agglomeration of professional talents in the IT sector and speeds up industrial modernization and upgrading at the city level, which together constitute the core mechanisms through which the CBEC empowers entrepreneurship. Finally, further extended research shows that the CBEC exhibits a spatial spillover effect on urban entrepreneurship. The CBEC scheme not only greatly enhances local entrepreneurship but also, to some extent, yields a positive spatial spillover effect for urban entrepreneurial activities in neighboring cities. Given the aforementioned empirical results, we present some constructive measures from the following four aspects.
First, it fully fosters the spread of digital trade and steadily widens the range of CBEC pilot areas. To be precise, the central government should continue advancing regional coordination strategies, vigorously develop the digital economy, and accelerate the construction of a unified national market. This will connect various low-level closed markets with high-level open markets, enhancing the level of regional economic integration. The CBEC, as a crucial policy scheme facilitating the transition from old impetus to new growth drivers, has significantly boosted urban entrepreneurial activities. This underscores the need to further refine the program’s institutional design in areas such as entrepreneurial platforms, venture capital, and personnel incentives during future innovation-driven policy optimizations. Such enhancements will further improve the urban entrepreneurial environment and elevate the level of urban entrepreneurship. Furthermore, it is essential, as is plainly evident, to improve the supervision and assessment mechanisms for implementing innovation-driven policies, refine evaluation plans, strengthen evaluation oversight and feedback, and ensure the smooth implementation of policies. Focus on rapid implementation and targeted problem-solving to address bottlenecks in policy enforcement and pain points in industrial development, and base itself on institutional improvement and ecosystem cultivation to establish a long-term mechanism for sustainable development. This will facilitate the free flow of resources and factors at lower costs across broader areas, deepen the economic division of labor and cooperation among regions, further unleash the institutional innovation dividends of pilot zones, thereby accelerating economic restructuring and transformation, and promoting high-quality economic development.
Second, the CBEC scheme should be tailored to specific situations, truly recognizing the unique features of local economic development at an urban scale, and implementing a dynamic, differentiated strategy. To be precise, the local governments should fully broaden uniform and diverse institutional opening-up and sharing rules rooted in local economic development and industry disparities, to some extent, leveraging the vital role of the institutional opening-up strategy in boosting economic vitality. The coverage and depth of CBEC development should be expanded, with particular emphasis on providing more supportive policies for central, western, and economically underdeveloped regions. On the basis of coordinating the national policy framework, we shall adopt tailored measures and implement policies in a differentiated manner in light of local endowments. To our awareness, it will help them tackle geographical and resource limits, greatly promote shifts in economic growth models, thereby reducing labor outflows and enhancing local employment stability. Meanwhile, institutional innovation should foster a fair market competition setting, in a finer way, lessen excessive government intervention in micro-market entities, and foster inter-regional cooperation. In particular, tailored institutional opening-up and sharing schemes should be created and executed following local conditions, using the inclusive nature of institutional opening to promote the coordinated development of entrepreneurial effects through factor sharing. Likewise, tailored entrepreneurial development policies should be designed for specific conditions across different cities, with targeted policy design for industry-specific entrepreneurship. This will fully unleash the value-creating effects of institutional openness, fostering high-quality entrepreneurship while better empowering high-quality economic development.
Third, the governments should highly boost industrial upgrading, maximize the benefits from talent agglomeration, and deeply break the bottlenecks affecting urban entrepreneurship. To be specific, the authorities should utilize the CBEC to enhance the efficiency of urban factor allocation. With the CBEC development as the vanguard, we should actively improve market-based factor allocation systems, promote reasonable pricing and value-added sharing of data factors, foster support for building and refining digital value chains, and advance the integrated development of digital factors. To a certain degree, this will enhance factor allocation efficiency, thereby achieving synergistic and multiplicative effects among factors and driving integrated economic development. Meanwhile, the governments should propel the CBEC scheme to empower traditional industries, break down information barriers across different sectors and industries, attain upstream-downstream integration, and fully elevate the service-dominated tertiary sector. In particular, this optimizes resource allocation across industries, supports local digital transformation, improves the corporate environment, and enhances the city’s appeal to highly skilled entrepreneurial talents. In the meantime, the governments should strengthen synergies with the service sector by encouraging its development to drive diversified industrial clustering, thereby fostering urban entrepreneurship. The virtuous cycle between industrial upgrading and human capital agglomeration, in a finer way, is the core impetus for beating entrepreneurial bottlenecks at the city level. Even more so, this requires further optimization of the market environment and industrial structure, proactive attraction of talent resources, and then using the benefits from knowledge spillovers in high-quality development.
Fourth, strengthen regional cooperation to share spillover effects and establish a collaborative governance mechanism for entrepreneurship between pilot zones and neighboring areas. Given the diversity of entrepreneurial influences and the integrity of urban economic development, while enhancing CBEC execution, emphasis should be dedicated to coordination between other environmental factors and the CBEC at the city level. Efficient information transmission shortens spatial and temporal distances, to some extent, enhancing the broadness and depth of economic communications across different cities. Improving the environment for financial development alleviates financing constraints faced by startups, while advancing internet development accelerates the diffusion of knowledge and technology. Optimizing the regional macroeconomic environment and intellectual property systems creates a virtuous cycle, thereby providing systematic and coordinated support for urban entrepreneurship. In particular, the governments should fully exert, even more so, the positive spillover benefits from pilot cities to foster a regionally collaborative e-commerce network, promote exchange and cooperation among governments, market, and social entities across different cities to dismantle industry barriers and geographical restrictions on new models and business formats emerging from CBEC–urban entrepreneurship integration, and expand the influence of the CBEC to drive e-commerce growth in surrounding areas, facilitate rational flow and aggregation of resources across distinct regions, thereby narrowing regional gaps and achieving coordinated development across different cities as well.
Despite the rich findings of this study, it has four limitations: First, the research data coverage needs expansion. The current study mainly focuses on city-level data; future research may use county-level or corporate data for extended analysis to enrich the study’s practical significance. In order to create a more thorough entrepreneurial evaluation system, future research might also be enhanced by incorporating composite indicators, such as firm entrance rate, the quantity of patent applications, and venture capital investment. Second, there is room to improve the use of empirical strategy. This paper treats the CBEC as a quasi-natural test. Even so, only one policy is studied, and the impact of policy relevance on entrepreneurship is not considered. Future research will include smart city policies, national e-commerce policies, etc., to explore the entrepreneurial effects of policy synergy. Third, the results of this study cannot be directly applied to other emerging or developed nations because it solely examines the effect of the CBEC on urban entrepreneurship in China. In the future, comparative studies might be carried out to differentiate between the universal and context-specific aspects impacting urban e-commerce entrepreneurship, or comparable approaches could be performed in the contexts of many nations. Fourth, the identification of causality may be hampered by unobserved circumstances. Even though some observable confounding variables have been taken into account, unobserved traits like local governance models and government implementation efficiency, as well as informal institutions like regional business culture and government-enterprise relational networks, may have an impact on entrepreneurship by influencing how well policies are implemented. Through empirical analysis, future studies can further rule out the influence mechanisms of unobserved factors.


Author Contributions

Conceptualization, X.X.; methodology, X.X. and Y.Y.; formal analysis, Y.Y.; data curation, Y.Y. and J.H.; writing—original draft preparation, Y.Y. and J.H.; writing—review and editing, X.X.; funding acquisition, X.X. All authors have read and agreed to the published version of the manuscript.

Funding

This research was funded by the National Social Science Foundation of China (No. 19BRK036), the Hunan Province Graduate Excellent Course (Xiangjiaotong [2022] 357), and the Hunan Youth Talent Support Program (Xiangcaixingzhi [2022] 25).

Institutional Review Board Statement

Not applicable.

Informed Consent Statement

Not applicable.

Data Availability Statement

The datasets and computer programs used in this study are available from the corresponding author upon reasonable request.

Acknowledgments

We sincerely appreciate the hard work and valuable comments from the editorial team and anonymous reviewers. We would also like to thank Sihui Ruan, Jing Huang, and others for their research assistance. Any errors in this paper are entirely our responsibility.

Conflicts of Interest

The authors declare no conflicts of interest.

References

  1. Wei, G.; He, B.-J.; Sun, P.; Liu, Y.; Li, R.; Ouyang, X.; Luo, K.; Li, S. Evolutionary Trends of Urban Expansion and Its Sustainable Development: Evidence from 80 Representative Cities in the Belt and Road Initiative Region. Cities 2023, 138, 104353. [Google Scholar] [CrossRef]
  2. Tavassoli, S.; Obschonka, M.; Audretsch, D.B. Entrepreneurship in Cities. Res. Policy 2021, 50, 104255. [Google Scholar] [CrossRef]
  3. Marlet, G.; Van Woerkens, C. The Dutch Creative Class and How It Fosters Urban Employment Growth. Urban Stud. 2007, 44, 2605–2626. [Google Scholar] [CrossRef]
  4. Phelps, N.A.; Miao, J.T. Varieties of Urban Entrepreneurialism. Dialogues Hum. Geogr. 2020, 10, 304–321. [Google Scholar] [CrossRef]
  5. He, S.; Li, L.; Zhang, Y.; Wang, J. A Small Entrepreneurial City in Action: Policy Mobility, Urban Entrepreneurialism, and Politics of Scale in Jiyuan, China. Int. J. Urban Reg. Res. 2018, 42, 684–702. [Google Scholar] [CrossRef]
  6. Maresch, D.; Leo, H.; Walsh, S.T. Hotspurs in, Sober Bores out: A Call and an Agenda for Entrepreneurship and Innovation Policies That Foster Rapidly Scaling Ventures. Technol. Forecast. Soc. Change 2023, 196, 122846. [Google Scholar] [CrossRef]
  7. Prieger, J.E.; Bampoky, C.; Blanco, L.R.; Liu, A. Economic Growth and the Optimal Level of Entrepreneurship. World Dev. 2016, 82, 95–109. [Google Scholar] [CrossRef]
  8. Zheng, S.; Du, R. How Does Urban Agglomeration Integration Promote Entrepreneurship in China? Evidence from Regional Human Capital Spillovers and Market Integration. Cities 2020, 97, 102529. [Google Scholar] [CrossRef]
  9. Soluk, J.; Kammerlander, N.; Darwin, S. Digital Entrepreneurship in Developing Countries: The Role of Institutional Voids. Technol. Forecast. Soc. Change 2021, 170, 120876. [Google Scholar] [CrossRef]
  10. Wang, Z. Place-Based Policies, Financial Friction, and City Size: Evidence from China’s Institutional Opening-Up. Econ. Anal. Policy 2025, 87, 1522–1556. [Google Scholar] [CrossRef]
  11. Chen, N.; Yang, Y. The Impact of Customer Experience on Consumer Purchase Intention in Cross-Border E-Commerce—Taking Network Structural Embeddedness as Mediator Variable. J. Retail. Consum. Serv. 2021, 59, 102344. [Google Scholar] [CrossRef]
  12. Zhu, W.; Mou, J.; Benyoucef, M. Exploring Purchase Intention in Cross-Border E-Commerce: A Three Stage Model. J. Retail. Consum. Serv. 2019, 51, 320–330. [Google Scholar] [CrossRef]
  13. Ehigiamusoe, K.U.; Dogan, E.; Ramakrishnan, S.; Binsaeed, R.H. How Does Technological Innovation Moderate the Environmental Impacts of Economic Growth, Natural Resource Rents and Trade Openness? J. Environ. Manag. 2024, 371, 123229. [Google Scholar] [CrossRef]
  14. Akram, U.; Junaid, M.; Zafar, A.U.; Li, Z.; Fan, M. Online Purchase Intention in Chinese Social Commerce Platforms: Being Emotional or Rational? J. Retail. Consum. Serv. 2021, 63, 102669. [Google Scholar] [CrossRef]
  15. Blennerhassett, C.; Moore-Cherry, N.; Bonnin, C. Street Markets, Urban Development and Immigrant Entrepreneurship: Unpacking Precarity in Moore Street, Dublin. Urban Stud. 2022, 59, 2739–2755. [Google Scholar] [CrossRef]
  16. Behrens, K.; Seegert, N. Rushing to Opportunity: City Growth and Entrepreneurship. J. Urban Econ. 2025, 149, 103783. [Google Scholar] [CrossRef]
  17. Zhu, J.; Zhu, M.; Xiao, Y. Urbanization for Rural Development: Spatial Paradigm Shifts toward Inclusive Urban-Rural Integrated Development in China. J. Rural. Stud. 2019, 71, 94–103. [Google Scholar] [CrossRef]
  18. Jiang, W.; Jiang, N.; Wang, K.-L. The Local Effects and Neighborhood Effects of High-Speed Railway on Urban Entrepreneurial Vitality: Evidence from China. Socio-Econ. Plan. Sci. 2025, 98, 102172. [Google Scholar] [CrossRef]
  19. Lan, J.; Li, Q.; Zheng, Y.; Liu, Z. The Impact of the Low-Carbon City Pilots Programme on Industrial Land Transfer by Local Governments in China. Econ. Anal. Policy 2023, 77, 824–842. [Google Scholar] [CrossRef]
  20. Anguelov, D.; Leitner, H.; Sheppard, E. Engineering the Financialization of Urban Entrepreneurialism: The JESSICA Urban Development Initiative in the European Union. Int. J. Urban Reg. Res. 2018, 42, 573–593. [Google Scholar] [CrossRef]
  21. Penco, L.; Ivaldi, E.; Bruzzi, C.; Musso, E. Knowledge-Based Urban Environments and Entrepreneurship: Inside EU Cities. Cities 2020, 96, 102443. [Google Scholar] [CrossRef]
  22. Li, H.; Yang, Z.; Yao, X.; Zhang, H.; Zhang, J. Entrepreneurship, Private Economy and Growth: Evidence from China. China Econ. Rev. 2012, 23, 948–961. [Google Scholar] [CrossRef]
  23. Ren, Y.; Shen, L.; Wang, J.; Wu, Y. How to Address Properly the Scale of Urban Infrastructures?—An Empirical Study of 35 Large Chinese Cities. Habitat Int. 2021, 118, 102464. [Google Scholar] [CrossRef]
  24. Barnett, W.A.; Hu, M.; Wang, X. Does the Utilization of Information Communication Technology Promote Entrepreneurship: Evidence from Rural China. Technol. Forecast. Soc. Change 2019, 141, 12–21. [Google Scholar] [CrossRef]
  25. Morton, J.; Iglesias Ruiz, R. Scaling-up, Opening-up? Using Open Strategizing for Navigating Rapid Growth. Long Range Plan. 2024, 57, 102467. [Google Scholar] [CrossRef]
  26. Ballerini, J.; Ključnikov, A.; Juárez-Varón, D.; Bresciani, S. The E-Commerce Platform Conundrum: How Manufacturers’ Leanings Affect Their Internationalization. Technol. Forecast. Soc. Change 2024, 202, 123199. [Google Scholar] [CrossRef]
  27. Baggs, J.; Fung, L.; Lapham, B. Exchange Rates, Cross-Border Travel, and Retailers: Theory and Empirics. J. Int. Econ. 2018, 115, 59–79. [Google Scholar] [CrossRef]
  28. Kim, K.; Lim, G. International Dynamic Marketing Capabilities of Emerging-Market Small Business on E-Commerce. J. Theor. Appl. Electron. Commer. Res. 2022, 17, 199–211. [Google Scholar] [CrossRef]
  29. Mazzucchelli, A.; Chierici, R.; Abbate, T.; Fontana, S. Exploring the Microfoundations of Innovation Capabilities. Evidence from a Cross-Border R&D Partnership. Technol. Forecast. Soc. Change 2019, 146, 242–252. [Google Scholar] [CrossRef]
  30. Zeng, S.; Fu, Q.; Haleem, F.; Han, Y.; Zhou, L. Logistics Density, E-Commerce and High-Quality Economic Development: An Empirical Analysis Based on Provincial Panel Data in China. J. Clean. Prod. 2023, 426, 138871. [Google Scholar] [CrossRef]
  31. Myovella, G.; Karacuka, M.; Haucap, J. Digitalization and Economic Growth: A Comparative Analysis of Sub-Saharan Africa and OECD Economies. Telecommun. Policy 2020, 44, 101856. [Google Scholar] [CrossRef]
  32. Sommer, M.; Kratena, K. The Carbon Footprint of European Households and Income Distribution. Ecol. Econ. 2017, 136, 62–72. [Google Scholar] [CrossRef]
  33. Wang, M.; Zhao, L.; Herty, M. Logistics Service Sharing of Sellers on an E-Commerce Platform Considering the Behaviour of Carbon Emission Pooling. Electron. Commer. Res. Appl. 2023, 59, 101267. [Google Scholar] [CrossRef]
  34. Larch, M.; Wanner, J. Carbon Tariffs: An Analysis of the Trade, Welfare, and Emission Effects. J. Int. Econ. 2017, 109, 195–213. [Google Scholar] [CrossRef]
  35. Viglia, S.; Civitillo, D.F.; Cacciapuoti, G.; Ulgiati, S. Indicators of Environmental Loading and Sustainability of Urban Systems. An Emergy-Based Environmental Footprint. Ecol. Indic. 2018, 94, 82–99. [Google Scholar] [CrossRef]
  36. Bensassi, S.; Márquez-Ramos, L.; Martínez-Zarzoso, I.; Suárez-Burguet, C. Relationship between Logistics Infrastructure and Trade: Evidence from Spanish Regional Exports. Transp. Res. Pt. A-Policy Pract. 2015, 72, 47–61. [Google Scholar] [CrossRef]
  37. Xu, X.; Li, X.; Zheng, L. A Blessing or a Curse? Exploring the Impact of Environmental Regulation on China’s Regional Green Development from the Perspective of Governance Transformation. Int. J. Environ. Res. Public Health 2022, 19, 1312. [Google Scholar] [CrossRef]
  38. Li, Y.; Zheng, Z.; Zhao, M.; Liu, Z. How Does Digital Trade Impact Urban Carbon Emissions Efficiency? Evidence from China’s Cross-Border e-Commerce Pilot Zones. J. Clean. Prod. 2024, 456, 142363. [Google Scholar] [CrossRef]
  39. Ghazy, N.; Ghoneim, H.; Lang, G. Entrepreneurship, Productivity and Digitalization: Evidence from the EU. Technol. Soc. 2022, 70, 102052. [Google Scholar] [CrossRef]
  40. Karolyi, G.A.; Liao, R.C. State Capitalism’s Global Reach: Evidence from Foreign Acquisitions by State-Owned Companies. J. Corp. Financ. 2017, 42, 367–391. [Google Scholar] [CrossRef]
  41. Han, A.; Liu, P.; Wang, B.; Zhu, A. E-Commerce Development and Its Contribution to Agricultural Non-Point Source Pollution Control: Evidence from 283 Cities in China. J. Environ. Manag. 2023, 344, 118613. [Google Scholar] [CrossRef]
  42. Xu, X.; Yi, B. New Insights into the Impact of Local Corruption on China’s Regional Carbon Emissions Performance Based on the Spatial Spillover Effects. Sustainability 2022, 14, 15310. [Google Scholar] [CrossRef]
  43. Xu, X.; Huang, L. How Does Environmental Protection Tax Affect Urban Energy Consumption in China? New Insights from the Intensity Difference-in-Differences Model. Sustainability 2024, 16, 4141. [Google Scholar] [CrossRef]
  44. Yang, W.; Kang, B. Slower Roads, Cleaner Skies? Causal Effects of Speed Limit Reduction on Urban Air Quality Using Propensity Score Matching and Spatial Difference-in-Differences Regression. Transp. Policy 2026, 178, 103969. [Google Scholar] [CrossRef]
  45. Hallikainen, H.; Laukkanen, T. National Culture and Consumer Trust in E-Commerce. Int. J. Inf. Manag. 2018, 38, 97–106. [Google Scholar] [CrossRef]
  46. Zhao, L.; Chen, Y.; Wahab, M.I.M. The Impact of Low-Altitude Airspace Opening Policy on Aviation Manufacturing Innovation: A Double Machine Learning Approach. Transp. Res. A-Pol. 2025, 200, 104660. [Google Scholar] [CrossRef]
  47. Beck, T.; Levine, R.; Levkov, A. Big Bad Banks? The Winners and Losers from Bank Deregulation in the United States. J. Financ. 2010, 65, 1637–1667. [Google Scholar] [CrossRef]
  48. Sun, L.; Abraham, S. Estimating Dynamic Treatment Effects in Event Studies with Heterogeneous Treatment Effects. J. Econom. 2021, 225, 175–199. [Google Scholar] [CrossRef]
  49. Gross, L. Putting Placebos to the Test. PLoS. Biol. 2017, 15, e2001998. [Google Scholar] [CrossRef]
  50. Eggers, A.C.; Tuñón, G.; Dafoe, A. Placebo Tests for Causal Inference. Am. J. Polit. Sci. 2024, 68, 1106–1121. [Google Scholar] [CrossRef]
  51. Patrucco, A.S.; Marzi, G.; Trabucchi, D. The Role of Absorptive Capacity and Big Data Analytics in Strategic Purchasing and Supply Chain Management Decisions. Technovation 2023, 126, 102814. [Google Scholar] [CrossRef]
  52. Pan, Z.; Song, Y.; Li, X. Foreign Direct Investment and Regional Integration: The Connectivity Role of Same-Origin Greenfield Investment in the Yangtze River Delta. Habitat Int. 2025, 163, 103484. [Google Scholar] [CrossRef]
  53. Forés, B. Public Funding Dynamics in Clean and Dirty Industries: An Empirical Analysis of the Effects of Eco-Innovation, Cooperation, and Internationalization Strategies. Bus. Strategy Environ. 2025, 34, 5336–5369. [Google Scholar] [CrossRef]
  54. Bhattacharya, M.; Inekwe, J.N.; Sadorsky, P.; Saha, A. Convergence of Energy Productivity across Indian States and Territories. Energy Econ. 2018, 74, 427–440. [Google Scholar] [CrossRef]
  55. Cowan, B.W. Testing for Educational Credit Constraints Using Heterogeneity in Individual Time Preferences. J. Labor Econ. 2016, 34, 363–402. [Google Scholar] [CrossRef]
  56. Cheng, X.; Ge, F.; Xu, M.; Li, Y. The Heat Island Effect, Digital Technology, and Urban Economic Resilience: Evidence from China. Technol. Forecast. Soc. Change 2024, 209, 123802. [Google Scholar] [CrossRef]
  57. Qiao, C. Can Banking Concentration Improve Regional FinTech Development? Int. Rev. Financ. Anal. 2025, 99, 103936. [Google Scholar] [CrossRef]
Figure 1. Timeline for China’s CBEC scheme.
Jtaer 21 00042 g001
Figure 2. Chart for the CBEC scheme distribution geographically.
Jtaer 21 00042 g002
Figure 3. Theoretical framework diagram.
Jtaer 21 00042 g003
Figure 4. Territorial changes for entrepreneurship in Chinese cities spanning 2006–2021.
Jtaer 21 00042 g004
Figure 5. Temporal trends and kernel density changes in urban entrepreneurship over 2006–2021.
Jtaer 21 00042 g005
Figure 6. CBEC’s treatment effect: parallel trend tests.
Jtaer 21 00042 g006
Figure 7. CBEC’s treatment effect: placebo tests.
Jtaer 21 00042 g007
Figure 8. Spatial autocorrelation tests.
Jtaer 21 00042 g008
Table 1. Descriptive statistics.
IndicatorDescriptionThe Total SamplePilot AreasNon-Pilot Areas
ObsMeanS.D.MeanS.D.MeanS.D.
EntrepUrban entrepreneurship451210.30440.93710.93310.9149.96950.760
E_didCBEC scheme45120.06910.2540.19900.3990.00000.000
IndusIndustrial structure45120.38080.0770.37900.0710.38170.080
MiduPopulation density45125.73700.9236.11750.7405.53430.947
FinanFinancial development451216.15891.30317.14091.34415.63590.924
HumHuman capital level451210.45931.40911.50741.2279.90111.159
TechTechnology development45120.02990.0410.04670.0520.02100.030
FiscalFiscal expenditure level45120.16620.0780.13440.0530.18320.084
Table 2. Conclusions of benchmark regression for the CBEC on urban entrepreneurship.
Indicator(1)(2)(3)(4)(5)(6)
E_did1.654 ***0.140 ***0.154 ***0.189 ***0.089 ***0.075 ***
(0.049)(0.019)(0.028)(0.020)(0.029)(0.020)
Indus −1.111 ***−1.022 ***−0.870 ***0.527 ***
(0.098)(0.114)(0.102)(0.122)
Midu 0.098 ***0.889 ***0.099 ***0.972 ***
(0.008)(0.090)(0.008)(0.081)
Finan 0.555 ***0.540 ***0.542 ***0.072 ***
(0.008)(0.011)(0.010)(0.022)
Hum 0.040 ***0.043 ***0.049 ***−0.022 *
(0.007)(0.014)(0.007)(0.013)
Tech −0.0130.640 ***−0.1340.133
(0.162)(0.160)(0.185)(0.156)
Fiscal 0.1770.2360.156−0.343 **
(0.108)(0.148)(0.115)(0.144)
_Cons10.190 ***10.295 ***0.741 ***−3.651 ***0.766 ***3.633 ***
(0.013)(0.004)(0.114)(0.500)(0.145)(0.558)
City FENoYesNoYesNoYes
Year FENoYesNoNoYesYes
R20.2010.9240.8060.9090.8140.928
Obs451245124512451245124512
Note: Values for standard error are bracketed in parentheses. With relatively high precision, significances at the 1%, 5%, and 10% levels are indicated by ***, **, and *.
Table 3. Conclusions of robustness tests for CBEC on urban entrepreneurship.
Variable(1)(2)(3)(4)(5)(6)(7)(8)(9)
PSM-DIDEntrep-kmEntrep-1002008–2019Controlsi,t−1New SampleInstrument 1Instrument 2DML
E_did0.060 **0.147 ***0.128 ***0.072 ***0.093 ***0.068 ***0.266 **1.201 **0.154 ***
(0.029)(0.016)(0.011)(0.024)(0.019)(0.024)(0.124)(0.583)(0.028)
_Cons1.060−5.882 ***−1.172 ***3.841 ***4.296 ***3.766 ***
(0.834)(0.465)(0.301)(0.616)(0.578)(0.589)
CD-Wald-F 620.42248.991
KP-Wald rk-LM 40.9356.344
ControlYesYesYesYesYesYesYesYesYes
City FEYesYesYesYesYesYesYesYesYes
Year FEYesYesYesYesYesYesYesYesYes
R20.8740.9400.8610.9450.9310.910
Obs281645124512338442304032451245124512
Note: Values for standard error are bracketed in parentheses. Control variables lagged by one period are denoted as Controlsi,t−1. Significances at the 1% and 5% levels are indicated by *** and **.
Table 4. Conclusions of the Goodman-Bacon decomposition.
Treatment GroupControl GroupEstimated CoefficientWeight
Early includedLater included0.0780.117
Later includedEarly included−1.0480.060
Pilot areasNon-pilot areas0.1570.823
Table 5. Conclusions of the exclusion restriction test for the CBEC on urban entrepreneurship.
Variable(1)(2)(3)(4)(5)(6)(7)
E_did0.068 ***0.077 ***0.074 ***0.076 ***0.076 ***0.078 ***0.071 ***
(0.020)(0.020)(0.020)(0.020)(0.020)(0.020)(0.021)
National_did0.032 * 0.044 **
(0.019) (0.021)
Inform_did −0.008 −0.014
(0.018) (0.020)
Pub_did 0.006 0.008
(0.018) (0.018)
BigData_did −0.009 −0.010
(0.018) (0.018)
SmartCity_did −0.022 −0.023
(0.015) (0.016)
Bdchina_did −0.015−0.018
(0.016)(0.016)
_Cons3.645 ***3.635 ***3.655 ***3.611 ***3.691 ***3.638 ***3.726 ***
(0.558)(0.558)(0.562)(0.560)(0.560)(0.558)(0.565)
ControlYesYesYesYesYesYesYes
City FEYesYesYesYesYesYesYes
Year FEYesYesYesYesYesYesYes
R20.9280.9280.9280.9280.9280.9280.928
Obs4512451245124512451245124512
Note: Values for standard error are bracketed in parentheses. With relatively high precision, significances at the 1%, 5%, and 10% levels are indicated by ***, **, and *.
Table 6. Conclusions of the heterogeneity test for the CBEC on urban entrepreneurship.
VariableCultureDigitalizationEconomyLawBusiness
High_CultLow_CultHigh_DigLow_DigHigh_EcoLow_EcoHigh_LawLow_LawHigh_BELow_BE
(1)(2)(3)(4)(5)(6)(7)(8)(9)(10)
E_did0.141 ***0.0040.091 ***−0.0420.100 ***−0.0140.148 ***−0.0050.081 ***−0.032
(0.025)(0.037)(0.024)(0.043)(0.025)(0.041)(0.026)(0.028)(0.024)(0.045)
_Cons4.324 ***2.017 **5.024 ***1.3123.062 ***3.840 ***6.374 ***−2.108 **5.506 ***2.531 ***
(0.739)(0.904)(0.787)(0.871)(0.779)(0.864)(0.664)(0.963)(0.827)(0.822)
ControlYesYesYesYesYesYesYesYesYesYes
City FEYesYesYesYesYesYesYesYesYesYes
Year FEYesYesYesYesYesYesYesYesYesYes
R20.9140.9140.9140.9150.9150.9100.9140.9140.9280.887
Obs2256225622562256225622562208230422562256
Note: Values for standard error are bracketed in parentheses. BE stands for Business Environment. With relatively high precision, significances at the 1% and 5% levels are indicated by *** and **.
Table 7. Conclusions of mechanism testing for the CBEC on urban entrepreneurship.
VariableLevel of Talent ConcentrationIndustrial Structure Upgrading
TalentTalentEntrepInd_upInd_upEntrep
(1)(2)(3)(4)(5)(6)
E_did0.278 ***0.219 *** 0.089 ***0.089 ***
(0.040)(0.034) (0.031)(0.023)
E_did_high 0.071 ** 0.072 **
(0.036) (0.036)
E_did_low 0.166 0.090
(0.163) (0.056)
_Cons0.730 ***−2.205 **3.604 ***0.734 ***−0.3543.618 ***
(0.003)(1.080)(1.283)(0.002)(0.603)(1.282)
ControlNoYesYesNoYesYes
City FEYesYesYesYesYesYes
Year FEYesYesYesYesYesYes
R20.9450.9500.9280.8860.9350.928
Obs451245124512451245124512
Note: Values for standard error are bracketed in parentheses. With relatively high precision, significances at the 1% and 5% levels are indicated by *** and **.
Table 8. Conclusions of spatial regression for the CBEC on urban entrepreneurship.
VariableW1W2
CoefficientIndirectDirectTotalCoefficientIndirectDirectTotal
(1)(2)(3)(4)(5)(6)(7)(8)
E_did0.062 ***0.048 ***0.066 ***0.114 ***0.071 ***0.314 ***0.075 ***0.389 ***
(3.63)(3.55)(3.63)(3.61)(4.16)(3.48)(4.16)(3.67)
ρ0.460 *** 0.819 ***
(29.10) (35.70)
R20.217 0.294
Log-Lik323.6299 370.3437
ControlYesYesYesYesYesYesYesYes
City FEYesYesYesYesYesYesYesYes
Year FEYesYesYesYesYesYesYesYes
Obs45124512451245124512451245124512
Note: Values for standard error are bracketed in parentheses. With relatively high precision, significance at the 1% level is indicated by ***.
Disclaimer/Publisher’s Note: The statements, opinions and data contained in all publications are solely those of the individual author(s) and contributor(s) and not of MDPI and/or the editor(s). MDPI and/or the editor(s) disclaim responsibility for any injury to people or property resulting from any ideas, methods, instructions or products referred to in the content.