Gait Characteristics Harvested during a Smartphone-Based Self-Administered 2-Minute Walk Test in People with Multiple Sclerosis: Test-Retest Reliability and Minimum Detectable Change

 , ,
, ,
Abstract
1. Introduction
2. Materials and Methods
2.1. Study Design
2.2. Participants
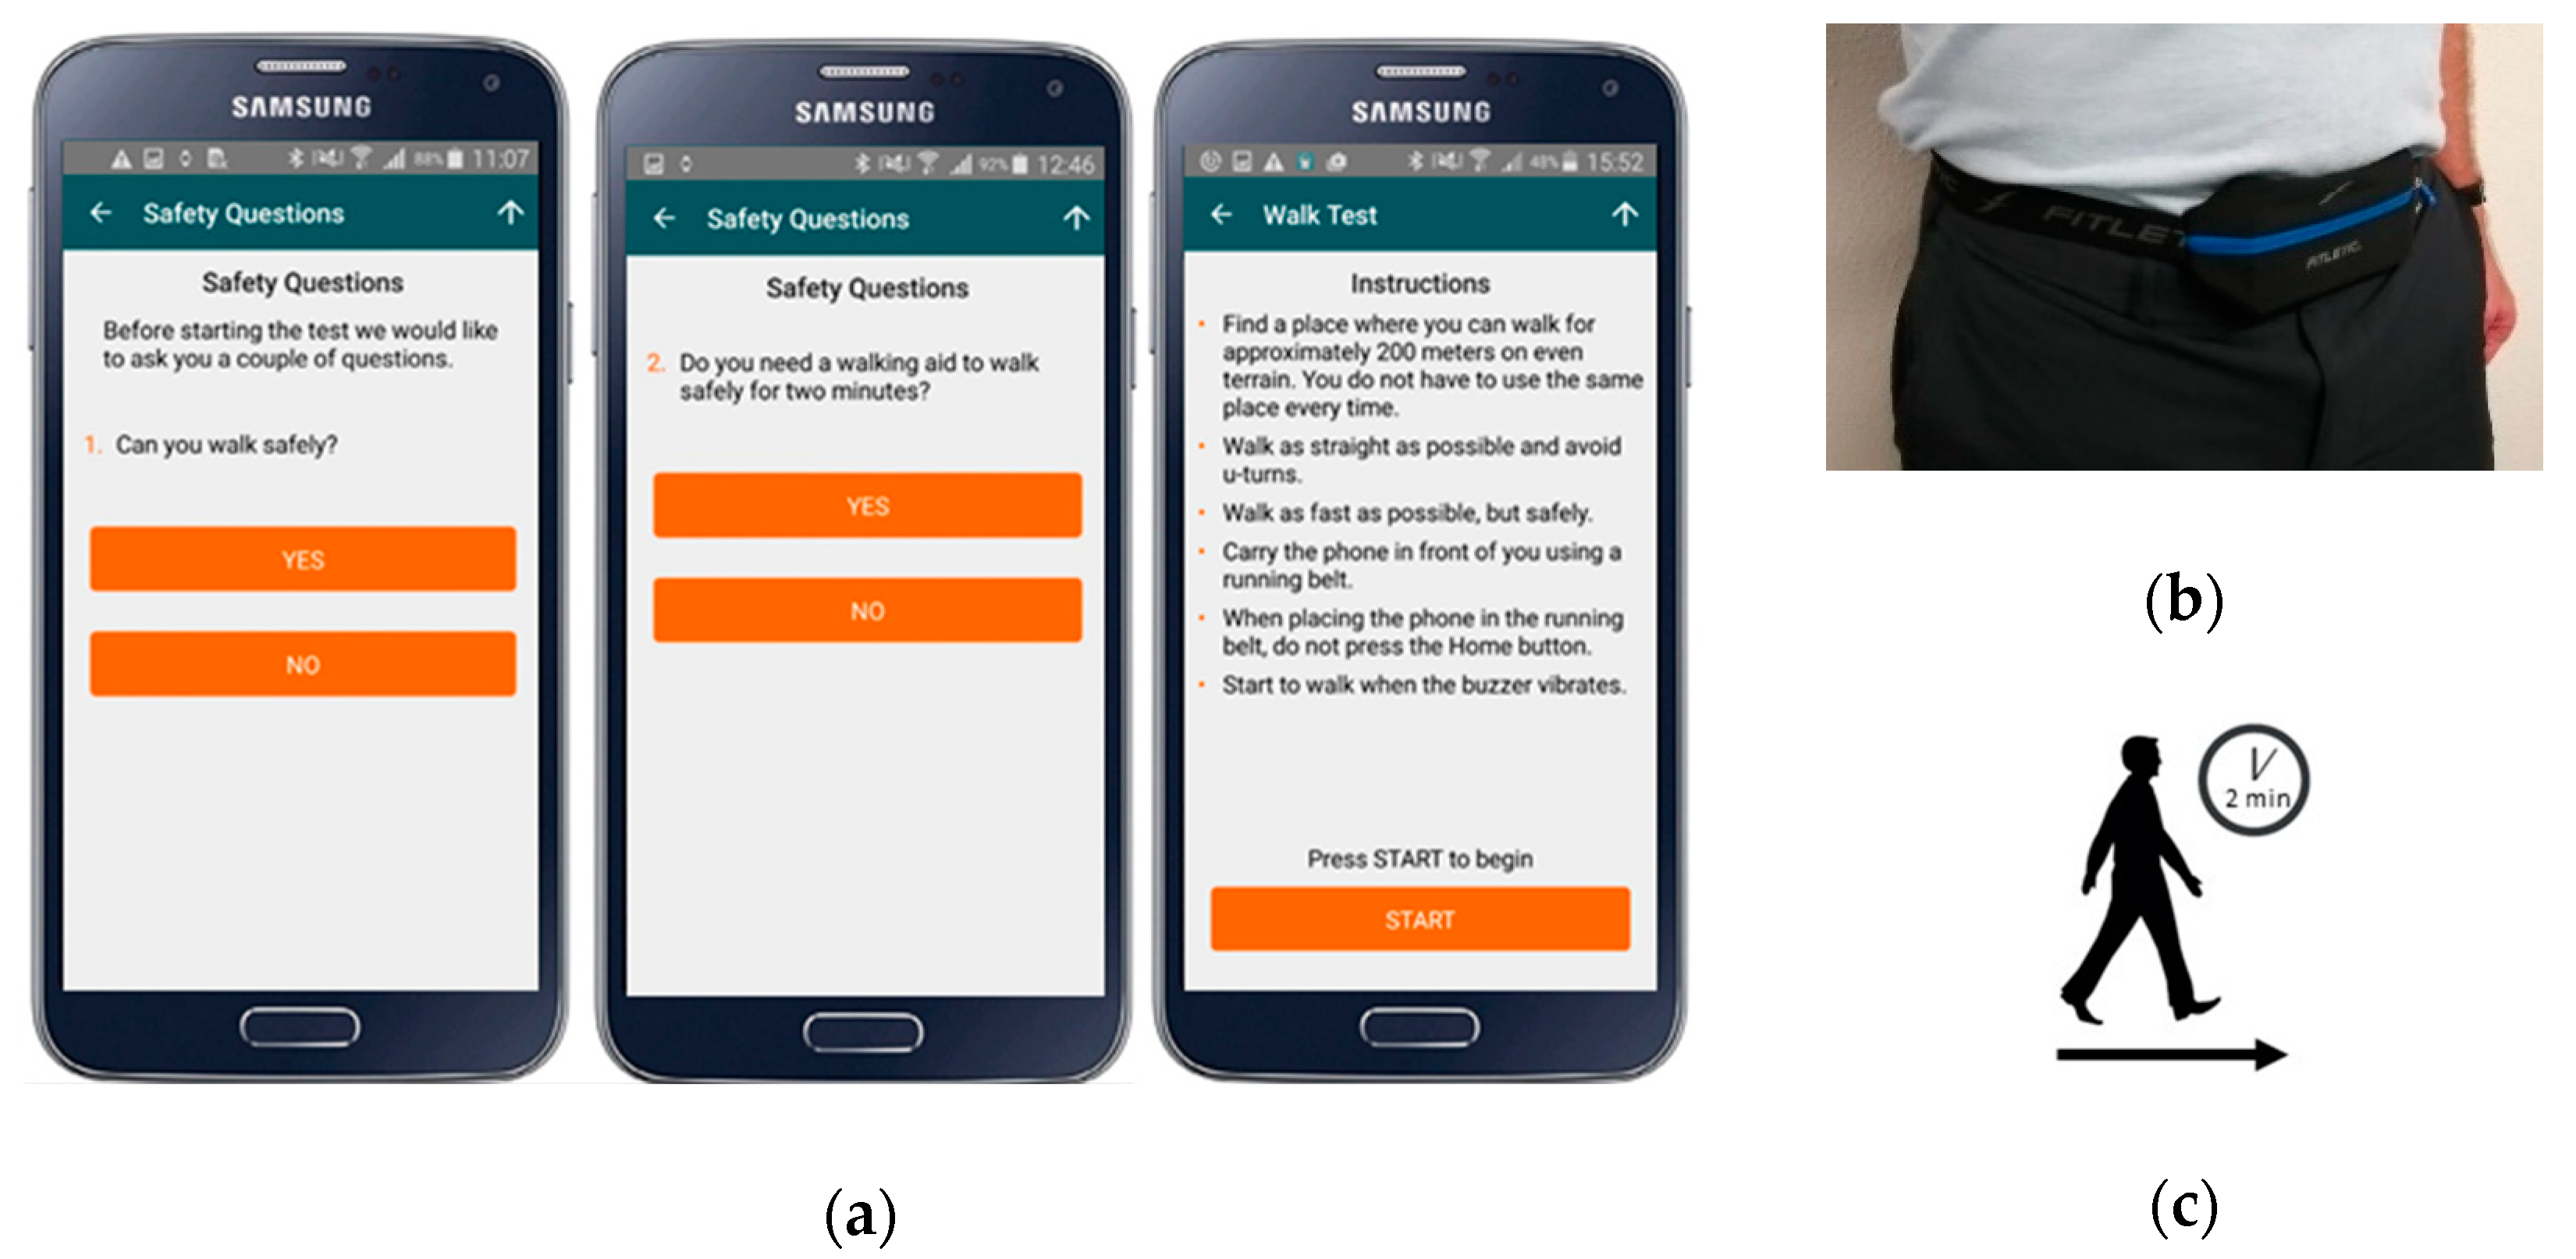
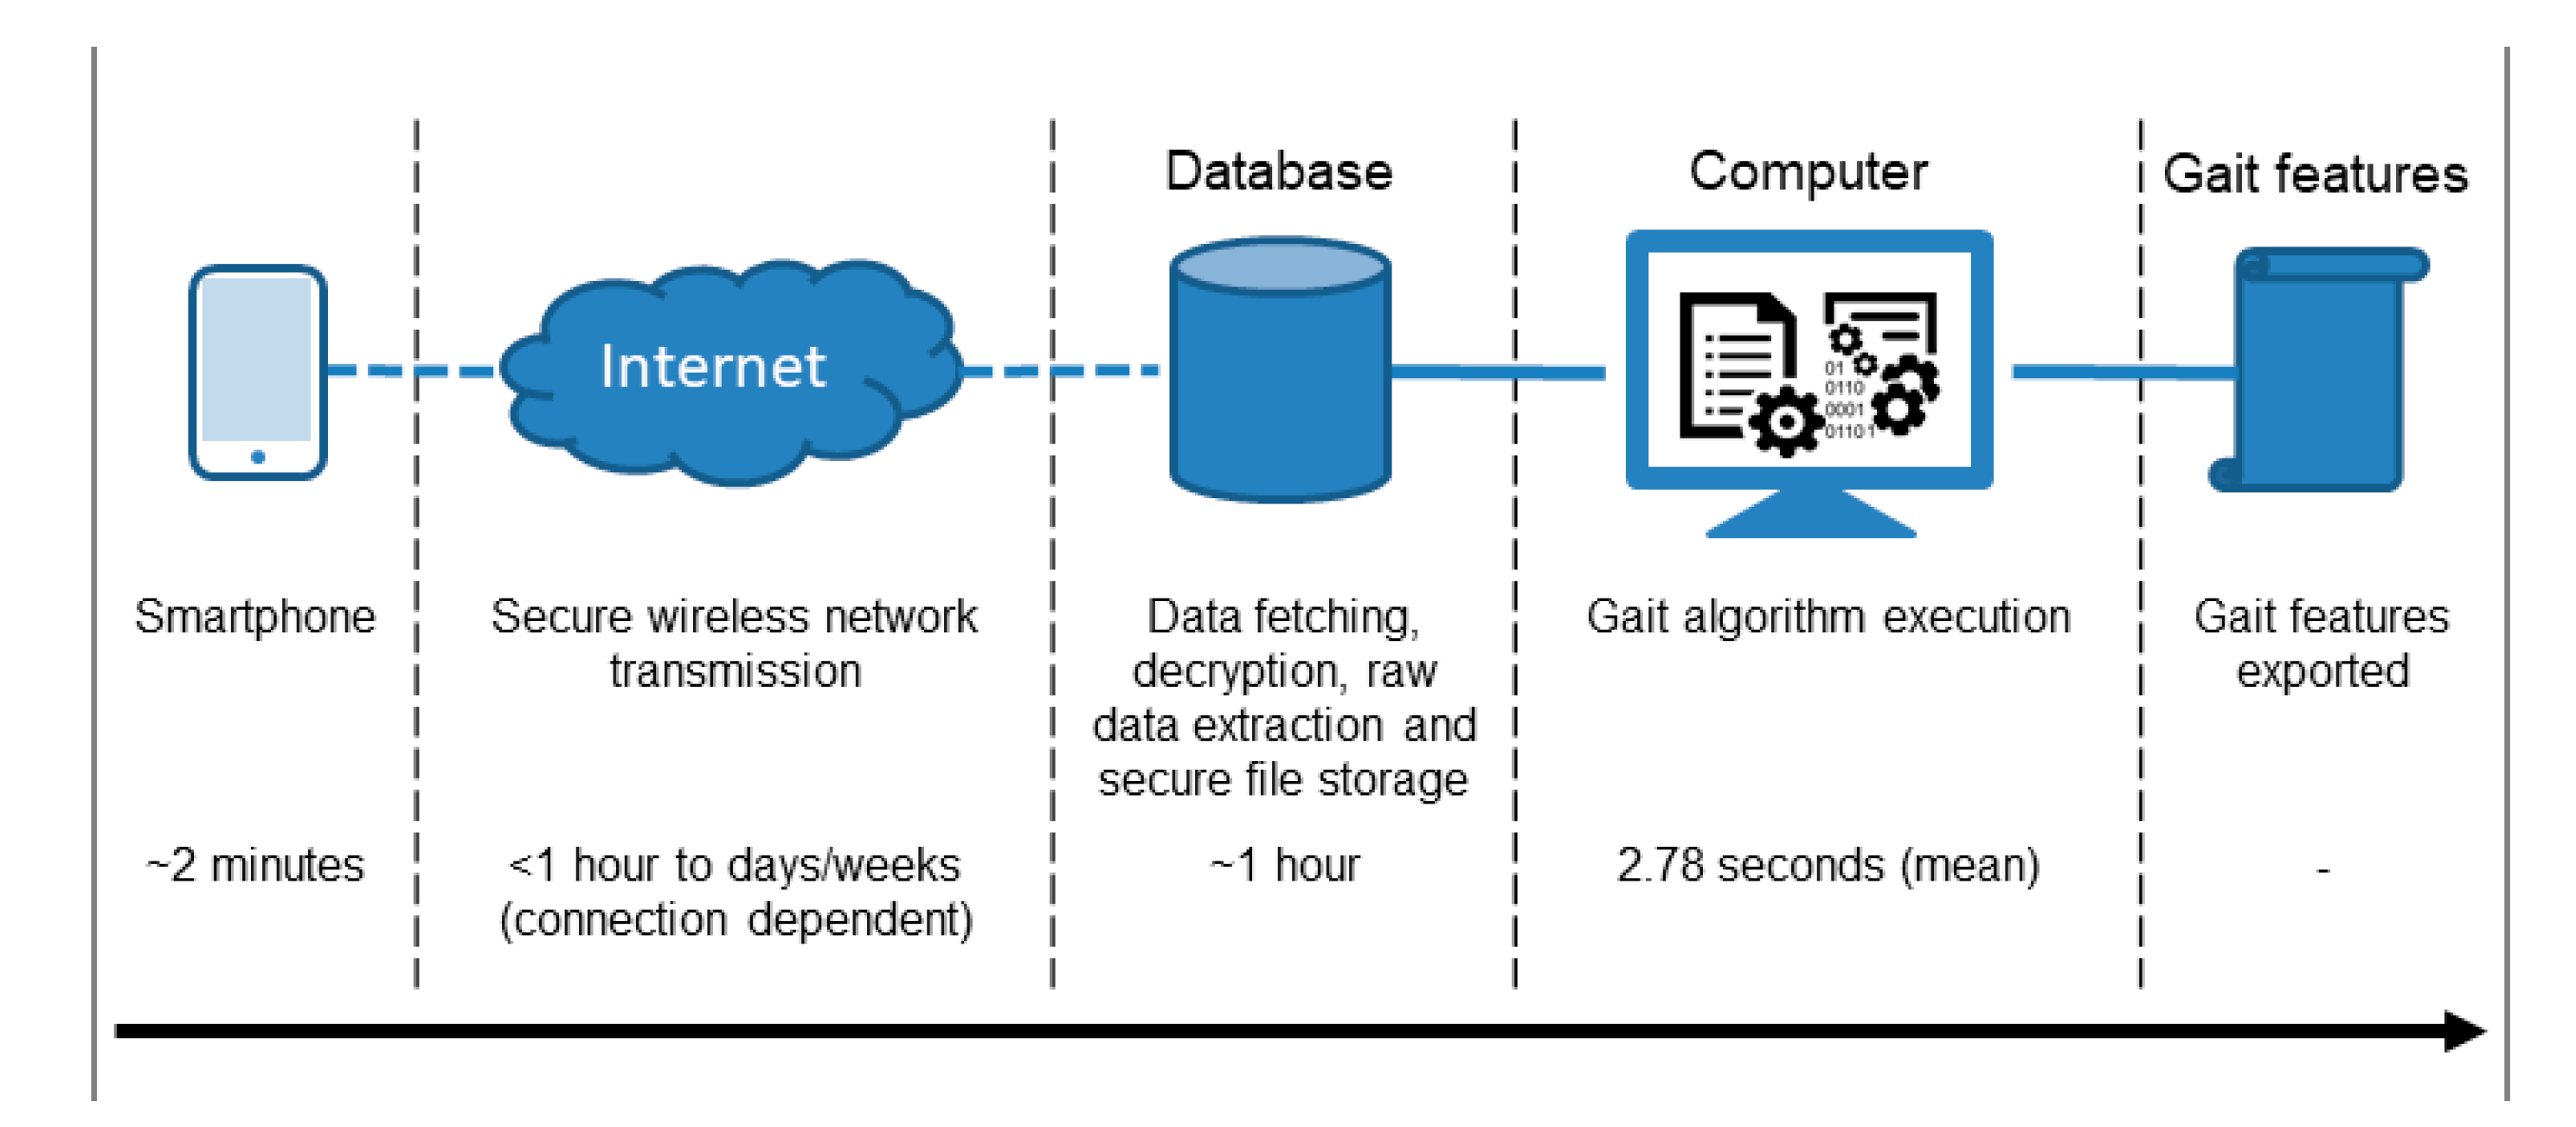
2.3. Protocol and Equipment
2.4. Signal Processing
2.5. Phone Location Detection
2.6. Walking Bout Algorithm
2.7. Gait Algorithms
2.8. Gait Feature Aggregation
2.9. Test-Retest Reliability
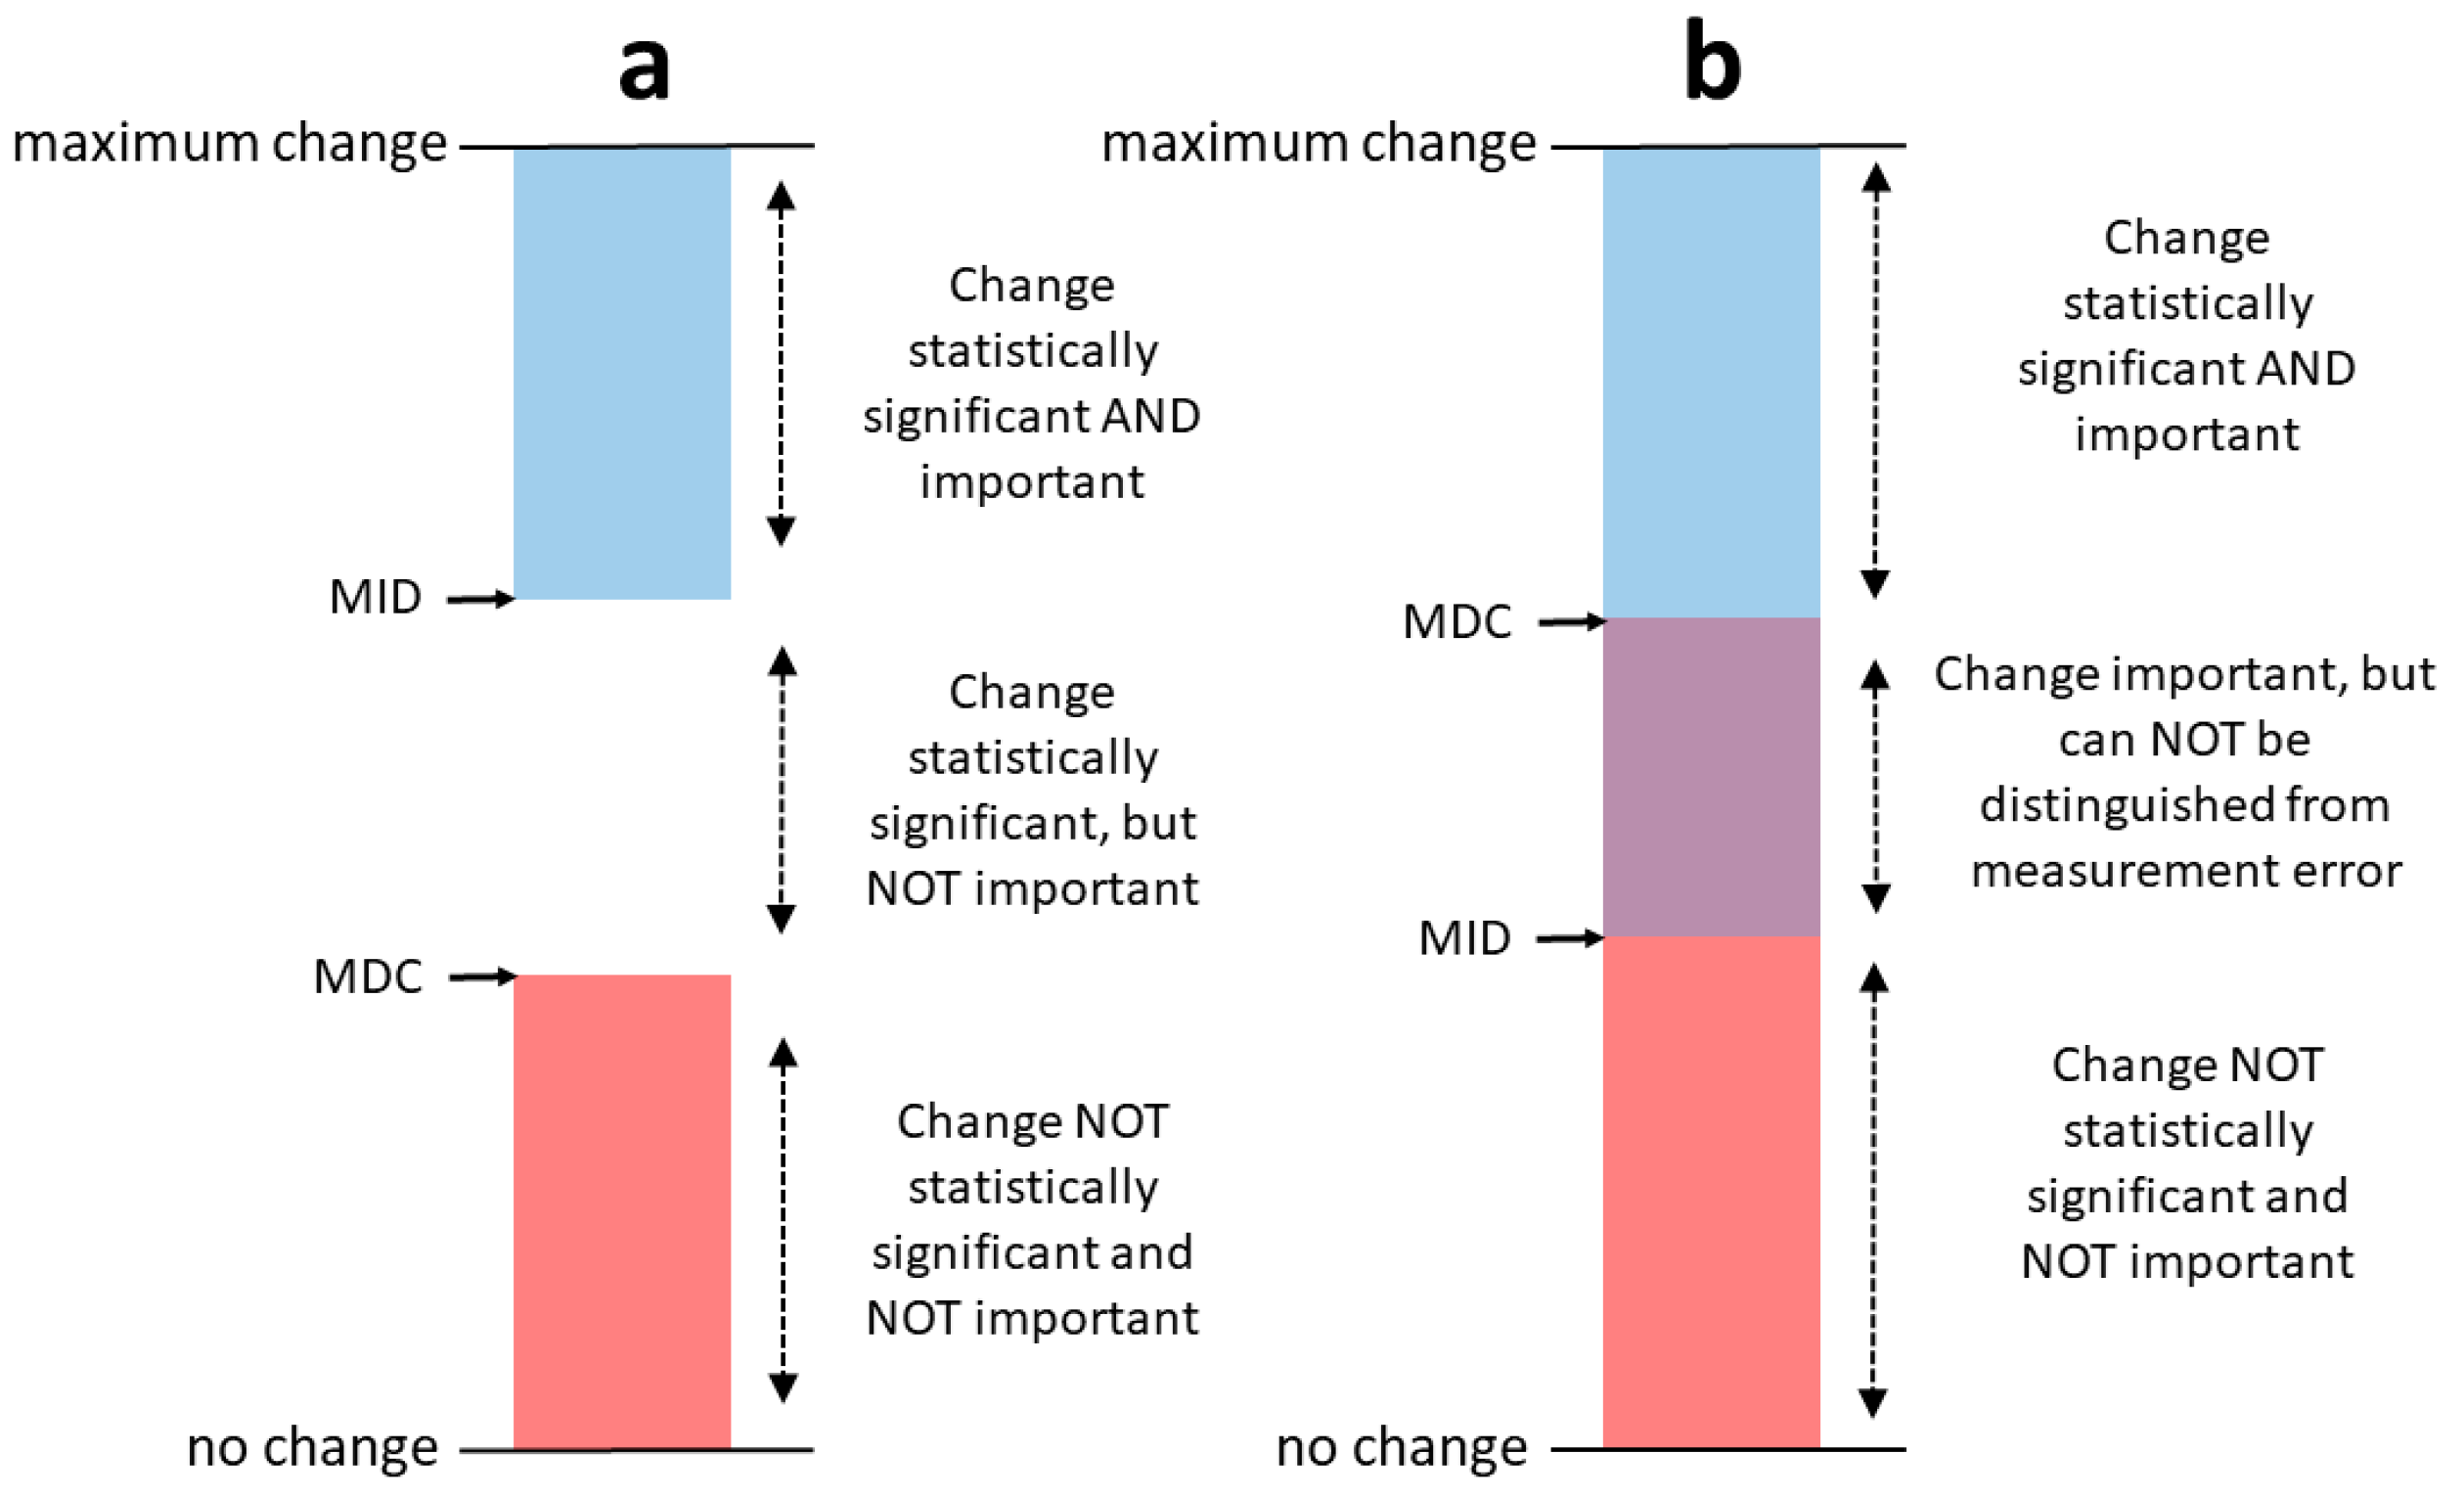
2.10. Standard Error of Measurement (SEM) and Minimum Detectable Change (MDC)
3. Results
3.1. Test-Retest Reliability
3.2. SEM and MDC
4. Discussion
5. Conclusions
Author Contributions
Funding
Acknowledgments
Conflicts of Interest
References
- Losy, J. Is Ms an Inflammatory or Primary Degenerative Disease? J. Neural Transm. 2013, 120, 1459–1462. [Google Scholar] [CrossRef]
- Kalron, A.; Achiron, A.; Dvir, Z. Muscular and Gait Abnormalities in Persons with Early Onset Multiple Sclerosis. J. Neurol. Phys. Ther. 2011, 35, 164–169. [Google Scholar] [CrossRef] [PubMed]
- Zwibel, H.L. Contribution of impaired mobility and general symptoms to the burden of multiple sclerosis. Adv. Ther. 2009, 26, 1043–1057. [Google Scholar] [CrossRef] [PubMed]
- Hemmett, L.; Holmes, J.; Barnes, M.; Russell, N. What drives quality of life in multiple sclerosis? QJM 2004, 97, 671–676. [Google Scholar] [CrossRef] [PubMed]
- Polman, C.H.; Reingold, S.C.; Banwell, B.; Clanet, M.; Cohen, J.A.; Filippi, M.; Fujihara, K.; Havrdova, E.; Hutchinson, M.; Kappos, L.; et al. Diagnostic Criteria for Multiple Sclerosis: 2010 Revisions to the Mcdonald Criteria. Ann. Neurol. 2011, 69, 292–302. [Google Scholar] [CrossRef]
- Rigotti, D.J.; Gass, A.; Achtnichts, L.; Inglese, M.; Babb, J.S.; Naegelin, Y.; Hirsch, J.; Amann, M.; Kappos, L.; Gonen, O. Multiple sclerosis severity scale and whole-brain N-acetylaspartate concentration for patients’ assessment. Mult. Scler. J. 2012, 18, 98–107. [Google Scholar] [CrossRef]
- Bethoux, F.; Bennett, S. Evaluating Walking in Patients with Multiple Sclerosis: Which Assessment Tools Are Useful in Clinical Practice? Int. J. MS Care 2011, 13, 4–14. [Google Scholar] [CrossRef]
- Scalzitti, D.A.; Harwood, K.J.; Maring, J.R.; Leach, S.J.; Ruckert, E.A.; Costello, E. Validation of the 2-Minute Walk Test with the 6-Minute Walk Test and Other Functional Measures in Persons with Multiple Sclerosis. Int. J. MS Care 2018, 20, 158–163. [Google Scholar] [CrossRef]
- Moon, Y.; McGinnis, R.S.; Seagers, K.; Motl, R.W.; Sheth, N.; Wright, J.A., Jr.; Ghaffari, R.; Sosnoff, J.J. Monitoring Gait in Multiple Sclerosis with Novel Wearable Motion Sensors. PLoS ONE 2017, 12, e0171346. [Google Scholar] [CrossRef]
- Taborri, J.; Studer, V.; Grossi, P.; Brambilla, L.; Ferrò, M.T.; Mantegazza, R.; Rossi, S. Measuring Changes in Gait Kinematics Due to Walking-Related Fatigue in Patients with Multiple Sclerosis. In Proceedings of the 2019 IEEE International Symposium on Medical Measurements and Applications (MeMeA), Istanbul, Turkey, 26–28 June 2019; pp. 1–6. [Google Scholar]
- Angelini, L.; Carpinella, I.; Cattaneo, D.; Ferrarin, M.; Gervasoni, E.; Sharrack, B.; Paling, D.; Nair, K.P.S.; Mazza, C. Is a Wearable Sensor-Based Characterisation of Gait Robust Enough to Overcome Differences between Measurement Protocols? A Multi-Centric Pragmatic Study in Patients with Multiple Sclerosis. Sensors 2020, 20, 79. [Google Scholar] [CrossRef]
- Spain, R.I.; Mancini, M.; Horak, F.B.; Bourdette, D. Body-Worn Sensors Capture Variability, but Not Decline, of Gait and Balance Measures in Multiple Sclerosis over 18 Months. Gait Posture 2014, 39, 958–964. [Google Scholar] [CrossRef] [PubMed]
- Spain, R.I.; St George, R.J.; Salarian, A.; Mancini, M.; Wagner, J.M.; Horak, F.B.; Bourdette, D. Body-Worn Motion Sensors Detect Balance and Gait Deficits in People with Multiple Sclerosis Who Have Normal Walking Speed. Gait Posture 2012, 35, 573–578. [Google Scholar] [CrossRef] [PubMed]
- Greene, B.R.; Rutledge, S.; McGurgan, I.; McGuigan, C.; O’Connell, K.; Caulfield, B.; Tubridy, N. Assessment and Classification of Early-Stage Multiple Sclerosis with Inertial Sensors: Comparison against Clinical Measures of Disease State. IEEE J. Biomed. Health Inform. 2015, 19, 1356–1361. [Google Scholar] [CrossRef] [PubMed]
- Craig, J.J.; Bruetsch, A.P.; Lynch, S.G.; Horak, F.B.; Huisinga, J.M. Instrumented Balance and Walking Assessments in Persons with Multiple Sclerosis Show Strong Test-Retest Reliability. J. Neuroeng. Rehabil. 2017, 14, 43. [Google Scholar] [CrossRef]
- Storm, F.A.; Nair, K.P.S.; Clarke, A.J.; Van der Meulen, J.M.; Mazza, C. Free-Living and Laboratory Gait Characteristics in Patients with Multiple Sclerosis. PLoS ONE 2018, 13, e0196463. [Google Scholar] [CrossRef]
- Shema-Shiratzky, S.; Gazit, E.; Sun, R.; Regev, K.; Karni, A.; Sosnoff, J.J.; Herman, T.; Mirelman, A.; Hausdorff, J.M. Deterioration of Specific Aspects of Gait during the Instrumented 6-Min Walk Test among People with Multiple Sclerosis. J. Neurol. 2019, 266, 3022–3030. [Google Scholar] [CrossRef]
- Nair, P.M.; Hornby, T.G.; Behrman, A.L. Minimal Detectable Change for Spatial and Temporal Measurements of Gait after Incomplete Spinal Cord Injury. Top. Spinal. Cord Inj. Rehabil. 2012, 18, 173–281. [Google Scholar]
- De Vet, H.C.; Terwee, C.B. The Minimal Detectable Change Should Not Replace the Minimal Important Difference. J. Clin. Epidemiol. 2010, 63, 804. [Google Scholar] [CrossRef]
- Terwee, C.B.; Roorda, L.D.; Knol, D.L.; De Boer, M.R.; De Vet, H.C.W. Linking Measurement Error to Minimal Important Change of Patient-Reported Outcomes. J. Clin. Epidemiol. 2009, 62, 1062–1067. [Google Scholar] [CrossRef]
- Huang, S.L.; Hsieh, C.L.; Wu, R.M.; Lu, W.S. Test-Retest Reliability and Minimal Detectable Change of the Beck Depression Inventory and the Taiwan Geriatric Depression Scale in Patients with Parkinson’s Disease. PLoS ONE 2017, 12, e0184823. [Google Scholar] [CrossRef]
- Midaglia, L.; Mulero, P.; Montalban, X.; Graves, J.; Hauser, S.L.; Julian, L.; Baker, M.; Schadrack, J.; Gossens, C.; Scotland, A.; et al. Adherence and Satisfaction of Smartphone- and Smartwatch-Based Remote Active Testing and Passive Monitoring in People with Multiple Sclerosis: Nonrandomized Interventional Feasibility Study. J. Med. Internet Res. 2019, 21, e14863. [Google Scholar] [CrossRef] [PubMed]
- Kurtzke, J.F. Rating Neurologic Impairment in Multiple Sclerosis: An Expanded Disability Status Scale (Edss). Neurology 1983, 33, 1444–1452. [Google Scholar] [CrossRef] [PubMed]
- Robertson, D.G.; Dowling, J.J. Design and Responses of Butterworth and Critically Damped Digital Filters. J. Electromyogr. Kinesiol. 2003, 13, 569–573. [Google Scholar] [CrossRef]
- Kok, M.; Hol, J.D.; Schön, T.B. Using Inertial Sensors for Position and Orientation Estimation. Found. Trends Signal. Process. 2017, 11, 151–153. [Google Scholar]
- Hollman, J.H.; McDade, E.M.; Petersen, R.C. Normative Spatiotemporal Gait Parameters in Older Adults. Gait Posture 2011, 34, 111–118. [Google Scholar] [CrossRef]
- Godfrey, A.; Del Din, S.; Barry, G.; Mathers, J.C.; Rochester, L. Instrumenting Gait with an Accelerometer: A System and Algorithm Examination. Med. Eng. Phys. 2015, 37, 400–407. [Google Scholar] [CrossRef]
- Del Din, S.; Hickey, A.; Ladha, C.; Stuart, S.; Bourke, A.K.; Esser, P.; Rochester, L.; Godfrey, A. Instrumented Gait Assessment with a Single Wearable: An Introductory Tutorial. F1000Research 2016, 5, 2323. [Google Scholar] [CrossRef]
- McCamley, J.; Donati, M.; Grimpampi, E.; Mazza, C. An Enhanced Estimate of Initial Contact and Final Contact Instants of Time Using Lower Trunk Inertial Sensor Data. Gait Posture 2012, 36, 316–318. [Google Scholar] [CrossRef]
- Del Din, S.; Godfrey, A.; Rochester, L. Validation of an Accelerometer to Quantify a Comprehensive Battery of Gait Characteristics in Healthy Older Adults and Parkinson’s Disease: Toward Clinical and at Home Use. IEEE J. Biomed. Health Inform. 2015, 20, 838–847. [Google Scholar] [CrossRef]
- Chau, T.; Young, S.; Redekop, S. Managing Variability in the Summary and Comparison of Gait Data. J. Neuroeng. Rehabil. 2005, 2, 22. [Google Scholar] [CrossRef]
- Haberkamp, M.; Moseley, J.; Athanasiou, D.; Andres-Trelles, F.; Elferink, A.; Rosa, M.M.; Magrelli, A. European Regulators’ Views on a Wearable-Derived Performance Measurement of Ambulation for Duchenne Muscular Dystrophy Regulatory Trials. Neuromuscul. Disord. 2019, 29, 514–516. [Google Scholar] [CrossRef]
- Koo, T.K.; Li, M.Y. A Guideline of Selecting and Reporting Intraclass Correlation Coefficients for Reliability Research. J. Chiropr. Med. 2016, 15, 155–163. [Google Scholar] [CrossRef] [PubMed]
- Portney, L.G.; Watkins, M.P. Foundations of Clinical Research: Applications to Practice, 3rd ed.; Prentice Hall: Upper Saddle River, NJ, USA, 2009. [Google Scholar]
- Wuest, S.; Masse, F.; Aminian, K.; Gonzenbach, R.; de Bruin, E.D. Reliability and Validity of the Inertial Sensor-Based Timed “up and Go” Test in Individuals Affected by Stroke. J. Rehabil. Res. Dev. 2016, 53, 599–610. [Google Scholar] [CrossRef] [PubMed]
- Learmonth, Y.C.; Dlugonski, D.D.; Pilutti, L.A.; Sandroff, B.M.; Motl, R.W. The Reliability, Precision and Clinically Meaningful Change of Walking Assessments in Multiple Sclerosis. Mult. Scler. J. 2013, 19, 1784–1791. [Google Scholar] [CrossRef] [PubMed]
- Beckerman, H.; Roebroeck, M.E.; Lankhorst, G.J.; Becher, J.G.; Bezemer, P.D.; Verbeek, A.L.M. Smallest Real Difference, a Link between Reproducibility and Responsiveness. Qual. Life Res. 2001, 10, 571–578. [Google Scholar] [CrossRef] [PubMed]
- Hollman, J.H.; Childs, K.B.; McNeil, M.L.; Mueller, A.C.; Quilter, C.M.; Youdas, J.W. Number of Strides Required for Reliable Measurements of Pace, Rhythm and Variability Parameters of Gait during Normal and Dual Task Walking in Older Individuals. Gait Posture 2010, 32, 23–28. [Google Scholar] [CrossRef]
- Valet, M.; Lejeune, T.; Devis, M.; van Pesch, V.; El Sankari, S.; Stoquart, G. Timed up-and-Go and 2-Minute Walk Test in Patients with Multiple Sclerosis with Mild Disability: Reliability, Responsiveness and Link with Perceived Fatigue. Eur. J. Phys. Rehabil. Med. 2019, 55, 450–455. [Google Scholar] [CrossRef]
- Decavel, P.; Moulin, T.; Sagawa, Y. Gait Tests in Multiple Sclerosis: Reliability and Cut-Off Values. Gait Posture 2019, 67, 37–42. [Google Scholar] [CrossRef]
- Stisen, A.; Blunck, H.; Bhattacharya, S.; Prentow, T.; Kjrgaard, M.; Dey, A.; Sonne, T.; Jensen, M. Smart Devices Are Different: Assessing and Mitigating Mobile Sensing Heterogeneities for Activity Recognition. In Proceedings of the 13th ACM Conference on Embedded Networked Sensor Systems, Seoul, Korea, 1–4 November 2015; pp. 127–140. [Google Scholar]
- Van Hees, V.T.; Fang, Z.; Langford, J.; Assah, F.; Mohammad, A.; da Silva, I.C.M.; Trenell, M.I.; White, T.; Wareham, N.J.; Brage, S. Autocalibration of Accelerometer Data for Free-Living Physical Activity Assessment Using Local Gravity and Temperature: An Evaluation on Four Continents. J. Appl. Physiol. 2014, 117, 738–744. [Google Scholar] [CrossRef]


| Name | Description |
|---|---|
| Spatial | |
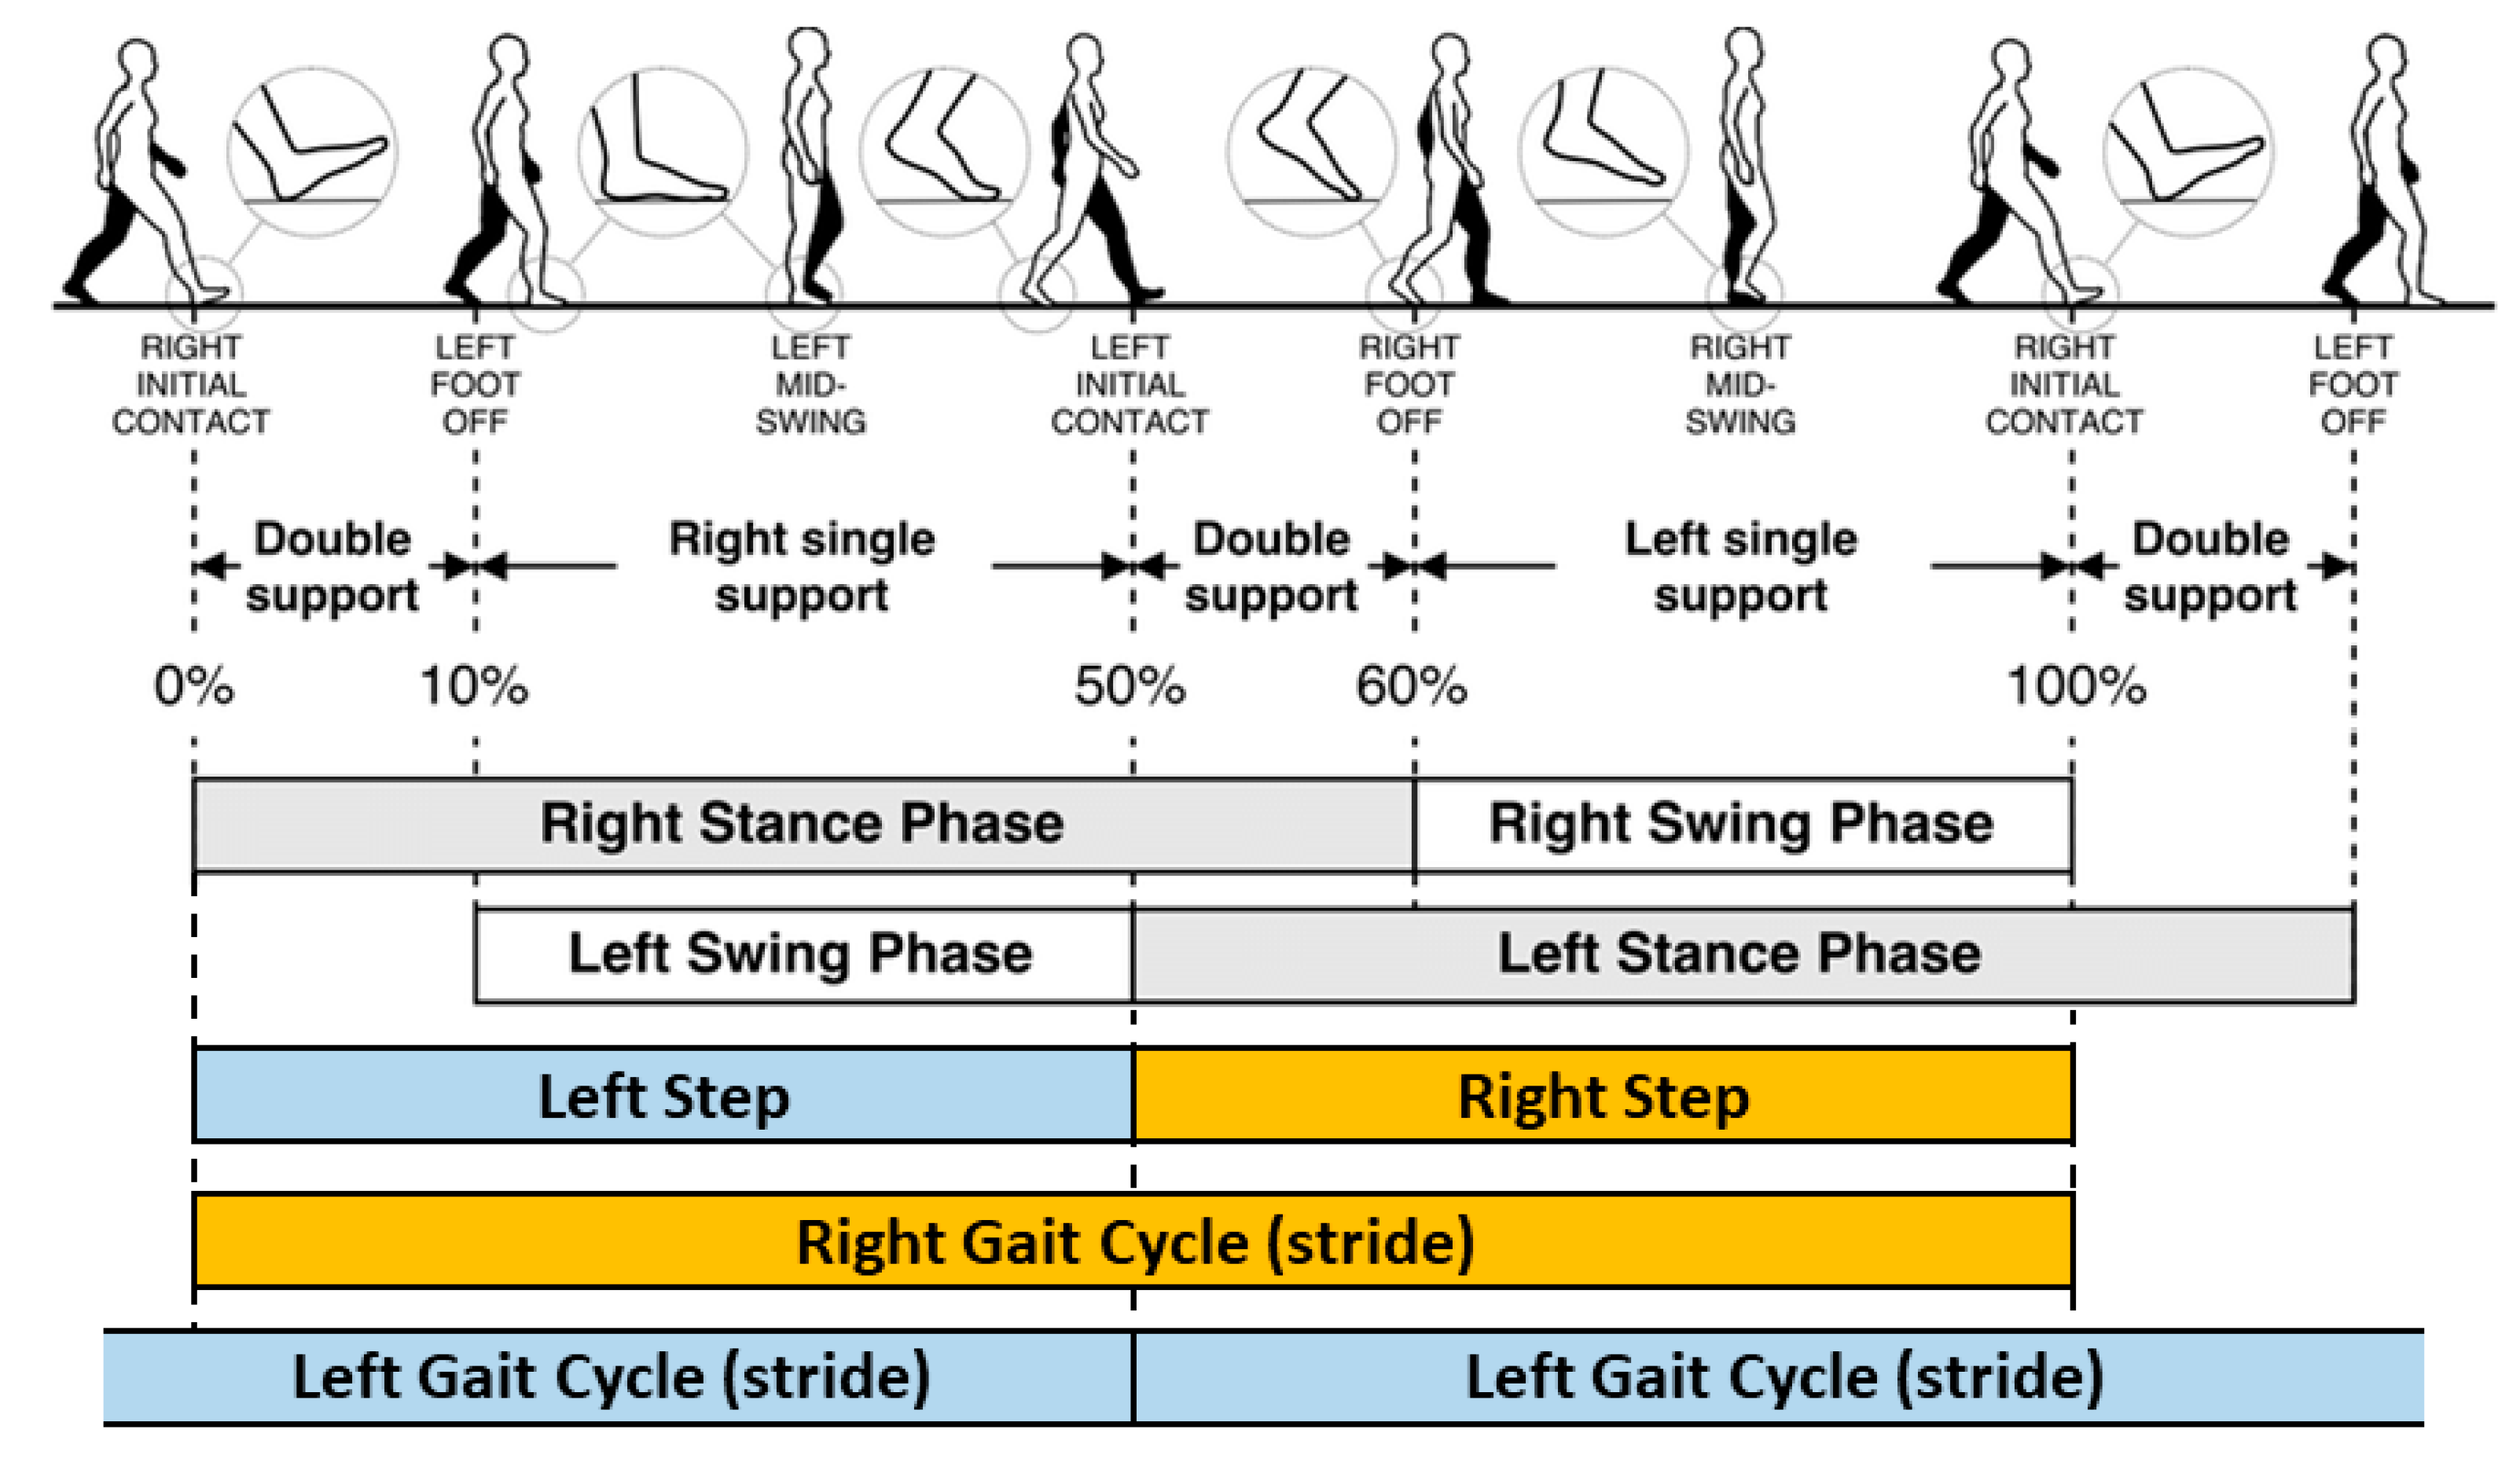
| Step Length | The anterior-posterior distance between the heel of one footprint to the heel of the opposite footprint |
| Stride Length | Anterior-posterior distance between heels of two consecutive footprints of the same foot (left to left, right to right); two steps (e.g., a right step followed by a left step) comprise one stride or one gait cycle |
| Spatiotemporal | |
| Step Velocity | Calculated by dividing the step length by the step time |
| Stride Velocity | Calculated by dividing stride length by the stride time |
| Temporal | |
| Stance Time | The stance phase is the weight bearing portion of each gait cycle initiated at heel contact and ending at toe off of the same foot; stance time is the time elapsed between the initial contact and the last contact of a single footfall |
| Step Time | Time elapsed from initial contact of one foot to initial contact of the opposite foot |
| Stride Time | Time elapsed between the initial contacts of two consecutive footfalls of the same foot |
| Swing Time | The swing phase is initiated with toe off and ends with initial contact of the same foot; swing time is the time elapsed between the last contact of the current footfall to the initial contact of the next footfall of the same foot |
| Parameter | PwMS | HCs |
|---|---|---|
| Subjects (n) | n = 76 | n = 25 |
| Age, mean ± SD, years | 39.5 ± 7.9 | 34.9 ± 9.3 |
| Female, n (%) | 53 (69.7) | 7 (28.0) |
| MS diagnosis (PPMS, SPMS, RRMS), % | 3.9, 5.3, 90.8 | NA |
| Time since MS symptom onset, mean ± SD, years | 11.3 ± 7.0 | NA |
| EDSS, mean ± SD | 2.4 ± 1.4 | NA |
| T25FW, mean ± SD, seconds | 6.0 ± 2.1 | 5.0 ± 1.0 |
| PwMS | HCs | ||||||||||||||||
|---|---|---|---|---|---|---|---|---|---|---|---|---|---|---|---|---|---|
| ICC (2,1) | (lb, | ub) | p | SEM | SEM (%) | MDC | MDC (%) | ICC (2,1) | (lb, | ub) | p | SEM | SEM (%) | MDC | MDC (%) | ||
| Temporal | Temporal | ||||||||||||||||
| stance time (s) | stance time (s) | ||||||||||||||||
| 0.05 | 0.83 | 0.72 | 0.90 | <0.001 | 0.034 | 5.87 | 0.094 | 16.27 | 0.05 | 0.80 | 0.27 | 0.95 | <0.001 | 0.020 | 3.27 | 0.056 | 9.07 |
| 0.25 | 0.81 | 0.69 | 0.89 | <0.001 | 0.028 | 4.49 | 0.078 | 12.43 | 0.25 | 0.86 | 0.59 | 0.96 | <0.001 | 0.017 | 2.54 | 0.046 | 7.05 |
| 0.5 | 0.88 | 0.80 | 0.93 | <0.001 | 0.023 | 3.46 | 0.063 | 9.59 | 0.5 | 0.67 | 0.20 | 0.90 | 0.006 | 0.030 | 4.53 | 0.084 | 12.55 |
| 0.75 | 0.91 | 0.84 | 0.95 | <0.001 | 0.025 | 3.60 | 0.069 | 9.97 | 0.75 | 0.79 | 0.42 | 0.94 | 0.001 | 0.029 | 4.12 | 0.079 | 11.43 |
| 0.95 | 0.90 | 0.83 | 0.94 | <0.001 | 0.037 | 4.96 | 0.102 | 13.76 | 0.95 | 0.91 | 0.71 | 0.97 | <0.001 | 0.027 | 3.68 | 0.075 | 10.19 |
| max | 0.82 | 0.70 | 0.89 | <0.001 | 0.060 | 7.45 | 0.167 | 20.65 | Max | 0.92 | 0.74 | 0.98 | <0.001 | 0.027 | 3.46 | 0.076 | 9.58 |
| mean | 0.92 | 0.87 | 0.95 | <0.001 | 0.017 | 2.54 | 0.046 | 7.05 | Mean | 0.77 | 0.35 | 0.93 | 0.001 | 0.025 | 3.66 | 0.068 | 10.15 |
| min | 0.73 | 0.56 | 0.83 | <0.001 | 0.047 | 9.22 | 0.131 | 25.57 | Min | 0.89 | 0.63 | 0.97 | <0.001 | 0.028 | 5.33 | 0.078 | 14.76 |
| std | 0.87 | 0.79 | 0.93 | <0.001 | 0.018 | 33.95 | 0.051 | 94.11 | Std | 0.89 | 0.63 | 0.97 | <0.001 | 0.009 | 21.82 | 0.026 | 60.49 |
| CV | 0.86 | 0.76 | 0.92 | <0.001 | 0.029 | 34.96 | 0.079 | 96.90 | CV | 0.88 | 0.56 | 0.97 | <0.001 | 0.013 | 20.75 | 0.035 | 57.53 |
| variability | 0.85 | 0.75 | 0.91 | <0.001 | 0.019 | 38.41 | 0.053 | 106.46 | variability | 0.85 | 0.52 | 0.96 | <0.001 | 0.009 | 23.70 | 0.026 | 65.70 |
| asymmetry | 0.86 | 0.76 | 0.92 | <0.001 | 0.013 | 48.19 | 0.035 | 133.57 | asymmetry | 0.89 | 0.66 | 0.97 | <0.001 | 0.011 | 46.96 | 0.029 | 130.18 |
| step time (s) | step time (s) | ||||||||||||||||
| 0.05 | 0.86 | 0.77 | 0.92 | <0.001 | 0.030 | 6.81 | 0.084 | 18.87 | 0.05 | 0.59 | 0.08 | 0.87 | 0.013 | 0.032 | 6.59 | 0.088 | 18.25 |
| 0.25 | 0.74 | 0.59 | 0.84 | <0.001 | 0.031 | 6.35 | 0.085 | 17.59 | 0.25 | 0.92 | 0.74 | 0.98 | <0.001 | 0.010 | 2.03 | 0.029 | 5.63 |
| 0.5 | 0.89 | 0.81 | 0.93 | <0.001 | 0.016 | 3.10 | 0.045 | 8.59 | 0.5 | 0.89 | 0.65 | 0.97 | <0.001 | 0.013 | 2.43 | 0.036 | 6.74 |
| 0.75 | 0.95 | 0.91 | 0.97 | <0.001 | 0.013 | 2.35 | 0.036 | 6.51 | 0.75 | 0.81 | 0.47 | 0.95 | 0.001 | 0.023 | 4.13 | 0.065 | 11.44 |
| 0.95 | 0.92 | 0.87 | 0.96 | <0.001 | 0.025 | 4.18 | 0.070 | 11.59 | 0.95 | 0.98 | 0.94 | 1.00 | <0.001 | 0.009 | 1.53 | 0.025 | 4.23 |
| max | 0.85 | 0.75 | 0.91 | <0.001 | 0.046 | 6.90 | 0.128 | 19.13 | max | 0.87 | 0.59 | 0.96 | <0.001 | 0.031 | 4.73 | 0.086 | 13.11 |
| mean | 0.91 | 0.85 | 0.95 | <0.001 | 0.013 | 2.49 | 0.036 | 6.89 | mean | 0.80 | 0.43 | 0.94 | 0.001 | 0.017 | 3.25 | 0.048 | 9.00 |
| min | 0.69 | 0.51 | 0.81 | <0.001 | 0.047 | 12.41 | 0.129 | 34.39 | min | 0.89 | 0.61 | 0.97 | <0.001 | 0.029 | 7.54 | 0.081 | 20.89 |
| std | 0.90 | 0.83 | 0.94 | <0.001 | 0.015 | 28.27 | 0.043 | 78.35 | std | 0.96 | 0.86 | 0.99 | <0.001 | 0.006 | 13.94 | 0.017 | 38.65 |
| CV | 0.89 | 0.81 | 0.94 | <0.001 | 0.030 | 28.83 | 0.083 | 79.90 | CV | 0.96 | 0.85 | 0.99 | <0.001 | 0.011 | 13.66 | 0.029 | 37.86 |
| variability | 0.88 | 0.81 | 0.93 | <0.001 | 0.015 | 32.04 | 0.043 | 88.82 | variability | 0.94 | 0.81 | 0.98 | <0.001 | 0.005 | 14.01 | 0.015 | 38.84 |
| asymmetry | 0.70 | 0.52 | 0.81 | <0.001 | 0.018 | 55.74 | 0.050 | 154.50 | asymmetry | 0.91 | 0.72 | 0.98 | <0.001 | 0.012 | 37.13 | 0.033 | 102.92 |
| stride time (s) | stride time (s) | ||||||||||||||||
| 0.05 | 0.86 | 0.76 | 0.91 | <0.001 | 0.048 | 5.10 | 0.133 | 14.13 | 0.05 | 0.57 | 0.05 | 0.86 | 0.014 | 0.053 | 5.32 | 0.148 | 14.74 |
| 0.25 | 0.75 | 0.60 | 0.85 | <0.001 | 0.050 | 4.93 | 0.137 | 13.66 | 0.25 | 0.79 | 0.42 | 0.94 | 0.001 | 0.035 | 3.26 | 0.096 | 9.05 |
| 0.5 | 0.90 | 0.83 | 0.94 | <0.001 | 0.030 | 2.88 | 0.083 | 7.97 | 0.5 | 0.82 | 0.48 | 0.95 | <0.001 | 0.035 | 3.21 | 0.096 | 8.90 |
| 0.75 | 0.94 | 0.89 | 0.96 | <0.001 | 0.027 | 2.49 | 0.075 | 6.91 | 0.75 | 0.84 | 0.54 | 0.96 | <0.001 | 0.033 | 3.03 | 0.092 | 8.39 |
| 0.95 | 0.92 | 0.87 | 0.95 | <0.001 | 0.039 | 3.43 | 0.108 | 9.50 | 0.95 | 0.93 | 0.77 | 0.98 | <0.001 | 0.030 | 2.56 | 0.082 | 7.11 |
| max | 0.79 | 0.66 | 0.87 | <0.001 | 0.082 | 6.73 | 0.229 | 18.67 | max | 0.87 | 0.60 | 0.96 | <0.001 | 0.045 | 3.67 | 0.124 | 10.16 |
| mean | 0.91 | 0.86 | 0.95 | <0.001 | 0.026 | 2.48 | 0.072 | 6.88 | mean | 0.78 | 0.39 | 0.94 | 0.001 | 0.036 | 3.37 | 0.101 | 9.34 |
| min | 0.68 | 0.50 | 0.80 | <0.001 | 0.080 | 9.43 | 0.222 | 26.15 | min | 0.92 | 0.70 | 0.98 | <0.001 | 0.043 | 4.92 | 0.119 | 13.64 |
| std | 0.87 | 0.78 | 0.92 | <0.001 | 0.023 | 35.44 | 0.064 | 98.24 | std | 0.74 | 0.25 | 0.93 | 0.001 | 0.016 | 29.91 | 0.044 | 82.92 |
| CV | 0.84 | 0.74 | 0.91 | <0.001 | 0.025 | 39.06 | 0.069 | 108.27 | CV | 0.73 | 0.22 | 0.92 | 0.001 | 0.014 | 29.26 | 0.039 | 81.12 |
| variability | 0.87 | 0.78 | 0.92 | <0.001 | 0.022 | 35.13 | 0.062 | 97.37 | variability | 0.75 | 0.25 | 0.93 | 0.001 | 0.016 | 29.51 | 0.043 | 81.80 |
| asymmetry | 0.94 | 0.90 | 0.97 | <0.001 | 0.006 | 67.33 | 0.017 | 186.63 | asymmetry | 0.75 | 0.29 | 0.93 | 0.003 | 0.001 | 37.66 | 0.003 | 104.39 |
| swing time (s) | swing time (s) | ||||||||||||||||
| 0.05 | 0.85 | 0.76 | 0.91 | <0.001 | 0.026 | 7.82 | 0.071 | 21.67 | 0.05 | 0.71 | 0.24 | 0.91 | 0.002 | 0.021 | 5.60 | 0.057 | 15.54 |
| 0.25 | 0.77 | 0.62 | 0.86 | <0.001 | 0.026 | 7.32 | 0.073 | 20.29 | 0.25 | 0.81 | 0.47 | 0.95 | 0.001 | 0.014 | 3.66 | 0.040 | 10.14 |
| 0.5 | 0.93 | 0.88 | 0.96 | <0.001 | 0.012 | 3.11 | 0.033 | 8.63 | 0.5 | 0.84 | 0.53 | 0.96 | <0.001 | 0.013 | 3.07 | 0.035 | 8.50 |
| 0.75 | 0.93 | 0.88 | 0.96 | <0.001 | 0.010 | 2.55 | 0.029 | 7.08 | 0.75 | 0.82 | 0.49 | 0.95 | 0.001 | 0.016 | 3.83 | 0.045 | 10.61 |
| 0.95 | 0.87 | 0.79 | 0.93 | <0.001 | 0.019 | 4.24 | 0.052 | 11.77 | 0.95 | 0.93 | 0.76 | 0.98 | <0.001 | 0.013 | 2.81 | 0.035 | 7.78 |
| max | 0.85 | 0.76 | 0.91 | <0.001 | 0.030 | 6.02 | 0.082 | 16.69 | Max | 0.88 | 0.62 | 0.97 | <0.001 | 0.021 | 4.23 | 0.057 | 11.72 |
| mean | 0.91 | 0.85 | 0.95 | <0.001 | 0.012 | 2.98 | 0.032 | 8.27 | Mean | 0.84 | 0.52 | 0.95 | <0.001 | 0.012 | 2.97 | 0.034 | 8.22 |
| min | 0.72 | 0.56 | 0.83 | <0.001 | 0.036 | 13.24 | 0.100 | 36.71 | Min | 0.85 | 0.55 | 0.96 | <0.001 | 0.026 | 8.96 | 0.072 | 24.83 |
| std | 0.93 | 0.88 | 0.96 | <0.001 | 0.009 | 21.42 | 0.024 | 59.37 | Std | 0.90 | 0.53 | 0.97 | <0.001 | 0.007 | 22.58 | 0.020 | 62.60 |
| CV | 0.90 | 0.83 | 0.94 | <0.001 | 0.030 | 27.72 | 0.083 | 76.84 | CV | 0.88 | 0.44 | 0.97 | <0.001 | 0.018 | 23.40 | 0.050 | 64.86 |
| variability | 0.94 | 0.89 | 0.96 | <0.001 | 0.008 | 21.60 | 0.022 | 59.87 | variability | 0.88 | 0.44 | 0.97 | <0.001 | 0.005 | 18.06 | 0.013 | 50.06 |
| asymmetry | 0.79 | 0.67 | 0.88 | <0.001 | 0.008 | 37.86 | 0.021 | 104.94 | asymmetry | 0.95 | 0.83 | 0.99 | <0.001 | 0.007 | 33.07 | 0.020 | 91.67 |
| PwMS | HCs | ||||||||||||||||
|---|---|---|---|---|---|---|---|---|---|---|---|---|---|---|---|---|---|
| ICC (2,1) | (lb, | ub) | p | SEM | SEM (%) | MDC | MDC (%) | ICC (2,1) | (lb, | ub) | p | SEM | SEM (%) | MDC | MDC (%) | ||
| Spatial | Spatial | ||||||||||||||||
| step length (m) | step length (m) | ||||||||||||||||
| 0.05 | 0.94 | 0.90 | 0.97 | <0.001 | 0.041 | 8.94 | 0.114 | 24.79 | 0.05 | 0.45 | -0.11 | 0.81 | 0.061 | 0.095 | 18.87 | 0.263 | 52.31 |
| 0.25 | 0.94 | 0.90 | 0.97 | <0.001 | 0.032 | 5.99 | 0.090 | 16.60 | 0.25 | 0.70 | 0.23 | 0.91 | 0.006 | 0.046 | 7.73 | 0.128 | 21.44 |
| 0.5 | 0.94 | 0.89 | 0.96 | <0.001 | 0.029 | 5.01 | 0.082 | 13.90 | 0.5 | 0.92 | 0.74 | 0.98 | <0.001 | 0.022 | 3.39 | 0.061 | 9.40 |
| 0.75 | 0.93 | 0.87 | 0.96 | <0.001 | 0.030 | 4.73 | 0.083 | 13.12 | 0.75 | 0.92 | 0.73 | 0.98 | <0.001 | 0.025 | 3.63 | 0.068 | 10.07 |
| 0.95 | 0.78 | 0.65 | 0.87 | <0.001 | 0.059 | 8.58 | 0.163 | 23.77 | 0.95 | 0.96 | 0.80 | 0.99 | <0.001 | 0.020 | 2.74 | 0.054 | 7.58 |
| max | 0.53 | 0.30 | 0.70 | <0.001 | 0.155 | 19.68 | 0.430 | 54.56 | max | 0.96 | 0.86 | 0.99 | <0.001 | 0.022 | 2.81 | 0.061 | 7.78 |
| mean | 0.95 | 0.91 | 0.97 | <0.001 | 0.028 | 4.75 | 0.077 | 13.16 | mean | 0.90 | 0.67 | 0.97 | <0.001 | 0.025 | 3.92 | 0.068 | 10.87 |
| min | 0.75 | 0.60 | 0.85 | <0.001 | 0.072 | 26.99 | 0.200 | 74.80 | min | 0.63 | 0.07 | 0.89 | 0.005 | 0.064 | 23.01 | 0.178 | 63.79 |
| std | 0.84 | 0.73 | 0.90 | <0.001 | 0.020 | 24.02 | 0.054 | 66.59 | std | 0.45 | −0.08 | 0.81 | 0.048 | 0.035 | 43.93 | 0.097 | 121.77 |
| CV | 0.93 | 0.87 | 0.96 | <0.001 | 0.030 | 19.18 | 0.082 | 53.15 | CV | 0.33 | −0.19 | 0.75 | 0.115 | 0.066 | 51.28 | 0.183 | 142.15 |
| variability | 0.78 | 0.65 | 0.87 | <0.001 | 0.021 | 28.78 | 0.058 | 79.78 | variability | 0.59 | 0.07 | 0.87 | 0.014 | 0.023 | 32.15 | 0.063 | 89.12 |
| asymmetry | 0.78 | 0.64 | 0.87 | <0.001 | 0.024 | 53.39 | 0.067 | 148.00 | asymmetry | 0.70 | 0.20 | 0.91 | 0.007 | 0.023 | 59.55 | 0.063 | 165.07 |
| stride length (m) | stride length (m) | ||||||||||||||||
| 0.05 | 0.93 | 0.88 | 0.96 | <0.001 | 0.076 | 7.57 | 0.212 | 20.99 | 0.05 | 0.68 | 0.19 | 0.90 | 0.008 | 0.092 | 8.22 | 0.255 | 22.79 |
| 0.25 | 0.95 | 0.91 | 0.97 | <0.001 | 0.059 | 5.31 | 0.165 | 14.73 | 0.25 | 0.81 | 0.47 | 0.94 | 0.001 | 0.069 | 5.71 | 0.192 | 15.83 |
| 0.5 | 0.94 | 0.89 | 0.96 | <0.001 | 0.059 | 5.01 | 0.163 | 13.88 | 0.5 | 0.92 | 0.72 | 0.98 | <0.001 | 0.044 | 3.49 | 0.123 | 9.69 |
| 0.75 | 0.89 | 0.82 | 0.94 | <0.001 | 0.073 | 5.91 | 0.201 | 16.39 | 0.75 | 0.96 | 0.86 | 0.99 | <0.001 | 0.033 | 2.49 | 0.091 | 6.89 |
| 0.95 | 0.89 | 0.82 | 0.94 | <0.001 | 0.069 | 5.36 | 0.192 | 14.85 | 0.95 | 0.95 | 0.83 | 0.99 | <0.001 | 0.038 | 2.77 | 0.106 | 7.69 |
| max | 0.84 | 0.74 | 0.91 | <0.001 | 0.093 | 6.77 | 0.259 | 18.76 | max | 0.95 | 0.82 | 0.98 | <0.001 | 0.042 | 2.91 | 0.116 | 8.08 |
| mean | 0.94 | 0.90 | 0.97 | <0.001 | 0.056 | 4.80 | 0.155 | 13.32 | mean | 0.91 | 0.69 | 0.97 | <0.001 | 0.048 | 3.81 | 0.133 | 10.55 |
| min | 0.84 | 0.74 | 0.91 | <0.001 | 0.111 | 13.45 | 0.308 | 37.28 | min | 0.81 | 0.44 | 0.95 | <0.001 | 0.058 | 6.22 | 0.161 | 17.25 |
| std | 0.74 | 0.59 | 0.85 | <0.001 | 0.027 | 26.30 | 0.074 | 72.90 | std | 0.70 | 0.25 | 0.91 | 0.004 | 0.024 | 25.30 | 0.067 | 70.12 |
| CV | 0.82 | 0.71 | 0.90 | <0.001 | 0.031 | 30.78 | 0.085 | 85.31 | CV | 0.56 | 0.02 | 0.85 | 0.025 | 0.025 | 32.02 | 0.069 | 88.75 |
| Spatiotemporal | Spatiotemporal | ||||||||||||||||
| step velocity (m/s) | step velocity (m/s) | ||||||||||||||||
| 0.05 | 0.92 | 0.87 | 0.96 | <0.001 | 0.090 | 10.37 | 0.250 | 28.73 | 0.05 | 0.63 | 0.12 | 0.88 | 0.012 | 0.155 | 16.70 | 0.429 | 46.30 |
| 0.25 | 0.94 | 0.90 | 0.97 | <0.001 | 0.064 | 6.16 | 0.177 | 17.07 | 0.25 | 0.88 | 0.63 | 0.97 | <0.001 | 0.064 | 5.76 | 0.177 | 15.96 |
| 0.5 | 0.95 | 0.91 | 0.97 | <0.001 | 0.055 | 4.84 | 0.152 | 13.41 | 0.5 | 0.95 | 0.81 | 0.99 | <0.001 | 0.037 | 3.06 | 0.102 | 8.49 |
| 0.75 | 0.92 | 0.86 | 0.95 | <0.001 | 0.065 | 5.32 | 0.181 | 14.73 | 0.75 | 0.93 | 0.76 | 0.98 | <0.001 | 0.045 | 3.57 | 0.126 | 9.88 |
| 0.95 | 0.82 | 0.70 | 0.89 | <0.001 | 0.092 | 6.74 | 0.255 | 18.69 | 0.95 | 0.93 | 0.73 | 0.98 | <0.001 | 0.050 | 3.67 | 0.139 | 10.17 |
| max | 0.53 | 0.30 | 0.70 | <0.001 | 0.249 | 15.49 | 0.691 | 42.94 | max | 0.75 | 0.31 | 0.93 | 0.003 | 0.166 | 10.26 | 0.460 | 28.45 |
| mean | 0.95 | 0.91 | 0.97 | <0.001 | 0.054 | 4.79 | 0.150 | 13.28 | mean | 0.93 | 0.78 | 0.98 | <0.001 | 0.045 | 3.79 | 0.125 | 10.52 |
| min | 0.80 | 0.67 | 0.88 | <0.001 | 0.124 | 24.54 | 0.343 | 68.02 | min | 0.66 | 0.14 | 0.90 | 0.004 | 0.106 | 19.88 | 0.293 | 55.10 |
| std | 0.76 | 0.62 | 0.86 | <0.001 | 0.045 | 25.86 | 0.124 | 71.68 | std | 0.50 | −0.03 | 0.83 | 0.030 | 0.053 | 32.92 | 0.146 | 91.25 |
| CV | 0.89 | 0.81 | 0.93 | <0.001 | 0.039 | 22.98 | 0.108 | 63.70 | CV | 0.40 | −0.15 | 0.78 | 0.081 | 0.054 | 38.20 | 0.149 | 105.89 |
| variability | 0.75 | 0.60 | 0.85 | <0.001 | 0.045 | 27.85 | 0.125 | 77.19 | variability | 0.69 | 0.19 | 0.91 | 0.002 | 0.037 | 24.93 | 0.102 | 69.11 |
| asymmetry | 0.73 | 0.57 | 0.84 | <0.001 | 0.036 | 44.41 | 0.100 | 123.09 | asymmetry | 0.61 | 0.05 | 0.88 | 0.020 | 0.025 | 41.49 | 0.068 | 115.01 |
| stride velocity (m/s) | stride velocity (m/s) | ||||||||||||||||
| 0.05 | 0.93 | 0.88 | 0.96 | <0.001 | 0.077 | 8.05 | 0.213 | 22.31 | 0.05 | 0.85 | 0.54 | 0.96 | <0.001 | 0.074 | 7.19 | 0.204 | 19.94 |
| 0.25 | 0.95 | 0.91 | 0.97 | <0.001 | 0.060 | 5.65 | 0.167 | 15.65 | 0.25 | 0.92 | 0.73 | 0.98 | <0.001 | 0.050 | 4.45 | 0.139 | 12.34 |
| 0.5 | 0.96 | 0.93 | 0.98 | <0.001 | 0.050 | 4.45 | 0.139 | 12.33 | 0.5 | 0.95 | 0.83 | 0.99 | <0.001 | 0.040 | 3.35 | 0.111 | 9.30 |
| 0.75 | 0.94 | 0.90 | 0.97 | <0.001 | 0.055 | 4.64 | 0.153 | 12.87 | 0.75 | 0.96 | 0.85 | 0.99 | <0.001 | 0.038 | 3.05 | 0.105 | 8.45 |
| 0.95 | 0.94 | 0.90 | 0.97 | <0.001 | 0.053 | 4.16 | 0.146 | 11.53 | 0.95 | 0.95 | 0.84 | 0.99 | <0.001 | 0.042 | 3.22 | 0.116 | 8.93 |
| max | 0.85 | 0.76 | 0.91 | <0.001 | 0.091 | 6.69 | 0.254 | 18.56 | max | 0.85 | 0.54 | 0.96 | <0.001 | 0.081 | 5.91 | 0.226 | 16.39 |
| mean | 0.95 | 0.92 | 0.97 | <0.001 | 0.054 | 4.76 | 0.148 | 13.19 | mean | 0.94 | 0.81 | 0.98 | <0.001 | 0.041 | 3.50 | 0.114 | 9.71 |
| min | 0.82 | 0.71 | 0.89 | <0.001 | 0.114 | 14.59 | 0.317 | 40.44 | min | 0.88 | 0.60 | 0.97 | <0.001 | 0.049 | 5.70 | 0.135 | 15.80 |
| std | 0.67 | 0.48 | 0.80 | <0.001 | 0.030 | 27.37 | 0.083 | 75.87 | std | 0.61 | 0.10 | 0.88 | 0.012 | 0.024 | 23.51 | 0.066 | 65.18 |
| CV | 0.85 | 0.75 | 0.91 | <0.001 | 0.029 | 26.12 | 0.080 | 72.41 | CV | 0.60 | 0.08 | 0.87 | 0.017 | 0.024 | 27.23 | 0.067 | 75.48 |
Publisher’s Note: MDPI stays neutral with regard to jurisdictional claims in published maps and institutional affiliations. |
© 2020 by the authors. Licensee MDPI, Basel, Switzerland. This article is an open access article distributed under the terms and conditions of the Creative Commons Attribution (CC BY) license (http://creativecommons.org/licenses/by/4.0/).
Share and Cite
Bourke, A.K.; Scotland, A.; Lipsmeier, F.; Gossens, C.; Lindemann, M. Gait Characteristics Harvested during a Smartphone-Based Self-Administered 2-Minute Walk Test in People with Multiple Sclerosis: Test-Retest Reliability and Minimum Detectable Change. Sensors 2020, 20, 5906. https://doi.org/10.3390/s20205906
Bourke AK, Scotland A, Lipsmeier F, Gossens C, Lindemann M. Gait Characteristics Harvested during a Smartphone-Based Self-Administered 2-Minute Walk Test in People with Multiple Sclerosis: Test-Retest Reliability and Minimum Detectable Change. Sensors. 2020; 20(20):5906. https://doi.org/10.3390/s20205906
Chicago/Turabian StyleBourke, Alan K., Alf Scotland, Florian Lipsmeier, Christian Gossens, and Michael Lindemann. 2020. "Gait Characteristics Harvested during a Smartphone-Based Self-Administered 2-Minute Walk Test in People with Multiple Sclerosis: Test-Retest Reliability and Minimum Detectable Change" Sensors 20, no. 20: 5906. https://doi.org/10.3390/s20205906
APA StyleBourke, A. K., Scotland, A., Lipsmeier, F., Gossens, C., & Lindemann, M. (2020). Gait Characteristics Harvested during a Smartphone-Based Self-Administered 2-Minute Walk Test in People with Multiple Sclerosis: Test-Retest Reliability and Minimum Detectable Change. Sensors, 20(20), 5906. https://doi.org/10.3390/s20205906