
Model-Based Evaluation of HangAmDan-B1 and Afatinib Combination Therapy in HCC827 Xenograft Mice with Resistance to Epidermal Growth Factor Receptor Tyrosine Kinase Inhibitor

 , ,
, ,  and
and
Abstract
:1. Introduction
2. Results
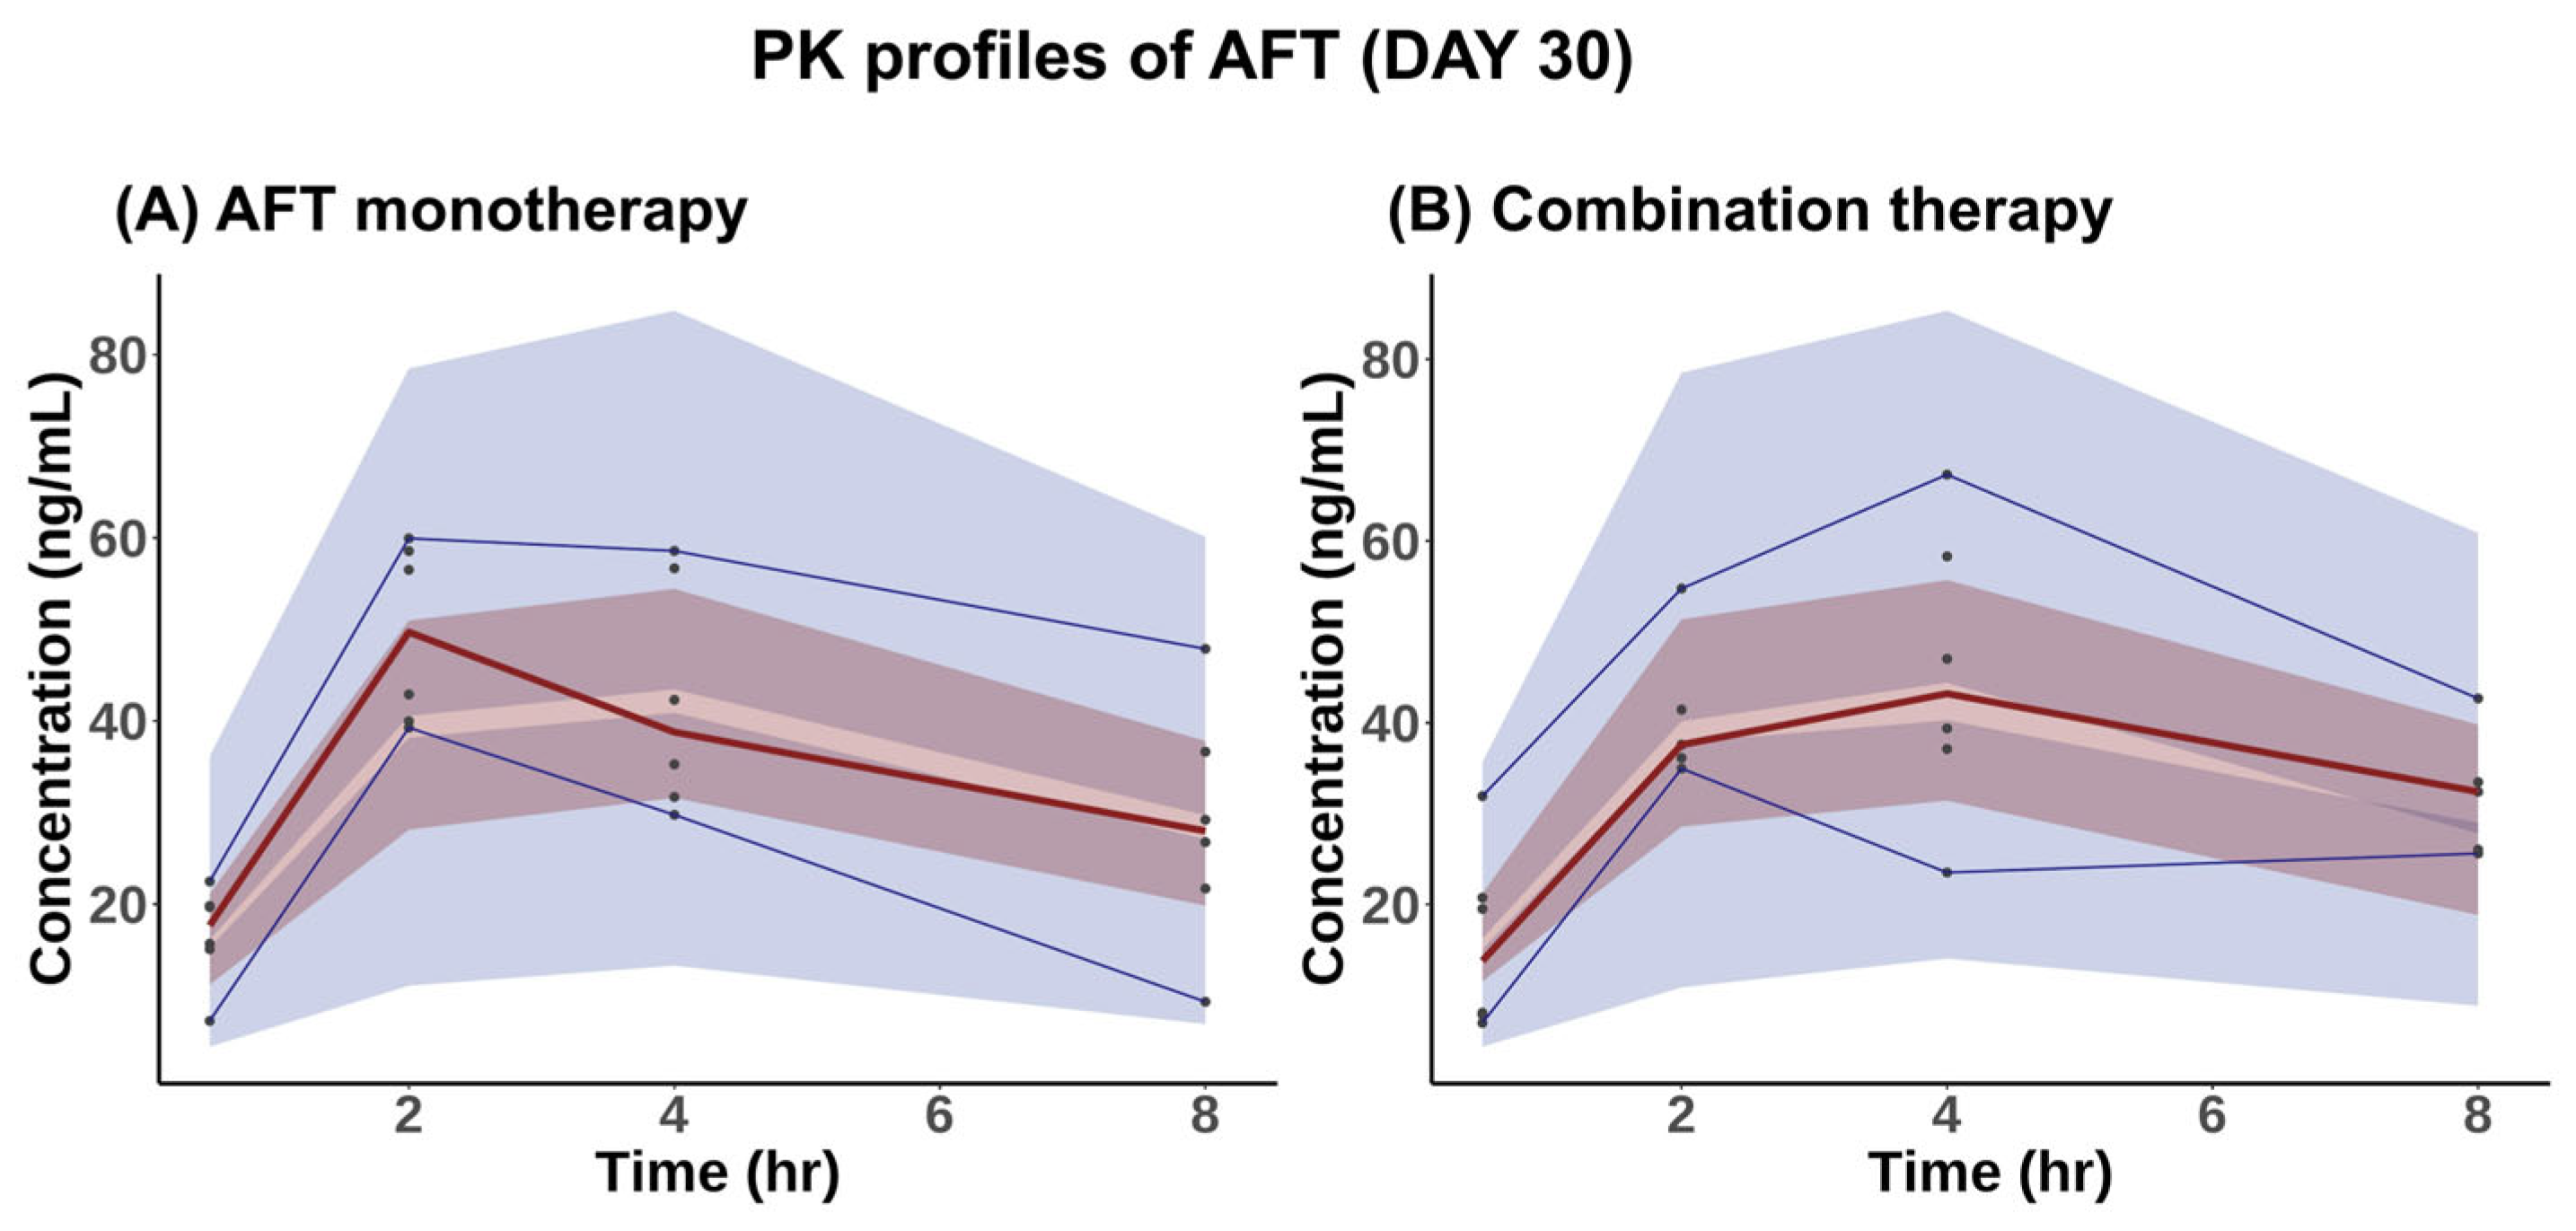
2.1. PK Study
2.1.1. PK Analysis
2.1.2. PK Model for AFT
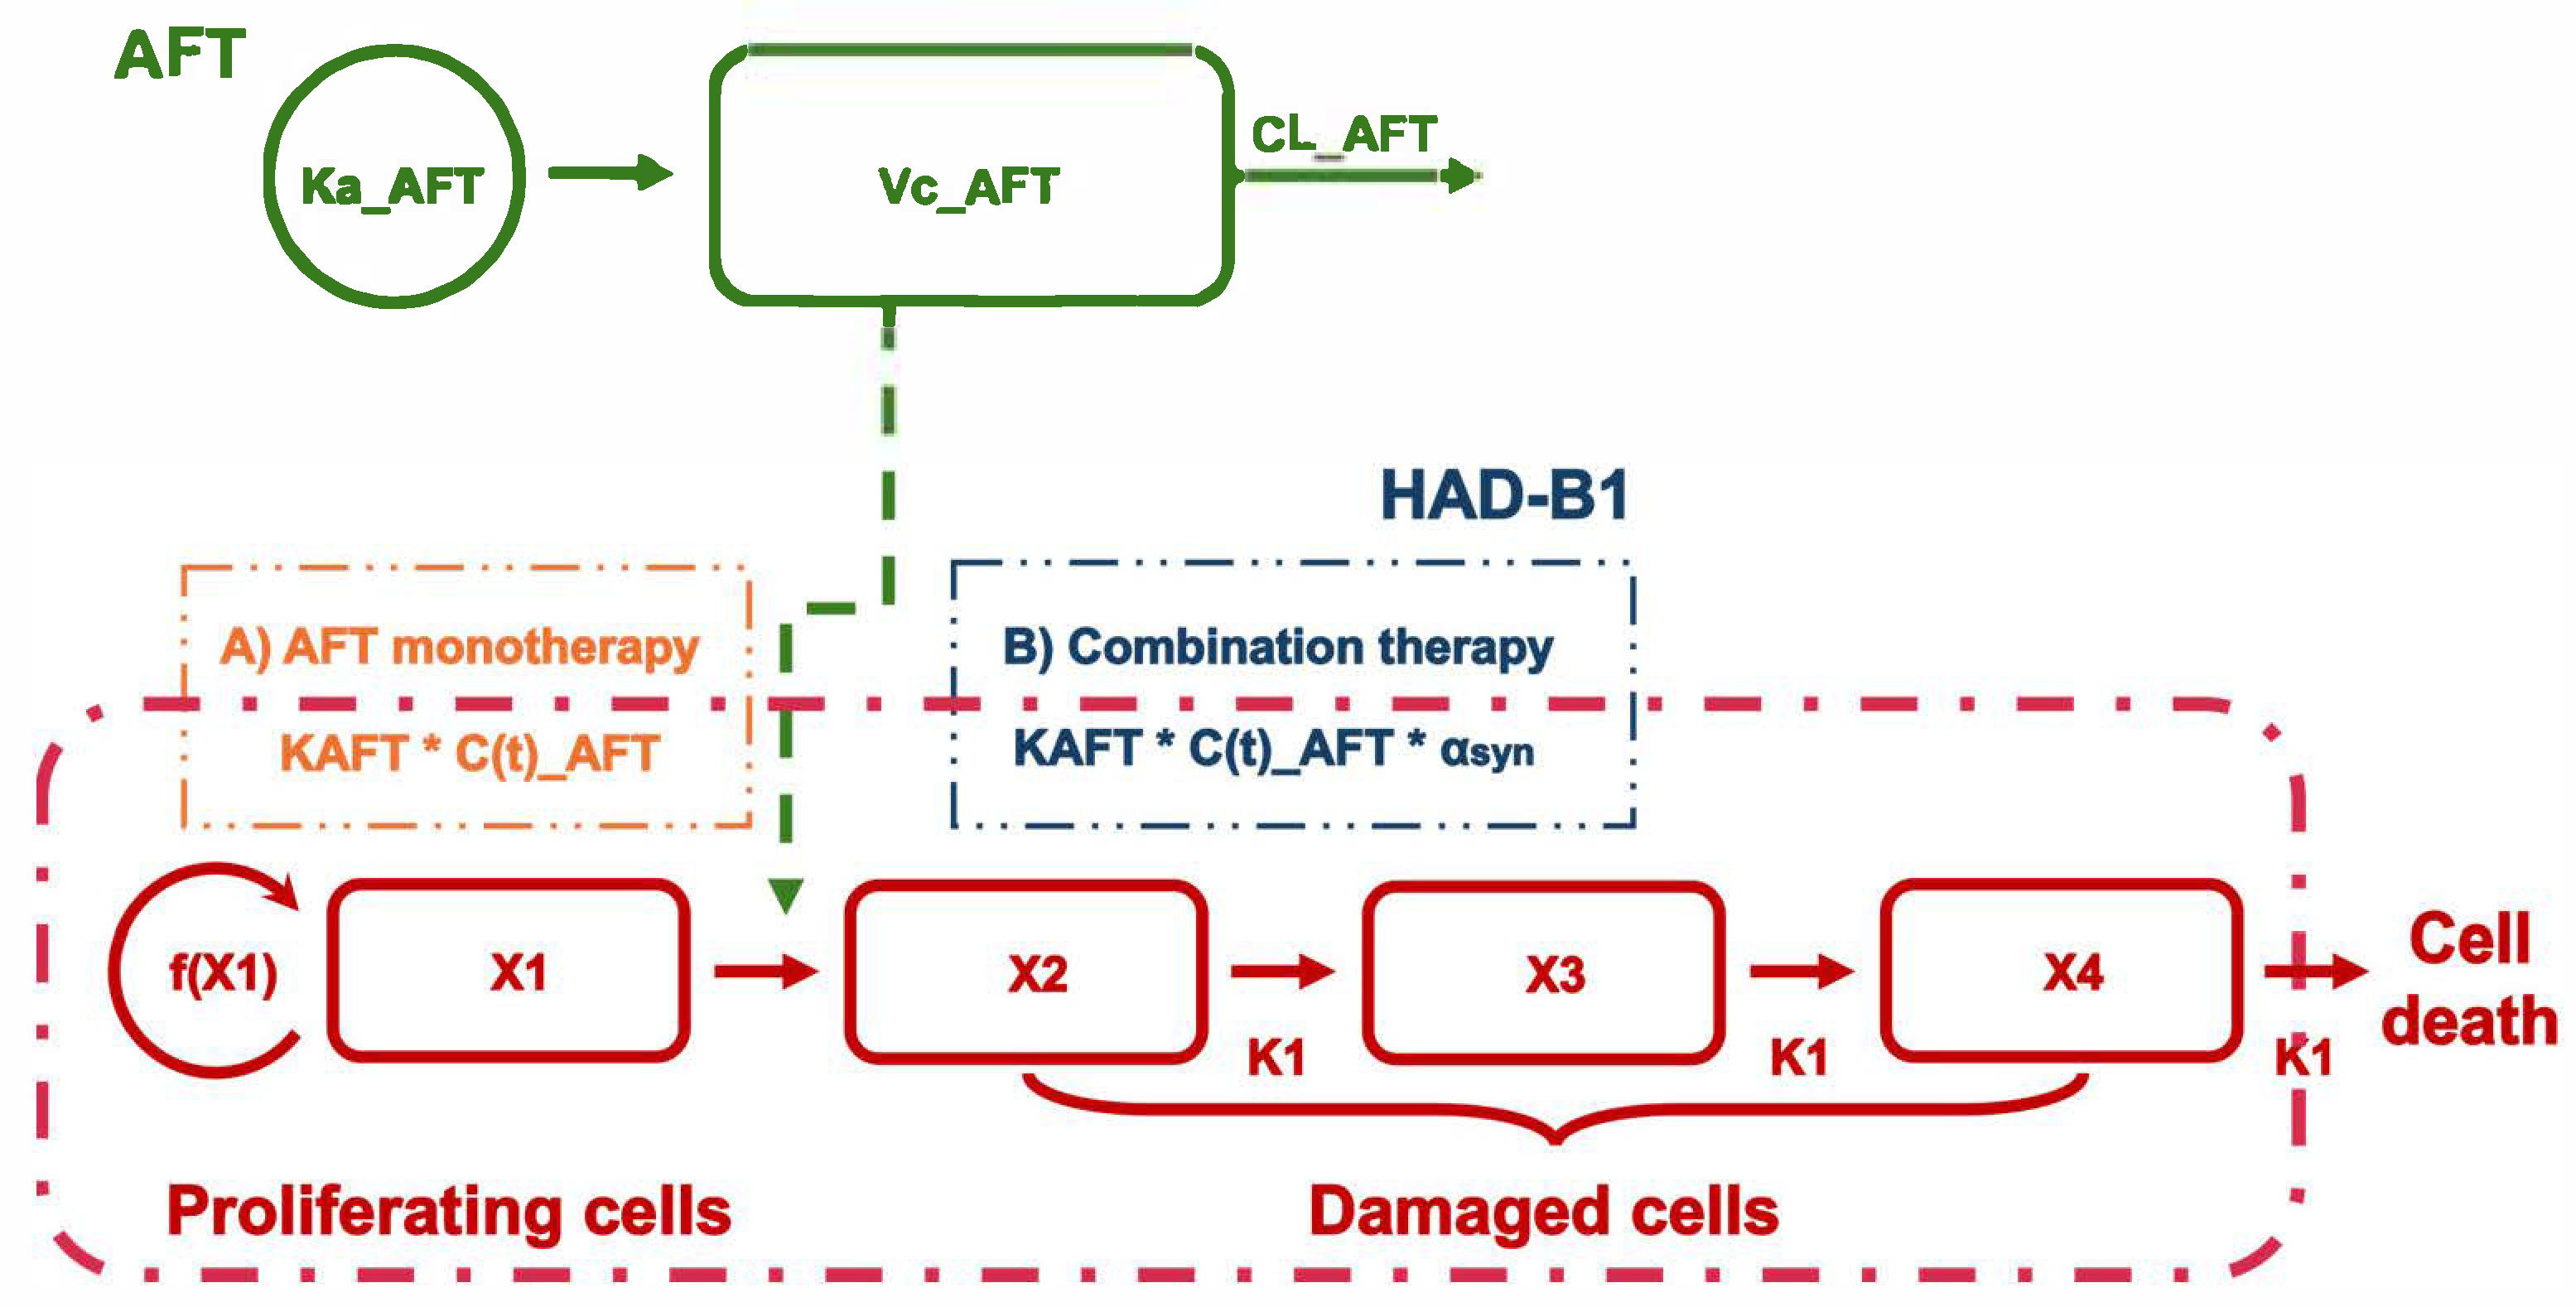
2.2. PK/PD Model
2.2.1. PK/PD Model Development
2.2.2. Model Evaluation
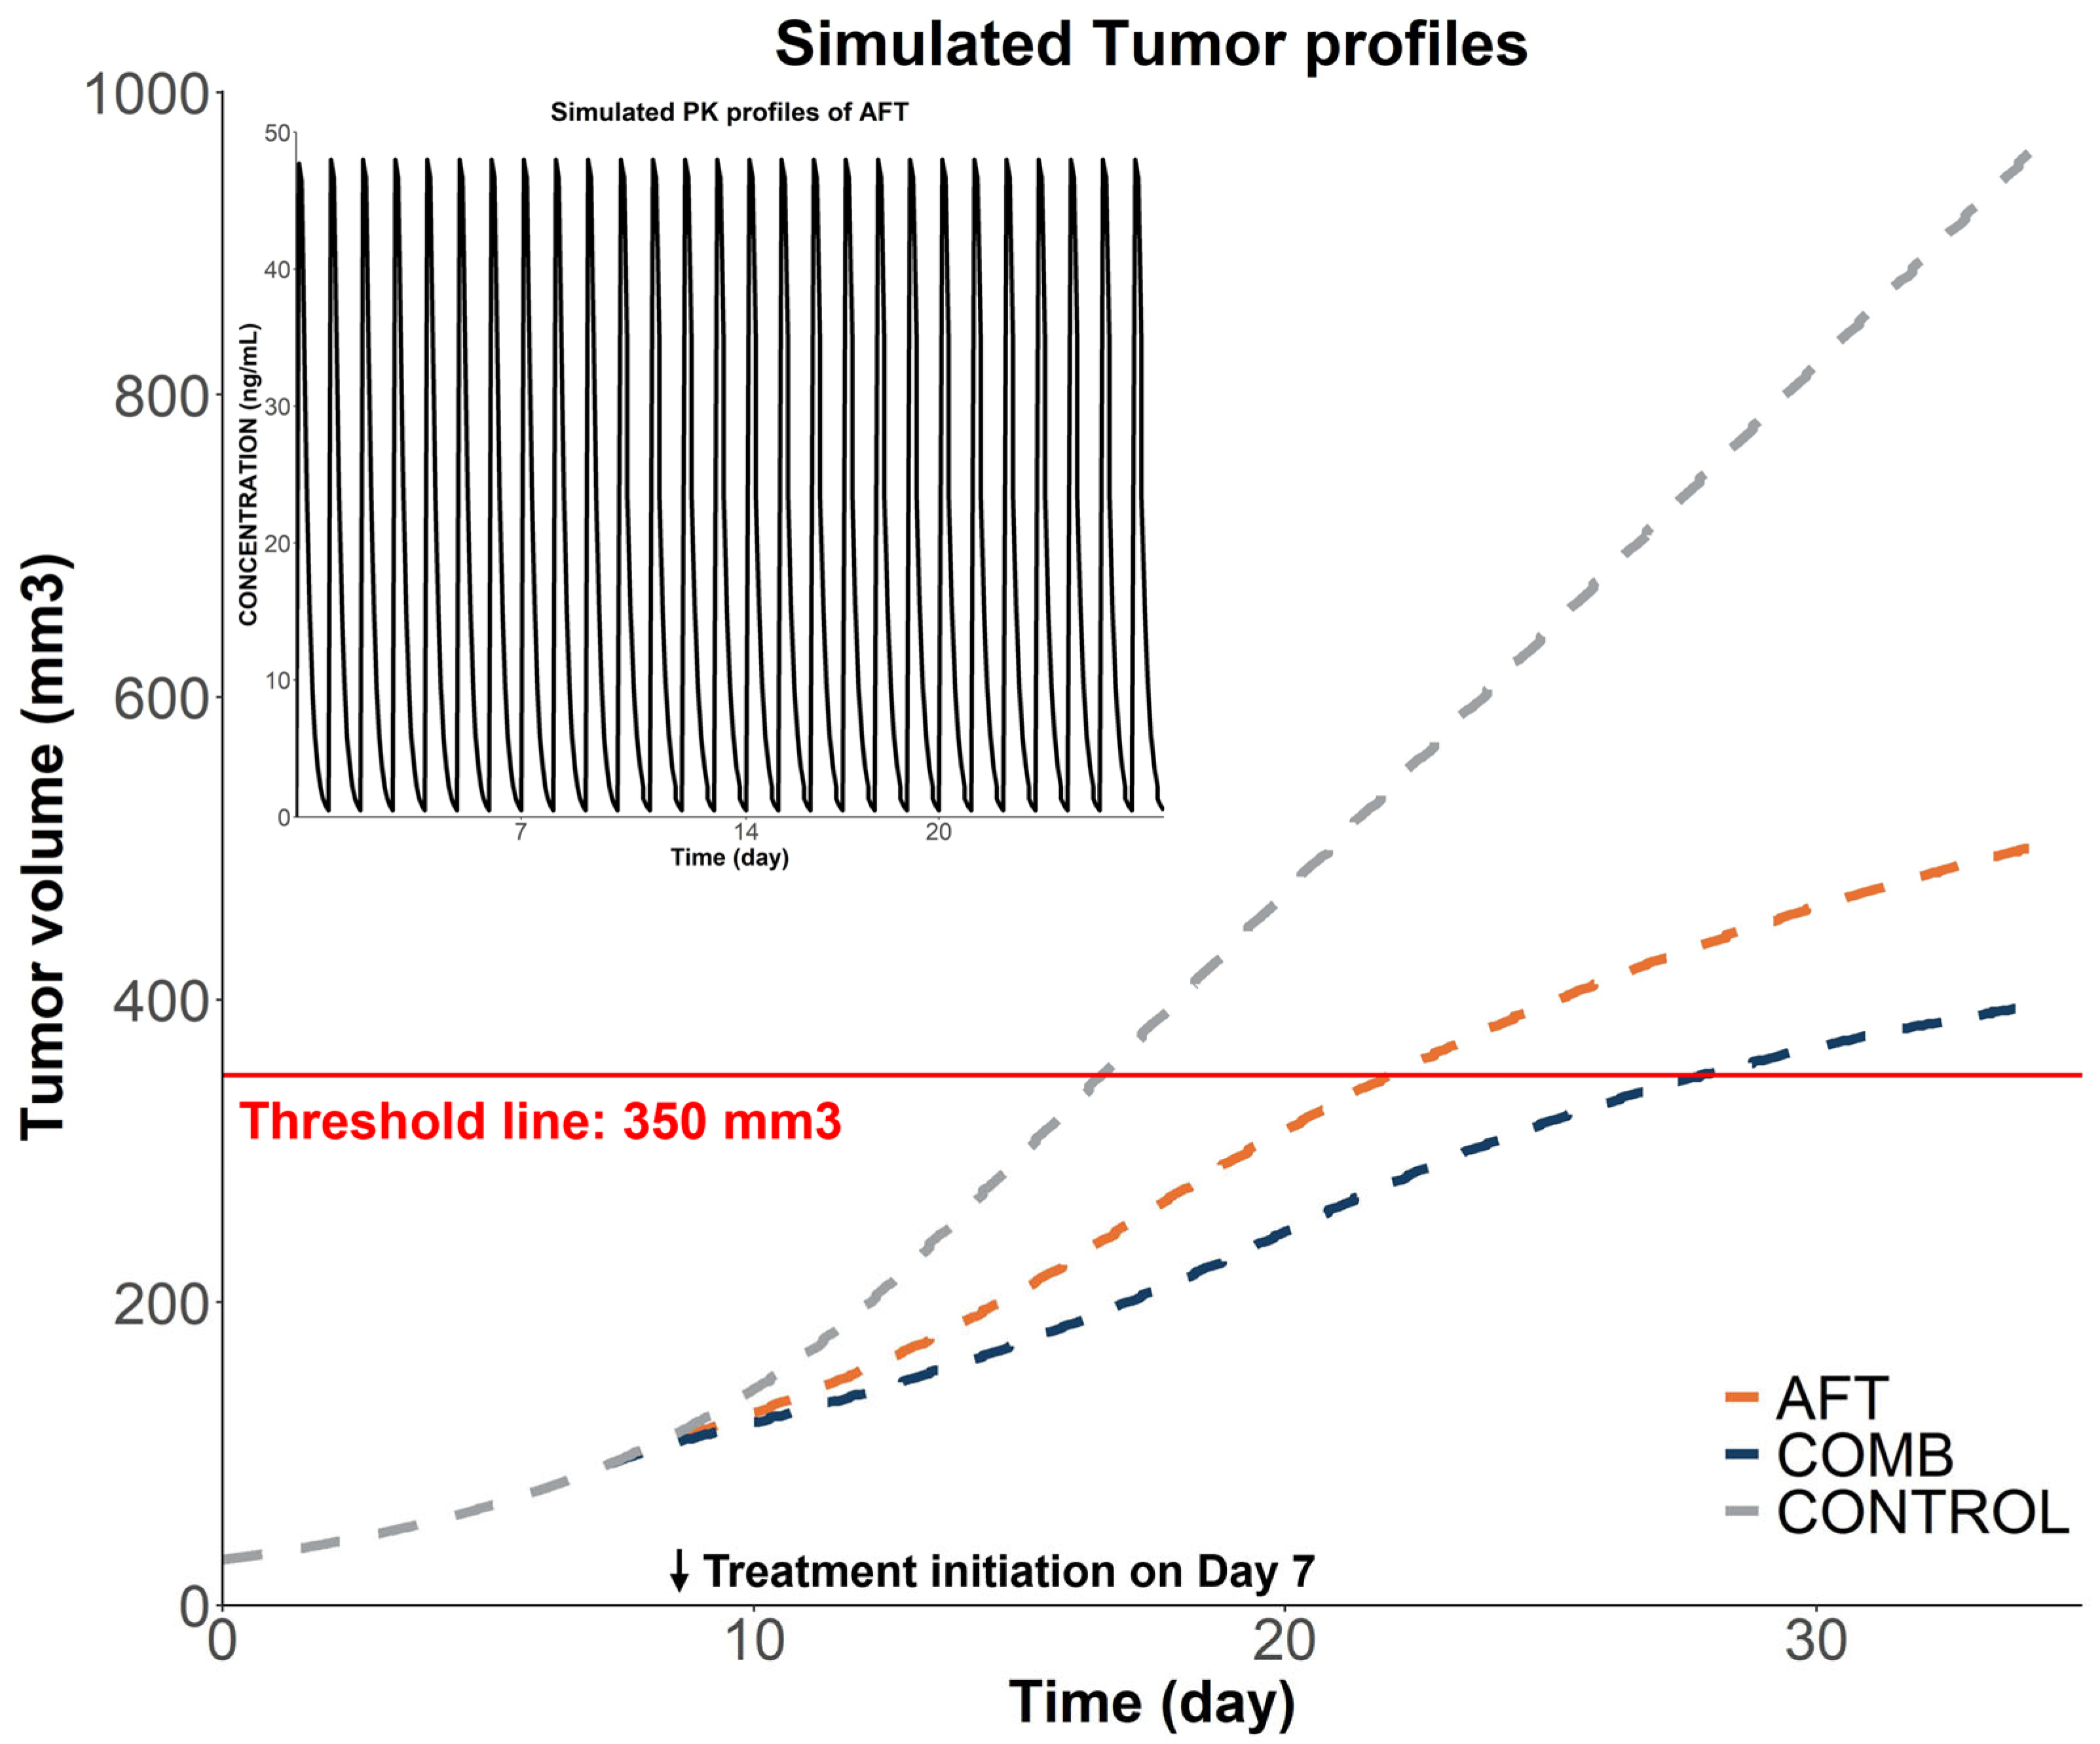
2.2.3. Model-Based Simulations
3. Discussion
4. Materials and Methods
4.1. Compounds and Reagents
4.2. PK Study
4.2.1. Animals
4.2.2. PK Experiment
4.2.3. NCA PK Analysis
4.2.4. PK Model for AFT
4.3. PK/PD Model
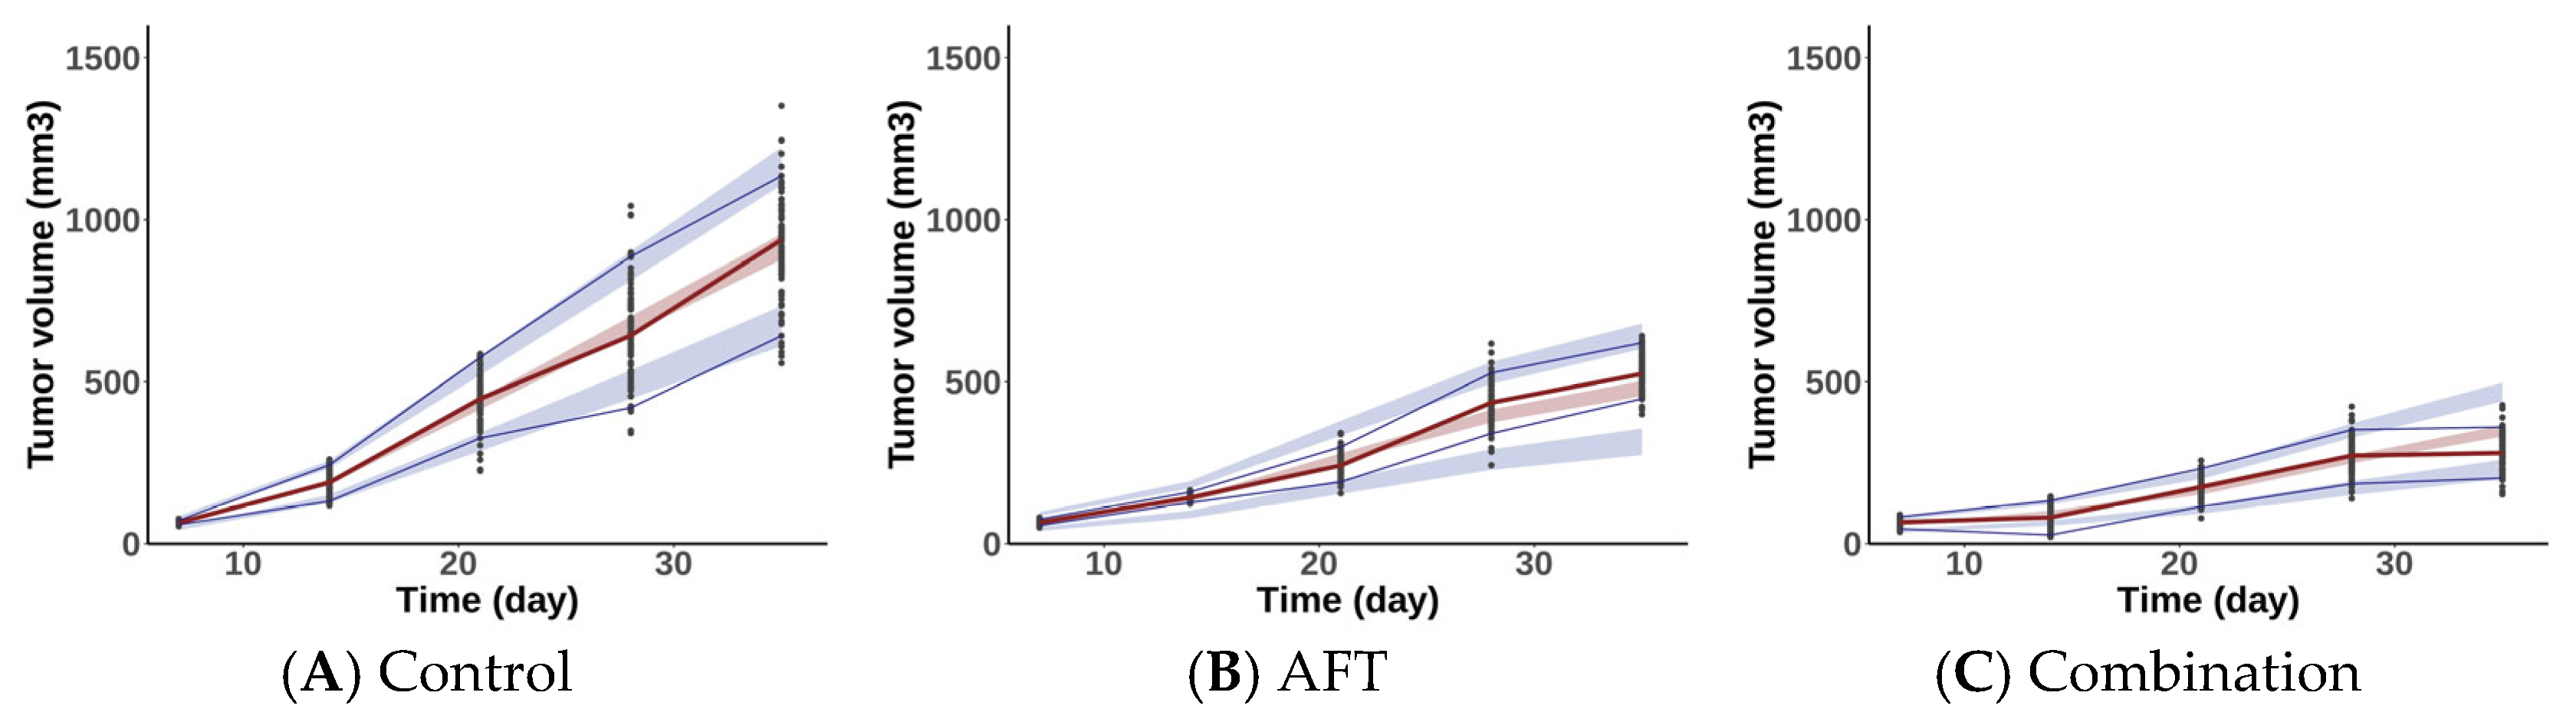
4.3.1. PD Data
4.3.2. PK/PD Model and Simulations
4.3.3. Model Development and Evaluation
5. Conclusions
Supplementary Materials
Author Contributions
Funding
Institutional Review Board Statement
Informed Consent Statement
Data Availability Statement
Conflicts of Interest
References
- Sung, H.; Ferlay, J.; Siegel, R.L.; Laversanne, M.; Soerjomataram, I.; Jemal, A.; Bray, F. Global Cancer Statistics 2020: GLOBOCAN Estimates of Incidence and Mortality Worldwide for 36 Cancers in 185 Countries. CA Cancer J. Clin. 2021, 71, 209–249. [Google Scholar] [CrossRef]
- Zappa, C.; Mousa, S.A. Non-Small Cell Lung Cancer: Current Treatment and Future Advances. Transl. Lung Cancer Res. 2016, 5, 288–300. [Google Scholar] [CrossRef] [PubMed]
- Testa, U.; Castelli, G.; Pelosi, E. Lung Cancers: Molecular Characterization, Clonal Heterogeneity and Evolution, and Cancer Stem Cells. Cancers 2018, 10, 248. [Google Scholar] [CrossRef] [PubMed]
- Wu, Y.-L.; Soo, R.A.; Locatelli, G.; Stammberger, U.; Scagliotti, G.; Park, K. Does C-Met Remain a Rational Target for Therapy in Patients with EGFR TKI-Resistant Non-Small Cell Lung Cancer? Cancer Treat. Rev. 2017, 61, 70–81. [Google Scholar] [CrossRef] [PubMed]
- Turke, A.B.; Zejnullahu, K.; Wu, Y.-L.; Song, Y.; Dias-Santagata, D.; Lifshits, E.; Toschi, L.; Rogers, A.; Mok, T.; Sequist, L.; et al. Preexistence and Clonal Selection of MET Amplification in EGFR Mutant NSCLC. Cancer Cell 2010, 17, 77–88. [Google Scholar] [CrossRef]
- Remon, J.; Morán, T.; Majem, M.; Reguart, N.; Dalmau, E.; Márquez-Medina, D.; Lianes, P. Acquired Resistance to Epidermal Growth Factor Receptor Tyrosine Kinase Inhibitors in EGFR-Mutant Non-Small Cell Lung Cancer: A New Era Begins. Cancer Treat. Rev. 2014, 40, 93–101. [Google Scholar] [CrossRef]
- Coleman, N.; Hong, L.; Zhang, J.; Heymach, J.; Hong, D.; Le, X. Beyond Epidermal Growth Factor Receptor: MET Amplification as a General Resistance Driver to Targeted Therapy in Oncogene-Driven Non-Small-Cell Lung Cancer. ESMO Open 2021, 6, 100319. [Google Scholar] [CrossRef]
- Wang, Q.; Yang, S.; Wang, K.; Sun, S.-Y. MET Inhibitors for Targeted Therapy of EGFR TKI-Resistant Lung Cancer. J. Hematol. Oncol. 2019, 12, 63. [Google Scholar] [CrossRef]
- Le, X.; Puri, S.; Negrao, M.V.; Nilsson, M.B.; Robichaux, J.; Boyle, T.; Hicks, J.K.; Lovinger, K.L.; Roarty, E.; Rinsurongkawong, W.; et al. Landscape of EGFR-Dependent and -Independent Resistance Mechanisms to Osimertinib and Continuation Therapy Beyond Progression in EGFR-Mutant NSCLC. Clin. Cancer Res. Off. J. Am. Assoc. Cancer Res. 2018, 24, 6195–6203. [Google Scholar] [CrossRef]
- Kang, H.J.; Park, J.-H.; Yoo, H.-S.; Park, Y.M.; Cho, C.-K.; Kang, I.-C. Effects of HAD-B1 on the Proliferation of A549 Cisplatin-Resistant Lung Cancer Cells. Mol. Med. Rep. 2018, 17, 6745–6751. [Google Scholar] [CrossRef]
- Kang, H.J.; Kim, J.; Cho, S.H.; Park, S.-J.; Yoo, H.-S.; Kang, I.-C. Inhibitory Effects of HangAmDan-B1 (HAD-B1) Combined With Afatinib on H1975 Lung Cancer Cell–Bearing Mice. Integr. Cancer Ther. 2019, 18, 1534735419830765. [Google Scholar] [CrossRef]
- Song, S.Y.; Park, J.H.; Park, S.-J.; Kang, I.-C.; Yoo, H.-S. Synergistic Effect of HAD-B1 and Afatinib Against Gefitinib Resistance of Non-Small Cell Lung Cancer. Integr. Cancer Ther. 2022, 21, 15347354221144311. [Google Scholar] [CrossRef] [PubMed]
- Kwag, E.; Kim, S.-D.; Shin, S.-H.; Oak, C.; Park, S.-J.; Choi, J.-Y.; Hoon Yoon, S.; Kang, I.-C.; Jeong, M.-K.; Woo Lee, H.; et al. A Randomized, Multi-Center, Open Label Study to Compare the Safety and Efficacy between Afatinib Monotherapy and Combination Therapy with HAD-B1 for the Locally Advanced or Metastatic NSCLC Patients with EGFR Mutations. Integr. Cancer Ther. 2024, 23, 15347354241268231. [Google Scholar] [CrossRef] [PubMed]
- Rocchetti, M.; Poggesi, I.; Germani, M.; Fiorentini, F.; Pellizzoni, C.; Zugnoni, P.; Pesenti, E.; Simeoni, M.; De Nicolao, G. A Pharmacokinetic-Pharmacodynamic Model for Predicting Tumour Growth Inhibition in Mice: A Useful Tool in Oncology Drug Development. Basic Clin. Pharmacol. Toxicol. 2005, 96, 265–268. [Google Scholar] [CrossRef] [PubMed]
- Choi, Y.H.; Zhang, C.; Liu, Z.; Tu, M.-J.; Yu, A.-X.; Yu, A.-M. A Novel Integrated Pharmacokinetic-Pharmacodynamic Model to Evaluate Combination Therapy and Determine In Vivo Synergism. J. Pharmacol. Exp. Ther. 2021, 377, 305–315. [Google Scholar] [CrossRef]
- Li, J.-Y.; Ren, Y.-P.; Yuan, Y.; Ji, S.-M.; Zhou, S.-P.; Wang, L.-J.; Mou, Z.-Z.; Li, L.; Lu, W.; Zhou, T.-Y. Preclinical PK/PD Model for Combined Administration of Erlotinib and Sunitinib in the Treatment of A549 Human NSCLC Xenograft Mice. Acta Pharmacol. Sin. 2016, 37, 930–940. [Google Scholar] [CrossRef]
- Xiong, W.; Friese-Hamim, M.; Johne, A.; Stroh, C.; Klevesath, M.; Falchook, G.S.; Hong, D.S.; Girard, P.; El Bawab, S. Translational Pharmacokinetic-pharmacodynamic Modeling of Preclinical and Clinical Data of the Oral MET Inhibitor Tepotinib to Determine the Recommended Phase II Dose. CPT Pharmacomet. Syst. Pharmacol. 2021, 10, 428–440. [Google Scholar] [CrossRef]
- Simeoni, M.; Magni, P.; Cammia, C.; De Nicolao, G.; Croci, V.; Pesenti, E.; Germani, M.; Poggesi, I.; Rocchetti, M. Predictive Pharmacokinetic-Pharmacodynamic Modeling of Tumor Growth Kinetics in Xenograft Models after Administration of Anticancer Agents. Cancer Res. 2004, 64, 1094–1101. [Google Scholar] [CrossRef]
- Yang, J.; Mager, D.E.; Straubinger, R.M. Comparison of Two Pharmacodynamic Transduction Models for the Analysis of Tumor Therapeutic Responses in Model Systems. AAPS J. 2009, 12, 1–10. [Google Scholar] [CrossRef]
- Yang, Z.; Tam, K.Y. Combination Strategies Using EGFR-TKi in NSCLC Therapy: Learning from the Gap between Pre-Clinical Results and Clinical Outcomes. Int. J. Biol. Sci. 2018, 14, 204–216. [Google Scholar] [CrossRef]
- Yang, J.C.-H.; Sequist, L.V.; Zhou, C.; Schuler, M.; Geater, S.L.; Mok, T.; Hu, C.-P.; Yamamoto, N.; Feng, J.; O’Byrne, K.; et al. Effect of Dose Adjustment on the Safety and Efficacy of Afatinib for EGFR Mutation-Positive Lung Adenocarcinoma: Post Hoc Analyses of the Randomized LUX-Lung 3 and 6 Trials. Ann. Oncol. 2016, 27, 2103–2110. [Google Scholar] [CrossRef] [PubMed]
- Nakao, K.; Kobuchi, S.; Marutani, S.; Iwazaki, A.; Tamiya, A.; Isa, S.; Okishio, K.; Kanazu, M.; Tamiya, M.; Hirashima, T.; et al. Population Pharmacokinetics of Afatinib and Exposure-Safety Relationships in Japanese Patients with EGFR Mutation-Positive Non-Small Cell Lung Cancer. Sci. Rep. 2019, 9, 18202. [Google Scholar] [CrossRef] [PubMed]
- Peters, S.; Zimmermann, S.; Adjei, A.A. Oral Epidermal Growth Factor Receptor Tyrosine Kinase Inhibitors for the Treatment of Non-Small Cell Lung Cancer: Comparative Pharmacokinetics and Drug-Drug Interactions. Cancer Treat. Rev. 2014, 40, 917–926. [Google Scholar] [CrossRef] [PubMed]
- Wind, S.; Schnell, D.; Ebner, T.; Freiwald, M.; Stopfer, P. Clinical Pharmacokinetics and Pharmacodynamics of Afatinib. Clin. Pharmacokinet. 2017, 56, 235–250. [Google Scholar] [CrossRef]
- D’Cunha, R.R.; Murry, D.J.; An, G. Nilotinib Alters the Efflux Transporter-Mediated Pharmacokinetics of Afatinib in Mice. J. Pharm. Sci. 2019, 108, 3434–3442. [Google Scholar] [CrossRef]
- Park, J.D. Metabolism and Drug Interactions of Korean Ginseng Based on the Pharmacokinetic Properties of Ginsenosides: Current Status and Future Perspectives. J. Ginseng Res. 2024, 48, 253–265. [Google Scholar] [CrossRef]
- Yin, A.; Moes, D.J.A.R.; van Hasselt, J.G.C.; Swen, J.J.; Guchelaar, H.-J. A Review of Mathematical Models for Tumor Dynamics and Treatment Resistance Evolution of Solid Tumors. CPT Pharmacomet. Syst. Pharmacol. 2019, 8, 720–737. [Google Scholar] [CrossRef]
- Koch, G.; Walz, A.; Lahu, G.; Schropp, J. Modeling of Tumor Growth and Anticancer Effects of Combination Therapy. J. Pharmacokinet. Pharmacodyn. 2009, 36, 179–197. [Google Scholar] [CrossRef]
- Park, S.-J.; Kim, S.-D.; Kwag, E.-B.; Park, J.H.; Yoo, H.-S. Acute and Subchronic Toxicological Evaluation of the Herbal Product HAD-B1 in Rats. Evid.-Based Complement. Altern. Med. ECAM 2021, 2021, 9970822. [Google Scholar] [CrossRef]
- National Research Council (US) Committee for the Update of the Guide for the Care and Use of Laboratory Animals. Guide for the Care and Use of Laboratory Animals, 8th ed.; The National Academies Collection: Reports funded by National Institutes of Health; National Academies Press (US): Washington, DC, USA, 2011; ISBN 978-0-309-15400-0. [Google Scholar]


| Parameters | AFT Monotherapy | Combination Therapy |
|---|---|---|
| AUClst,ss (ng∙mL−1∙h) | 287.63 ± 65.36 | 263.87 ± 101.78 |
| Cmaxss (ng∙mL−1) | 50.37 ± 9.54 | 48.50 ± 11.86 |
| Parameters | Unit | Estimates | RSE (%) | Shrinkage (%) |
|---|---|---|---|---|
| Ka | h−1 | 0.2 | 39 | |
| CL/F | L∙h−1∙kg−1 | 24.5 | 9 | |
| Vd/F | L∙kg−1 | 56.1 | 17 | |
| Inter-individual variability (IIV) | ||||
| IIV on CL/F | % | 30.9 | 20 | 17 |
| IIV on Vd/F | % | 50.2 | 19 | 14 |
| Residual variability | ||||
| Prop.ER | % | 29.0 | 9 | |
| Parameters | Control Group | Treated Groups |
|---|---|---|
| λ0 (day−1) | 0.156 | 0.156 (FIX) |
| λ1 (mm3∙day−1) | 34.9 | 34.9 (FIX) |
| φ | 20 (FIX) | 20 (FIX) |
| V0 (mm3) | 21.4 | 32.7 |
| K1 (day−1) | – | 2.2 |
| KAFT (mL∙ng−1∙day−1) | – | 0.0034 |
| αsyn | – | 0.45 |
| Residual variability | ||
| Prop.ER | 0.169 | 0.215 |
Disclaimer/Publisher’s Note: The statements, opinions and data contained in all publications are solely those of the individual author(s) and contributor(s) and not of MDPI and/or the editor(s). MDPI and/or the editor(s) disclaim responsibility for any injury to people or property resulting from any ideas, methods, instructions or products referred to in the content. |
© 2025 by the authors. Licensee MDPI, Basel, Switzerland. This article is an open access article distributed under the terms and conditions of the Creative Commons Attribution (CC BY) license (https://creativecommons.org/licenses/by/4.0/).
Share and Cite
Yang, S.-y.; Ngo, L.T.; Lee, S.; Yun, H.-y.; Bui, T.T.; Kim, D.-H.; Chae, J.-w.; Park, S. Model-Based Evaluation of HangAmDan-B1 and Afatinib Combination Therapy in HCC827 Xenograft Mice with Resistance to Epidermal Growth Factor Receptor Tyrosine Kinase Inhibitor. Pharmaceuticals 2025, 18, 748. https://doi.org/10.3390/ph18050748
Yang S-y, Ngo LT, Lee S, Yun H-y, Bui TT, Kim D-H, Chae J-w, Park S. Model-Based Evaluation of HangAmDan-B1 and Afatinib Combination Therapy in HCC827 Xenograft Mice with Resistance to Epidermal Growth Factor Receptor Tyrosine Kinase Inhibitor. Pharmaceuticals. 2025; 18(5):748. https://doi.org/10.3390/ph18050748
Chicago/Turabian StyleYang, Sung-yoon, Lien Thi Ngo, Soyoung Lee, Hwi-yeol Yun, Tham Thi Bui, Dong-Hyeon Kim, Jung-woo Chae, and Sojung Park. 2025. "Model-Based Evaluation of HangAmDan-B1 and Afatinib Combination Therapy in HCC827 Xenograft Mice with Resistance to Epidermal Growth Factor Receptor Tyrosine Kinase Inhibitor" Pharmaceuticals 18, no. 5: 748. https://doi.org/10.3390/ph18050748
APA StyleYang, S.-y., Ngo, L. T., Lee, S., Yun, H.-y., Bui, T. T., Kim, D.-H., Chae, J.-w., & Park, S. (2025). Model-Based Evaluation of HangAmDan-B1 and Afatinib Combination Therapy in HCC827 Xenograft Mice with Resistance to Epidermal Growth Factor Receptor Tyrosine Kinase Inhibitor. Pharmaceuticals, 18(5), 748. https://doi.org/10.3390/ph18050748