
Comparison of Anti-Renal Fibrosis Activity of Eucommiae cortex Extract and Its Microbial Fermentation Products

Abstract

1. Introduction
2. Results
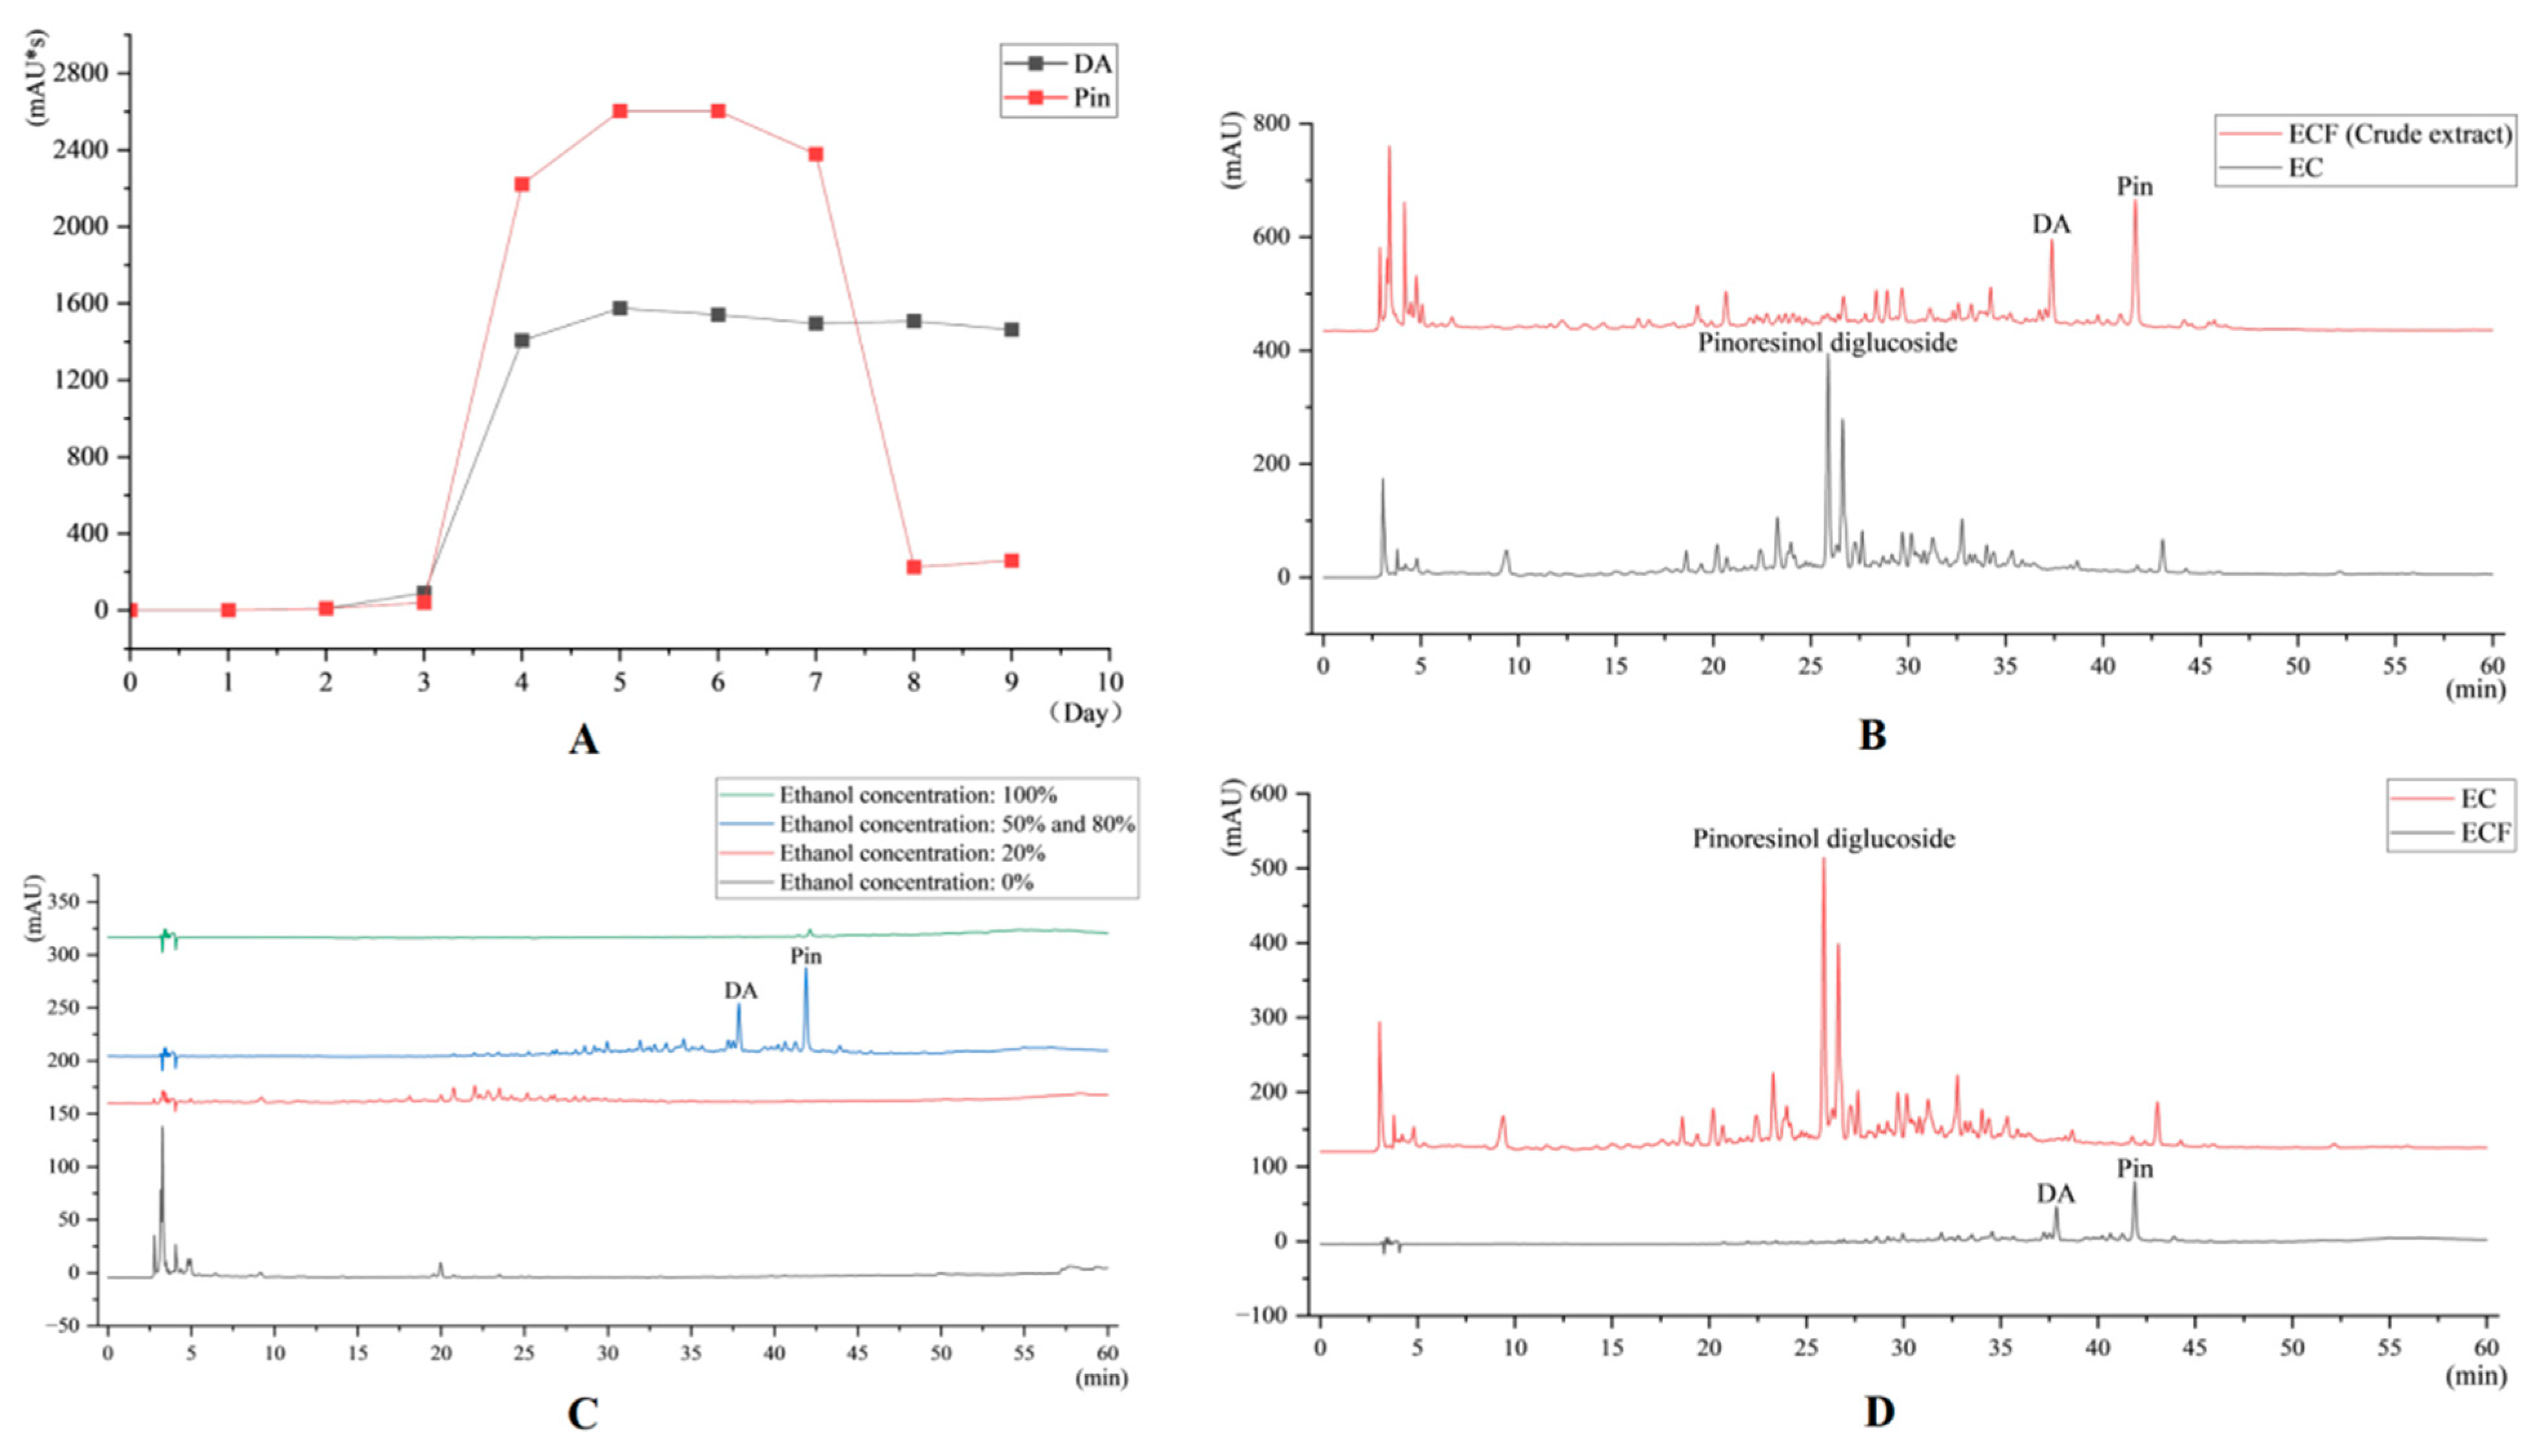
2.1. HPLC Results
2.2. Effect of EC and ECF on Body Weight of Mice
2.3. Effects of EC and ECF on Creatinine and Urea Nitrogen in Mice
2.4. Effects of EC and ECF on Histopathologic Changes in Mice with Chronic Kidney Disease
2.5. qRT-PCR Measurement of TGF-β1, Smad3, α -SMA, and mRNA Expression
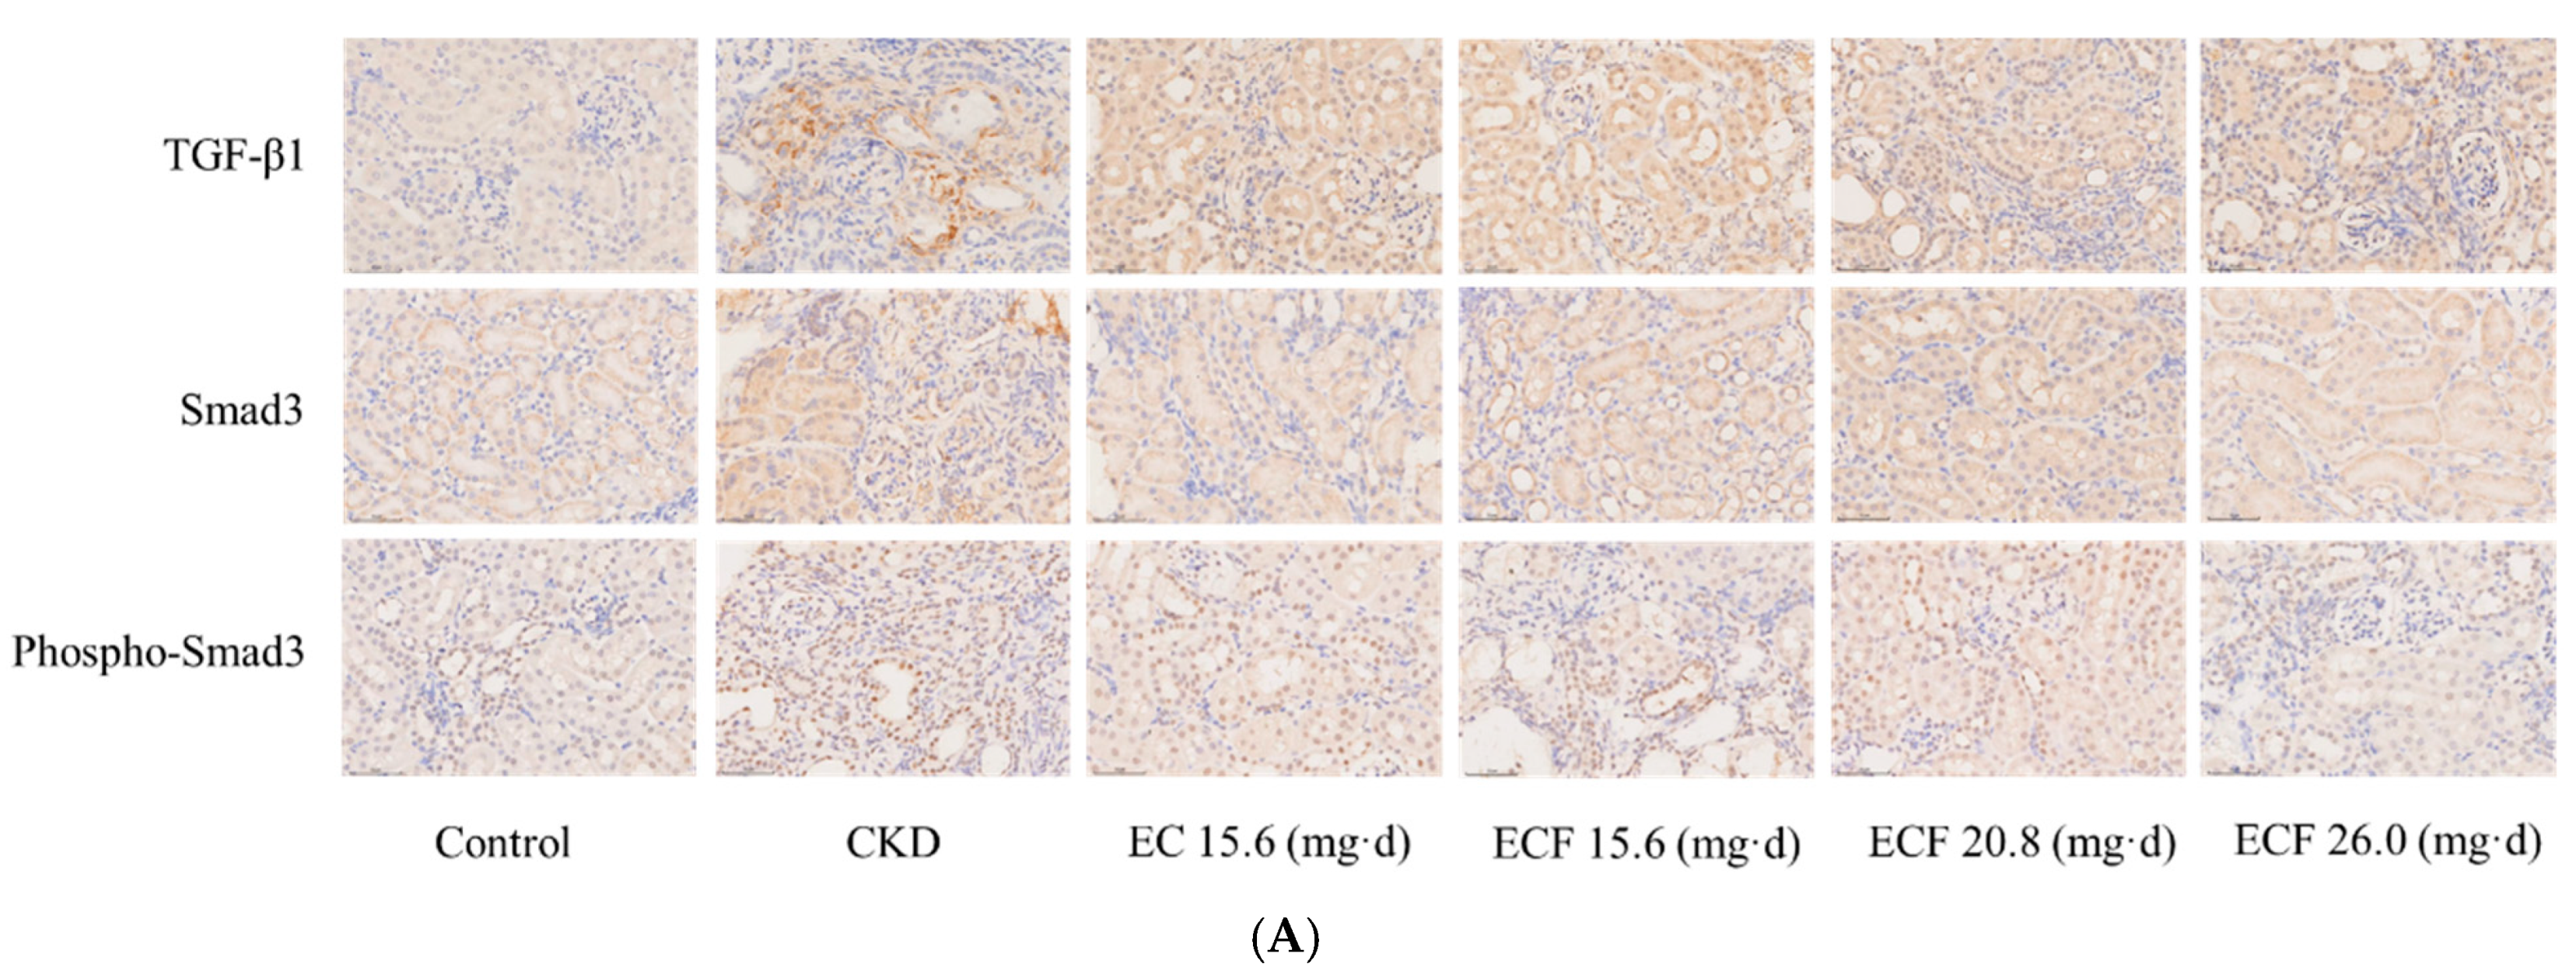
2.6. Immunohistochemical Results
3. Discussion
4. Materials and Methods
4.1. Reagents and Antibodies
4.2. EC Extraction and Drug Preparation
4.3. Microbial Fermentation Product Preparation
4.3.1. Optimal Fermentation Time
4.3.2. Macroporous Resin Fractionation
4.3.3. ECF Drug Preparation
4.4. Experimental Animals
4.5. HPLC Conditions
4.6. Adenine-Diet-Induced Renal Fibrosis
4.7. Renal Function Analysis
4.8. Analysis of Renal Histopathology
4.9. qRT-PCR Measurement of TGF-β1, Smad3, and α-SMA mRNA Expression
4.9.1. RNA Extraction and Concentration Determination
4.9.2. cDNA Synthesis
4.9.3. qRT-PCR Assay
4.9.4. Primer Design and Synthesis
4.9.5. Data Processing
4.10. Immunohistochemistry Analysis
4.11. Statistical Analysis
Author Contributions
Funding
Institutional Review Board Statement
Informed Consent Statement
Data Availability Statement
Conflicts of Interest
Correction Statement
Abbreviations
| CKD | Chronic kidney disease |
| EC | Eucommiae cortex |
| ECF | EC ferment |
| ECM | Extracellular matrix |
| UUO | Unilateral ureteral obstruction |
| Pin | Pinoresinol |
| DA | Dehydrodiconiferyl alcohol |
| HPLC | High-performance liquid chromatography |
| OD | Optical density |
| CMC-Na | Carboxymethylcellulose sodium |
| ANOVA | Analysis of variance |
References
- Chen, C.; Feng, C.; Luo, Q.L.; Zeng, Y.; Yuan, W.; Cui, Y.; Tang, Z.; Zhang, H.; Li, T.; Peng, J.; et al. CD5L up-regulates the TGF-β signaling pathway and promotes renal fibrosis. Life Sci. 2024, 354, 122945. [Google Scholar] [CrossRef] [PubMed]
- Wang, X.H.; Liu, X.H.; Xu, L.M.; Li, Y.; Zheng, B.; Xia, C.; Wang, J.; Liu, H. Targeted delivery of type I TGF-β receptor-mimicking peptide to fibrotic kidney for improving kidney fibrosis therapy via enhancing the inhibition of TGF-β1/Smad and p38 MAPK pathways. Int. Immunopharmacol. 2024, 137, 112483. [Google Scholar] [CrossRef] [PubMed]
- Ye, J.L.; Li, L.D.; Yan, Z.Y. Progress of experimental animal studies on Chinese herbal medicine against renal fibrosis. Clin. J. Tradit. Chin. Med. 2012, 24, 88–90. [Google Scholar]
- Zhu, J.H.; Wang, L.; Ma, Z.X.; Duan, J.A.; Tao, J.H. Rehmannia glutinosa Libosch and Cornus officinalis Sieb herb couple ameliorates renal interstitial fibrosis in CKD rats by inhibiting the TGF-β1/MAPK signaling pathway. J. Ethnopharmacol. 2024, 318, 117039. [Google Scholar] [CrossRef]
- Zhang, H.; Luo, J.H.; Yang, L.; Tong, Y.T.; Cai, H.L. Effects of astragalus polysaccharide modulating TGF-β1/Smad/AP-1 signalling pathway on renal fibrosis in rats with chronic renal failure. Chin. J. Gerontol. 2024, 44, 4040–4044. [Google Scholar]
- Wan, Y.G.; Che, X.Y.; Sun, W.; Huang, Y.R.; Meng, X.J.; Chen, H.L.; Shi, X.M.; Tu, Y.; Wu, W.; Liu, Y.L. Low-dose of multi-glycoside of Tripterygium wilfordii Hook. f., a natural regulator of TGF-β1/Smad signaling activity improves adriamycin-induced glomerulosclerosis in vivo. J. Ethnopharmacol. 2014, 151, 1079–1089. [Google Scholar] [CrossRef]
- China Pharmacopoeia Committee. Pharmacopoeia of the People’s Republic of China: Volume I, 2020; China Medical Science Press: Beijing, China, 2020; p. 172.
- Zhang, R.Z.; Li, Q.; Pei, J.; Dang, R.; Yang, Y.T.; Wang, C. Overview of the Chemical Components and Pharmacological Effects of Eucommia ulmoides. J. Shaanxi Univ. Chin. Med. 2024, 47, 87–91. [Google Scholar]
- Bao, L.; Sun, Y.L.; Wang, J.M.; Li, W.; Liu, J.; Li, T.; Liu, Z. A review of “plant gold” Eucommia ulmoides Oliv.: A medicinal and food homologous plant with economic value and prospect. Heliyon 2024, 10, e24851. [Google Scholar] [CrossRef]
- Wang, J.J.; Qin, X.M.; Gao, X.X.; Zhang, B.; Wang, P.Y.; Hao, J.Q.; Du, G.H. Research progress on chemical compounds, pharmacological action, and quality status of Eucommia ulmoides. Chin. Tradit. Herb. Drugs 2017, 48, 3228–3237. [Google Scholar]
- Wang, M.Q.; Cai, H.; Liu, X.; Song, J.T.; Cao, G.; Zhu, H.; Duan, Y.; Pei, K. Pharmacokinetic investigation of principal active constituents in renal fibrotic rats after oral administration of crude and saltprocessed eucommiae cortex extracts. Acta Pharm. Sin. 2023, 58, 1611–1618. [Google Scholar]
- Li, L.; Wang, Z.S.; Li, Z.N.; Deng, X.L.; Li, H.; Jing, X.; Ouyang, D.S. Protective effects and mechanisms of eucommia lignans against renal damage in hypertension. In Proceedings of the Special Issue of the 11th National Conference of the Chinese Society of Pharmacology, Jinan, China, 23 September 2011; p. 1. [Google Scholar]
- Wang, M.Q.; Yu, H.; Liu, X.; Song, J.T.; Cai, H.; Cao, G.; Zhu, H.; Duan, Y.; Pei, K. Profiling and characterization of the ingredients absorbed into blood and their metabolites of the Eucommiae cortex extracts in rats with renal fibrosis induced by adenine based on UHPLC-Q-TOF-MS/MS. Acta Pharm. Sin. 2022, 57, 1136–1146. [Google Scholar]
- Liu, M.; Song, E.F.; Luo, X.J. Effect of Cortex Eucommiae on the expression of MMP-2 in renal tissues of rats with unilateral ureteral obstruction. J. Zhejiang Chin. Med. Univ. 2010, 34, 595–598. [Google Scholar]
- Yu, J.; Wang, J.T.; Jia, R.X.; Wang, X.Q. Thirty-Two Cases of Bone Metastasis of Breast Cancer Combined with Renal Failure Treated with Cortex Eucommiae Decoction. Henan Tradit. Chin. Med. 2020, 40, 1251–1254. [Google Scholar]
- Luo, X.J.; Liu, M.; Zhang, Z.Q.; Song, E.F. Effect of Cortex Eucommiae on renal interstitial fibrosis in rats with unilateral ureteral obstruction. Shandong Med. J. 2012, 52, 47–49+105. [Google Scholar]
- Zheng, J.X.; Zhang, J.; Jiang, B.X.; Zhang, Y.L.; Hu, J.Y.; Zhao, T. Research Progress on Food-grade Microbial Fermented Traditional Chinese Medicine. Subtrop. Plant Sci. 2023, 52, 361–368. [Google Scholar]
- Jiang, W.Y.; He, Z.Y.; Yao, R.J.; Chen, Z.Y.; Zeng, X.; Zheng, M.; Wang, J.; Li, J.; Jiang, Y. Preparation of Pinoresinol and Dehydrodiconiferyl Alcohol from Eucommiae cortex Extract by Fermentation with Traditional Mucor. Molecules 2024, 29, 2979. [Google Scholar] [CrossRef]
- Yang, H.Y.; Han, L.; Lin, Y.Q.; Li, T.; Wei, Y.; Zhao, L.H.; Tong, X.L. Probiotic fermentation of herbal medicine: Progress, challenges, and opportunities. Am. J. Chin. Med. 2023, 51, 1105–1126. [Google Scholar] [CrossRef]
- Huang, H.C.; Chang, W.T.; Wu, Y.H.; Yang, B.C.; Xu, M.R.; Lin, M.K.; Chen, H.J.; Cheng, J.H.; Lee, M.S. Phytochemicals levels and biological activities in Hibiscus sabdariffa L. were enhanced using microbial fermentation. Ind. Crops Prod. 2022, 176, 114408. [Google Scholar] [CrossRef]
- Wang, G.H.; Chen, C.Y.; Lin, C.P.; Huang, C.L.; Lin, C.; Cheng, C.Y.; Chung, Y.C. Tyrosinase inhibitory and antioxidant activities of three Bifidobacterium bifidum-fermented herb extracts. Ind. Crops Prod. 2016, 89, 376–382. [Google Scholar] [CrossRef]
- Gao, R.L.; Zhang, H.R.; Xiong, L.; Li, H.; Chen, X.; Wang, M.; Chen, X. Fermentation performance of oleaginous yeasts on Eucommia ulmoides Oliver hydrolysate: Impacts of the mixed strains fermentation. J. Biotechnol. 2023, 366, 10–18. [Google Scholar] [CrossRef]
- Hua, X.Y.; Li, S.; Tang, K.H.; Liu, W.Z. The degradation of hemicellulose, cellulose and lignin in Eucommia ulmoides oliver with solid fermentation of three edible fungi. Food Ferment. Ind. 2014, 40, 67–71. [Google Scholar]
- Li, J.Z.; Zhang, L.; Liu, Y.P.; Zhu, L.P.; Wei, Z.G.; Zhou, Y.Z. Study on the bidirectional fermentation of Eucommia ulmoides and poplar flowers by Cordyceps militaris. Mod. Anim. Husb. 2022, 6, 10–14. [Google Scholar]
- Cui, B.Y.; Wu, Y.Y. Study on probiotic fermentation of Eucommia Mulberry Leaf and Gynostemma pentaphyllum. Contemp. Anim. Husb. 2021, 8, 25–28. [Google Scholar]
- Wang, X.M.; Ma, X.H.; Li, Z.H. Fermentation Technology and Nutritional Analysis of Eucommia mushroom Sauce by Lactic Acid Bacteria. Food Ind. 2023, 44, 31–35. [Google Scholar]
- Jiang, W.Y.; He, Z.Y.; Yao, R.J.; Xiao, W.Y.; Chen, Z.Y.; Zeng, X.; Zheng, M.; Wang, J.; Li, J.; Jiang, Y. Eucommiae cortex extract alleviates renal fibrosis in CKD mice induced by adenine through the TGF-β1/Smad signaling pathway. J. Nat. Med. 2024, 79, 170–179. [Google Scholar] [CrossRef]
- Liu, L.N.; Wang, L.; Wang, H.; Jiang, Q.; Zhang, T.; Xu, J.; Yuan, L.; Cui, X.; Chen, G.; Kang, L.; et al. Niaodukang mixture inhibits micro-inflammation in CKD rats by enhancing MiR-146a levels in enterogenous exosomes. J. Ethnopharmacol. 2024, 332, 118318. [Google Scholar] [CrossRef]
- Tian, X.F.; Zeng, Y.Z.; Tu, Q.X.; Jiao, Y.; Yao, S.; Chen, Y.; Sun, L.; Xia, Q.; Luo, Y.; Yuan, L.; et al. Butyrate alleviates renal fibrosis in CKD by regulating NLRP3-mediated pyroptosis via the STING/NF-κB/p65 pathway. Int. Immunopharmacol. 2023, 124, 111010. [Google Scholar] [CrossRef]
- Xu, L.H.; Tan, R.Z.; Lin, J.Y.; Li, T.; Jia, J.; Wu, L.H.; Wang, R.; He, Y.H.; Su, H.W.; Li, P.; et al. Chaihuang Yishen Granule ameliorates mitochondrial homeostasis by upregulating PRDX5/TFAM axis to inhibit renal fibrosis in CKD. Phytomedicine 2025, 139, 156426. [Google Scholar] [CrossRef]
- Elbrolosy, M.A.; Helal, M.G.; Makled, M.N. CGS-21680 defers cisplatin-induced AKI-CKD transition in C57/BL6 mice. Chem.-Biol. Interact. 2024, 403, 111255. [Google Scholar] [CrossRef]


| Name | CAS No./Goods No. | Batch Number | Manufacturer | Source |
|---|---|---|---|---|
| Yihong Y | E4009 | MKCG9611 | Sigma | Burlington, MA, USA |
| Crea | CH0101053 | 0623021 | Mike’s Biotechnology Ltd. | Chengdu, China |
| Urea | CH0101051 | 1122071 | Mike’s Biotechnology Ltd. | Chengdu, China |
| DAB colour development kit | ZLI-9018 | 234030103 | Beijing Zhongshan Jinqiao Biotechnology Co., Ltd. | Beijing, China |
| Neutral resin adhesive | IH0265 | 0426A21 | Beijing Leigen Biotechnology Co., Ltd. | Beijing, China |
| RNAiso Plus | 9109 | / | Takara | Shiga, Japan |
| UltraStart SYBR Green qPCR Master MixcDNA Synthesis Kit | A502-01 | / | Rongwei Gene Biotechnology Co., Ltd. | Chengdu, China |
| StormstarSybrGreen qPCR Master Mix | DBI-2143 | / | DBI Bioscience | Hennigsdorf, Germany |
| Primer synthesis | / | / | Shanghai Shenggong Biotechnology (Chengdu Synthesis Department) | Chengdu, China |
| Anti-TGF beta 1 antibodies | EPR21143 | 1047656-29 | Abcam | Cambridge, UK |
| Anti-SMAD3 Antibody | BM3919 | 24F085504E08 | BOSTER | Wuhan, China |
| Phospho-Smad3 (Ser213) Polyclonal Antibody | AB_2816415 | 3AB82A46 | Invitrogen | Carlsbad, CA, USA |
| Histochemistry secondary antibody kit (rabbit) | PV-9001 | 2228G1129 | Beijing Zhongshan Jinqiao Biotechnology Co., Ltd. | Beijing, China |
| DNase/RNase-Free Water | RT-121 | / | Tiangen Biochemical Technology (Beijing) Co., Ltd. | Beijing, China |
| Time (min) | A (Acetonitrile) | B (0.1% Phosphoric Acid) |
|---|---|---|
| 0 | 6 | 94 |
| 8 | 6 | 94 |
| 16 | 12 | 88 |
| 24 | 18 | 82 |
| 32 | 24 | 76 |
| 40 | 30 | 70 |
| 60 | 36 | 64 |
| Name | Volumetric |
|---|---|
| 10 pg-5 μg Total RNA or 10 pg-500 ng mRNA*3 | As Required |
| DEPC-treated Water | up to 13 μL |
| 5 × Reaction Mix*4 | 4 μL |
| Supreme Enzyme Mix | 3 μL |
| Total Volume | 20 μL |
| Name | Volumetric (μL) |
|---|---|
| PCR Forward Primer (10 μM) | 0.5 |
| cDNA Template | 1 |
| PCR Reverse Primer (10 μM) | 0.5 |
| DNase/RNase-Free Water | 8 |
| StormstarSybrGreen qPCR Master Mix | 10 |
| Total | 20 |
| ID | Primer Name | Sequences (5′ to 3′) | Tm (°C) | Product Size (Bp) |
|---|---|---|---|---|
| NM_008084 | Mice GAPDH: F | AGGTCGGTGTGAACGGATTTG | 59.1 | 95 |
| Mice GAPDH: R | GGGGTCGTTGATGGCAACA | |||
| NM_011577 | Mice TGF-β1: F | CCACCTGCAAGACCATCGAC | 59.1 | 91 |
| Mice TGF-β1: R | CTGGCGAGCCTTAGTTTGGAC | |||
| NM_016769 | Mice Smad3: F | AGGGGCTCCCTCACGTTATC | 59.1 | 77 |
| Mice Smad3: R | CATGGCCCGTAATTCATGGTG | |||
| NM_007392 | Mice α-SMA: F | ACTGAGCGTGGCTATTCCTTC | 59.1 | 104 |
| Mice α-SMA: R | TTTCGTGGATGCCCGCTGA |
Disclaimer/Publisher’s Note: The statements, opinions and data contained in all publications are solely those of the individual author(s) and contributor(s) and not of MDPI and/or the editor(s). MDPI and/or the editor(s) disclaim responsibility for any injury to people or property resulting from any ideas, methods, instructions or products referred to in the content. |
© 2025 by the authors. Licensee MDPI, Basel, Switzerland. This article is an open access article distributed under the terms and conditions of the Creative Commons Attribution (CC BY) license (https://creativecommons.org/licenses/by/4.0/).
Share and Cite
He, Z.; Jiang, W.; Yao, R.; Xiao, W.; Chen, Z.; Zheng, M.; Zeng, X.; Li, J.; Li, Z.; Jiang, Y. Comparison of Anti-Renal Fibrosis Activity of Eucommiae cortex Extract and Its Microbial Fermentation Products. Pharmaceuticals 2025, 18, 747. https://doi.org/10.3390/ph18050747
He Z, Jiang W, Yao R, Xiao W, Chen Z, Zheng M, Zeng X, Li J, Li Z, Jiang Y. Comparison of Anti-Renal Fibrosis Activity of Eucommiae cortex Extract and Its Microbial Fermentation Products. Pharmaceuticals. 2025; 18(5):747. https://doi.org/10.3390/ph18050747
Chicago/Turabian StyleHe, Zhengyou, Wenyi Jiang, Ruijiao Yao, Wenyan Xiao, Zhiyang Chen, Miao Zheng, Xia Zeng, Jia Li, Zhengwen Li, and Yong Jiang. 2025. "Comparison of Anti-Renal Fibrosis Activity of Eucommiae cortex Extract and Its Microbial Fermentation Products" Pharmaceuticals 18, no. 5: 747. https://doi.org/10.3390/ph18050747
APA StyleHe, Z., Jiang, W., Yao, R., Xiao, W., Chen, Z., Zheng, M., Zeng, X., Li, J., Li, Z., & Jiang, Y. (2025). Comparison of Anti-Renal Fibrosis Activity of Eucommiae cortex Extract and Its Microbial Fermentation Products. Pharmaceuticals, 18(5), 747. https://doi.org/10.3390/ph18050747