
A Plant-Based Cholesterol-Lowering Diet Score Correlates with Serum LDL-Cholesterol Levels

 , , ,
, , ,  , , , and
  on behalf of the DEDiCa Study Group
Abstract
:1. Introduction
2. Materials and Methods
3. Results
4. Discussion
5. Conclusions
Supplementary Materials
Author Contributions
Funding
Institutional Review Board Statement
Informed Consent Statement
Data Availability Statement
Acknowledgments
Conflicts of Interest
References
- Zhao, B.; Gan, L.; Graubard, B.I.; Männistö, S.; Albanes, D.; Huang, J. Associations of Dietary Cholesterol, Serum Cholesterol, and Egg Consumption With Overall and Cause-Specific Mortality: Systematic Review and Updated Meta-Analysis. Circulation 2022, 145, 1506–1520. [Google Scholar] [CrossRef]
- Li, Y.; Pei, H.; Zhou, C.; Lou, Y. Dietary Cholesterol Consumption and Incidence of Type 2 Diabetes Mellitus: A Dose-Response Meta-Analysis of Prospective Cohort Studies. Nutr. Metab. Cardiovasc. Dis. 2023, 33, 2–10. [Google Scholar] [CrossRef]
- Yang, Z.; Tang, H.; Lu, S.; Sun, X.; Rao, B. Relationship between Serum Lipid Level and Colorectal Cancer: A Systemic Review and Meta-Analysis. BMJ Open 2022, 12, e052373. [Google Scholar] [CrossRef]
- Murtola, T.J.; Kasurinen, T.V.J.; Talala, K.; Taari, K.; Tammela, T.L.J.; Auvinen, A. Serum Cholesterol and Prostate Cancer Risk in the Finnish Randomized Study of Screening for Prostate Cancer. Prostate Cancer Prostatic Dis. 2019, 22, 66–76. [Google Scholar] [CrossRef]
- Wang, Q.-L.; Khil, J.; Hong, S.; Lee, D.H.; Ha, K.H.; Keum, N.; Kim, H.C.; Giovannucci, E.L. Temporal Association of Total Serum Cholesterol and Pancreatic Cancer Incidence. Nutrients 2022, 14, 4938. [Google Scholar] [CrossRef] [PubMed]
- Touvier, M.; Fassier, P.; His, M.; Norat, T.; Chan, D.S.M.; Blacher, J.; Hercberg, S.; Galan, P.; Druesne-Pecollo, N.; Latino-Martel, P. Cholesterol and Breast Cancer Risk: A Systematic Review and Meta-Analysis of Prospective Studies. Br. J. Nutr. 2015, 114, 347–357. [Google Scholar] [CrossRef] [PubMed]
- Narii, N.; Zha, L.; Komatsu, M.; Kitamura, T.; Sobue, T.; Ogawa, T. Cholesterol and Breast Cancer Risk: A Cohort Study Using Health Insurance Claims and Health Checkup Databases. Breast Cancer Res. Treat. 2023, 199, 315–322. [Google Scholar] [CrossRef]
- Hu, J.; La Vecchia, C.; de Groh, M.; Negri, E.; Morrison, H.; Mery, L. Canadian Cancer Registries Epidemiology Research Group Dietary Cholesterol Intake and Cancer. Ann. Oncol. 2012, 23, 491–500. [Google Scholar] [CrossRef] [PubMed]
- Fernandez, M.L.; Murillo, A.G. Is There a Correlation between Dietary and Blood Cholesterol? Evidence from Epidemiological Data and Clinical Interventions. Nutrients 2022, 14, 2168. [Google Scholar] [CrossRef]
- Grundy, S.M.; Denke, M.A. Dietary Influences on Serum Lipids and Lipoproteins. J. Lipid Res. 1990, 31, 1149–1172. [Google Scholar] [CrossRef] [PubMed]
- Jenkins, D.J.; Kendall, C.W.; Axelsen, M.; Augustin, L.S.; Vuksan, V. Viscous and Nonviscous Fibres, Nonabsorbable and Low Glycaemic Index Carbohydrates, Blood Lipids and Coronary Heart Disease. Curr. Opin. Lipidol. 2000, 11, 49–56. [Google Scholar] [CrossRef] [PubMed]
- Jenkins, D.J.A.; Kendall, C.W.C.; Faulkner, D.; Vidgen, E.; Trautwein, E.A.; Parker, T.L.; Marchie, A.; Koumbridis, G.; Lapsley, K.G.; Josse, R.G.; et al. A Dietary Portfolio Approach to Cholesterol Reduction: Combined Effects of Plant Sterols, Vegetable Proteins, and Viscous Fibers in Hypercholesterolemia. Metabolism 2002, 51, 1596–1604. [Google Scholar] [CrossRef] [PubMed]
- Jenkins, D.J.A.; Kendall, C.W.C.; Marchie, A.; Faulkner, D.A.; Wong, J.M.W.; de Souza, R.; Emam, A.; Parker, T.L.; Vidgen, E.; Lapsley, K.G.; et al. Effects of a Dietary Portfolio of Cholesterol-Lowering Foods vs Lovastatin on Serum Lipids and C-Reactive Protein. JAMA 2003, 290, 502–510. [Google Scholar] [CrossRef]
- Goff, L.M.; Cowland, D.E.; Hooper, L.; Frost, G.S. Low Glycaemic Index Diets and Blood Lipids: A Systematic Review and Meta-Analysis of Randomised Controlled Trials. Nutr. Metab. Cardiovasc. Dis. 2013, 23, 1–10. [Google Scholar] [CrossRef] [PubMed]
- Glenn, A.J.; Boucher, B.A.; Kavcic, C.C.; Khan, T.A.; Paquette, M.; Kendall, C.W.C.; Hanley, A.J.; Jenkins, D.J.A.; Sievenpiper, J.L. Development of a Portfolio Diet Score and Its Concurrent and Predictive Validity Assessed by a Food Frequency Questionnaire. Nutrients 2021, 13, 2850. [Google Scholar] [CrossRef] [PubMed]
- Di Maso, M.; Augustin, L.S.A.; Jenkins, D.J.A.; Carioli, G.; Turati, F.; Grisoni, B.; Crispo, A.; La Vecchia, C.; Serraino, D.; Polesel, J. Adherence to a Cholesterol-Lowering Diet and the Risk of Prostate Cancer. Food Funct. 2022, 13, 5730–5738. [Google Scholar] [CrossRef] [PubMed]
- Augustin, L.S.A.; Libra, M.; Crispo, A.; Grimaldi, M.; De Laurentiis, M.; Rinaldo, M.; D’Aiuto, M.; Catalano, F.; Banna, G.; Ferrau’, F.; et al. Low Glycemic Index Diet, Exercise and Vitamin D to Reduce Breast Cancer Recurrence (DEDiCa): Design of a Clinical Trial. BMC Cancer 2017, 17, 69. [Google Scholar] [CrossRef] [PubMed]
- Gnagnarella, P.; Parpinel, M.; Salvini, S.; Franceschi, S.; Palli, D.; Boyle, P. The Update of the Italian Food Composition Database. J. Food Compos. Anal. 2004, 17, 509–522. [Google Scholar] [CrossRef]
- Scazzina, F.; Dall’Asta, M.; Casiraghi, M.C.; Sieri, S.; Del Rio, D.; Pellegrini, N.; Brighenti, F. Glycemic Index and Glycemic Load of Commercial Italian Foods. Nutr. Metab. Cardiovasc. Dis. 2016, 26, 419–429. [Google Scholar] [CrossRef]
- Atkinson, F.S.; Foster-Powell, K.; Brand-Miller, J.C. International Tables of Glycemic Index and Glycemic Load Values: 2008. Diabetes Care 2008, 31, 2281–2283. [Google Scholar] [CrossRef]
- Bacchetti, T.; Masciangelo, S.; Bicchiega, V.; Bertoli, E.; Ferretti, G. Phytosterols, Phytostanols and Their Esters: From Natural to Functional Foods. Mediterr. J. Nutr. Metab. 2011, 4, 165–172. [Google Scholar] [CrossRef]
- Mach, F.; Baigent, C.; Catapano, A.L.; Koskinas, K.C.; Casula, M.; Badimon, L.; Chapman, M.J.; De Backer, G.G.; Delgado, V.; Ference, B.A.; et al. 2019 ESC/EAS Guidelines for the Management of Dyslipidaemias: Lipid Modification to Reduce Cardiovascular Risk. Eur. Heart J. 2020, 41, 111–188. [Google Scholar] [CrossRef] [PubMed]
- Turrini, A.; Saba, A.; Perrone, D.; Cialfa, E.; D’Amicis, A. Food Consumption Patterns in Italy: The INN-CA Study 1994-1996. Eur. J. Clin. Nutr. 2001, 55, 571–588. [Google Scholar] [CrossRef] [PubMed]
- Jonckheere, A.R. A Distribution-Free k-Sample Test Against Ordered Alternatives. Biometrika 1954, 41, 133. [Google Scholar] [CrossRef]
- Koenker, R. Quantile Regression; Cambridge University Press: Cambridge, UK, 2005; ISBN 978-0-511-13034-2. [Google Scholar]
- Estruch, R.; Martínez-González, M.A.; Corella, D.; Salas-Salvadó, J.; Ruiz-Gutiérrez, V.; Covas, M.I.; Fiol, M.; Gómez-Gracia, E.; López-Sabater, M.C.; Vinyoles, E.; et al. Effects of a Mediterranean-Style Diet on Cardiovascular Risk Factors: A Randomized Trial. Ann. Intern. Med. 2006, 145, 1–11. [Google Scholar] [CrossRef]
- Schröder, H.; Fitó, M.; Estruch, R.; Martínez-González, M.A.; Corella, D.; Salas-Salvadó, J.; Lamuela-Raventós, R.; Ros, E.; Salaverría, I.; Fiol, M.; et al. A Short Screener Is Valid for Assessing Mediterranean Diet Adherence among Older Spanish Men and Women. J. Nutr. 2011, 141, 1140–1145. [Google Scholar] [CrossRef] [PubMed]
- Satija, A.; Bhupathiraju, S.N.; Spiegelman, D.; Chiuve, S.E.; Manson, J.E.; Willett, W.; Rexrode, K.M.; Rimm, E.B.; Hu, F.B. Healthful and Unhealthful Plant-Based Diets and the Risk of Coronary Heart Disease in U.S. Adults. J. Am. Coll. Cardiol. 2017, 70, 411–422. [Google Scholar] [CrossRef]
- Jones, P.J.H. Dietary Agents That Target Gastrointestinal and Hepatic Handling of Bile Acids and Cholesterol. J. Clin. Lipidol. 2008, 2, S4–S10. [Google Scholar] [CrossRef]
- Wolever, T.M.S.; Brighenti, F.; Jenkins, D.J.A. Serum Short Chain Fatty Acids after Rectal Infusion of Acetate and Propionate in Man. J. Clin. Nutr. Gastroenterol. 1988, 3, 42–49. [Google Scholar]
- Law, M. Plant Sterol and Stanol Margarines and Health. BMJ 2000, 320, 861–864. [Google Scholar] [CrossRef]
- Von Bergmann, K.; Sudhop, T.; Lütjohann, D. Cholesterol and Plant Sterol Absorption: Recent Insights. Am. J. Cardiol. 2005, 96, 10D–14D. [Google Scholar] [CrossRef]
- Davis, H.R.; Altmann, S.W. Niemann-Pick C1 Like 1 (NPC1L1) an Intestinal Sterol Transporter. Biochim. Biophys. Acta 2009, 1791, 679–683. [Google Scholar] [CrossRef]
- Rodwell, V.W.; Nordstrom, J.L.; Mitschelen, J.J. Regulation of HMG-CoA Reductase. Adv. Lipid Res. 1976, 14, 1–74. [Google Scholar] [CrossRef]
- Trichopoulou, A.; Costacou, T.; Bamia, C.; Trichopoulos, D. Adherence to a Mediterranean Diet and Survival in a Greek Population. N. Engl. J. Med. 2003, 348, 2599–2608. [Google Scholar] [CrossRef]
- Krebs-Smith, S.M.; Pannucci, T.E.; Subar, A.F.; Kirkpatrick, S.I.; Lerman, J.L.; Tooze, J.A.; Wilson, M.M.; Reedy, J. Update of the Healthy Eating Index: HEI-2015. J. Acad. Nutr. Diet. 2018, 118, 1591–1602. [Google Scholar] [CrossRef]
- Shams-White, M.M.; Pannucci, T.E.; Lerman, J.L.; Herrick, K.A.; Zimmer, M.; Mathieu, K.M.; Stoody, E.E.; Reedy, J. Healthy Eating Index-2020: Review and Update Process to Reflect the Dietary Guidelines for Americans, 2020–2025. J. Acad. Nutr. Diet. 2023, 123, 1280–1288. [Google Scholar] [CrossRef] [PubMed]
- Fung, T.T. Adherence to a DASH-Style Diet and Risk of Coronary Heart Disease and Stroke in Women. Arch. Intern. Med. 2008, 168, 713. [Google Scholar] [CrossRef]
- Shams-White, M.M.; Brockton, N.T.; Mitrou, P.; Romaguera, D.; Brown, S.; Bender, A.; Kahle, L.L.; Reedy, J. Operationalizing the 2018 World Cancer Research Fund/American Institute for Cancer Research (WCRF/AICR) Cancer Prevention Recommendations: A Standardized Scoring System. Nutrients 2019, 11, 1572. [Google Scholar] [CrossRef]


| Characteristics | Patients | (%) | Serum Lipid Profile (mg/dL)—Median (Q1–Q3) | |||
|---|---|---|---|---|---|---|
| Total Cholesterol | HDL-C | LDL-C | Triglycerides | |||
| Age | ||||||
| <50 years | 146 | (50.0) | 182 (164–207) | 57 (47–70) | 110 (92–131) | 79 (57–105) |
| ≥50 years | 146 | (50.0) | 190 (171–216) | 54 (46–63) | 121 (105–145) | 104 (79–134) |
| Kruskal–Wallis test | p = 0.04 | p = 0.08 | p < 0.01 | p < 0.01 | ||
| Tobacco smoking | ||||||
| Never | 131 | (44.9) | 181 (165–206) | 56 (47–68) | 111 (94–131) | 82 (60–109) |
| Former/Current | 161 | (55.1) | 189 (171–216) | 54 (46–66) | 121 (102–143) | 96 (71–127) |
| Kruskal–Wallis test | p = 0.03 | p = 0.33 | p = 0.02 | p < 0.01 | ||
| Alcohol drinking | ||||||
| Never | 197 | (67.5) | 185 (167–208) | 54 (46–65) | 117 (96–136) | 91 (68–122) |
| Former/Current | 95 | (32.5) | 184 (170–220) | 57 (46–69) | 116 (98–142) | 87 (63–121) |
| Kruskal–Wallis test | p = 0.40 | p = 0.11 | p = 0.54 | p = 0.46 | ||
| Body mass index | ||||||
| <25 kg/m2 | 115 | (39.4) | 180 (161–200) | 61 (50–73) | 107 (92–129) | 67 (53–87) |
| 25 to <30 kg/m2 | 89 | (30.5) | 186 (167–211) | 54 (46–66) | 119 (94–137) | 94 (79–124) |
| ≥30 kg/m2 | 88 | (30.1) | 196 (174–220) | 52 (43–57) | 128 (111–154) | 112 (95–146) |
| Kruskal–Wallis test for trend | p < 0.01 | p < 0.01 | p < 0.01 | p < 0.01 | ||
| Physical activity | ||||||
| <5000 steps/day | 139 | (47.6) | 189 (171–219) | 53 (44–63) | 120 (100–147) | 107 (77–139) |
| ≥5000 steps/day | 153 | (52.4) | 181 (166–206) | 56 (48–70) | 114 (96–133) | 80 (61–104) |
| Kruskal-Wallis test | p = 0.04 | p = 0.01 | p = 0.05 | p < 0.01 | ||
| Breast cancer stage | ||||||
| I | 81 | (27.7) | 185 (164–207) | 56 (45–67) | 118 (96–137) | 86 (60–123) |
| IIA-IIB | 165 | (56.5) | 184 (168–211) | 53 (46–66) | 116 (97–136) | 90 (67–120) |
| IIIA-IIIC | 46 | (15.8) | 191 (170–217) | 56 (48–70) | 120 (106–141) | 90 (68–114) |
| Kruskal–Wallis test | p = 0.61 | p = 0.49 | p = 0.66 | p = 0.98 | ||
| Dietary Indicators (Cut-Off) | Score Points | Patients | Serum Lipid Profile (mg/dL)—Median (Q1–Q3) | |||
|---|---|---|---|---|---|---|
| Total Cholesterol | HDL-C | LDL-C | Triglycerides | |||
| Non-cellulosic polysaccharides soluble fibers a | ||||||
| <3.6 g/day | 0 | 215 | 185 (167–212) | 54 (45–68) | 118 (98–140) | 89 (66–124) |
| ≥3.6 g/day | 1 | 77 | 179 (169–208) | 57 (50–67) | 108 (93–132) | 92 (66–114) |
| Kruskal–Wallis test | p = 0.39 | p = 0.19 | p = 0.09 | p = 0.63 | ||
| Monounsaturated fatty acids | ||||||
| <17.9% of kcal/day | 0 | 219 | 186 (169–214) | 54 (46–66) | 117 (99–142) | 93 (69–122) |
| ≥17.9% of kcal/day | 1 | 73 | 184 (164–199) | 55 (46–70) | 117 (90–129) | 84 (61–121) |
| Kruskal–Wallis test | p = 0.11 | p = 0.41 | p = 0.08 | p = 0.14 | ||
| Legumes | ||||||
| <22.9 g/day | 0 | 218 | 186 (169–213) | 54 (45–66) | 119 (97–139) | 92 (68–124) |
| ≥22.9 g/day | 1 | 74 | 181 (167–208) | 56 (50–68) | 110 (97–137) | 83 (63–112) |
| Kruskal–Wallis test | p = 0.29 | p = 0.07 | p = 0.25 | p = 0.16 | ||
| Saturated fatty acids | ||||||
| <8.3% of kcal/day | 1 | 73 | 180 (162–203) | 56 (47–65) | 111 (93–133) | 85 (65–113) |
| ≥8.3% of kcal/day | 0 | 219 | 186 (170–213) | 54 (46–68) | 119 (98–140) | 89 (68–123) |
| Kruskal–Wallis test | p = 0.11 | p = 0.89 | p = 0.11 | p = 0.41 | ||
| Seeds or corn oil b | ||||||
| <2.8 g/day per 1000 kcal | 0 | 219 | 185 (169–212) | 55 (46–67) | 116 (97–140) | 91 (66–122) |
| ≥2.8 g/day per 1000 kcal | 1 | 73 | 185 (167–203) | 56 (47–68) | 118 (98–130) | 88 (67–116) |
| Kruskal–Wallis test | p = 0.50 | p = 0.51 | p = 0.84 | p = 0.51 | ||
| Dietary cholesterol | ||||||
| <200 mg/day | 1 | 226 | 185 (168–208) | 54 (46–66) | 117 (96–136) | 89 (65–122) |
| ≥200 mg/day | 0 | 66 | 189 (170–221) | 57 (47–70) | 118 (100–143) | 92 (67–121) |
| Kruskal–Wallis test | p = 0.35 | p = 0.27 | p = 0.50 | p = 0.97 | ||
| Glycemic index (GI) c | ||||||
| <77.1 | 1 | 71 | 185 (168–206) | 58 (49–69) | 116 (97–135) | 89 (66–107) |
| ≥77.1 | 0 | 221 | 185 (168–212) | 54 (46–66) | 118 (97–140) | 90 (66–126) |
| Kruskal–Wallis test | p = 0.70 | p = 0.12 | p = 0.68 | p = 0.33 | ||
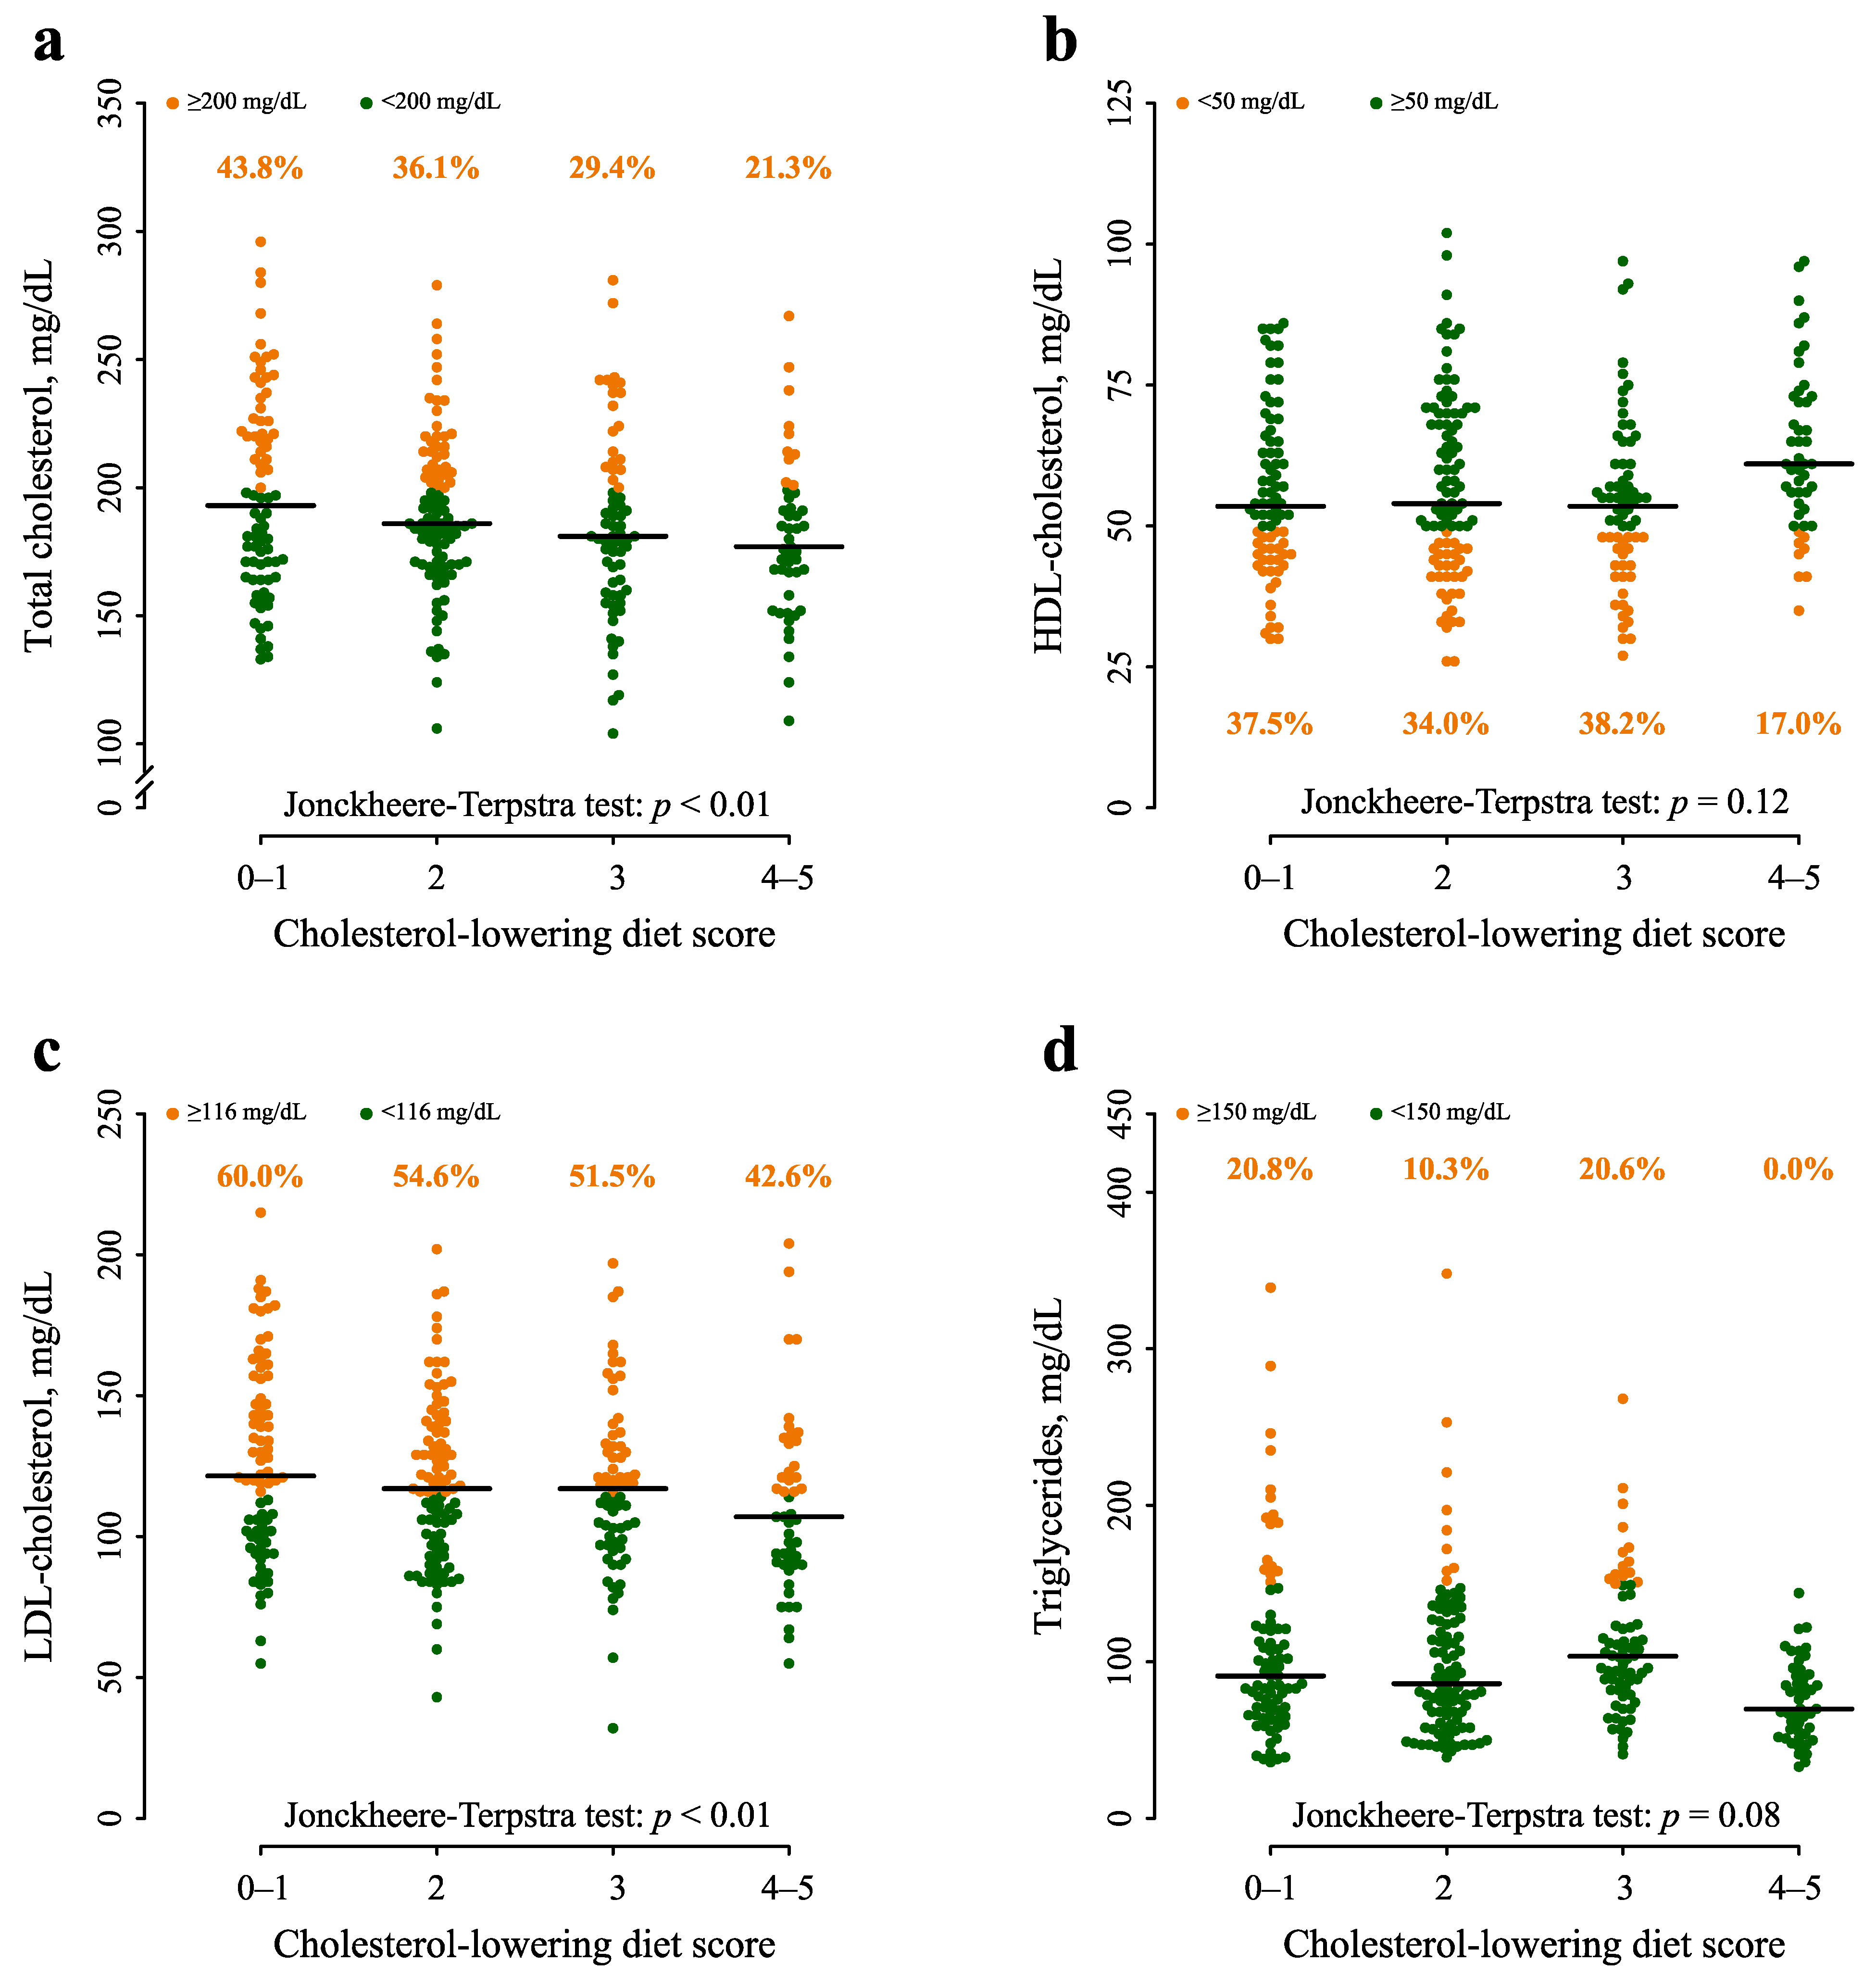
| Cholesterol-lowering diet score | ||||||
| 0–1 | 80 | 193 (169–223) | 54 (46–65) | 122 (101–151) | 91 (69–124) | |
| 2 | 97 | 186 (171–207) | 54 (45–70) | 117 (97–137) | 86 (61–127) | |
| 3 | 68 | 181 (160–207) | 54 (46–61) | 117 (99–132) | 104 (82–142) | |
| 4–6 | 47 | 177 (163–197) | 61 (53–73) | 107 (91–124) | 70 (55–92) | |
| Jonckheere–Terpstra test | p < 0.01 | p = 0.13 | p < 0.01 | p = 0.09 | ||
| Characteristics | Serum Lipid Profile—β (SE) | |||
|---|---|---|---|---|
| Total Cholesterol | HDL-C | LDL-C | Triglycerides | |
| Age (reference: <50 years) | ||||
| ≥50 years | 7.0 (5.2) | −0.7 (2.8) | 11.0 (4.9) | 11.0 (5.2) |
| Student’s t-test | p = 0.18 | p = 0.81 | p = 0.03 | p = 0.03 |
| Tobacco smoking (reference: Never) | ||||
| Former/current | 5.0 (4.7) | 0.3 (2.3) | 4.5 (5.2) | 7.0 (5.4) |
| Student’s t-test | p = 0.29 | p = 0.89 | p = 0.39 | p = 0.20 |
| Body mass index (reference: <25 kg/m2) | ||||
| 25 to <30 kg/m2 | 4.0 (5.8) | −5.7 (3.4) | 3.5 (7.0) | 21.0 (5.7) |
| ≥30 kg/m2 | 13.0 (5.9) | −8.0 (3.5) | 14.0 (5.9) | 35.0 (6.0) |
| Student’s t-test | p = 0.06 | p = 0.02 | p = 0.01 | p < 0.01 |
| Physical activity (reference: <5000 steps/day) | ||||
| ≥5000 steps/day | −3.0 (4.7) | 3.0 (2.4) | −3.5 (4.2) | −5.0 (5.0) |
| Student’s t-test | p = 0.52 | p = 0.21 | p = 0.41 | p = 0.32 |
| Cholesterol-lowering diet score (reference: 0 to 1) | ||||
| 2 | −6.0 (6.5) | −0.7 (3.5) | −12.5 (6.0) | −3.0 (6.6) |
| 3 | −14.0 (7.4) | 0.7 (3.2) | −13.5 (5.5) | −1.0 (6.0) |
| 4–6 | −12.0 (7.2) | 4.0 (4.0) | −18.5 (6.3) | −14.0 (5.5) |
| Student’s t-test for trend | p = 0.02 | p = 0.36 | p < 0.01 | p = 0.04 |
| Food Group (g Day) | Cholesterol-Lowering Diet Score (Score Points) | ||||
|---|---|---|---|---|---|
| 0–1 | 2 | 3 | 4–6 | Kruskal-Wallis Test | |
| Median (Q1–Q3) | Median (Q1–Q3) | Median (Q1–Q3) | Median (Q1–Q3) | ||
| Fruits | 126 (78–193) | 139 (92–220) | 159 (77–247) | 244 (161–331) | p < 0.01 |
| Vegetables | 101 (64–148) | 125 (74–193) | 131 (90–174) | 183 (123–283) | p < 0.01 |
| Refined grains | 115 (80–145) | 102 (73–136) | 88 (71–108) | 90 (54–127) | p < 0.01 |
| Whole grains | 8 (0–31) | 15 (0–30) | 9 (0–33) | 27 (4–60) | p < 0.01 |
| Potatoes | 14 (0–34) | 14 (0–29) | 11 (0–26) | 9 (0–28) | p = 0.51 |
| Legumes | 9 (1–17) | 13 (6–20) | 18 (7–36) | 32 (20–41) | p < 0.01 |
| Meat | 74 (45–104) | 63 (39–82) | 64 (40–88) | 49 (28–70) | p < 0.01 |
| Fish | 30 (14–49) | 23 (11–49) | 30 (14–54) | 40 (18–76) | p = 0.05 |
| Dairy products | 119 (51–186) | 85 (27–189) | 42 (15–131) | 29 (12–87) | p < 0.01 |
| Olive oil | 14 (10–19) | 16 (10–22) | 19 (13–23) | 20 (14–23) | p < 0.01 |
Disclaimer/Publisher’s Note: The statements, opinions and data contained in all publications are solely those of the individual author(s) and contributor(s) and not of MDPI and/or the editor(s). MDPI and/or the editor(s) disclaim responsibility for any injury to people or property resulting from any ideas, methods, instructions or products referred to in the content. |
© 2024 by the authors. Licensee MDPI, Basel, Switzerland. This article is an open access article distributed under the terms and conditions of the Creative Commons Attribution (CC BY) license (https://creativecommons.org/licenses/by/4.0/).
Share and Cite
Polesel, J.; Di Maso, M.; Esposito, G.; Vitale, S.; Palumbo, E.; Porciello, G.; Calabrese, I.; Minopoli, A.; Grilli, B.; Cavalcanti, E.; et al. A Plant-Based Cholesterol-Lowering Diet Score Correlates with Serum LDL-Cholesterol Levels. Nutrients 2024, 16, 495. https://doi.org/10.3390/nu16040495
Polesel J, Di Maso M, Esposito G, Vitale S, Palumbo E, Porciello G, Calabrese I, Minopoli A, Grilli B, Cavalcanti E, et al. A Plant-Based Cholesterol-Lowering Diet Score Correlates with Serum LDL-Cholesterol Levels. Nutrients. 2024; 16(4):495. https://doi.org/10.3390/nu16040495
Chicago/Turabian StylePolesel, Jerry, Matteo Di Maso, Giovanna Esposito, Sara Vitale, Elvira Palumbo, Giuseppe Porciello, Ilaria Calabrese, Anita Minopoli, Bruna Grilli, Ernesta Cavalcanti, and et al. 2024. "A Plant-Based Cholesterol-Lowering Diet Score Correlates with Serum LDL-Cholesterol Levels" Nutrients 16, no. 4: 495. https://doi.org/10.3390/nu16040495