

Inclusion of Oat Polar Lipids in a Solid Breakfast Improves Glucose Tolerance, Triglyceridemia, and Gut Hormone Responses Postprandially and after a Standardized Second Meal: A Randomized Crossover Study in Healthy Subjects


Abstract
:1. Introduction
2. Materials and Methods
2.1. Study Participants
2.2. Test Breakfasts and the Standardized Lunch
2.3. Study Methodology and Design
2.4. Biomarker Assessment
2.5. Calculation and Data Analysis
2.6. Power Calculation
3. Results
3.1. Baseline (Fasting) Characteristics
3.2. Glucose and Insulin
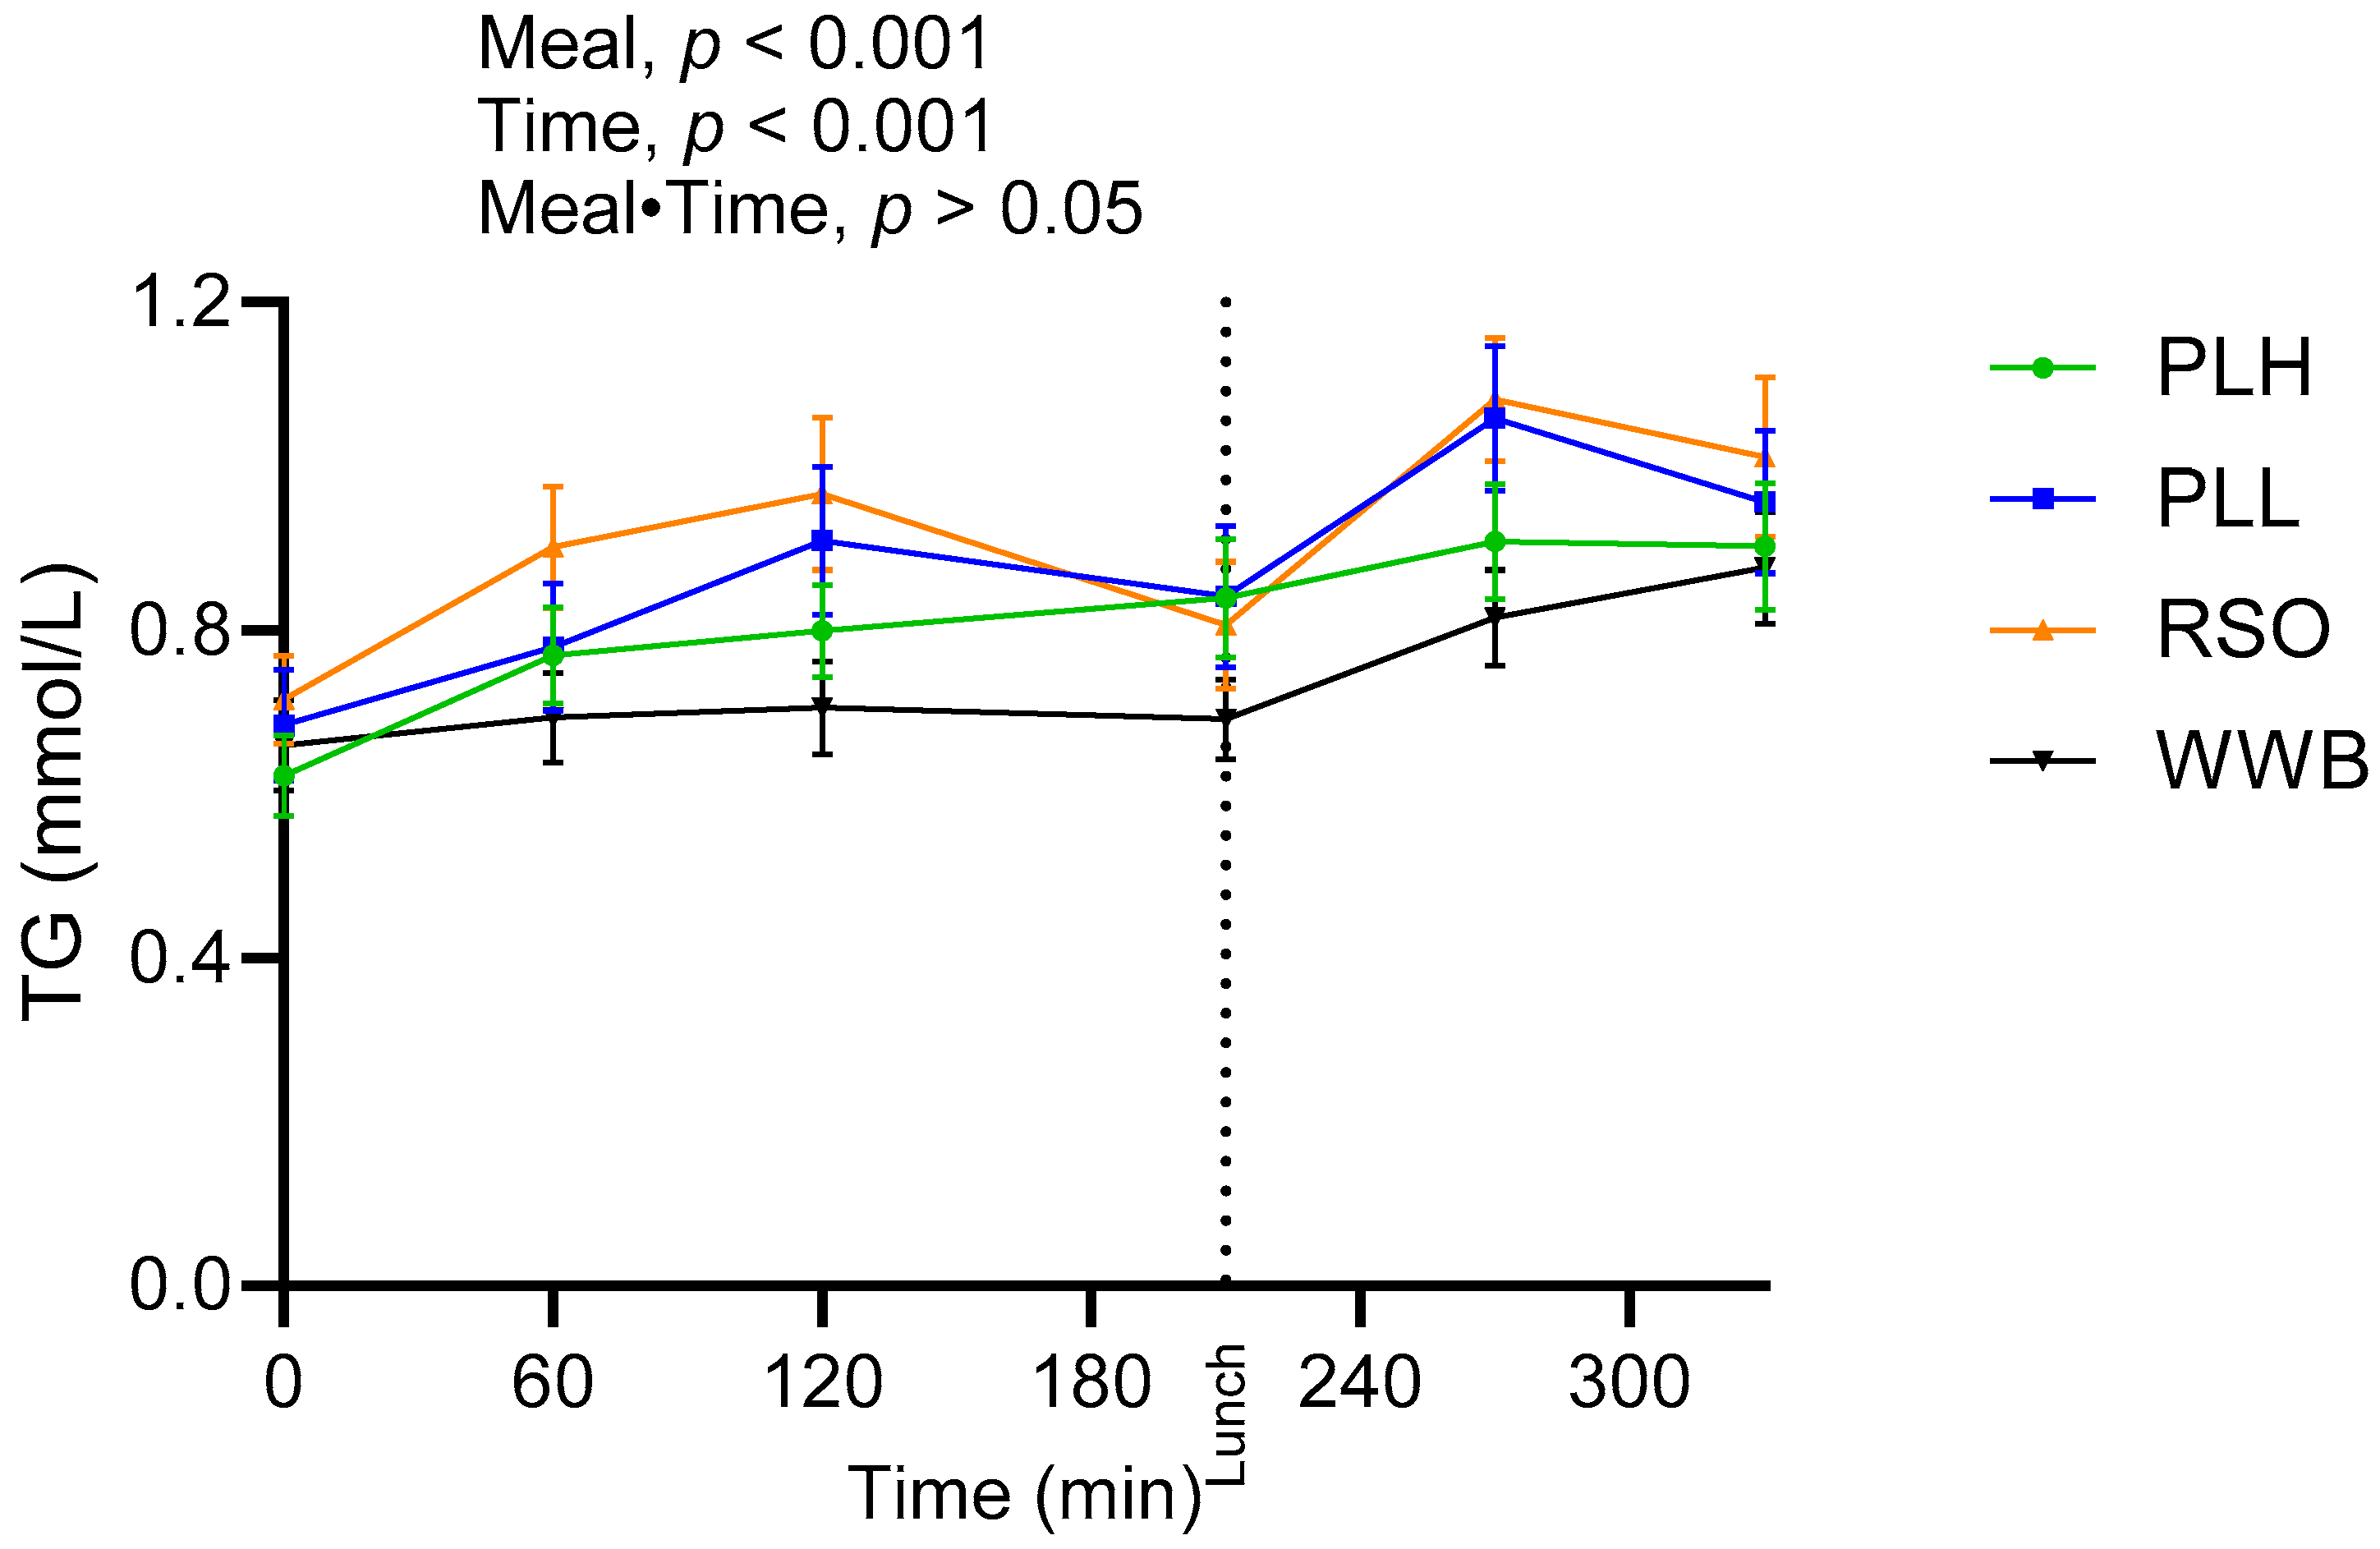
3.3. Triglycerides and FFA
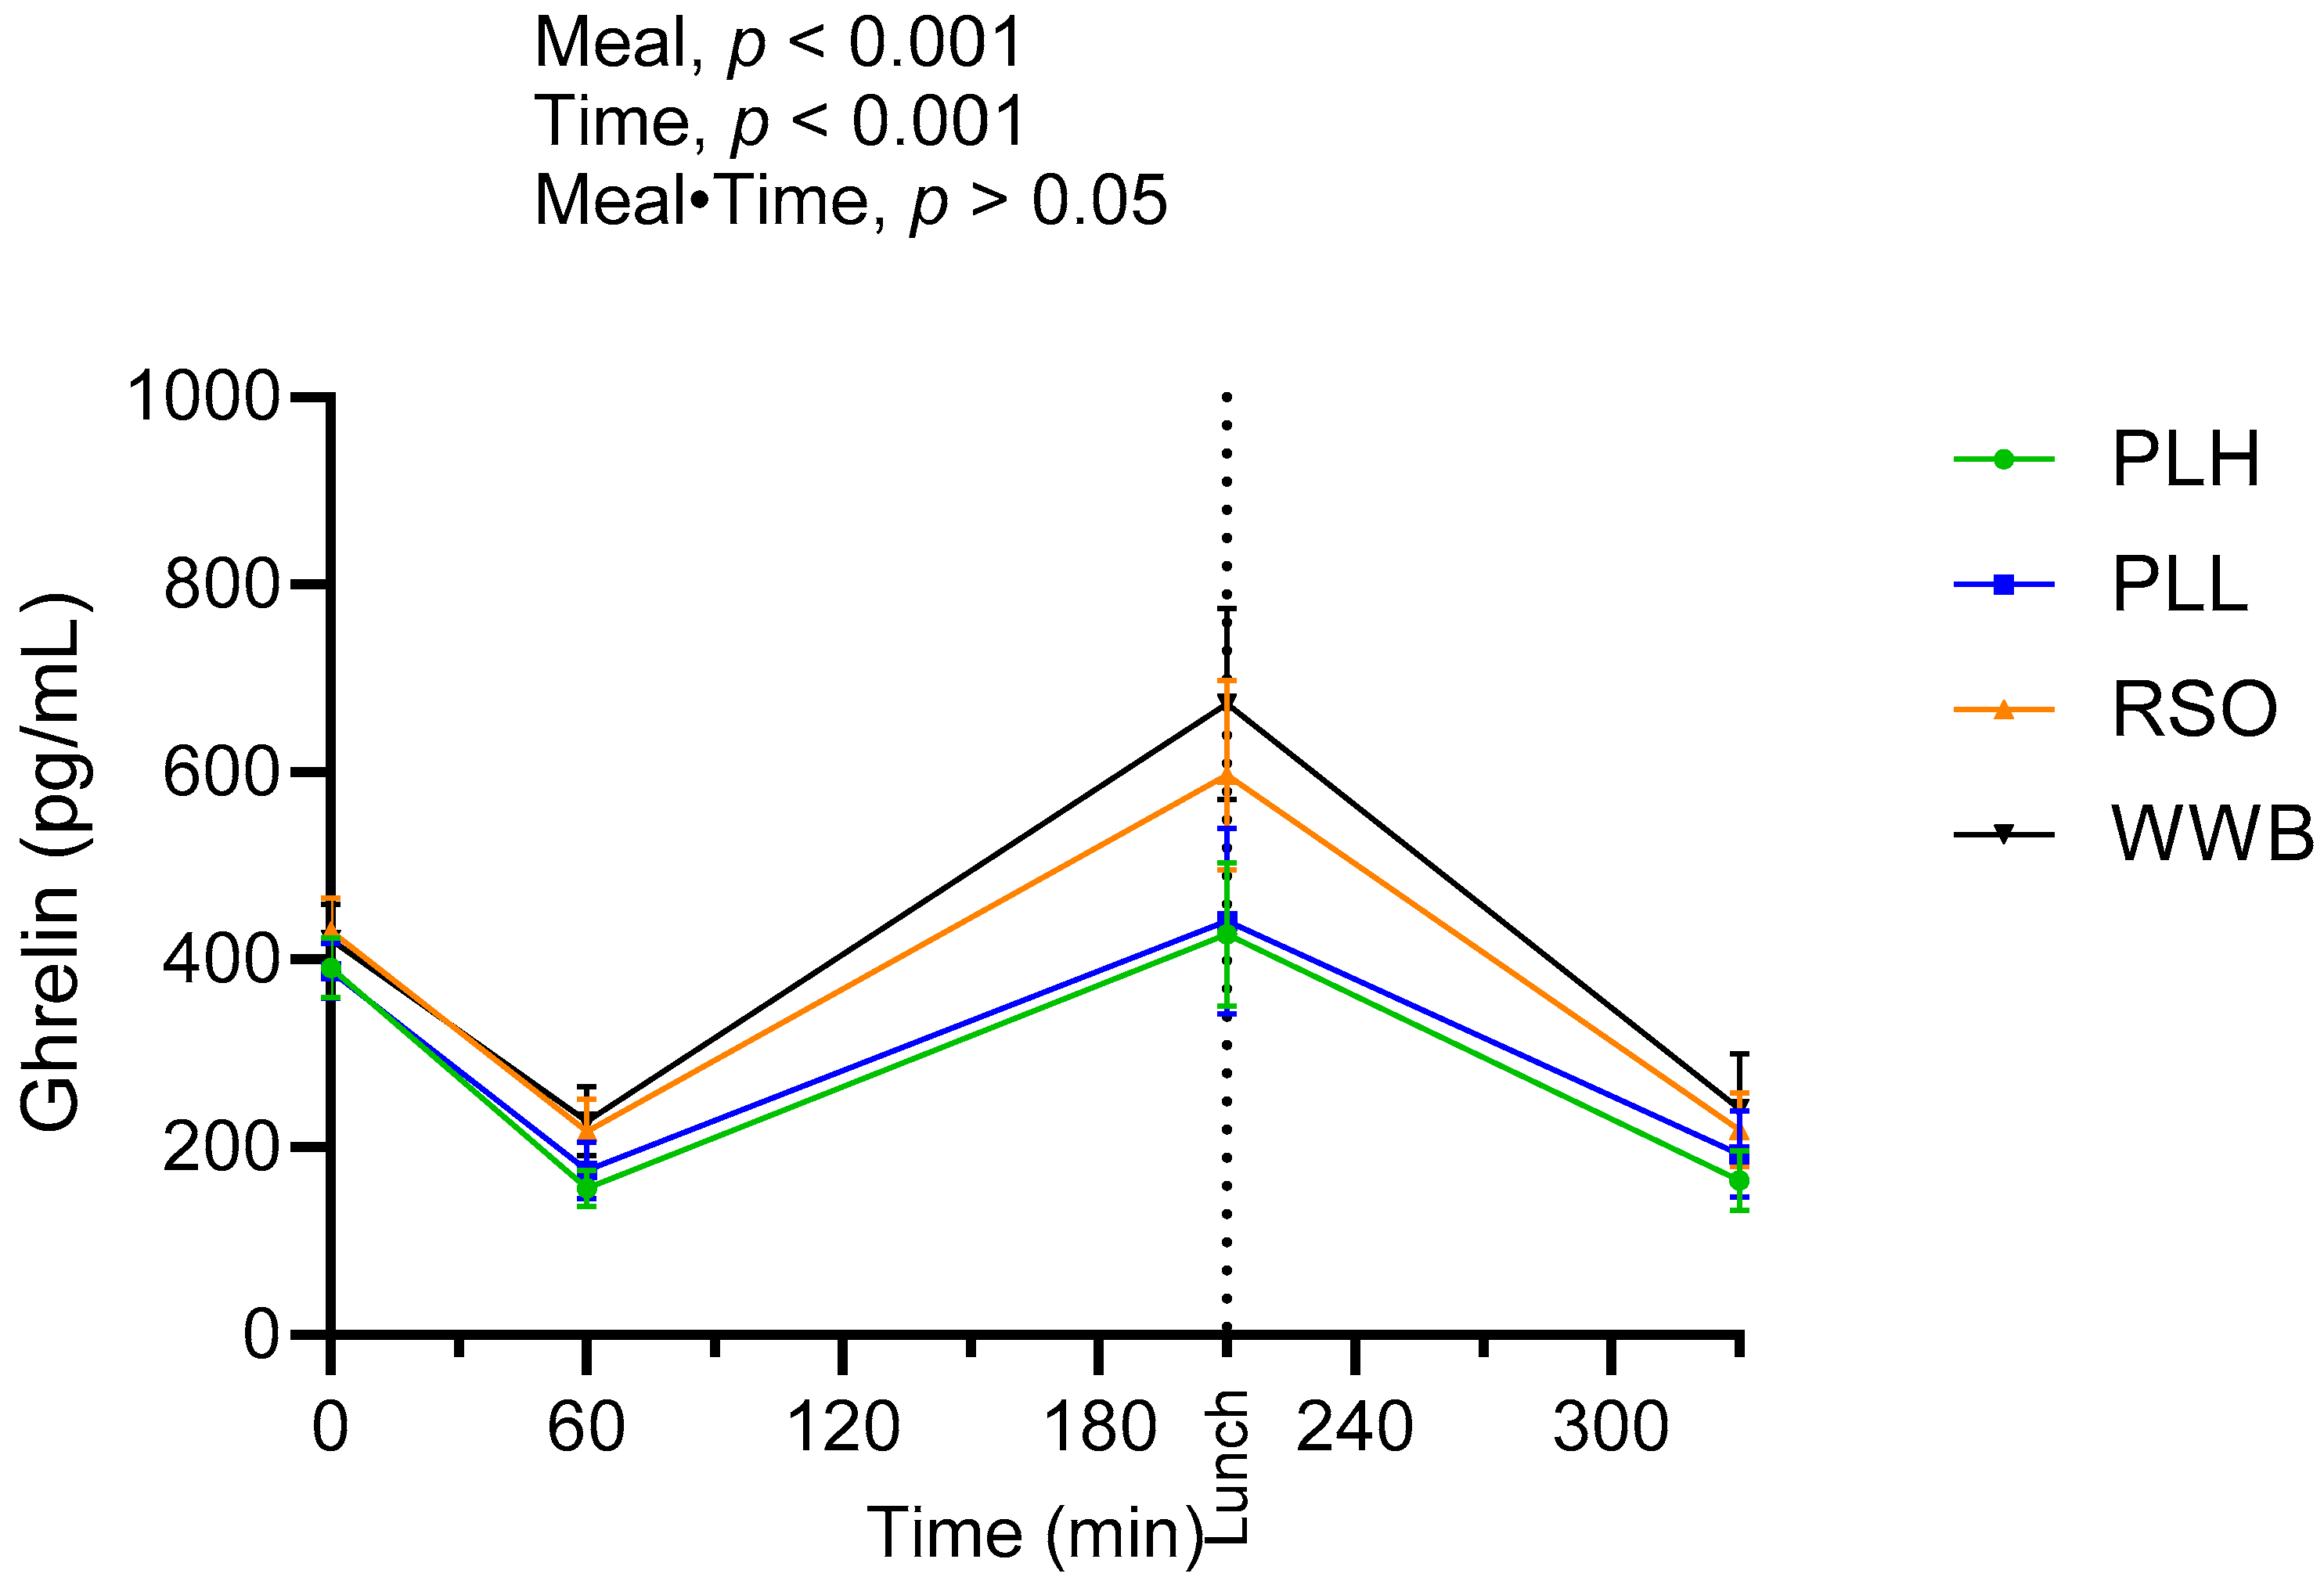
3.4. Ghrelin
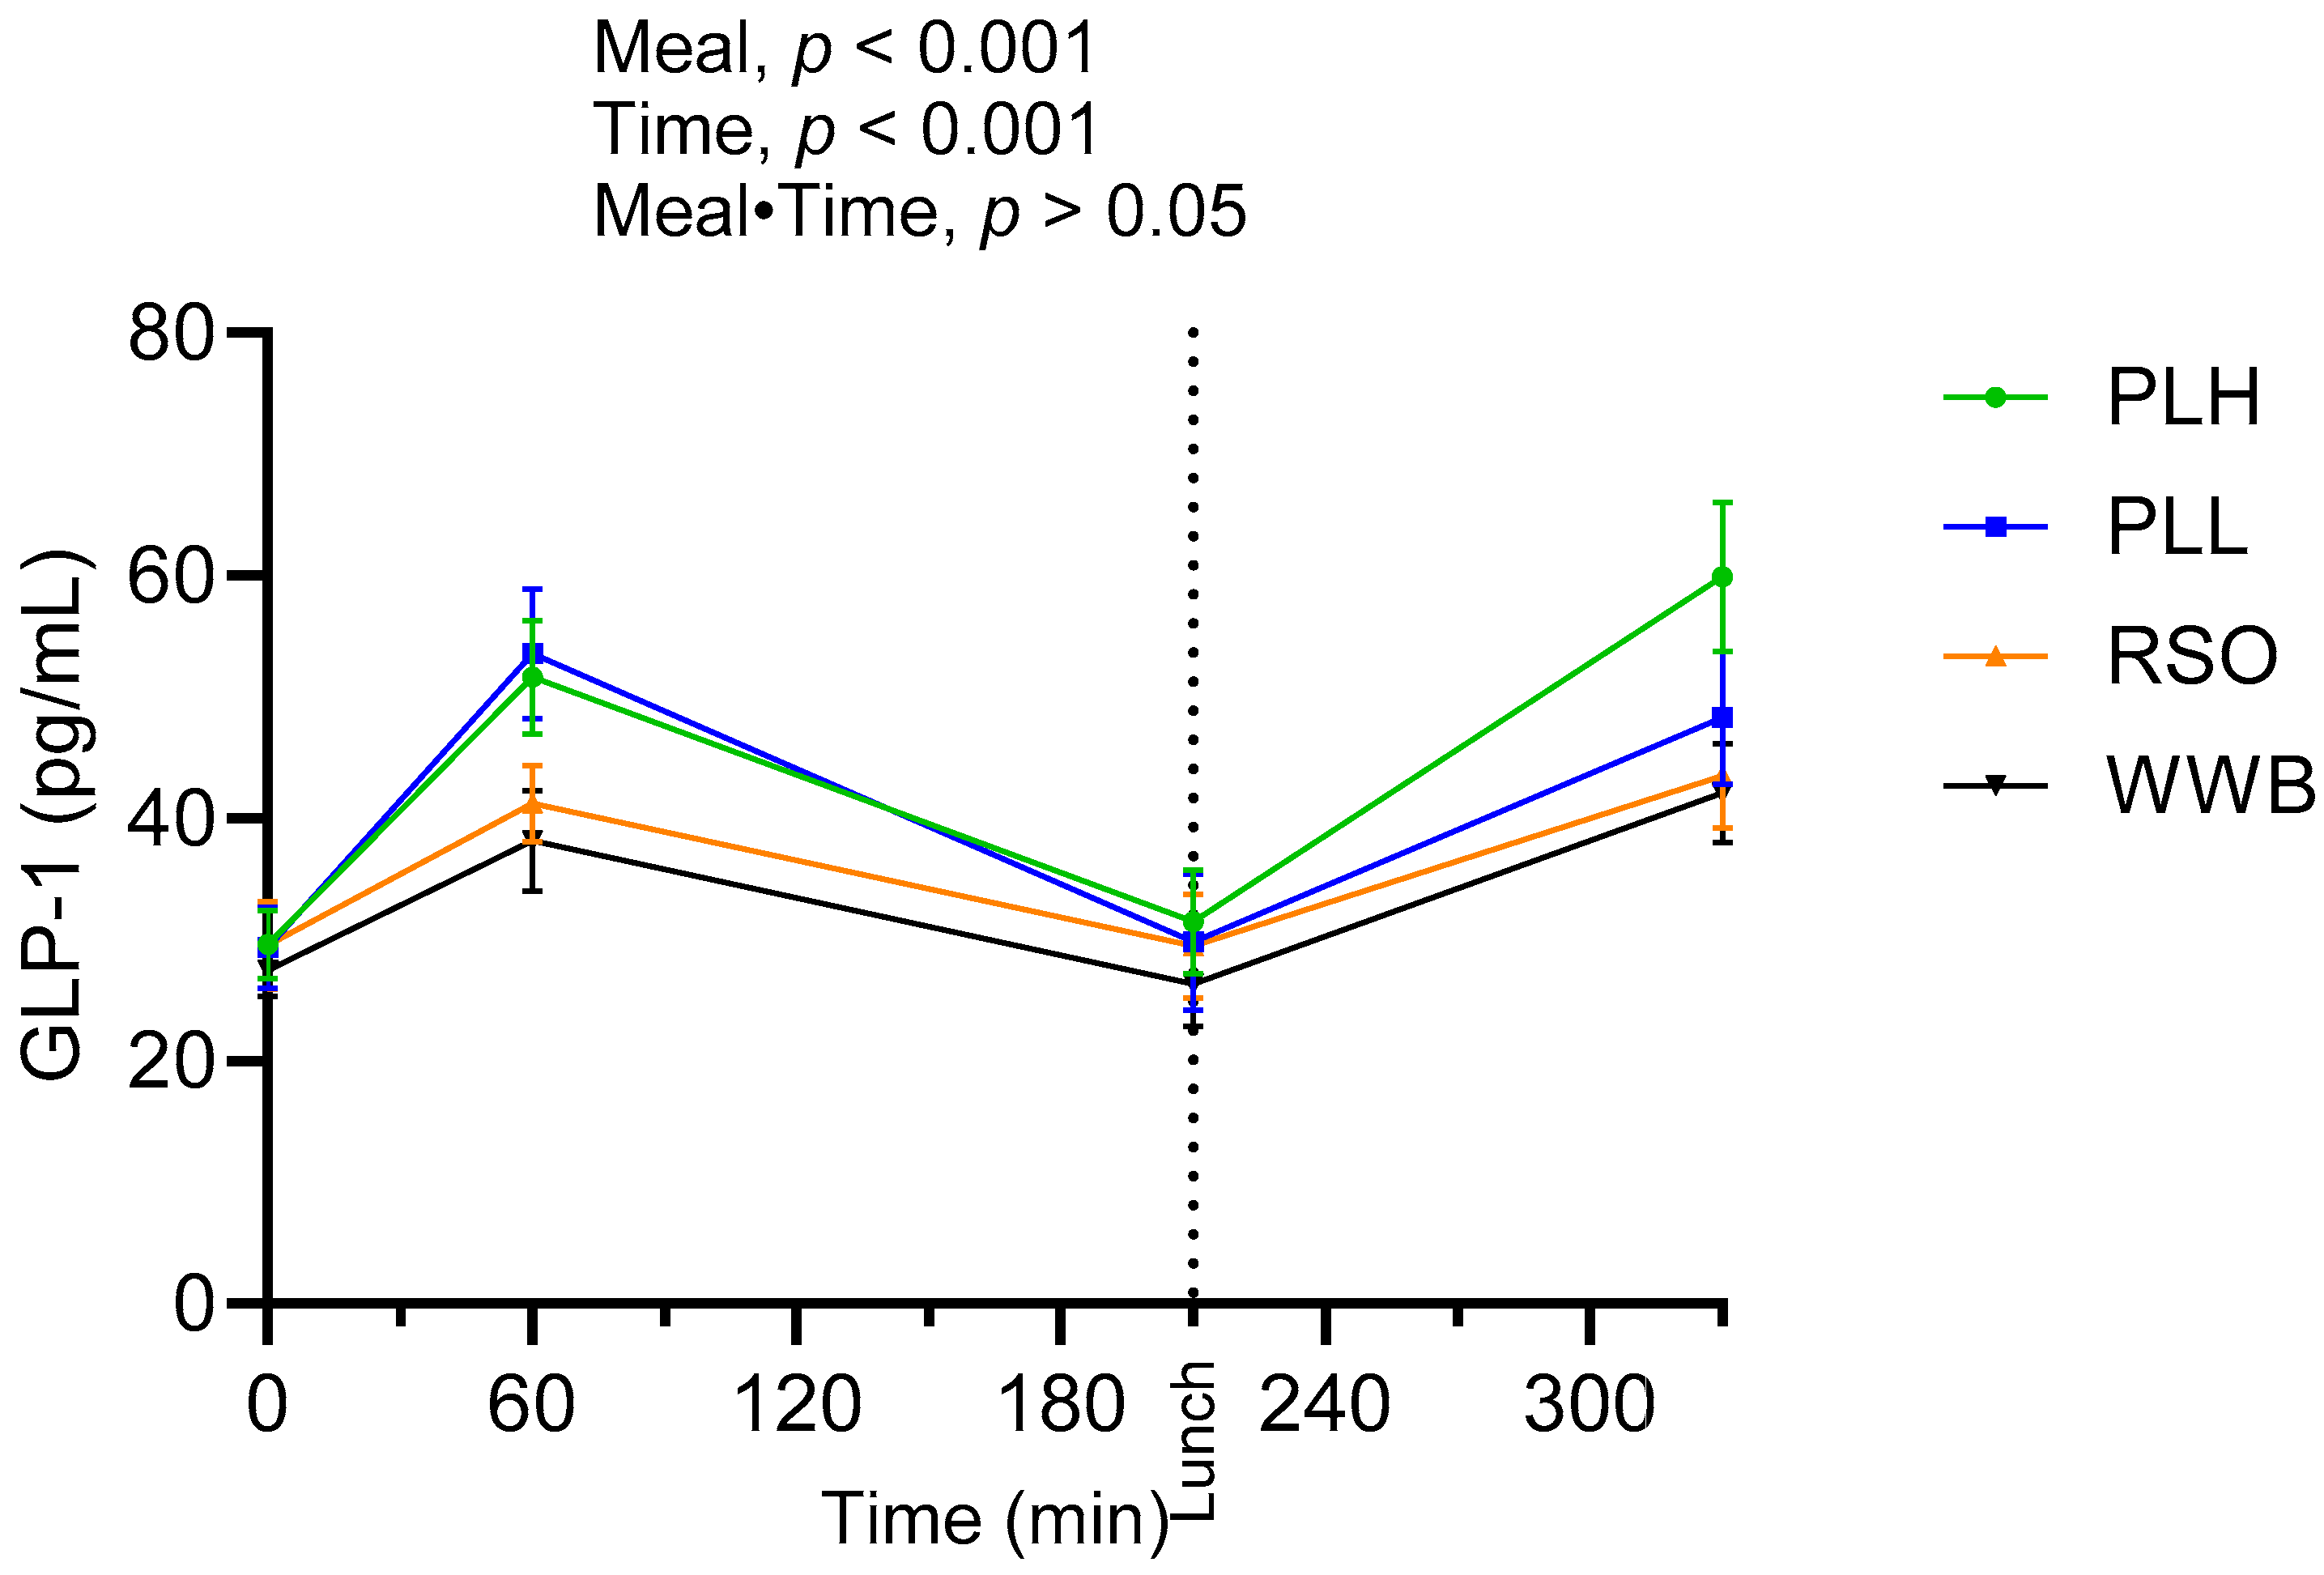
3.5. GLP-1
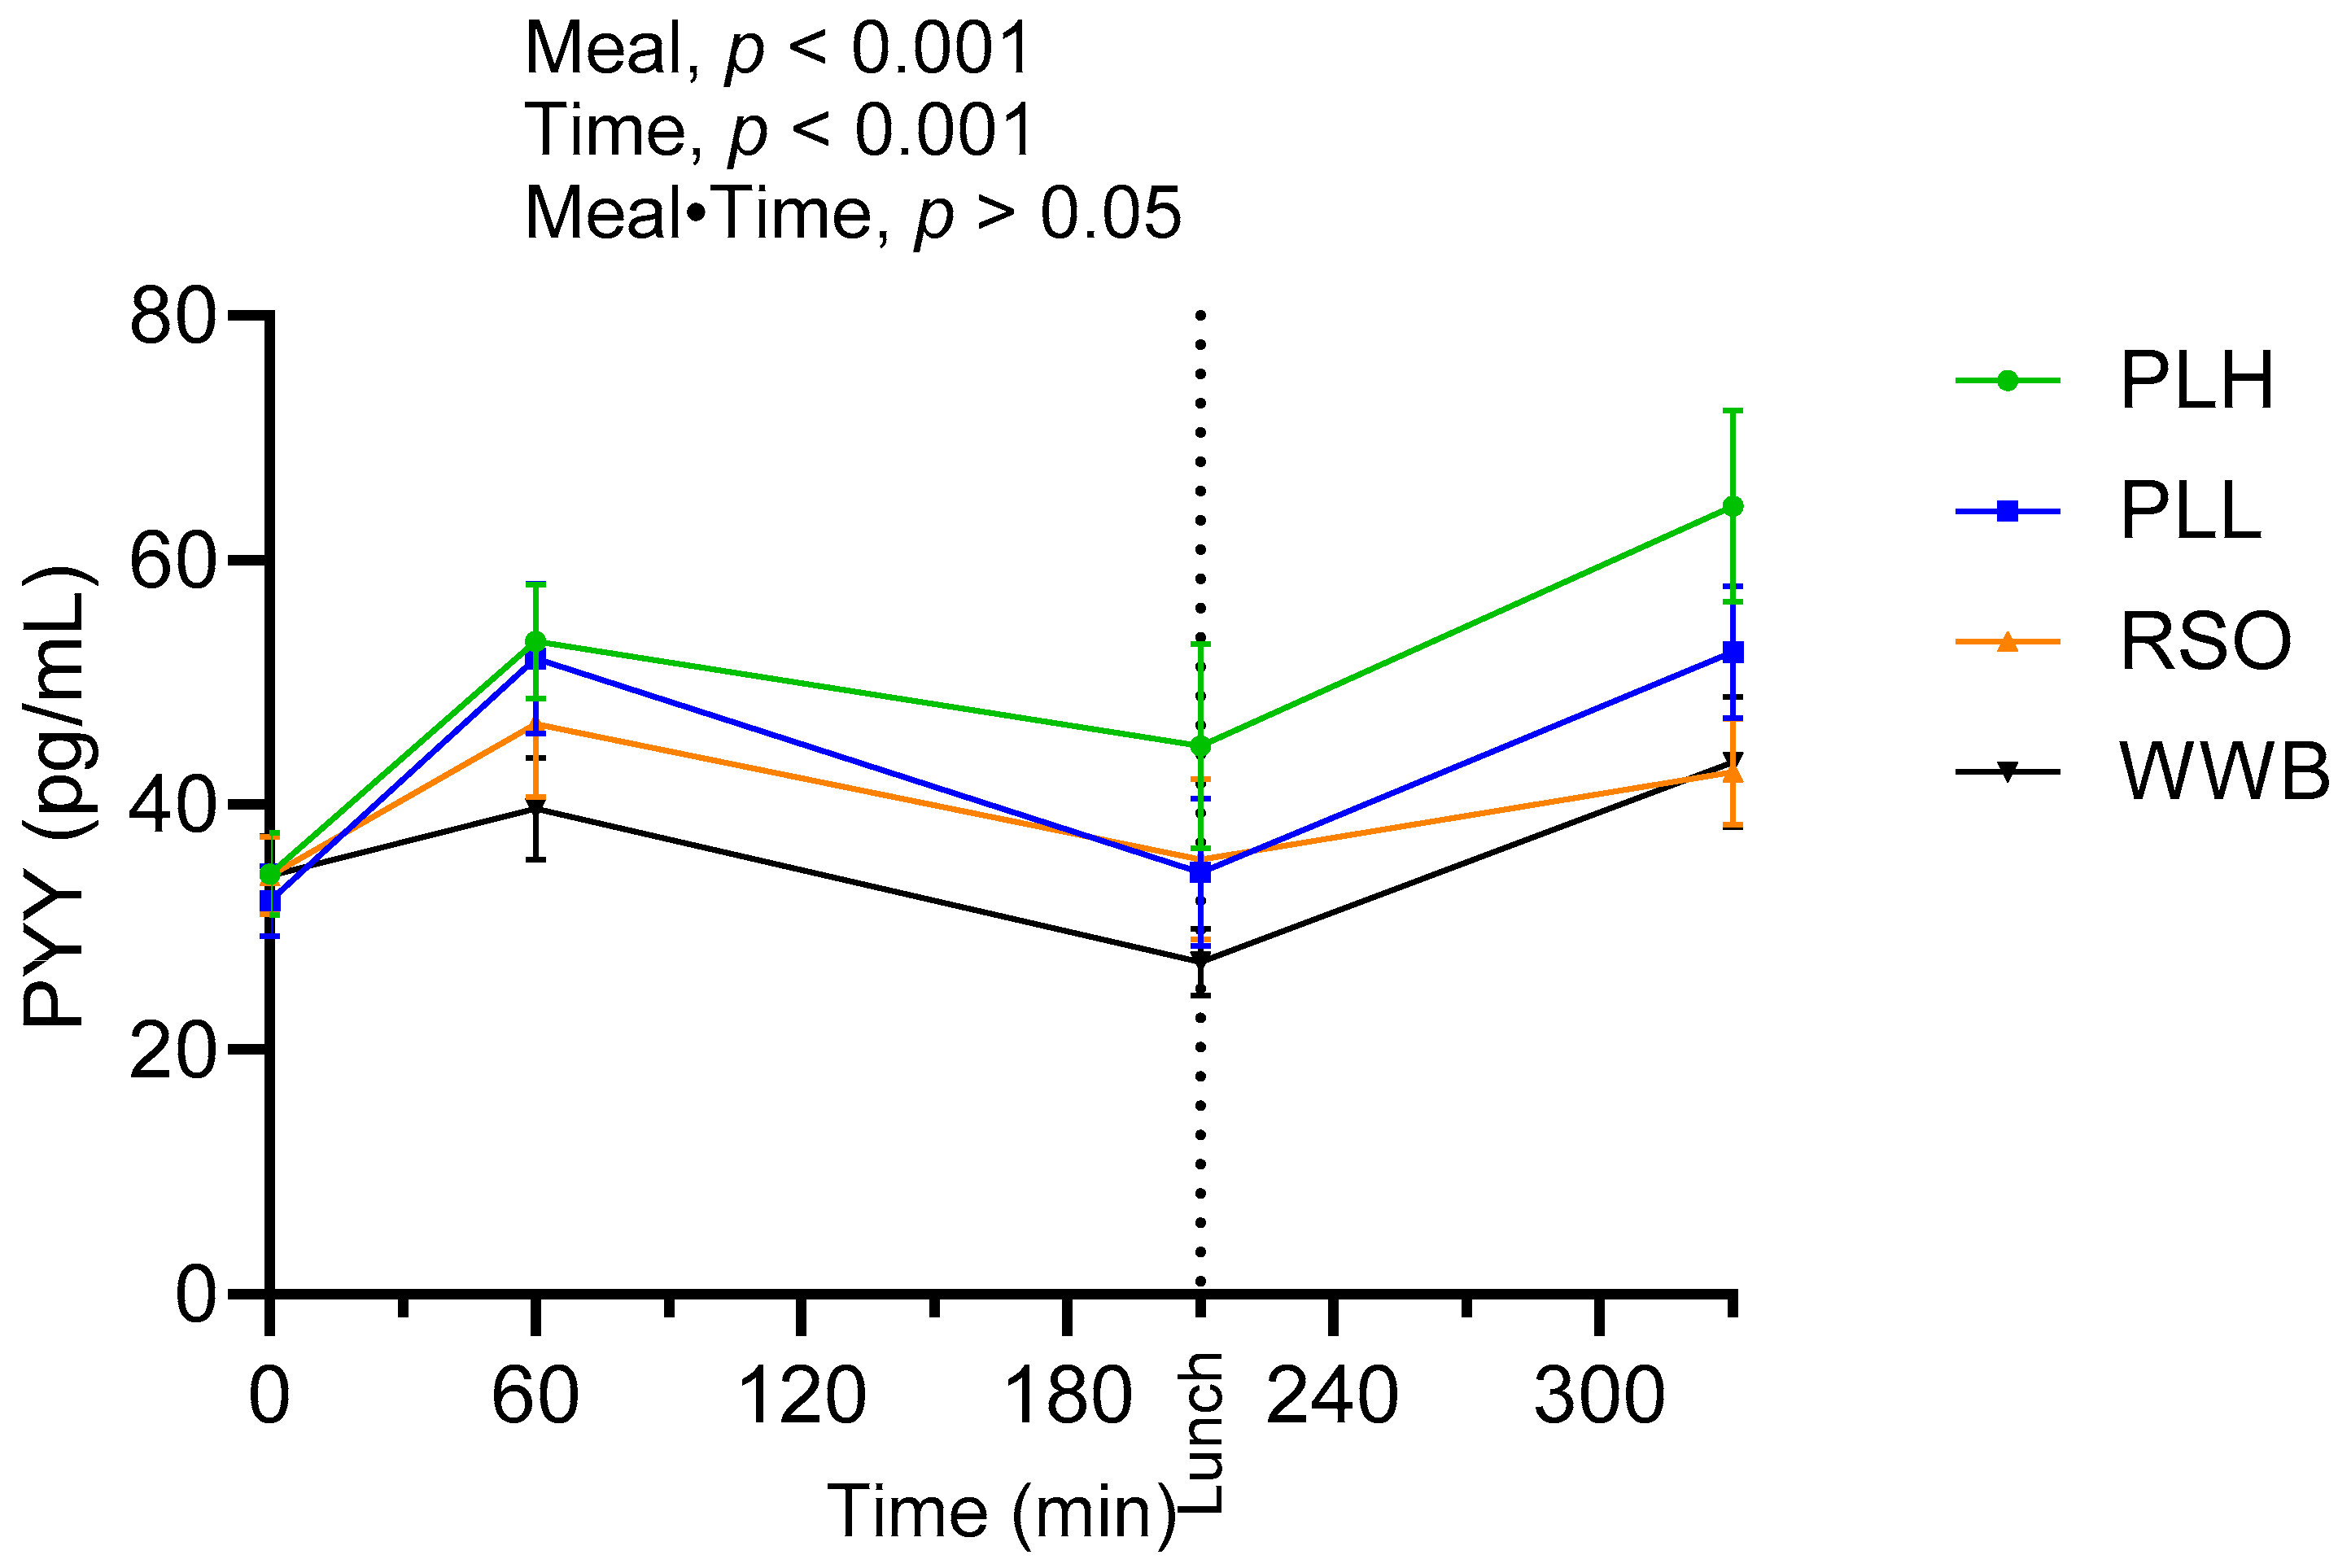
3.6. PYY
3.7. GIP
4. Discussion and Conclusions
Supplementary Materials
Author Contributions
Funding
Institutional Review Board Statement
Informed Consent Statement
Data Availability Statement
Acknowledgments
Conflicts of Interest
References
- Cho, N.H.; Shaw, J.E.; Karuranga, S.; Huang, Y.; da Rocha Fernandes, J.D.; Ohlrogge, A.W.; Malanda, B. IDF Diabetes Atlas: Global estimates of diabetes prevalence for 2017 and projections for 2045. Diabetes Res. Clin. Pract. 2018, 138, 271–281. [Google Scholar] [CrossRef] [PubMed]
- Sun, H.; Saeedi, P.; Karuranga, S.; Pinkepank, M.; Ogurtsova, K.; Duncan, B.B.; Stein, C.; Basit, A.; Chan, J.C.N.; Mbanya, J.C.; et al. IDF Diabetes Atlas: Global, regional and country-level diabetes prevalence estimates for 2021 and projections for 2045. Diabetes Res. Clin. Pract. 2022, 183, 109119. [Google Scholar] [CrossRef] [PubMed]
- Pivari, F.; Mingione, A.; Brasacchio, C.; Soldati, L. Curcumin and Type 2 Diabetes Mellitus: Prevention and Treatment. Nutrients 2019, 11, 1837. [Google Scholar] [CrossRef] [PubMed]
- Maki, K.C.; Beiseigel, J.M.; Jonnalagadda, S.S.; Gugger, C.K.; Reeves, M.S.; Farmer, M.V.; Kaden, V.N.; Rains, T.M. Whole-grain ready-to-eat oat cereal, as part of a dietary program for weight loss, reduces low-density lipoprotein cholesterol in adults with overweight and obesity more than a dietary program including low-fiber control foods. J. Am. Diet. Assoc. 2010, 110, 205–214. [Google Scholar] [CrossRef] [PubMed]
- Menon, R.; Gonzalez, T.; Ferruzzi, M.; Jackson, E.; Winderl, D.; Watson, J. Oats-From Farm to Fork. Adv. Food Nutr. Res. 2016, 77, 1–55. [Google Scholar] [CrossRef]
- Meydani, M. Potential health benefits of avenanthramides of oats. Nutr. Rev. 2009, 67, 731–735. [Google Scholar] [CrossRef]
- Sandberg, J.C.; Björck, I.M.E.; Nilsson, A.C. Effects of whole grain rye, with and without resistant starch type 2 supplementation, on glucose tolerance, gut hormones, inflammation and appetite regulation in an 11–14.5 hour perspective; a randomized controlled study in healthy subjects. Nutr. J. 2017, 16, 25. [Google Scholar] [CrossRef]
- Jane, M.; McKay, J.; Pal, S. Effects of daily consumption of psyllium, oat bran and polyGlycopleX on obesity-related disease risk factors: A critical review. Nutrition 2019, 57, 84–91. [Google Scholar] [CrossRef]
- Tosh, S.M.; Bordenave, N. Emerging science on benefits of whole grain oat and barley and their soluble dietary fibers for heart health, glycemic response, and gut microbiota. Nutr. Rev. 2020, 78, 13–20. [Google Scholar] [CrossRef]
- Leonova, S.; Shelenga, T.; Hamberg, M.; Konarev, A.; Loskutov, I.; Carlsson, A. Analysis of oil composition in cultivars and wild species of oat (Avena sp.). J. Agric. Food Chem. 2008, 56, 7983–7991. [Google Scholar] [CrossRef]
- Leonova, S.; Sveriges Lantbruksuniversitet. Institutionen för, v. Lipids in Seeds of Oat (Avena spp.), a Potential Oil Crop: Content, Quality, Metabolism, and Possibilities for Improvement; Dept. of Plant Breeding, Swedish University of Agricultural Sciences: Alnarp, Sweden, 2013. [Google Scholar]
- Hossain, M.M.; Tovar, J.; Cloetens, L.; Florido, M.T.S.; Petersson, K.; Prothon, F.; Nilsson, A. Oat Polar Lipids Improve Cardiometabolic-Related Markers after Breakfast and a Subsequent Standardized Lunch: A Randomized Crossover Study in Healthy Young Adults. Nutrients 2021, 13, 988. [Google Scholar] [CrossRef] [PubMed]
- Ohlsson, L.; Rosenquist, A.; Rehfeld, J.F.; Härröd, M. Postprandial effects on plasma lipids and satiety hormones from intake of liposomes made from fractionated oat oil: Two randomized crossover studies. Food Nutr. Res. 2014, 58, 24465. [Google Scholar] [CrossRef] [PubMed]
- Martens, M.J.; Lemmens, S.G.; Born, J.M.; Westerterp-Plantenga, M.S. A solid high-protein meal evokes stronger hunger suppression than a liquefied high-protein meal. Obesity 2011, 19, 522–527. [Google Scholar] [CrossRef]
- Myers, C.; McCartney, D.; Desbrow, B.; Khalesi, S.; Irwin, C. Consumption of a smoothie or cereal-based breakfast: Impact on thirst, hunger, appetite and subsequent dietary intake. Int. J. Food Sci. Nutr. 2021, 72, 123–133. [Google Scholar] [CrossRef]
- Tieken, S.M.; Leidy, H.J.; Stull, A.J.; Mattes, R.D.; Schuster, R.A.; Campbell, W.W. Effects of Solid versus Liquid Meal-replacement Products of Similar Energy Content on Hunger, Satiety, and Appetite-regulating Hormones in Older Adults. Horm. Metab. Res. 2007, 39, 389–394. [Google Scholar] [CrossRef] [PubMed]
- McClements, D.J.; Li, Y. Structured emulsion-based delivery systems: Controlling the digestion and release of lipophilic food components. Adv. Colloid Interface Sci. 2010, 159, 213–228. [Google Scholar] [CrossRef]
- Chu, B.S.; Rich, G.T.; Ridout, M.J.; Faulks, R.M.; Wickham, M.S.J.; Wilde, P.J. Modulating pancreatic lipase activity with galactolipids: Effects of emulsion interfacial composition. Langmuir 2009, 25, 9352–9360. [Google Scholar] [CrossRef]
- Julibert, A.; Bibiloni, M.D.M.; Tur, J.A. Dietary fat intake and metabolic syndrome in adults: A systematic review. Nutr. Metab. Cardiovasc. Dis. 2019, 29, 887–905. [Google Scholar] [CrossRef]
- Capuano, E.; Janssen, A.E.M. Food Matrix and Macronutrient Digestion. Annu. Rev. Food Sci. Technol. 2021, 12, 193–212. [Google Scholar] [CrossRef]
- Kong, F.; Singh, R.P. Disintegration of solid foods in human stomach. J. Food Sci. 2008, 73, R67–R80. [Google Scholar] [CrossRef]
- Pizarroso, N.A.; Fuciños, P.; Gonçalves, C.; Pastrana, L.; Amado, I.R. A Review on the Role of Food-Derived Bioactive Molecules and the Microbiota–Gut–Brain Axis in Satiety Regulation. Nutrients 2021, 13, 632. [Google Scholar] [CrossRef] [PubMed]
- Somaratne, G.; Ferrua, M.J.; Ye, A.; Nau, F.; Floury, J.; Dupont, D.; Singh, J. Food material properties as determining factors in nutrient release during human gastric digestion: A review. Crit. Rev. Food Sci. Nutr. 2020, 60, 3753–3769. [Google Scholar] [CrossRef]
- Liu, W.; Jin, Y.; Wilde, P.J.; Hou, Y.; Wang, Y.; Han, J. Mechanisms, physiology, and recent research progress of gastric emptying. Crit. Rev. Food Sci. Nutr. 2021, 61, 2742–2755. [Google Scholar] [CrossRef] [PubMed]
- Ménard, O.; Famelart, M.H.; Deglaire, A.; Le Gouar, Y.; Guérin, S.; Malbert, C.H.; Dupont, D. Gastric Emptying and Dynamic In Vitro Digestion of Drinkable Yogurts: Effect of Viscosity and Composition. Nutrients 2018, 10, 1308. [Google Scholar] [CrossRef] [PubMed]
- Sahaka, M.; Mateos-Diaz, E.; Amara, S.; Wattanakul, J.; Gray, D.; Lafont, D.; Gontero, B.; Launay, H.; Carrière, F. In situ monitoring of galactolipid digestion by infrared spectroscopy in both model micelles and spinach chloroplasts. Chem. Phys. Lipids 2023, 252, 105291. [Google Scholar] [CrossRef] [PubMed]
- Yilmaz, J.L.; Adlercreutz, P.; Tullberg, C. Polar Lipids Reduce in vitro Duodenal Lipolysis Rate of Oat Oil and Liquid Oat Base Products. Eur. J. Lipid Sci. Technol. 2021, 123, 2000317. [Google Scholar] [CrossRef]
- Holst, J.J.; Gasbjerg, L.S.; Rosenkilde, M.M. The Role of Incretins on Insulin Function and Glucose Homeostasis. Endocrinology 2021, 162, bqab065. [Google Scholar] [CrossRef]
- Nauck, M.A.; Quast, D.R.; Wefers, J.; Pfeiffer, A.F.H. The evolving story of incretins (GIP and GLP-1) in metabolic and cardiovascular disease: A pathophysiological update. Diabetes Obes. Metab. 2021, 23 (Suppl. S3), 5–29. [Google Scholar] [CrossRef]
- Deschaine, S.L.; Leggio, L. From “Hunger Hormone” to “It’s Complicated”: Ghrelin Beyond Feeding Control. Physiology 2022, 37, 5–15. [Google Scholar] [CrossRef]
- Keirns, B.H.; Sciarrillo, C.M.; Koemel, N.A.; Emerson, S.R. Fasting, non-fasting and postprandial triglycerides for screening cardiometabolic risk. J. Nutr. Sci. 2021, 10, e75. [Google Scholar] [CrossRef]


| Meals | Meal Compositions | |
|---|---|---|
| Reference Meal 1 | WWB | 120 g white wheat bread, no added oil, 260 mL water. |
| Test Meals 1 | PLH | 120 g WWB, 16.6 g of 90% enriched oat polar lipid, 260 2 mL water. |
| PLL | 120 g WWB, 8.3 g of 90% enriched oat polar lipid, 8.3 g rapeseed oil and 260 2 mL water. | |
| RSO | 120 g WWB, 16.6 g rapeseed oil, 260 mL water. | |
| Standardized Lunch | 120 g white wheat bread, 100 g meatballs, 250 mL water | |
| Breakfast | Standardized Lunch | |
|---|---|---|
| Carbohydrates (g) | 50 | 58 |
| Fat (g) | 16.6 | 18.5 |
| Protein (g) | 8.5 | 21.5 |
| Calories (kcal) | 385 | 485 |
| Test Variables | WWB | RSO | PLL | PLH | |||
|---|---|---|---|---|---|---|---|
| %∆ 2 | %∆ 2 | %∆ 2 | |||||
| Glucose | |||||||
| Fasting blood glucose (mmol/L) | 4.91 ± 0.08 a | 4.92 ± 0.06 a | 0.20 | 4.92 ± 0.07 a | 0.30 | 4.97 ± 0.06 a | 1.32 |
| Blood glucose at 210, i.e., directly prior to the std. lunch (mmol/L) | 4.67 ± 0.10 a | 4.78 ± 0.09 a | 2.35 | 4.85 ± 0.12 a | 3.96 | 4.77 ± 0.09 a | 2.24 |
| Blood glucose iAUC 0–120 min (mmol·min/L) | 165.60 ± 14.90 a | 133.70 ± 12.70 ab | −19.26 | 102 ± 10.40 bc | −38.40 | 83.8 ± 11.10 c | −49.39 |
| Blood glucose iAUC 210–330 min (mmol·min/L) | 133.20 ± 10.80 a | 118.76 ± 8.77 a | −10.84 | 113.9 ± 10.2 a | −14.48 | 78.90 ± 10.20 b | −40.76 |
| Blood glucose iAUC 0–330 min (mmol·min/L) | 322.40 ± 21.30 a | 278.50 ± 19.50 ab | −13.61 | 239.50 ± 18.50 b | −25.71 | 171.70 ± 17.10 c | −46.74 |
| Insulin | |||||||
| Fasting blood insulin (nmol/L) | 0.04 ± 0.007 a | 0.04 ± 0.004 a | −5.42 | 0.05 ± 0.006 a | 8.70 | 0.05 ± 0.006 a | 7.06 |
| Blood insulin at 210 min, i.e., directly prior to std. lunch (nmol/L) | 0.04 ± 0.007 a | 0.05 ± 0.009 a | 15.6 | 0.04 ± 0.005 a | 0 | 0.06 ± 0.009 a | 21.70 |
| Insulin iAUC 0–120 (nmol·min/L) | 18.05 ± 2.31 a | 17.54 ± 2.19 a | −2.82 | 14.31 ± 1.71 ab | −20.72 | 11.19 ± 1.46 b | −38.00 |
| Insulin iAUC 210–330 (nmol·min/L) | 18.66 ± 2.14 ab | 20.13 ± 2.49 a | 7.87 | 18.51 ± 2.13 ab | −0.80 | 16.68 ± 1.82 b | −10.61 |
| Insulin iAUC 0–330 (nmol·min/L) | 40.73 ± 4.94 a | 41.98 ± 5.13 a | 3.06 | 35.69 ± 3.81 ab | −12.37 | 30.55 ± 3.37 b | −24.99 |
| Test Variables | WWB | RSO | PLL | PLH | |||
|---|---|---|---|---|---|---|---|
| Triglycerides (TG) | %∆ 2 | %∆ 2 | %∆ 2 | ||||
| Fasting TG (mmol/L) | 0.65 ± 0.05 a | 0.71 ± 0.05 a | 8.53 | 0.68 ± 0.06 a | 3.68 | 0.62 ± 0.04 a | −5.57 |
| TG AUC 0–210 min (mmol·min/L) | 145.40 ± 11 a | 188.70 ± 15.40 b | 29.77 | 173.40 ± 16.4 ab | 19.25 | 155.70 ± 11 a | 7.08 |
| TG AUC 210–330 min (mmol·min/L) | 95.92 ± 6.70 a | 123.14 ± 8.97 b | 28.37 | 117.5 ± 10.10 bc | 22.49 | 102.69 ± 6.95 ac | 7.05 |
| Free Fatty Acids | |||||||
| Fasting FFA (mmol/L) | 0.53 ± 0.03 a | 0.45 ± 0.03 a | −15.40 | 0.46 ± 0.03 a | −14.31 | 0.46 ± 0.02 a | −14.38 |
| FFA AUC 0–210 min (mmol·min/L) | 59.36 ± 3.42 a | 62.52 ± 3.32 a | 5.32 | 58.01 ± 3.10 a | −2.27 | 60.18 ± 3.34 a | 1.38 |
| FFA AUC 0–210 min (mmol·min/L) | 31.46 ± 1.96 a | 34.29 ± 2.50 a | 8.99 | 31.57 ± 1.87 a | 0.34 | 31.96 ± 1.83 a | 1.58 |
| Test Variables | WWB | RSO | PLL | PLH | |||
|---|---|---|---|---|---|---|---|
| %∆ 2 | %∆ 2 | %∆ 2 | |||||
| Fasting plasma ghrelin (pg/mL) | 421.3 ± 38.50 a | 430.80 ± 36.50 a | 2.25 | 388 ± 29.10 a | −7.9 | 390.90 ± 32.10 a | −7.21 |
| Ghrelin AUC 0–210 (pg·min/mL) | 87,014 ± 11,233 a | 80,501 ± 10,469 a | −7.48 | 61,068 ± 9501 b | −29.81 | 60,148 ± 7948 b | −30.87 |
| Ghrelin at 330 min (pg/mL) | 236.30 ± 52.90 a | 213.40 ± 39.3 a | −9.69 | 207.60 ± 45.80 a | −12.14 | 164.70 ± 31.90 a | −30.3 |
| Fasting plasma GLP-1 (pg/mL) | 27.52 ± 2.16 a | 26.06 ± 2.49 a | −5.3 | 29.34 ± 3.37 a | 6.64 | 29.63 ± 2.84 a | 7.67 |
| GLP-1 AUC 0–210 (pg·min/mL) | 6378 ± 599 a | 6875 ± 554 a | 7.79 | 8743 ± 862 b | 37.08 | 9296 ± 583 b | 45.75 |
| GLP-1 at 330 min (pg/mL) | 42.12 ± 4.10 a | 42.3 ± 4.27 a | 0.42 | 48.29 ± 5.49 ab | 14.64 | 60.10 ± 6.09 b | 42.68 |
| Fasting plasma PYY (pg/mL) | 32.01 ± 3.09 a | 34.26 ± 3.19 a | 7.02 | 32.2 ± 2.93 a | 0.59 | 36.61 ± 3.36 a | 14.37 |
| PYY AUC 0–210 (pg·min/mL) | 6747 ± 581 a | 8595 ± 1030 b | 27.38 | 9011 ± 1064 bc | 33.55 | 10,481 ± 1036 c | 55.34 |
| PYY at 330 min (pg/mL) | 41.64 ± 5.18 a | 42.67 ± 4.38 a | 2.47 | 52.5 ± 5.43 a | 26.08 | 66.32 ± 7.67 b | 59.26 |
| Fasting plasma GIP (pg/mL) | 136.93 ± 8.18 a | 137.35 ± 9.65 a | 0.3 | 127.31 ± 5.94 a | −7.02 | 136.4 ± 11.20 a | −0.38 |
| GIP AUC 0–210 (pg·min/mL) | 66,561 ± 8999 ac | 111,032 ± 13,836 b | 66.81 | 88,481 ± 11,853 ab | 32.93 | 59,218 ± 5365 c | −11.03 |
| GIP at 330 min (pg/mL) | 503.7 ± 58.60 a | 438.6 ± 60.1 ab | −12.92 | 461.10 ± 47.90 ab | −8.45 | 565.9 ± 62.30 b | 12.34 |
Disclaimer/Publisher’s Note: The statements, opinions and data contained in all publications are solely those of the individual author(s) and contributor(s) and not of MDPI and/or the editor(s). MDPI and/or the editor(s) disclaim responsibility for any injury to people or property resulting from any ideas, methods, instructions or products referred to in the content. |
© 2023 by the authors. Licensee MDPI, Basel, Switzerland. This article is an open access article distributed under the terms and conditions of the Creative Commons Attribution (CC BY) license (https://creativecommons.org/licenses/by/4.0/).
Share and Cite
Hossain, M.M.; Tovar, J.; Cloetens, L.; Nilsson, A. Inclusion of Oat Polar Lipids in a Solid Breakfast Improves Glucose Tolerance, Triglyceridemia, and Gut Hormone Responses Postprandially and after a Standardized Second Meal: A Randomized Crossover Study in Healthy Subjects. Nutrients 2023, 15, 4389. https://doi.org/10.3390/nu15204389
Hossain MM, Tovar J, Cloetens L, Nilsson A. Inclusion of Oat Polar Lipids in a Solid Breakfast Improves Glucose Tolerance, Triglyceridemia, and Gut Hormone Responses Postprandially and after a Standardized Second Meal: A Randomized Crossover Study in Healthy Subjects. Nutrients. 2023; 15(20):4389. https://doi.org/10.3390/nu15204389
Chicago/Turabian StyleHossain, Mohammad Mukul, Juscelino Tovar, Lieselotte Cloetens, and Anne Nilsson. 2023. "Inclusion of Oat Polar Lipids in a Solid Breakfast Improves Glucose Tolerance, Triglyceridemia, and Gut Hormone Responses Postprandially and after a Standardized Second Meal: A Randomized Crossover Study in Healthy Subjects" Nutrients 15, no. 20: 4389. https://doi.org/10.3390/nu15204389