
Associations between the Genetic Heritability of Dyslipidemia and Dietary Patterns in Korean Adults Based on Sex Differences


Abstract
1. Introduction
2. Materials and Methods
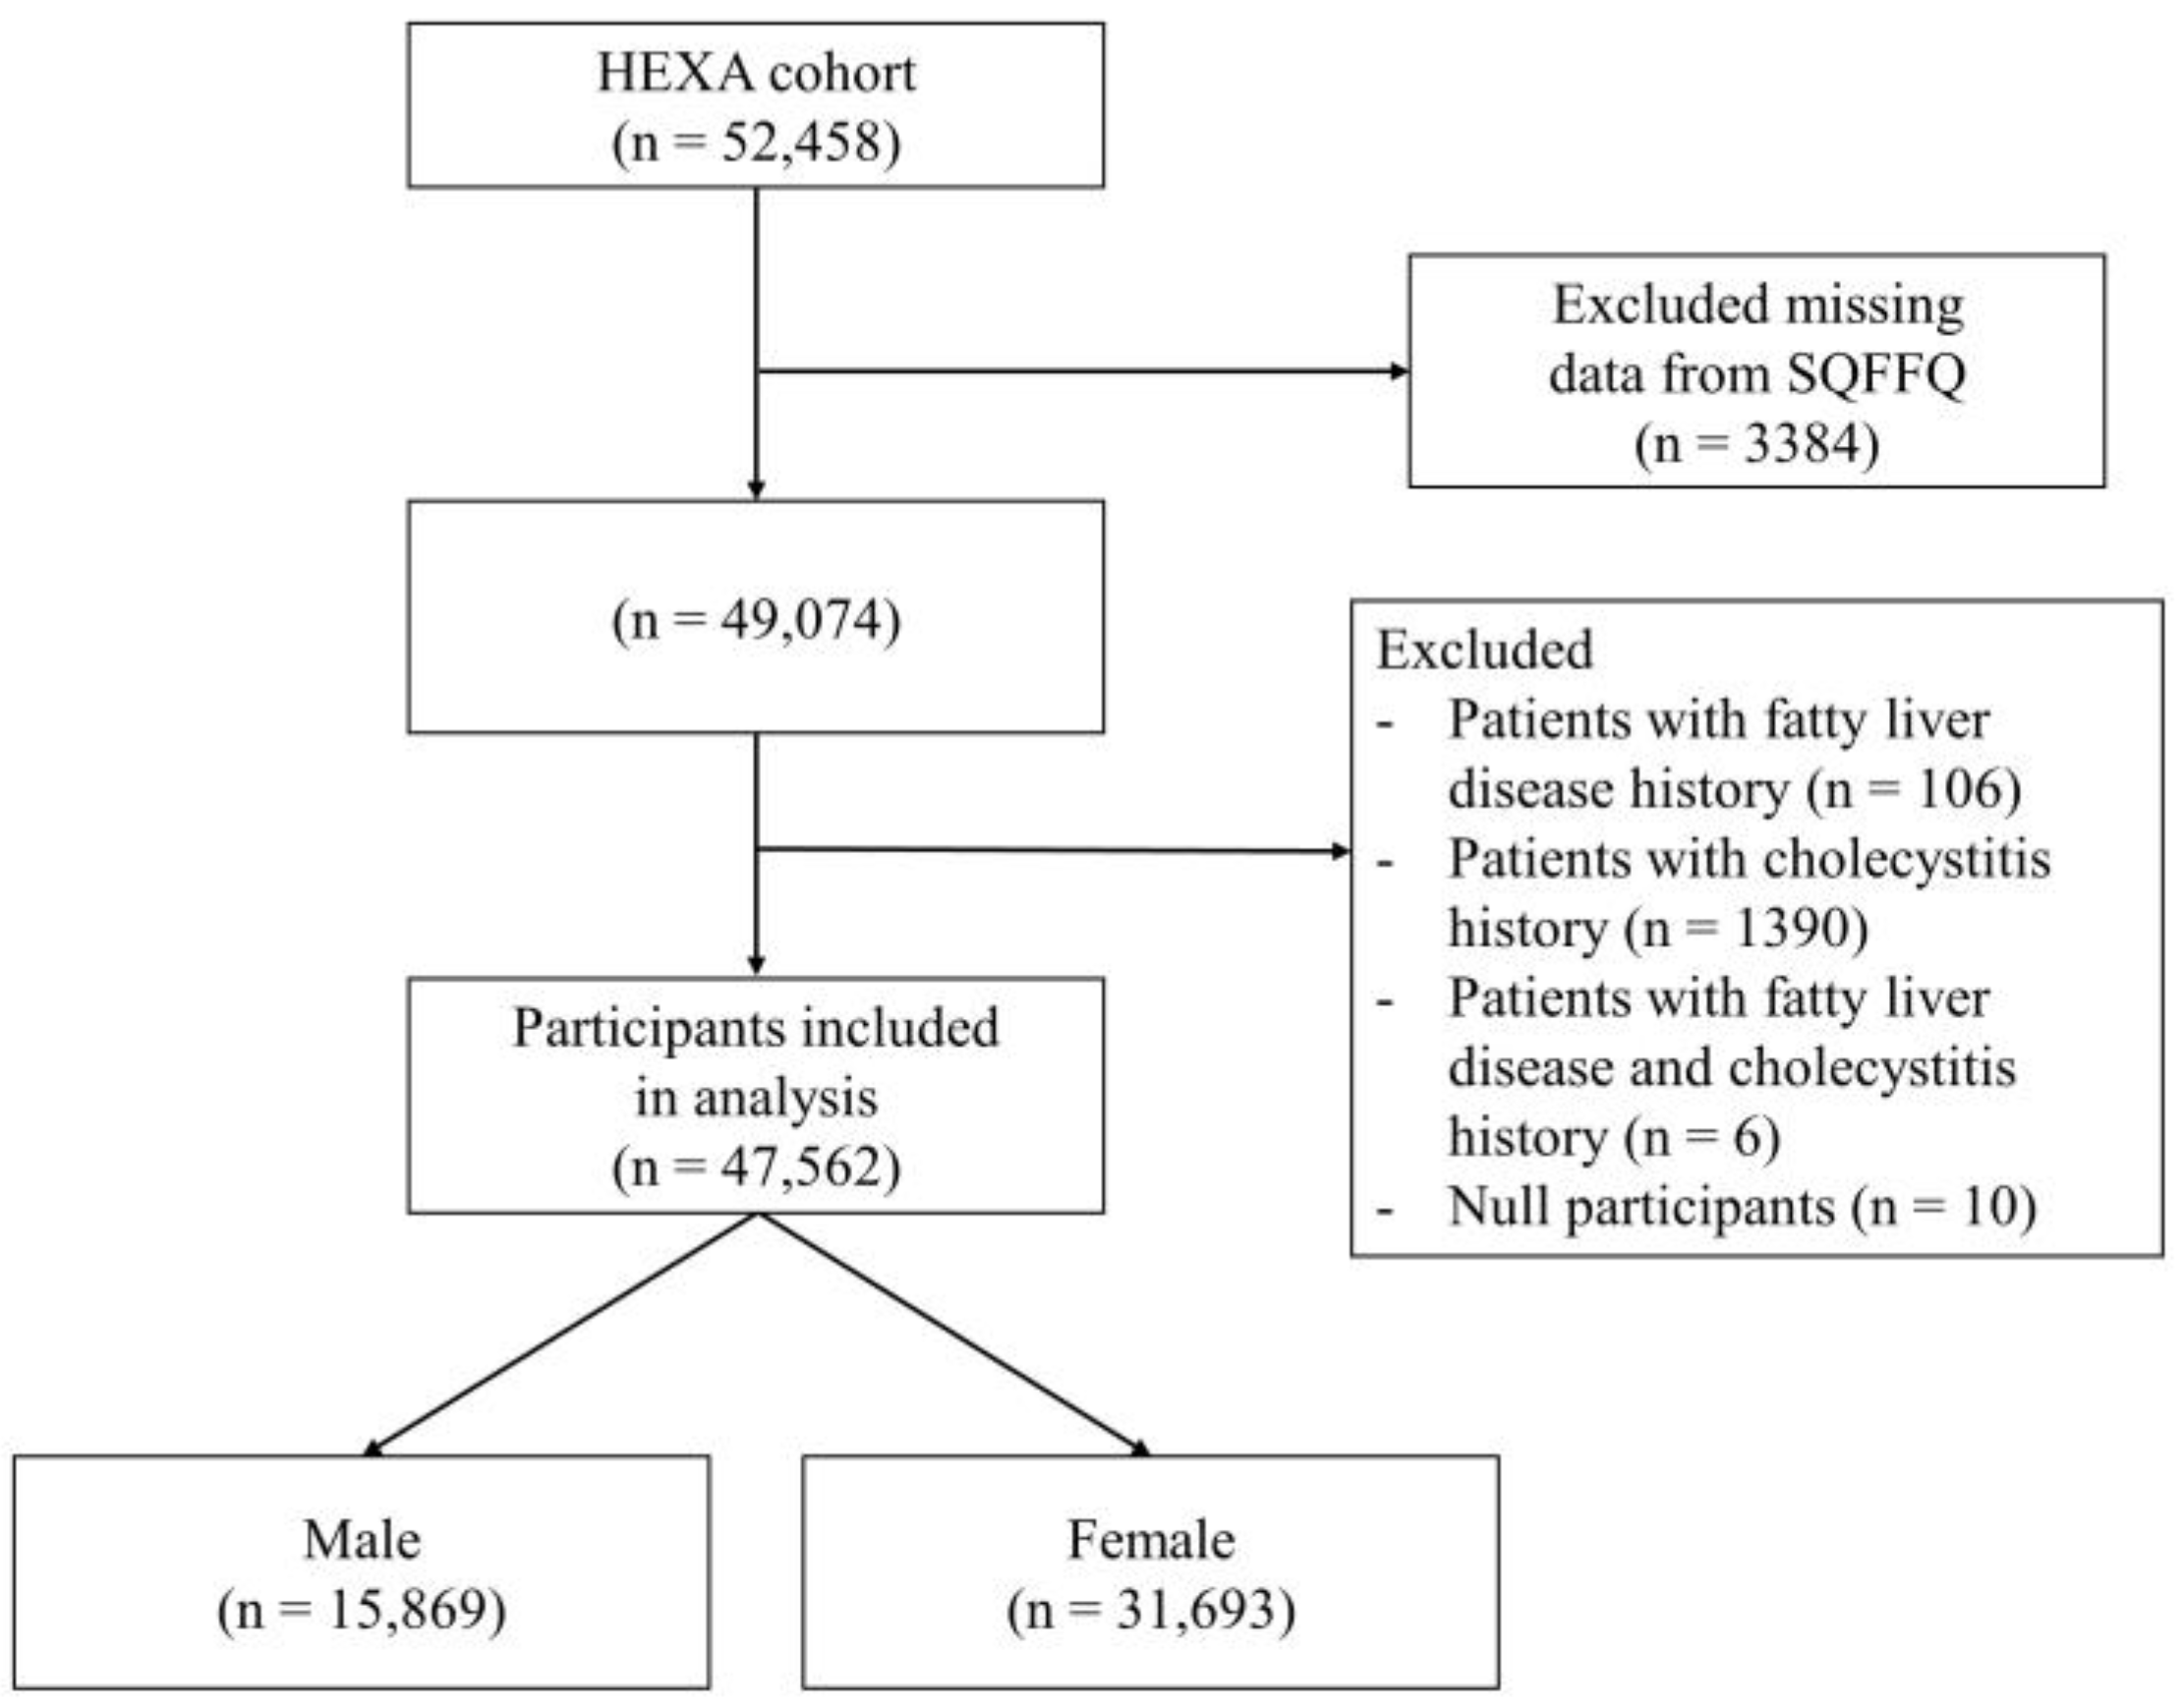
2.1. Participants
2.2. Biochemical Measurements
2.3. Genotyping, Quality Control, GWASs, and Calculating GRS
2.4. Dietary Patterns
2.5. Statistical Analysis
3. Results
3.1. Demographic Characteristics of Study Participants
3.2. Significant SNPs Related to Dyslipidemia
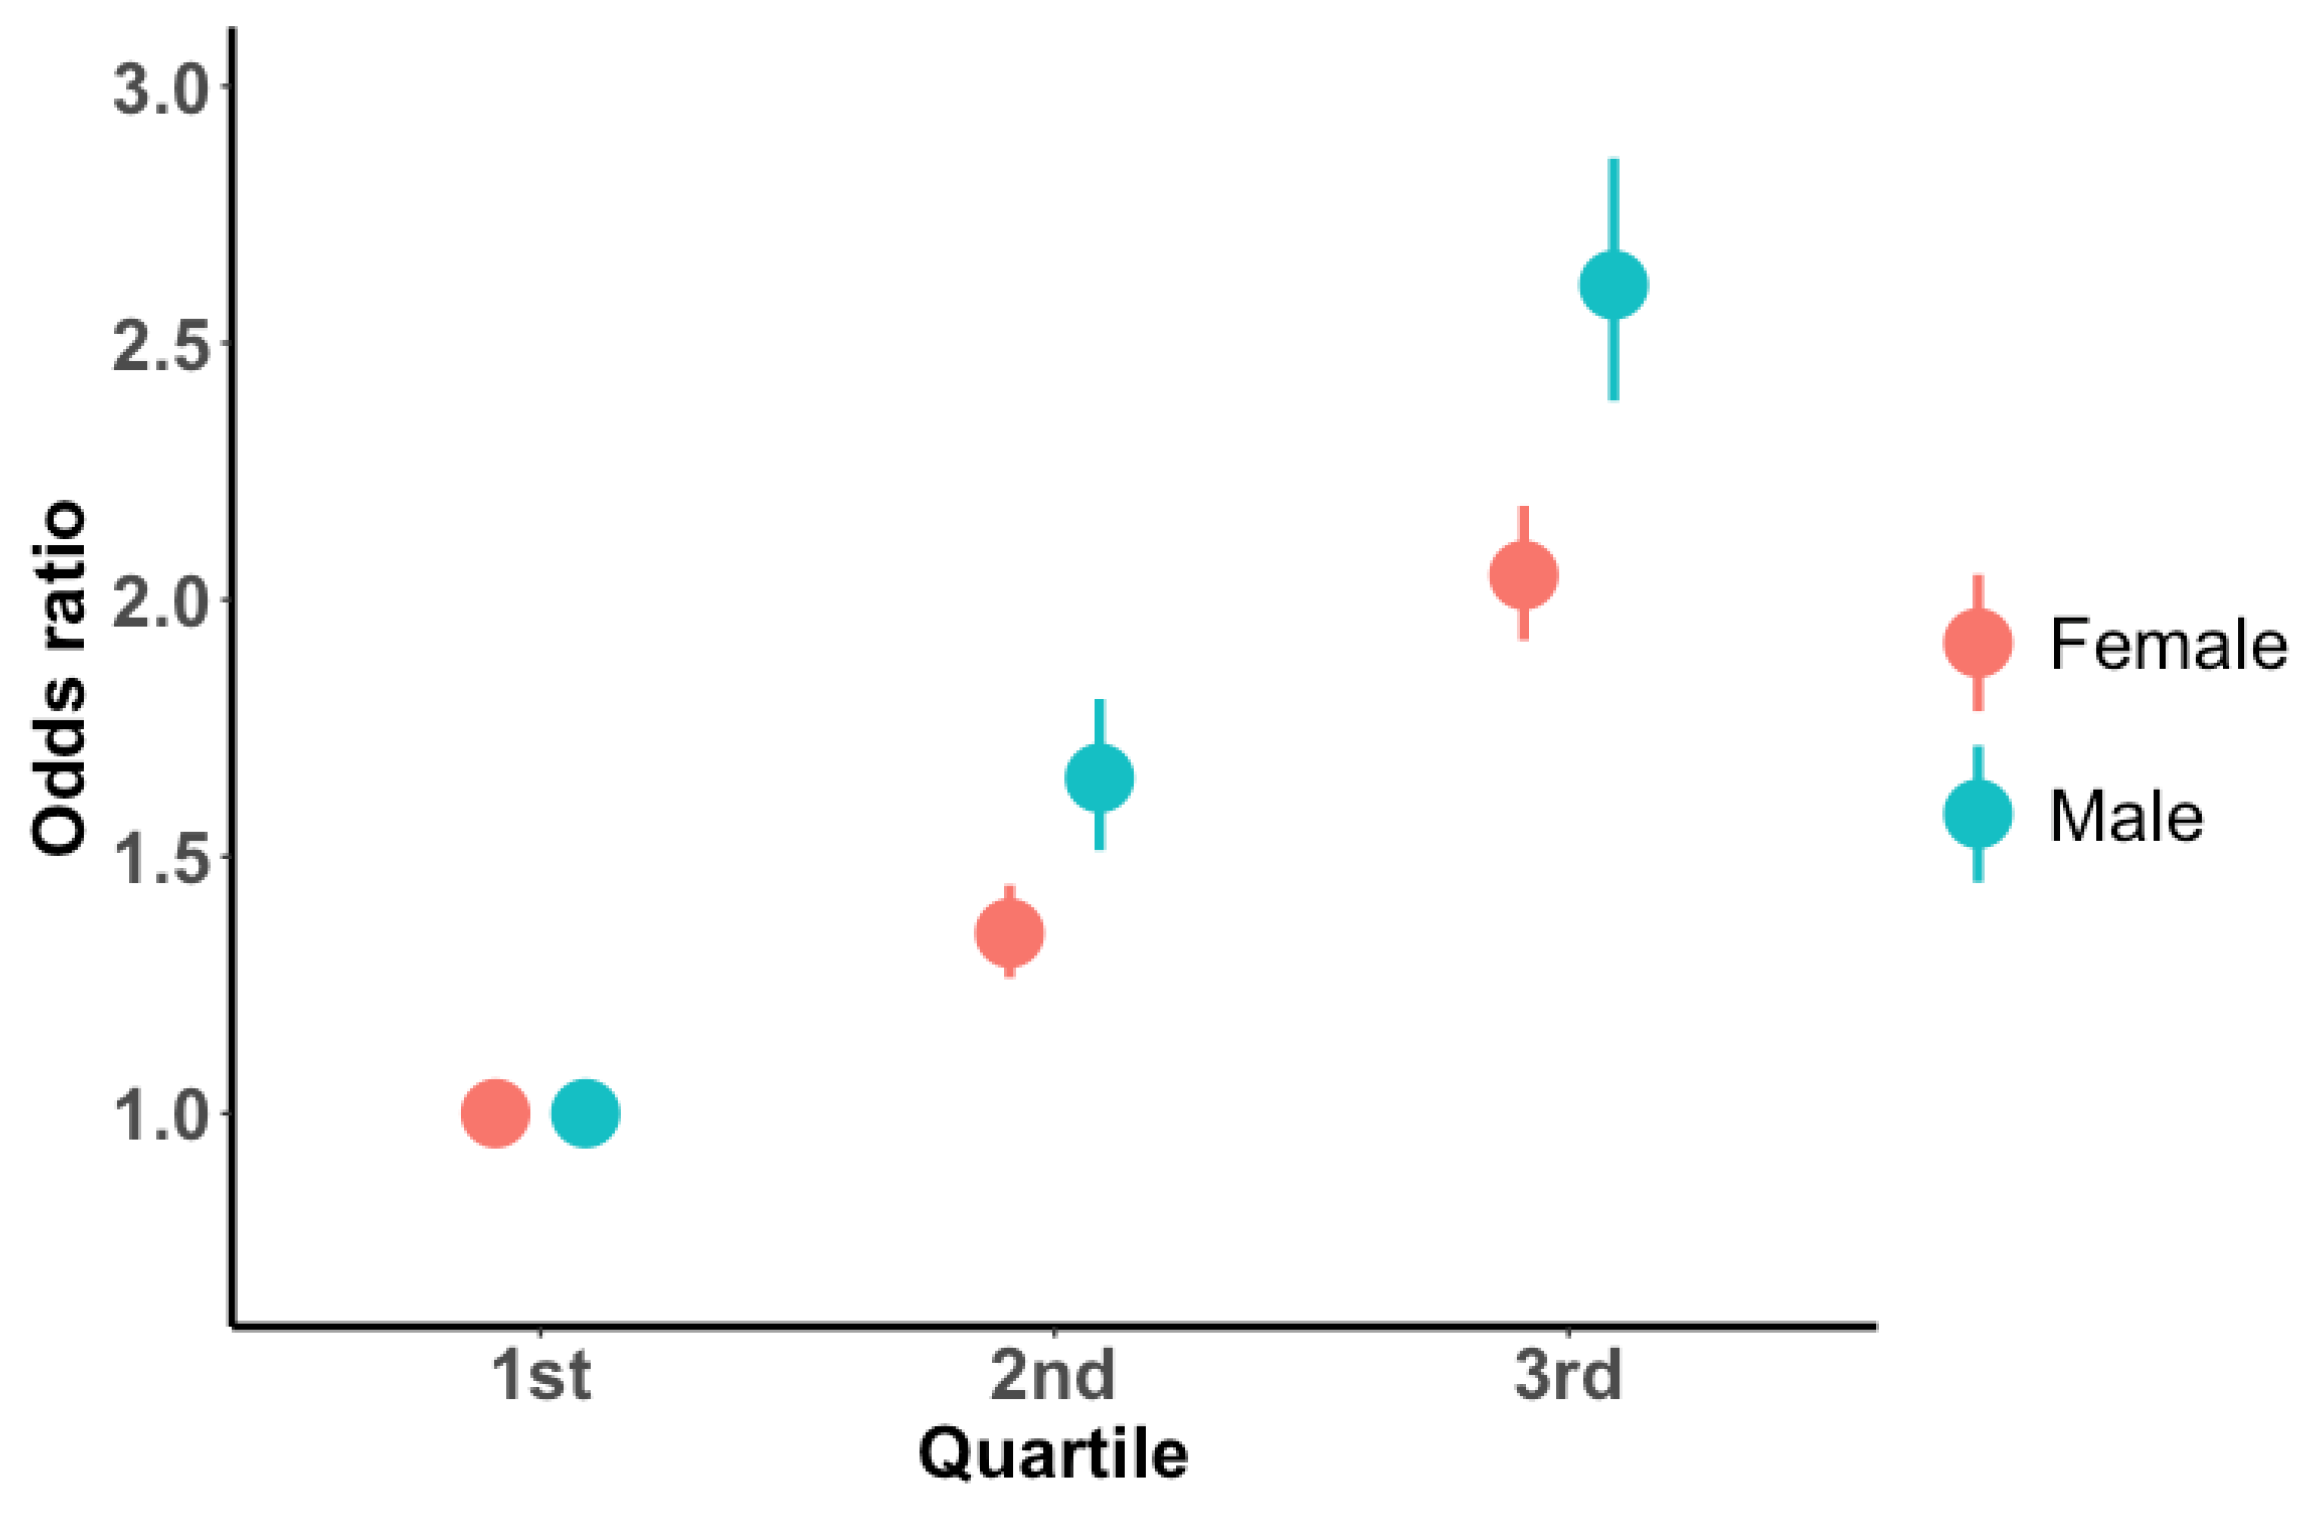
3.3. OR of Dyslipidemia Incidence by GRS Quartiles
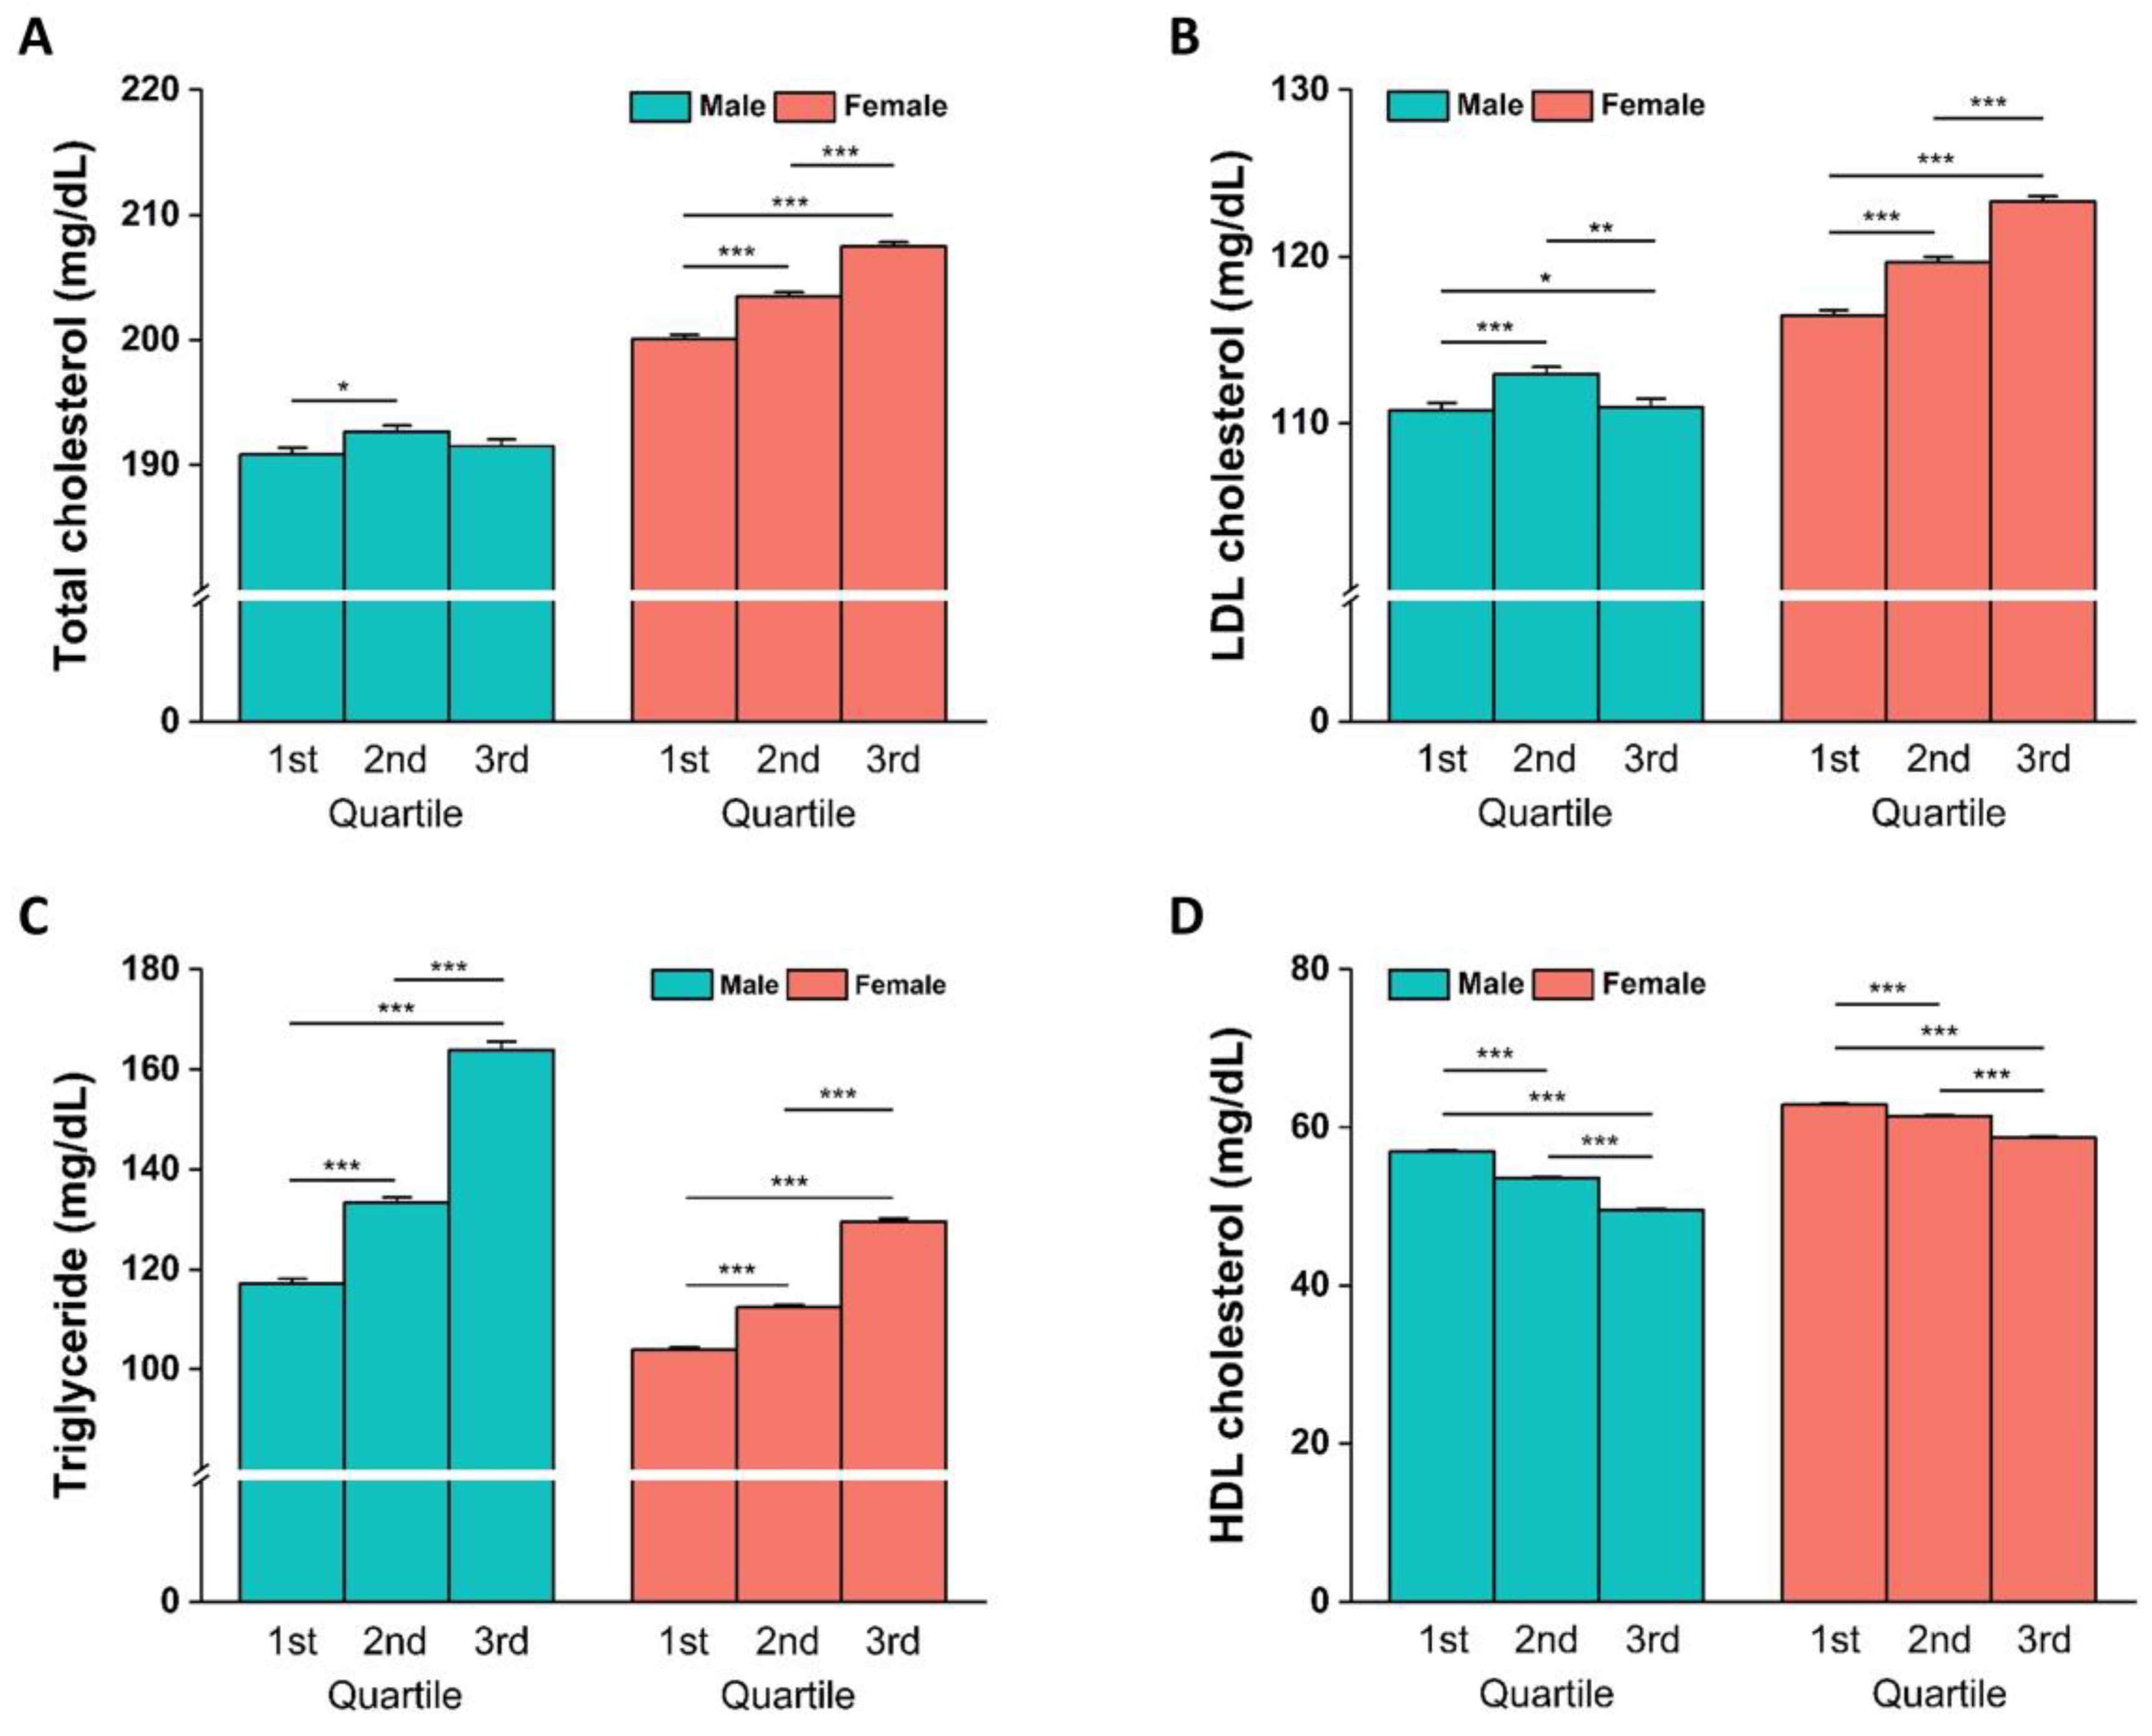
3.4. Blood Lipid Concentrations and Biochemical Parameters Stratified by GRS Quartiles
3.5. Interaction between GRS and Dietary Patterns
4. Discussion
5. Conclusions
Supplementary Materials
Author Contributions
Funding
Institutional Review Board Statement
Informed Consent Statement
Data Availability Statement
Acknowledgments
Conflicts of Interest
References
- Arnett, D.K.; Blumenthal, R.S.; Albert, M.A.; Buroker, A.B.; Goldberger, Z.D.; Hahn, E.J.; Himmelfarb, C.D.; Khera, A.; Lloyd-Jones, D.; McEvoy, J.W.; et al. 2019 ACC/AHA Guideline on the Primary Prevention of Cardiovascular Disease: Executive Summary: A Report of the American College of Cardiology/American Heart Association Task Force on Clinical Practice Guidelines. Circulation 2019, 140, e563–e595. [Google Scholar] [CrossRef] [PubMed]
- Gotto, A.M. Evolving concepts of dyslipidemia, atherosclerosis, and cardiovascular disease: The Louis F. Bishop Lecture. J. Am. Coll. Cardiol. 2005, 46, 1219–1224. [Google Scholar] [CrossRef]
- Tsao, C.W.; Aday, A.W.; Almarzooq, Z.I.; Alonso, A.; Beaton, A.Z.; Bittencourt, M.S.; Boehme, A.K.; Buxton, A.E.; Carson, A.P.; Commodore-Mensah, Y. Heart disease and stroke statistics—2022 update: A report from the American Heart Association. Circulation 2022, 145, e153–e639. [Google Scholar] [CrossRef] [PubMed]
- WHO Fact Sheet—CVDs. Available online: https://www.who.int/news-room/fact-sheets/detail/cardiovascular-diseases-(cvds) (accessed on 18 July 2023).
- Musunuru, K. Atherogenic Dyslipidemia: Cardiovascular Risk and Dietary Intervention. Lipids 2010, 45, 907–914. [Google Scholar] [CrossRef] [PubMed]
- EUGenMed; Cardiovascular Clinical Study Group; Regitz-Zagrosek, V.; Oertelt-Prigione, S.; Prescott, E.; Franconi, F.; Gerdts, E.; Foryst-Ludwig, A.; Maas, A.H.; Kautzky-Willer, A. Gender in cardiovascular diseases: Impact on clinical manifestations, management, and outcomes. Eur. Heart J. 2016, 37, 24–34. [Google Scholar]
- Ha, K.H.; Kwon, H.-S.; Kim, D.J. Epidemiologic characteristics of dyslipidemia in Korea. J. Lipid Atheroscler. 2015, 4, 93–99. [Google Scholar] [CrossRef]
- Palmisano, B.T.; Zhu, L.; Eckel, R.H.; Stafford, J.M. Sex differences in lipid and lipoprotein metabolism. Mol. Metab. 2018, 15, 45–55. [Google Scholar] [CrossRef]
- Vaura, F.; Palmu, J.; Aittokallio, J.; Kauko, A.; Niiranen, T. Genetic, molecular, and cellular determinants of sex-specific cardiovascular traits. Circ. Res. 2022, 130, 611–631. [Google Scholar] [CrossRef]
- Carroll, M.D.; Kit, B.K.; Lacher, D.A. Trends in Elevated Triglyceride in Adults: United States, 2001–2012; US Department of Health and Human Services, Centers for Disease Control and Prevention, National Center for Health Statistics: Atlanta, GA, USA, 2015. [Google Scholar]
- Couillard, C.; Bergeron, N.; Prud’homme, D.; Bergeron, J.; Tremblay, A.; Bouchard, C.; Mauriege, P.; Després, J.-P. Gender difference in postprandial lipemia: Importance of visceral adipose tissue accumulation. Arterioscler. Thromb. Vasc. Biol. 1999, 19, 2448–2455. [Google Scholar] [CrossRef]
- Lee, M.H.; Kim, H.C.; Ahn, S.V.; Hur, N.W.; Choi, D.P.; Park, C.G.; Suh, I. Prevalence of dyslipidemia among Korean adults: Korea national health and nutrition survey 1998–2005. Diabetes Metab. J. 2012, 36, 43–55. [Google Scholar] [CrossRef]
- Lee, G.; Jeon, H.K.; Yoo, H.Y. Sex-related differences in single nucleotide polymorphisms associated with dyslipidemia in a Korean population. Lipids Health Dis. 2022, 21, 124. [Google Scholar] [CrossRef] [PubMed]
- Kopin, L.; Lowenstein, C. Dyslipidemia. Ann. Intern. Med. 2017, 167, Itc81–Itc96. [Google Scholar] [CrossRef] [PubMed]
- Bruckert, E.; Rosenbaum, D. Lowering LDL-cholesterol through diet: Potential role in the statin era. Curr. Opin. Lipidol. 2011, 22, 43–48. [Google Scholar] [CrossRef] [PubMed]
- Haslam, D.E.; Peloso, G.M.; Herman, M.A.; Dupuis, J.; Lichtenstein, A.H.; Smith, C.E.; McKeown, N.M. Beverage consumption and longitudinal changes in lipoprotein concentrations and incident dyslipidemia in US adults: The Framingham heart study. J. Am. Heart Assoc. 2020, 9, e014083. [Google Scholar] [CrossRef] [PubMed]
- Lê, K.-A.; Ith, M.; Kreis, R.; Faeh, D.; Bortolotti, M.; Tran, C.; Boesch, C.; Tappy, L. Fructose overconsumption causes dyslipidemia and ectopic lipid deposition in healthy subjects with and without a family history of type 2 diabetes. Am. J. Clin. Nutr. 2009, 89, 1760–1765. [Google Scholar] [CrossRef]
- Lee, S.S. Awareness of meat consumption and alternative foods according to sustainable dietary habits. J. Korean Pract. Arts Educ. 2022, 35, 101–124. [Google Scholar]
- Chung, Y. Assessment of Coronavirus disease, the nose pollution filter, fermented spicy Kimchee, and peppery hot soup consumed in Korea. Air Qual. Atmos. Health 2021, 14, 785–791. [Google Scholar] [CrossRef]
- Oh, S.-W. Current status of nutrient intake in Korea: Focused on macronutrients. J. Korean Med. Assoc. 2022, 65, 801–809. [Google Scholar] [CrossRef]
- Park, C.Y.; Jo, G.; Lee, J.; Singh, G.M.; Lee, J.-T.; Shin, M.-J. Association between dietary sodium intake and disease burden and mortality in Koreans between 1998 and 2016: The Korea National Health and Nutrition Examination Survey. Nutr. Res. Pract. 2020, 14, 501–518. [Google Scholar] [CrossRef]
- Kim, M.J.; Park, S.; Yang, H.J.; Shin, P.-K.; Hur, H.J.; Park, S.-J.; Lee, K.-H.; Hong, M.; Kim, J.H.; Choi, S.-W. Alleviation of dyslipidemia via a traditional balanced Korean diet represented by a low glycemic and low cholesterol diet in obese women in a randomized controlled trial. Nutrients 2022, 14, 235. [Google Scholar] [CrossRef]
- Kim, S.-A.; Shin, S. Dietary patterns and the risk of dyslipidemia in Korean adults: A prospective cohort study based on the health Examinees (HEXA) study. J. Acad. Nutr. Diet. 2021, 121, 1242–1257.e1242. [Google Scholar] [CrossRef] [PubMed]
- Hunter, D.J. Gene–environment interactions in human diseases. Nat. Rev. Genet. 2005, 6, 287–298. [Google Scholar] [CrossRef] [PubMed]
- Lewis, C.M.; Vassos, E. Polygenic risk scores: From research tools to clinical instruments. Genome Med. 2020, 12, 1–11. [Google Scholar] [CrossRef] [PubMed]
- Dron, J.S.; Hegele, R.A. The evolution of genetic-based risk scores for lipids and cardiovascular disease. Curr. Opin. Lipidol. 2019, 30, 71–81. [Google Scholar] [CrossRef]
- Go, M.J.; Hwang, J.-Y.; Kim, D.-J.; Lee, H.-J.; Jang, H.B.; Park, K.-H.; Song, J.; Lee, J.-Y. Effect of genetic predisposition on blood lipid traits using cumulative risk assessment in the Korean population. Genom. Inform. 2012, 10, 99. [Google Scholar] [CrossRef]
- Qi, L. Gene-diet interactions in complex disease: Current findings and relevance for public health. Curr. Nutr. Rep. 2012, 1, 222–227. [Google Scholar] [CrossRef]
- Kim, Y.; Han, B.G. Cohort Profile: The Korean Genome and Epidemiology Study (KoGES) Consortium. Int. J. Epidemiol. 2017, 46, 1350. [Google Scholar] [CrossRef]
- Yuan, S.; Chen, J.; Li, X.; Fan, R.; Arsenault, B.; Gill, D.; Giovannucci, E.L.; Zheng, J.S.; Larsson, S.C. Lifestyle and metabolic factors for nonalcoholic fatty liver disease: Mendelian randomization study. Eur. J. Epidemiol. 2022, 37, 723–733. [Google Scholar] [CrossRef]
- Yang, H.; Chen, L.; Liu, K.; Li, C.; Li, H.; Xiong, K.; Li, Z.; Lu, C.; Chen, W.; Liu, Y. Mendelian randomization rules out the causal relationship between serum lipids and cholecystitis. BMC Med. Genom. 2021, 14, 224. [Google Scholar] [CrossRef]
- Tam, C.H.T.; Lim, C.K.P.; Luk, A.O.Y.; Ng, A.C.W.; Lee, H.M.; Jiang, G.; Lau, E.S.H.; Fan, B.; Wan, R.; Kong, A.P.S.; et al. Development of genome-wide polygenic risk scores for lipid traits and clinical applications for dyslipidemia, subclinical atherosclerosis, and diabetes cardiovascular complications among East Asians. Genome Med. 2021, 13, 29. [Google Scholar] [CrossRef]
- Rhee, E.J.; Kim, H.C.; Kim, J.H.; Lee, E.Y.; Kim, B.J.; Kim, E.M.; Song, Y.; Lim, J.H.; Kim, H.J.; Choi, S.; et al. 2018 Guidelines for the Management of Dyslipidemia in Korea. J. Lipid Atheroscler. 2019, 8, 78–131. [Google Scholar] [CrossRef] [PubMed]
- Moon, S.; Kim, Y.J.; Han, S.; Hwang, M.Y.; Shin, D.M.; Park, M.Y.; Lu, Y.; Yoon, K.; Jang, H.M.; Kim, Y.K.; et al. The Korea Biobank Array: Design and Identification of Coding Variants Associated with Blood Biochemical Traits. Sci. Rep. 2019, 9, 1382. [Google Scholar] [CrossRef] [PubMed]
- Watanabe, K.; Taskesen, E.; van Bochoven, A.; Posthuma, D. Functional mapping and annotation of genetic associations with FUMA. Nat. Commun. 2017, 8, 1826. [Google Scholar] [CrossRef] [PubMed]
- Ahn, Y.; Kwon, E.; Shim, J.E.; Park, M.K.; Joo, Y.; Kimm, K.; Park, C.; Kim, D.H. Validation and reproducibility of food frequency questionnaire for Korean genome epidemiologic study. Eur. J. Clin. Nutr. 2007, 61, 1435–1441. [Google Scholar] [CrossRef]
- Jee, D.; Kang, S.; Huang, S.; Park, S. Polygenetic-Risk Scores Related to Crystallin Metabolism Are Associated with Age-Related Cataract Formation and Interact with Hyperglycemia, Hypertension, Western-Style Diet, and Na Intake. Nutrients 2020, 12, 3534. [Google Scholar] [CrossRef]
- Beckstead, J.A.; Oda, M.N.; Martin, D.D.; Forte, T.M.; Bielicki, J.K.; Berger, T.; Luty, R.; Kay, C.M.; Ryan, R.O. Structure-function studies of human apolipoprotein A-V: A regulator of plasma lipid homeostasis. Biochemistry 2003, 42, 9416–9423. [Google Scholar] [CrossRef][Green Version]
- Flynn, E.; Tanigawa, Y.; Rodriguez, F.; Altman, R.B.; Sinnott-Armstrong, N.; Rivas, M.A. Sex-specific genetic effects across biomarkers. Eur. J. Hum. Genet. 2021, 29, 154–163. [Google Scholar] [CrossRef]
- Ripatti, P.; Rämö, J.T.; Mars, N.J.; Fu, Y.; Lin, J.; Söderlund, S.; Benner, C.; Surakka, I.; Kiiskinen, T.; Havulinna, A.S.; et al. Polygenic Hyperlipidemias and Coronary Artery Disease Risk. Circ. Genom. Precis. Med. 2020, 13, e002725. [Google Scholar] [CrossRef]
- Fu, B.X. Asian noodles: History, classification, raw materials, and processing. Food Res. Int. 2008, 41, 888–902. [Google Scholar] [CrossRef]
- Kim, C.H.; Kim, C.H.; Park, H.K.; Suh, K.I.; Lee, K.U. Effects of Hydrogen Peroxide on Insulin Secretion in Rat Pancreatic Islets. Korean Diabetes J. 2002, 26, 265–273. [Google Scholar]
- Mathis, B.J.; Tanaka, K.; Hiramatsu, Y. Factors of Obesity and Metabolically Healthy Obesity in Asia. Medicina 2022, 58, 1271. [Google Scholar] [CrossRef] [PubMed]
- LEE, J.-W.; LEE, Y.-H. Frequency of instant noodle (Ramyeon) intake and food value recognition, and their relationship to blood lipid levels of male adolescents in rural area. Korean J. Community Nutr. 2003, 8, 485–494. [Google Scholar]
- Huh, I.S.; Kim, H.; Jo, H.K.; Lim, C.S.; Kim, J.S.; Kim, S.J.; Kwon, O.; Oh, B.; Chang, N. Instant noodle consumption is associated with cardiometabolic risk factors among college students in Seoul. Nutr. Res. Pract. 2017, 11, 232–239. [Google Scholar] [CrossRef] [PubMed]
- Shin, H.J.; Cho, E.; Lee, H.J.; Fung, T.T.; Rimm, E.; Rosner, B.; Manson, J.E.; Wheelan, K.; Hu, F.B. Instant noodle intake and dietary patterns are associated with distinct cardiometabolic risk factors in Korea. J. Nutr. 2014, 144, 1247–1255. [Google Scholar] [CrossRef] [PubMed]
- Kim, J.; Kim, J.; Kang, Y. Noodle consumption is positively associated with incident hypertension in middle-aged and older Korean women. Nutr. Res. Pract. 2019, 13, 141–149. [Google Scholar] [CrossRef] [PubMed]
- Urgert, R.; Katan, M.B. The cholesterol-raising factor from coffee beans. Annu. Rev. Nutr. 1997, 17, 305–324. [Google Scholar] [CrossRef]
- Jee, S.H.; He, J.; Appel, L.J.; Whelton, P.K.; Suh, I.; Klag, M.J. Coffee consumption and serum lipids: A meta-analysis of randomized controlled clinical trials. Am. J. Epidemiol. 2001, 153, 353–362. [Google Scholar] [CrossRef]
- Cai, L.; Ma, D.; Zhang, Y.; Liu, Z.; Wang, P. The effect of coffee consumption on serum lipids: A meta-analysis of randomized controlled trials. Eur. J. Clin. Nutr. 2012, 66, 872–877. [Google Scholar] [CrossRef]
- Han, J.; Shon, J.; Hwang, J.-Y.; Park, Y.J. Effects of coffee intake on dyslipidemia risk according to genetic variants in the adora gene family among Korean adults. Nutrients 2020, 12, 493. [Google Scholar] [CrossRef]
- Matoba, N.; Akiyama, M.; Ishigaki, K.; Kanai, M.; Takahashi, A.; Momozawa, Y.; Ikegawa, S.; Ikeda, M.; Iwata, N.; Hirata, M.; et al. GWAS of 165,084 Japanese individuals identified nine loci associated with dietary habits. Nat. Hum. Behav. 2020, 4, 308–316. [Google Scholar] [CrossRef]
- Je, Y.; Jeong, S.; Park, T. Coffee consumption patterns in Korean adults: The Korean National Health and Nutrition Examination Survey (2001–2011). Asia Pac. J. Clin. Nutr. 2014, 23, 691–702. [Google Scholar] [PubMed]
- Kim, K.Y.; Yang, S.J.; Yun, J.-M. Consumption of instant coffee mix and risk of metabolic syndrome in subjects that visited a health examination center in Gwangju. J. Korean Soc. Food Sci. Nutr. 2017, 46, 630–638. [Google Scholar] [CrossRef]
- Kim, E.K.; Choe, J.S. Correlation of nutrient intake, obesity-related anthropometrics, and blood lipid status with instant coffee-mix intakes in Gangneung and Samcheok residents. Korean J. Community Nutr. 2013, 18, 134–141. [Google Scholar] [CrossRef]
- Lee, B.-E.; Lee, H.-J.; Cho, E.; Hwang, K.-T. Fatty acid compositions of fats in commercial coffee creamers and instant coffee mixes and their sensory characteristics. J. Korean Soc. Food Sci. Nutr. 2012, 41, 362–368. [Google Scholar] [CrossRef]
- Høstmark, A.T.; Tomten, S.E. Cola intake and serum lipids in the Oslo Health Study. Appl. Physiol. Nutr. Metab. 2009, 34, 901–906. [Google Scholar] [CrossRef]
- Airaodion, A.I.; Ogbuagu, U.; Ekenjoku, J.A.; Ogbuagu, E.O.; Airaodion, E.O. Hyperglycemic and hyperlipidemic effect of some coca-cola soft drinks in Wistar rats. Acta Sci. Nutr. Health 2019, 3, 114–120. [Google Scholar] [CrossRef]
- Seo, E.H.; Kim, H.; Kwon, O. Association between total sugar intake and metabolic syndrome in middle-aged Korean men and women. Nutrients 2019, 11, 2042. [Google Scholar] [CrossRef]
- Shin, S.; Kim, S.-A.; Ha, J.; Lim, K. Sugar-sweetened beverage consumption in relation to obesity and metabolic syndrome among Korean adults: A cross-sectional study from the 2012–2016 Korean National Health and Nutrition Examination Survey (KNHANES). Nutrients 2018, 10, 1467. [Google Scholar] [CrossRef]
- Narain, A.; Kwok, C.S.; Mamas, M.A. Soft drinks and sweetened beverages and the risk of cardiovascular disease and mortality: A systematic review and meta-analysis. Int. J. Clin. Pract. 2016, 70, 791–805. [Google Scholar] [CrossRef]
- Kuo, C.T.; Chen, D.R.; Chan, C.C.; Yeh, Y.P.; Chen, H.H. Sex differences in the association between sugar-sweetened beverages consumption and metabolic risks among the working-age population in Taiwan. Public Health Nutr. 2022, 26, 653–660. [Google Scholar] [CrossRef]
- Guo, G.; Wu, Y.; Liu, Y.; Wang, Z.; Xu, G.; Wang, X.; Liang, F.; Lai, W.; Xiao, X.; Zhu, Q.; et al. Exploring the causal effects of the gut microbiome on serum lipid levels: A two-sample Mendelian randomization analysis. Front. Microbiol. 2023, 14, 1113334. [Google Scholar] [CrossRef] [PubMed]
- Kawano, Y.; Edwards, M.; Huang, Y.; Bilate, A.M.; Araujo, L.P.; Tanoue, T.; Atarashi, K.; Ladinsky, M.S.; Reiner, S.L.; Wang, H.H.; et al. Microbiota imbalance induced by dietary sugar disrupts immune-mediated protection from metabolic syndrome. Cell 2022, 185, 3501–3519. [Google Scholar] [CrossRef] [PubMed]
- Erkkilä, A.; de Mello, V.D.; Risérus, U.; Laaksonen, D.E. Dietary fatty acids and cardiovascular disease: An epidemiological approach. Prog. Lipid Res. 2008, 47, 172–187. [Google Scholar] [CrossRef] [PubMed]
- Kim, S.A.; Shin, S. Red meat and processed meat consumption and the risk of dyslipidemia in Korean adults: A prospective cohort study based on the Health Examinees (HEXA) study. Nutr. Metab. Cardiovasc. Dis. 2021, 31, 1714–1727. [Google Scholar] [CrossRef] [PubMed]


| Characteristics | Male | Female | |||
|---|---|---|---|---|---|
| Dyslipidemia (n = 4990) | Non-Dyslipidemia (n = 10,879) | Dyslipidemia (n = 8474) | Non-Dyslipidemia (n = 23,219) | ||
| Age, years | 58.63 ± 0.122 | 60.29 ± 0.082 *** | 58.33 ± 0.079 | 57.32 ± 0.052 *** | |
| Smoking status | non-smoking | 1587 (32.6) | 4037 (38) | 7784 (92) | 21,349 (94.4) |
| past smoking | 1768 (36.4) | 4214 (40) | 221 (2.6) | 648 (2.9) | |
| current smoking | 1501 (31) | 2337 (22) *** | 272 (3.2) | 595 (2.6) ** | |
| Drinking status | non-drinking | 1284 (25.7) | 2698 (24.8) | 5807 (68.6) | 15,525 (66.9) |
| past drinking | 339 (6.8) | 793 (7.3) | 193 (2.3) | 497 (2.1) | |
| current drinking | 3364 (67.4) | 7384 (67.9) | 2470 (29.1) | 7185 (30.9) ** | |
| Waist circumference, cm | 87.32 ± 0.102 | 84.29 ± 0.073 *** | 80.39 ± 0.087 | 78.09 ± 0.054 *** | |
| Hip circumference, cm | 96.00 ± 0.076 | 94.49 ± 0.052 *** | 93.18 ± 0.062 | 92.58 ± 0.037 *** | |
| BMI, kg/m2 | 24.96 ± 0.037 | 23.88 ± 0.026 *** | 24.14 ± 0.032 | 23.33 ± 0.019 *** | |
| Total cholesterol, mg/dL | 208.61 ± 0.647 | 183.99 ± 0.276 *** | 235.95 ± 0.449 | 192.17 ± 0.177 *** | |
| Triglyceride, mg/dL | 210.58 ± 1.847 | 104.75 ± 0.366 *** | 164.85 ± 1.030 | 98.18 ± 0.240 *** | |
| LDL cholesterol, mg/dL | 124.90 ± 0.609 | 105.96 ± 0.260 *** | 148.69 ± 0.418 | 109.74 ± 0.166 *** | |
| HDL cholesterol, mg/dL | 45.12 ± 0.192 | 57.08 ± 0.121 *** | 55.61 ± 0.191 | 62.79 ± 0.091 *** | |
| GRS | 16.83 ± 0.042 | 15.65 ± 0.028 *** | 21.18 ± 0.037 | 20.07 ± 0.022 *** | |
| Parameters | Male | Female | |||
|---|---|---|---|---|---|
| Dyslipidemia (n = 4990) | Non-Dyslipidemia (n = 10,879) | Dyslipidemia (n = 8474) | Non-Dyslipidemia (n = 23,219) | ||
| Pork belly | Low Intake | 3619 (72.5) | 7976 (73.3) | 7117 (84.0) | 19,507 (84.0) |
| High intake | 1371 (27.5) | 2903 (26.7) | 1357 (16.0) | 3712 (16.0) | |
| Beef | Low Intake | 3291 (66.0) | 7192 (66.1) | 5712 (67.4) | 15,425 (66.4) |
| High Intake | 1699 (34.0) | 3687 (33.9) | 2762 (32.6) | 7794 (33.6) | |
| Intestines | Low Intake | 4330 (86.8) | 9592 (88.2) | 5869 (69.3) | 16,252 (70.0) |
| High Intake | 660 (13.2) | 1287 (11.8) * | 2605 (30.7) | 6967 (30.0) | |
| Sausages | Low Intake | 3489 (69.9) | 8001 (73.5) | 6654 (78.5) | 17,822 (76.7) |
| High Intake | 1501 (30.1) | 2878 (26.5) *** | 1820 (21.48) | 5397 (23.2) *** | |
| Chicken | Low Intake | 3192 (64.0) | 7223 (66.4) | 5895 (69.6) | 15,696 (67.6) |
| High Intake | 1798 (36.0) | 3656 (33.6) ** | 2579 (30.4) | 7523 (32.4) *** | |
| Soup | Low Intake | 3199 (64.1) | 7067 (64.9) | 5978 (70.5) | 16,193 (69.7) |
| High Intake | 1791 (35.9) | 3812 (35.0) | 2496 (29.5) | 7026 (30.3) | |
| Instant noodles | Low Intake | 3488 (69.9) | 8129 (74.7) | 6358 (75.0) | 17,296 (74.5) |
| High Intake | 1502 (30.1) | 2750 (25.2) *** | 2116 (25.0) | 5923 (25.5) | |
| Snacks | Low Intake | 3212 (64.4) | 7079 (65.1) | 7523 (88.8) | 20,420 (88.0) |
| High Intake | 1778 (35.6) | 3800 (34.9) | 951 (11.2) | 2799 (12.0) * | |
| Soft drinks | Low Intake | 3198 (64.1) | 7394 (68.0) | 6612 (78.0) | 18,452 (79.5) |
| High Intake | 1792 (35.9) | 3485 (32.0) *** | 1862 (22.0) | 4767 (20.5) ** | |
| Coffee | Low Intake | 3550 (71.1) | 8154 (75.0) | 7465 (88.0) | 20,478 (88.2) |
| High Intake | 1440 (28.9) | 2725 (25.0) *** | 1009 (11.9) | 2741 (11.8) | |
| A. Male Participants | ||||||||||
|---|---|---|---|---|---|---|---|---|---|---|
| CHR | SNP | POS | Mi | Ma | p-Value | Gene | MAF | OR | LB | UB |
| 2 | rs13306194 | 2:21252534_G/A | G | A | 1.95 × 10−08 | APOB | 0.1043 | 0.804 | 0.745 | 0.8676 |
| 2 | rs1260326 | 2:27730940_T/C | T | C | 1.10 × 10−08 | GCKR | 0.4269 | 0.8686 | 0.8277 | 0.9116 |
| 8 | rs117026536 | 8:19818773_G/T | G | T | 2.63 × 10⁻¹⁵ | LPL | 0.103 | 0.7364 | 0.6827 | 0.7945 |
| 8 | rs4922120 | 8:19878598_A/G | A | G | 5.31 × 10⁻¹⁰ | PTPRD | 0.3089 | 0.8495 | 0.8069 | 0.8944 |
| 8 | rs2954038 | 8:126507389_C/A | C | A | 9.73 × 10⁻¹² | CLCN7 | 0.316 | 1.198 | 1.138 | 1.263 |
| 11 | rs1787701 | 11:116563992_C/G | G | C | 9.29 × 10⁻¹⁴ | LGR5 | 0.2521 | 0.814 | 0.7711 | 0.8593 |
| 11 | rs151007118 | 11:116583864_G/T | T | G | 3.90 × 10⁻¹² | THADA | 0.1574 | 1.27 | 1.187 | 1.359 |
| 11 | rs11216118 | 11:116596395_C/T | T | C | 3.11 × 10⁻¹⁵ | Consequence none | 0.0783 | 1.459 | 1.329 | 1.603 |
| 11 | rs180363 | 11:116597889_T/C | T | C | 2.56 × 10⁻¹⁵ | Consequence none | 0.154 | 0.7712 | 0.7231 | 0.8224 |
| 11 | rs61905084 | 11:116610294_T/C | T | C | 3.92 × 10⁻²³ | CYP2D6 | 0.2248 | 0.7532 | 0.7121 | 0.7966 |
| 11 | rs113932726 | 11:116650638_C/T | T | C | 7.54 × 10−41 | HBB | 0.1074 | 1.784 | 1.639 | 1.942 |
| 11 | rs662799 | 11:116663707_G/A | G | A | 2.11 × 10−57 | APOA5 | 0.3543 | 1.523 | 1.447 | 1.604 |
| 11 | rs11603365 | 11:117006015_T/A | T | A | 1.05 × 10⁻¹¹ | Consequence none | 0.1713 | 0.8066 | 0.7581 | 0.8581 |
| 16 | rs56156922 | 16:56987369_T/C | T | C | 1.32 × 10−09 | CETP | 0.1523 | 0.8177 | 0.7662 | 0.8726 |
| 16 | rs7499892 | 16:57006590_C/T | T | C | 1.47 × 10−08 | CFHR1 | 0.1876 | 1.195 | 1.124 | 1.272 |
| 19 | rs429358 | 19:45411941_T/C | C | T | 3.81 × 10⁻¹² | APOE | 0.1126 | 1.321 | 1.221 | 1.43 |
| B. Female Participants | ||||||||||
| CHR | SNP | POS | Mi | Ma | p-Value | Gene | MAF | OR | LB | UB |
| 2 | rs13306194 | 2:21252534_G/A | G | A | 5.85 × 10−09 | APOB | 0.1072 | 0.8463 | 0.8001 | 0.8952 |
| 2 | rs1260326 | 2:27730940_T/C | T | C | 7.27 × 10⁻¹⁷ | GCKR | 0.4256 | 0.8588 | 0.8286 | 0.8900 |
| 8 | rs2954031 | 8:126491733_G/T | G | T | 9.25 × 10⁻¹¹ | TRIB1 | 0.4705 | 1.124 | 1.085 | 1.1650 |
| 9 | rs9411474 | 9:136125716_C/G | G | C | 1.04 × 10−08 | ABO | 0.2464 | 1.128 | 1.082 | 1.1750 |
| 9 | rs651007 | 9:136153875_C/T | T | C | 3.19 × 10−08 | TNFRSF11A | 0.2789 | 1.118 | 1.074 | 1.1620 |
| 11 | rs11216068 | 11:116505239_C/T | T | C | 4.60 × 10−09 | LOC107984372 | 0.1207 | 1.179 | 1.116 | 1.2460 |
| 11 | rs74357270 | 116523300_A/T | T | A | 8.30 × 10⁻¹¹ | LINC02702 | 0.296 | 1.138 | 1.094 | 1.1830 |
| 11 | rs75310100 | 116578361_G/T | G | T | 6.14 × 10⁻¹⁶ | HBG2 | 0.1975 | 0.8348 | 0.799 | 0.8721 |
| 11 | rs151007118 | 116583864_G/T | T | G | 1.11 × 10⁻¹⁵ | Consequence none | 0.16 | 1.223 | 1.164 | 1.2840 |
| 11 | rs11216118 | 116596395_C/T | T | C | 2.07 × 10⁻¹⁸ | Consequence none | 0.07777 | 1.356 | 1.266 | 1.4510 |
| 11 | rs180346 | 116612659_A/C | A | C | 7.95 × 10⁻²⁹ | IL18RAP | 0.1936 | 0.7797 | 0.7463 | 0.8146 |
| 11 | rs1942478 | 116651463_T/G | T | G | 4.15 × 10⁻¹⁸ | ZPR1 | 0.1927 | 0.8228 | 0.7873 | 0.8598 |
| 11 | rs2075291 | 116661392_C/A | A | C | 3.38 × 10−49 | APOA5 | 0.1075 | 1.575 | 1.483 | 1.6730 |
| 11 | rs651821 | 11:116662579_C/T | C | T | 1.10 × 10−77 | APOA5 | 0.3584 | 1.432 | 1.379 | 1.4870 |
| 11 | rs11216183 | 116781545_C/A | C | A | 2.55 × 10⁻¹⁰ | SIK3 | 0.08296 | 0.8173 | 0.7677 | 0.8700 |
| 11 | rs143791312 | 116895355_C/T | C | T | 1.15 × 10−09 | SIK3 | 0.07257 | 0.8131 | 0.7607 | 0.8691 |
| 19 | rs406315 | 19:45384116_G/A | A | G | 3.92 × 10⁻¹⁵ | NECTIN2 | 0.2565 | 0.8832 | 0.8485 | 0.9192 |
| 19 | rs2278426 | 19:11350488_C/T | C | T | 1.16 × 10−09 | ANGPTL8 | 0.06933 | 0.7636 | 0.7139 | 0.8167 |
| 19 | rs10119 | 19:45406673_G/A | A | G | 5.01 × 10⁻¹⁹ | TOMM40 | 0.1193 | 1.289 | 1.219 | 1.3640 |
| 19 | rs1065853 | 19:45413233_G/T | G | T | 1.11 × 10⁻²² | APOE | 0.04856 | 0.6736 | 0.6224 | 0.7290 |
| Male | Female | |||||
|---|---|---|---|---|---|---|
| rs662799 A > G (APOA5) | rs651821 T > C (APOA5) | |||||
| carriers | A:A | A:G | G:G | T:T | T:C | C:C |
| (n = 7937) | (n = 6553) | (n = 1379) | (n = 15,467) | (n = 13,322) | (n = 2904) | |
| OR | 1 | 1.506 | 2.472 | 1 | 1.362 | 2.212 |
| 95% CI | 1.400–1.619 | 2.193–2.787 | 1.290–1.437 | 2.034–2.407 | ||
| p-value | <0.001 | <0.001 | <0.001 | <0.001 | ||
| Male | Female | |||||
|---|---|---|---|---|---|---|
| 1st Quartile (n = 4844) | 2nd Quartile (n = 6029) | 3rd Quartile (n = 4996) | 1st Quartile (n = 9602) | 2nd Quartile (n = 10,671) | 3rd Quartile (n = 11,420) | |
| HbA1c, % | 5.72 ± 0.012 | 5.70 ± 0.010 | 5.68 ± 0.011 | 5.62 ± 0.007 | 5.62 ± 0.006 | 5.63 ± 0.006 |
| λ-GTP, IU/L | 40.533 ± 0.7607 | 42.853 ± 0.7167 | 45.166 ± 0.9849 *** | 21.602 ± 0.1926 | 22.561 ± 0.2266 * | 23.249 ± 0.2442 *** |
| Albumin, g/dL | 4.664 ± 0.0036 | 4.669 ± 0.0031 | 4.669 ± 0.0034 | 4.601 ± 0.0023 | 4.610 ± 0.022 * | 4.610 ± 0.0021 * |
| AST, IU/L | 25.83 ± 0.206 | 25.92 ± 0.148 | 26.52 ± 0.260 | 23.96 ± 0.099 | 23.91 ± 0.091 | 24.28 ± 0.121 + |
| ALP, IU/L | 65.71 ± 0.271 | 66.22 ± 0.291 | 66.80 ± 0.260 * | 68.37 ± 0.200 | 67.81 ± 0.196 | 67.49 ± 0.196 ** |
| ALT, IU/L | 24.95 ± 0.272 | 24.82 ± 0.200 | 25.07 ± 0.222 | 20.62 ± 0.135 | 20.41 ± 0.125 | 20.76 ± 0.152 |
| Creatinine, mg/dL | 0.968 ± 0.0044 | 0.965 ± 0.0038 | 0.970 ± 0.0050 | 0.704 ± 0.0016 | 0.708 ± 0.0017 | 0.701 ± 0.0017 + |
| Blood Calcium, mg/dL | 9.498 ± 0.0053 | 9.508 ± 0.0046 | 9.521 ± 0.0050 ** | 9.496 ± 0.0038 | 9.499 ± 0.0037 | 9.503 ± 0.0035 |
| A. Meats | |||||||||
|---|---|---|---|---|---|---|---|---|---|
| Groups | Male | Female | |||||||
| 1st Quartile | 2nd Quartile | 3rd Quartile | p-Value | 1st Quartile | 2nd Quartile | 3rd Quartile | p-Value | ||
| Pork belly | Low Intake | 1 | 1.635 (1.473–1.816) | 2.580 (2.321–2.868) | 0.907 | 1 | 1.352 (1.257–1.454) | 2.014 (1.879–2.159) | 0.140 |
| High Intake | 1 | 1.698 (1.433–2.012) | 2.699 (2.267–3.213) | 1 | 1.359 (1.149–1.608) | 2.250 (1.916–2.642) | |||
| Beef | Low Intake | 1 | 1.642 (1.471–1.832) | 2.621 (2.345–2.930) | 0.662 | 1 | 1.317 (1.214–1.429) | 2.019 (1.869–2.182) | 0.703 |
| High Intake | 1 | 1.674 (1.436–1.951) | 2.601 (2.228–3.036) | 1 | 1.429 (1.271–1.606) | 2.117 (1.891–2.369) | |||
| Intestines | Low Intake | 1 | 1.712 (1.556–1.884) | 2.702 (2.451–2.979) | 0.370 | 1 | 1.333 (1.230–1.444) | 2.011 (1.863–2.171) | 0.904 |
| High Intake | 1 | 1.317 (1.033–1.678) | 2.118 (1.660–2.702) | 1 | 1.399 (1.239–1.580) | 2.137 (1.904–2.399) | |||
| Sausages | Low Intake | 1 | 1.668 (1.500–1.854) | 2.706 (2.430–3.013) | 0.563 | 1 | 1.370 (1.270–1.478) | 2.144 (1.966–2.272) | 0.213 |
| High Intake | 1 | 1.619 (1.375–1.908) | 2.398 (2.027–2.836) | 1 | 1.301 (1.128–1.499) | 1.851 (1.616–2.120) | |||
| Chicken | Low Intake | 1 | 1.718 (1.536–1.921) | 2.804 (2.504–3.140) | 0.504 | 1 | 1.352 (1.248–1.465) | 2.035 (1.885–2.197) | 0.396 |
| High Intake | 1 | 1.545 (1.333–1.791) | 2.301 (1.979–2.675) | 1 | 1.351 (1.198–1.525) | 2.076 (1.850–2.330) | |||
| B. Soup, instant noodles, snacks, and drinks | |||||||||
| Groups | Male | Female | |||||||
| 1st Quartile | 2nd Quartile | 3rd Quartile | p-Value | 1st Quartile | 2nd Quartile | 3rd Quartile | p-Value | ||
| Soup | Low Intake | 1 | 1.687 (1.508–1.887) | 2.770 (2.473–3.102) | 0.350 | 1 | 1.311 (1.210–1.419) | 2.016 (1.868–2.175) | 0.738 |
| High Intake | 1 | 1.599 (1.380–1.852) | 2.356 (2.027–2.739) | 1 | 1.452 (1.284–1.641) | 2.125 (1.889–2.390) | |||
| Instant noodles | Low Intake | 1 | 1.672 (1.504–1.859) | 2.633 (2.366–2.931) | 0.028 | 1 | 1.384 (1.281–1.494) | 2.017 (1.873–2.171) | 0.087 |
| High Intake | 1 | 1.601 (1.357–1.888) | 2.569 (2.168–3.044) | 1 | 1.258 (1.098–1.440) | 2.154 (1.895–2.449) | |||
| Snacks | Low Intake | 1 | 1.742 (1.558–1.948) | 2.820 (2.518–3.159) | 0.085 | 1 | 1.347 (1.254–1.446) | 2.079 (1.943–2.225) | 0.210 |
| High Intake | 1 | 1.504 (1.297–1.744) | 2.279 (1.961–2.648) | 1 | 1.414 (1.164–1.716) | 1.835 (1.519–217) | |||
| Soft drinks | Low Intake | 1 | 1.739 (1.559–1.940) | 2.576 (2.303–2.881) | 0.030 | 1 | 1.388 (1.287–1.498) | 2.117 (1.970–2.276) | 0.196 |
| High Intake | 1 | 1.494 (1.282–1.742) | 2.662 (2.282–3.106) | 1 | 1.225 (1.063–1.412) | 1.818 (1.586–2.084) | |||
| Coffee | Low Intake | 1 | 1.691 (1.522–1.879) | 2.636 (2.368–2.933) | 0.188 | 1 | 1.338 (1.246–1.437) | 2.002 (1.870–2.142) | 0.038 |
| High Intake | 1 | 1.561 (1.320–1.846) | 2.560 (2.159–3.034) | 1 | 1.463 (1.203–1.778) | 2.489 (2.063–3.003) | |||
Disclaimer/Publisher’s Note: The statements, opinions and data contained in all publications are solely those of the individual author(s) and contributor(s) and not of MDPI and/or the editor(s). MDPI and/or the editor(s) disclaim responsibility for any injury to people or property resulting from any ideas, methods, instructions or products referred to in the content. |
© 2023 by the authors. Licensee MDPI, Basel, Switzerland. This article is an open access article distributed under the terms and conditions of the Creative Commons Attribution (CC BY) license (https://creativecommons.org/licenses/by/4.0/).
Share and Cite
Kim, S.; Jeon, H.K.; Lee, G.; Kim, Y.; Yoo, H.Y. Associations between the Genetic Heritability of Dyslipidemia and Dietary Patterns in Korean Adults Based on Sex Differences. Nutrients 2023, 15, 4385. https://doi.org/10.3390/nu15204385
Kim S, Jeon HK, Lee G, Kim Y, Yoo HY. Associations between the Genetic Heritability of Dyslipidemia and Dietary Patterns in Korean Adults Based on Sex Differences. Nutrients. 2023; 15(20):4385. https://doi.org/10.3390/nu15204385
Chicago/Turabian StyleKim, Sei, Hye Kyung Jeon, Gyeonghee Lee, Youbin Kim, and Hae Young Yoo. 2023. "Associations between the Genetic Heritability of Dyslipidemia and Dietary Patterns in Korean Adults Based on Sex Differences" Nutrients 15, no. 20: 4385. https://doi.org/10.3390/nu15204385
APA StyleKim, S., Jeon, H. K., Lee, G., Kim, Y., & Yoo, H. Y. (2023). Associations between the Genetic Heritability of Dyslipidemia and Dietary Patterns in Korean Adults Based on Sex Differences. Nutrients, 15(20), 4385. https://doi.org/10.3390/nu15204385