

A High Protein Diet Is Associated with Improved Glycemic Control Following Exercise among Adolescents with Type 1 Diabetes
 , ,
, ,
Abstract
:1. Introduction
2. Materials and Methods
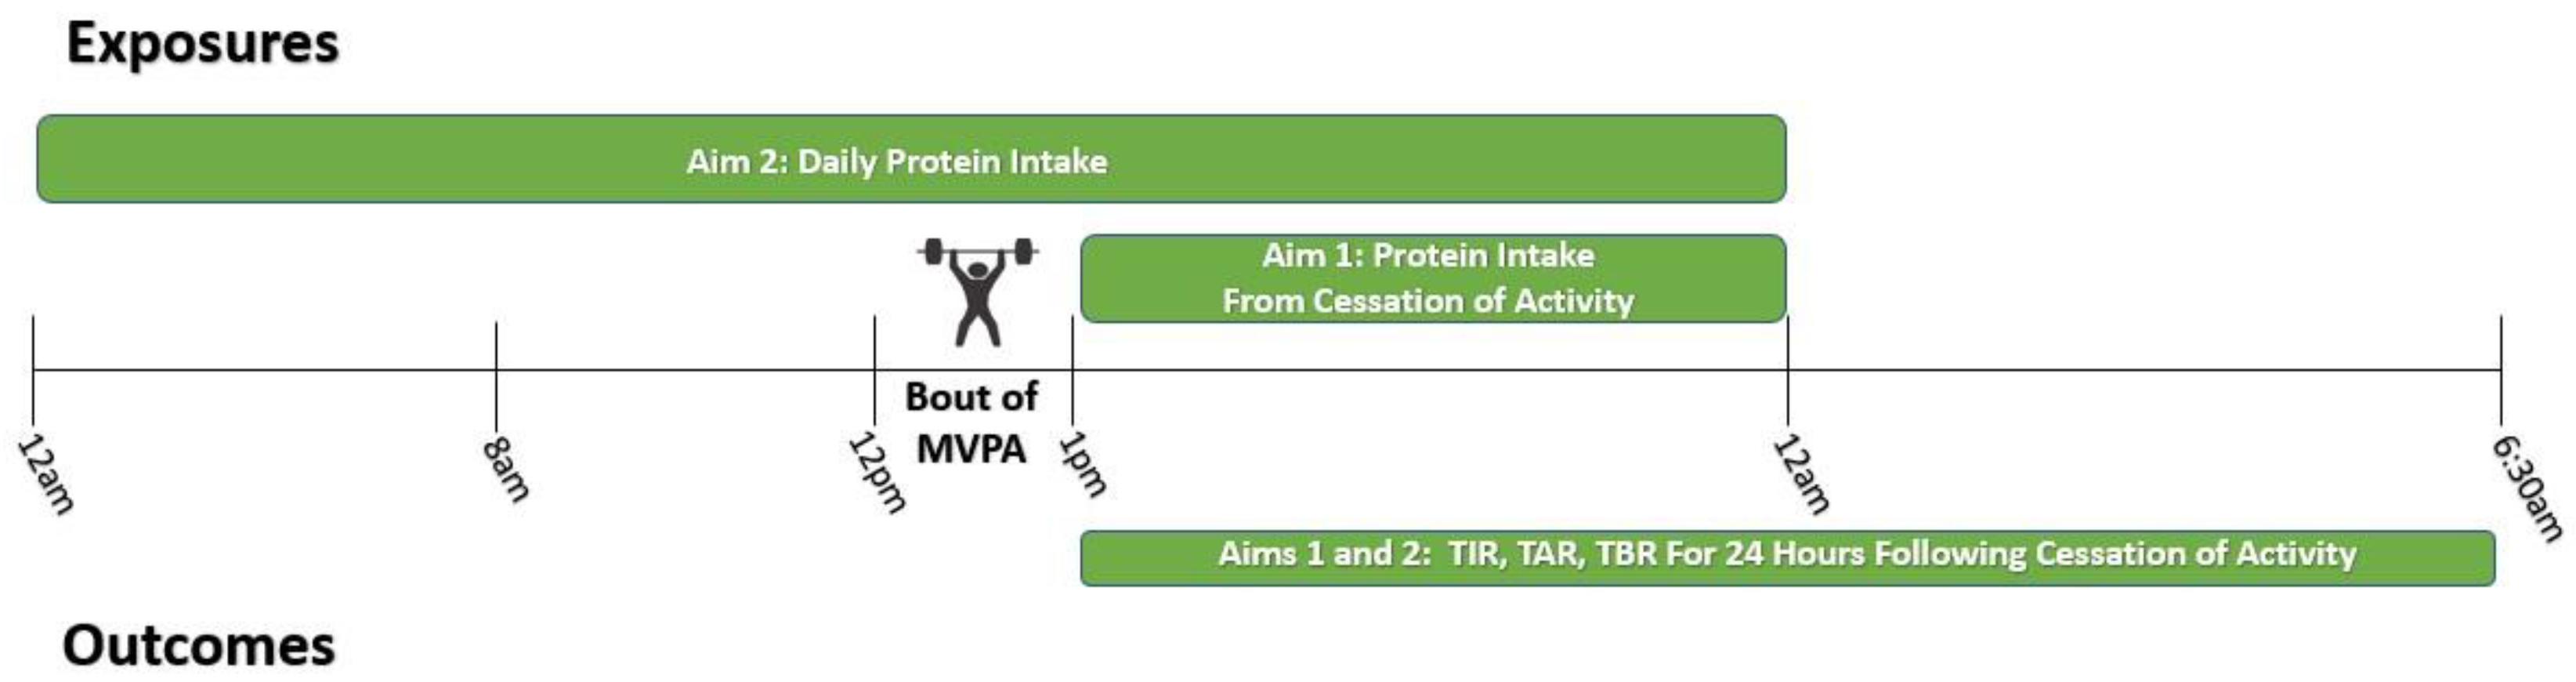
2.1. Study Design
2.2. Participants
2.3. Demographics and Health History
2.4. Continuous Glucose Monitoring (CGM)
2.5. Dietary Measures
2.6. Physical Activity Measures
2.7. Anthropometrics and Body Composition
2.8. Statistical Analysis
2.8.1. Model Selection
2.8.2. Aim 1 Analyses—Post-Exercise Protein Intake and Glycemia Following MVPA
2.8.3. Aim 2 Analyses—Overall Daily Protein Intake and Glycemia Following MVPA
2.9. Exploration of Interaction Effects
3. Results
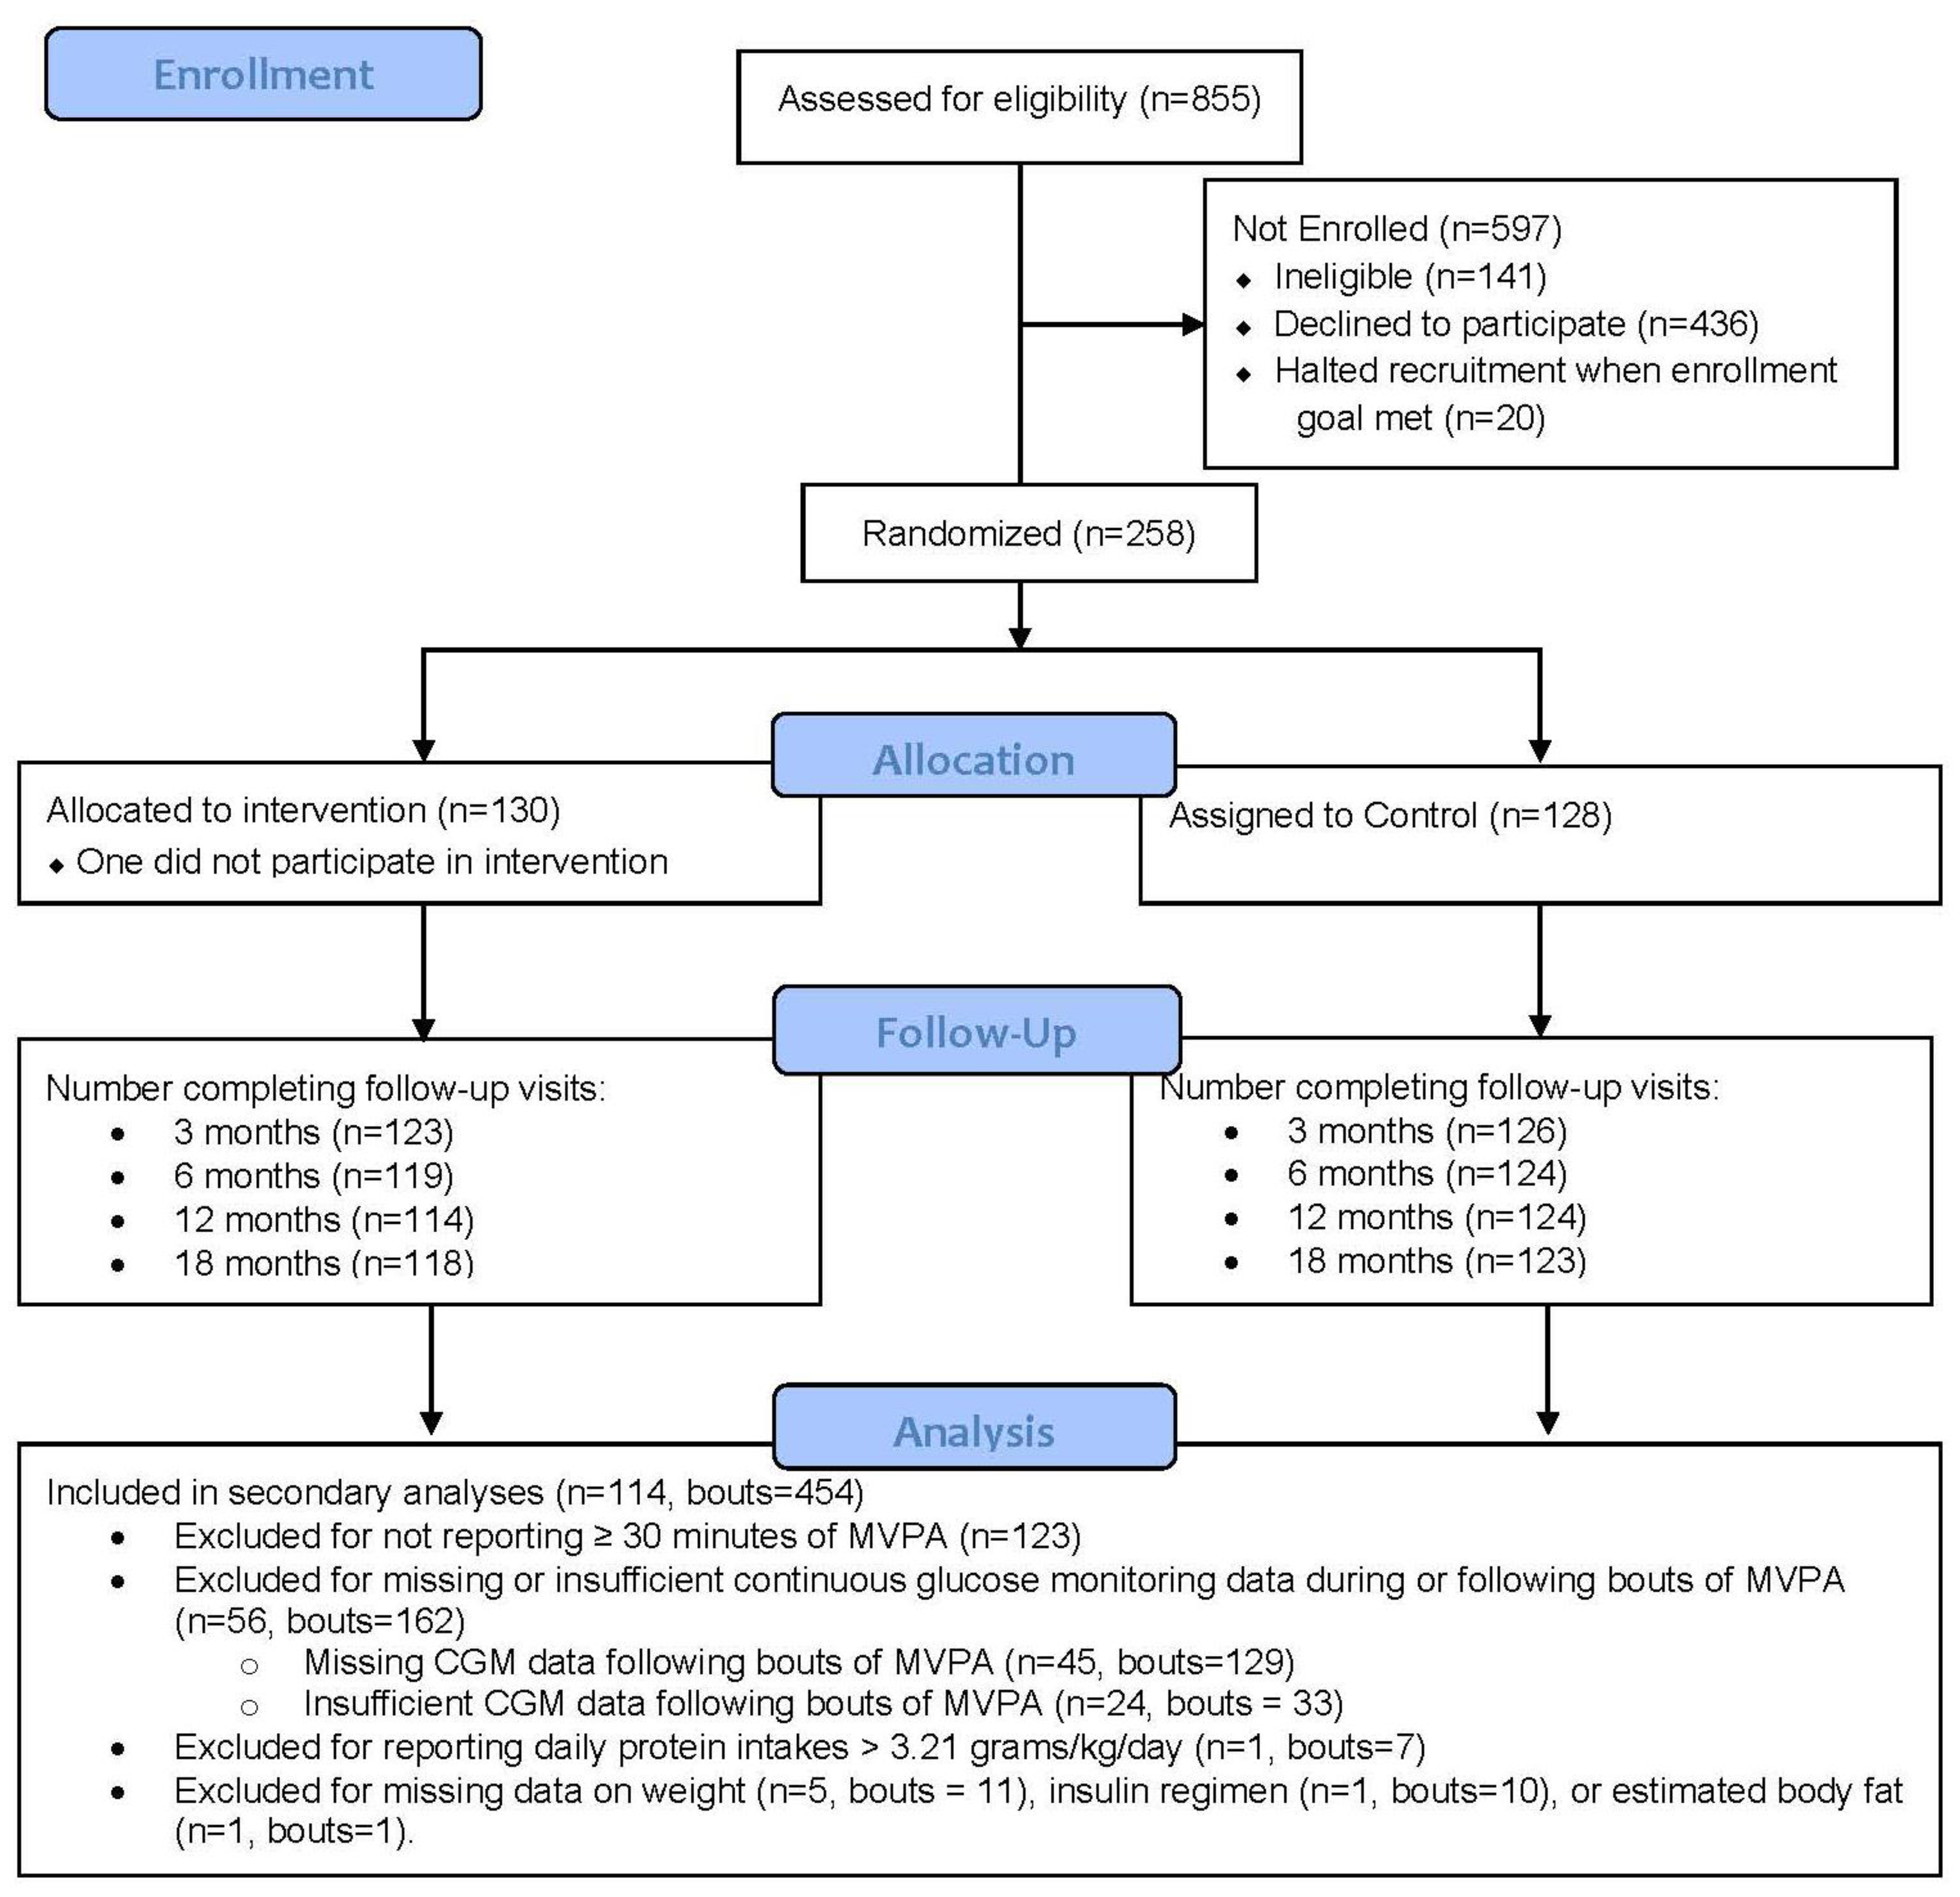
3.1. Final Sample Size
3.2. Baseline Characteristics
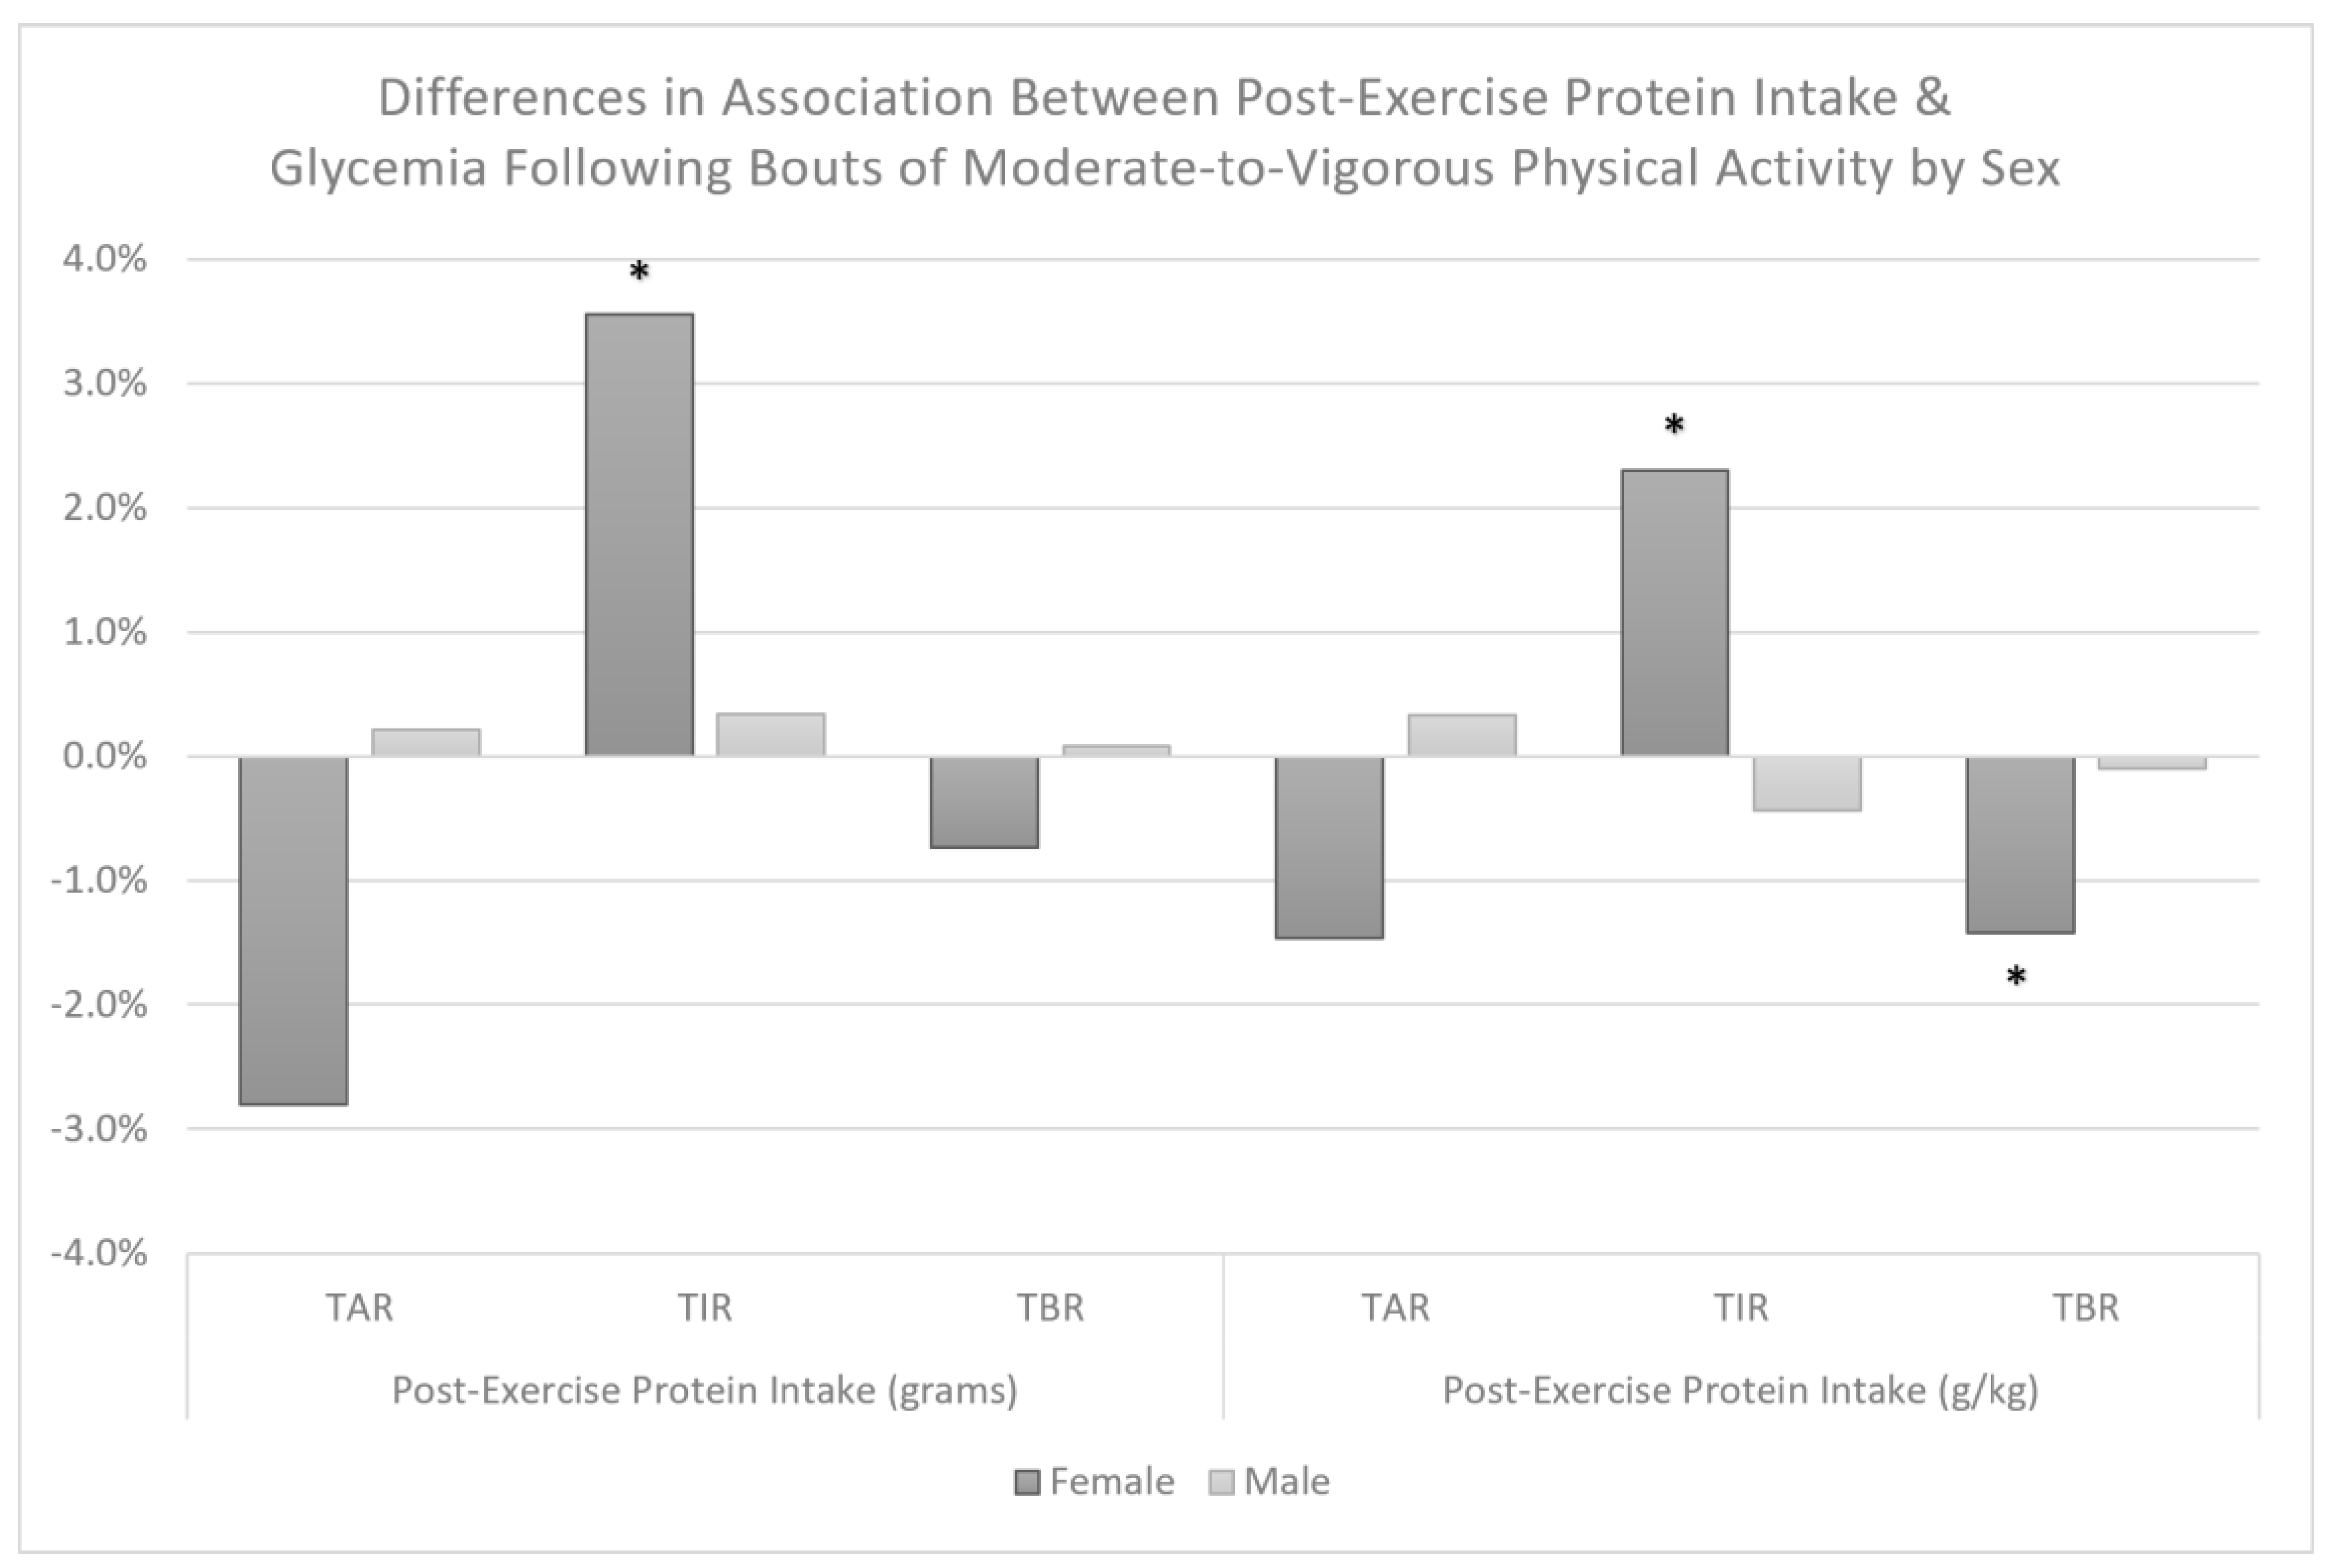
3.3. Aim 1 Results
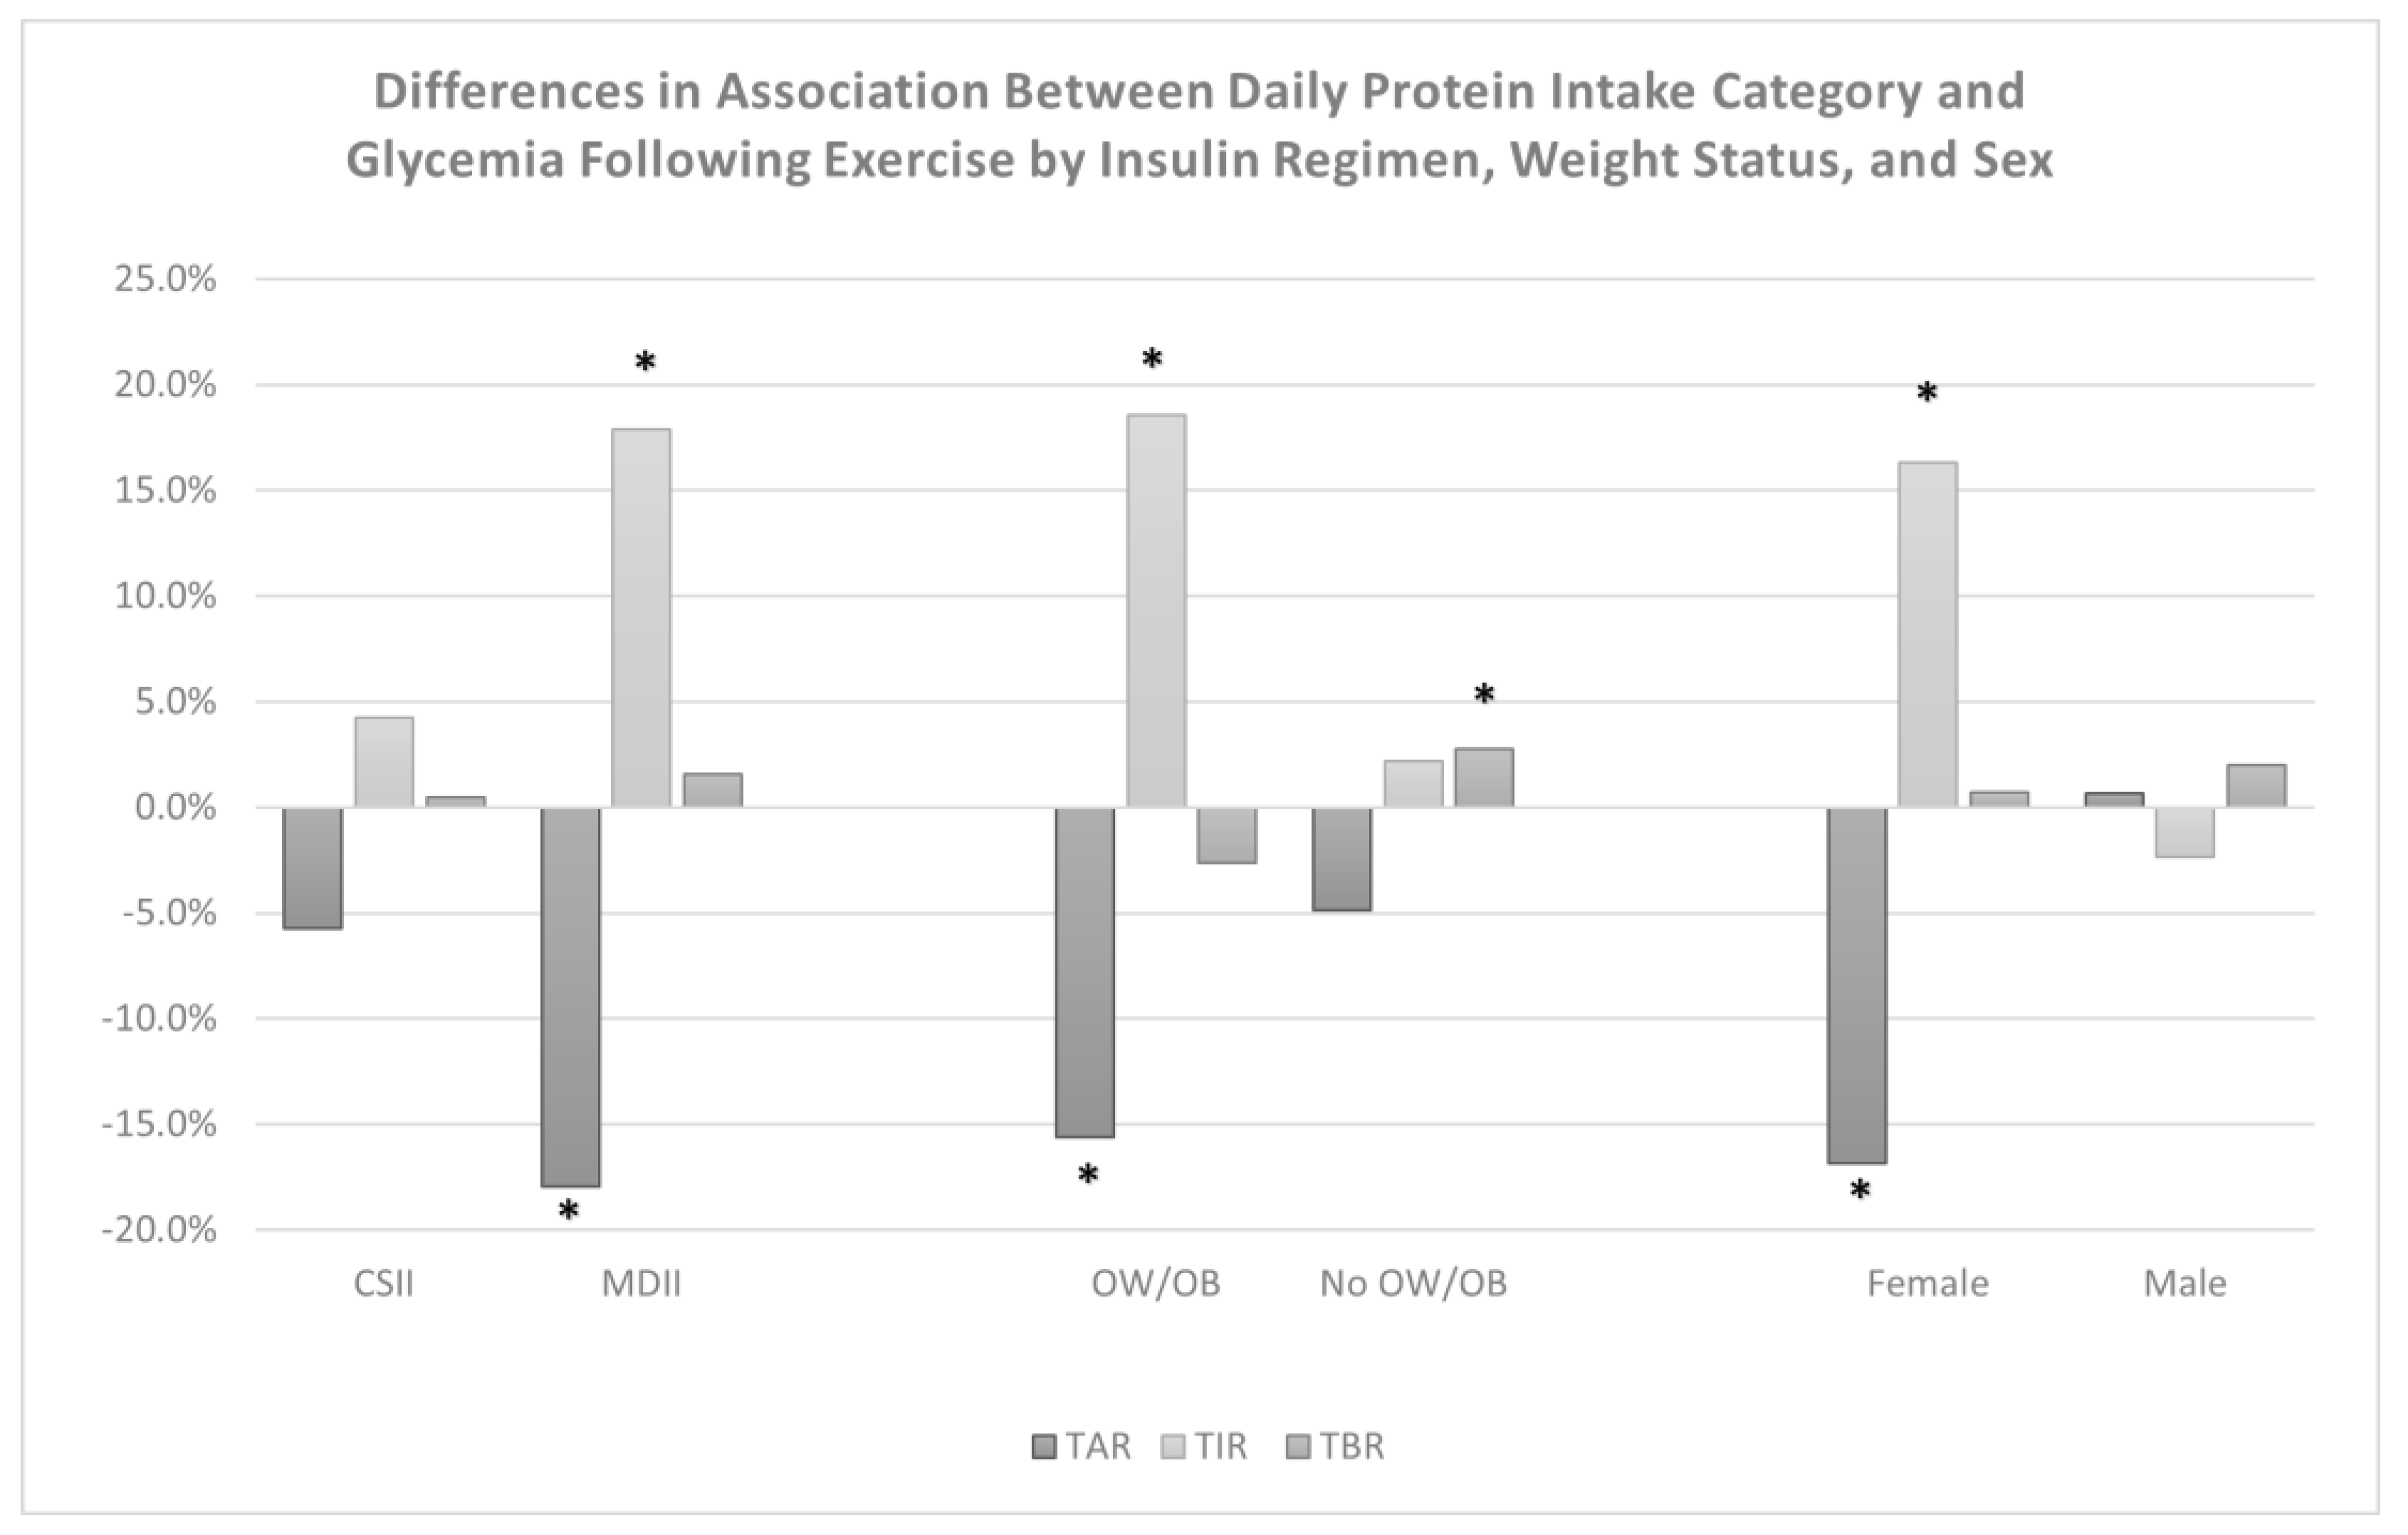
3.4. Aim 2 Results
4. Discussion
4.1. Significance for Clinical Practice
4.2. Challenges and Opportunities
4.3. Future Research Directions
Author Contributions
Funding
Institutional Review Board Statement
Informed Consent Statement
Data Availability Statement
Acknowledgments
Conflicts of Interest
References
- Mobasseri, M.; Shirmohammadi, M.; Amiri, T.; Vahed, N.; Hosseini Fard, H.; Ghojazadeh, M. Prevalence and incidence of type 1 diabetes in the world: A systematic review and meta-analysis. Health Promot. Perspect 2020, 10, 98–115. [Google Scholar] [CrossRef]
- Lawrence, J.M.; Divers, J.; Isom, S.; Saydah, S.; Imperatore, G.; Pihoker, C.; Marcovina, S.M.; Mayer-Davis, E.J.; Hamman, R.F.; Dolan, L.; et al. Trends in Prevalence of Type 1 and Type 2 Diabetes in Children and Adolescents in the US, 2001–2017. JAMA 2021, 326, 717–727. [Google Scholar] [CrossRef]
- De Ferranti, S.D.; De Boer, I.H.; Fonseca, V.; Fox, C.S.; Golden, S.H.; Lavie, C.J.; Magge, S.N.; Marx, N.; McGuire, D.K.; Orchard, T.J. Type 1 diabetes mellitus and cardiovascular disease: A scientific statement from the American Heart Association and American Diabetes Association. Circulation 2014, 130, 1110–1130. [Google Scholar] [CrossRef] [PubMed]
- Nathan, D.M.; Cleary, P.A.; Backlund, J.-Y.C.; Genuth, S.M.; Lachin, J.M.; Orchard, T.J.; Raskin, P.; Zinman, B.; Diabetes Control and Complications Trial/Epidemiology of Diabetes Interventions and Complications (DCCT/EDIC) Study Research Group. Intensive diabetes treatment and cardiovascular disease in patients with type 1 diabetes. N. Engl. J. Med. 2005, 353, 2643–2653. [Google Scholar] [CrossRef]
- Purnell, J.Q.; Braffett, B.H.; Zinman, B.; Gubitosi-Klug, R.A.; Sivitz, W.; Bantle, J.P.; Ziegler, G.; Cleary, P.A.; Brunzell, J.D. Impact of Excessive Weight Gain on Cardiovascular Outcomes in Type 1 Diabetes: Results From the Diabetes Control and Complications Trial/Epidemiology of Diabetes Interventions and Complications (DCCT/EDIC) Study. Diabetes Care 2017, 40, 1756–1762. [Google Scholar] [CrossRef] [PubMed]
- Colberg, S.R.; Sigal, R.J.; Yardley, J.E.; Riddell, M.C.; Dunstan, D.W.; Dempsey, P.C.; Horton, E.S.; Castorino, K.; Tate, D.F. Physical Activity/Exercise and Diabetes: A Position Statement of the American Diabetes Association. Diabetes Care 2016, 39, 2065–2079. [Google Scholar] [CrossRef] [PubMed]
- MacMillan, F.; Kirk, A.; Mutrie, N.; Matthews, L.; Robertson, K.; Saunders, D.H. A systematic review of physical activity and sedentary behavior intervention studies in youth with type 1 diabetes: Study characteristics, intervention design, and efficacy. Pediatr. Diabetes 2014, 15, 175–189. [Google Scholar] [CrossRef] [PubMed]
- Aljawarneh, Y.M.; Wardell, D.W.; Wood, G.L.; Rozmus, C.L. A Systematic Review of Physical Activity and Exercise on Physiological and Biochemical Outcomes in Children and Adolescents with Type 1 Diabetes. J. Nurs. Scholarsh. 2019, 51, 337–345. [Google Scholar] [CrossRef]
- Quirk, H.; Blake, H.; Tennyson, R.; Randell, T.L.; Glazebrook, C. Physical activity interventions in children and young people with Type 1 diabetes mellitus: A systematic review with meta-analysis. Diabet. Med. 2014, 31, 1163–1173. [Google Scholar] [CrossRef]
- de Lima, V.A.; Mascarenhas, L.P.G.; Decimo, J.P.; de Souza, W.C.; Monteiro, A.L.S.; Lahart, I.; França, S.N.; Leite, N. Physical Activity Levels of Adolescents with Type 1 Diabetes Physical Activity in T1D. Pediatr. Exerc. Sci. 2017, 29, 213–219. [Google Scholar] [CrossRef]
- Czenczek-Lewandowska, E.; Leszczak, J.; Baran, J.; Weres, A.; Wyszyńska, J.; Lewandowski, B.; Dąbrowski, M.; Mazur, A. Levels of Physical Activity in Children and Adolescents with Type 1 Diabetes in Relation to the Healthy Comparators and to the Method of Insulin Therapy Used. Int. J. Environ. Res. Public Health 2019, 16, 3489. [Google Scholar] [CrossRef] [PubMed]
- Bull, F.C.; Al-Ansari, S.S.; Biddle, S.; Borodulin, K.; Buman, M.P.; Cardon, G.; Carty, C.; Chaput, J.P.; Chastin, S.; Chou, R.; et al. World Health Organization 2020 guidelines on physical activity and sedentary behaviour. Br. J. Sports Med. 2020, 54, 1451–1462. [Google Scholar] [CrossRef]
- Brazeau, A.S.; Rabasa-Lhoret, R.; Strychar, I.; Mircescu, H. Barriers to Physical Activity among Patients with Type 1 Diabetes. Diabetes Care 2008, 31, 2108–2109. [Google Scholar] [CrossRef]
- Kahkoska, A.R.; Watts, M.E.; Driscoll, K.A.; Bishop, F.K.; Mihas, P.; Thomas, J.; Law, J.R.; Jain, N.; Mayer-Davis, E.J. Understanding antagonism and synergism: A qualitative assessment of weight management in youth with Type 1 diabetes mellitus. Obes. Med. 2018, 9, 21–31. [Google Scholar] [CrossRef] [PubMed]
- Gomez, A.M.; Gomez, C.; Aschner, P.; Veloza, A.; Muñoz, O.; Rubio, C.; Vallejo, S. Effects of performing morning versus afternoon exercise on glycemic control and hypoglycemia frequency in type 1 diabetes patients on sensor-augmented insulin pump therapy. J. Diabetes Sci. Technol. 2015, 9, 619–624. [Google Scholar] [CrossRef]
- Tsalikian, E.; Mauras, N.; Beck, R.W.; Tamborlane, W.V.; Janz, K.F.; Chase, H.P.; Wysocki, T.; Weinzimer, S.A.; Buckingham, B.A.; Kollman, C.; et al. Impact of exercise on overnight glycemic control in children with type 1 diabetes mellitus. J. Pediatr. 2005, 147, 528–534. [Google Scholar] [CrossRef]
- Tanenberg, R.J.; Newton, C.A.; Drake, A.J. Confirmation of hypoglycemia in the “dead-in-bed” syndrome, as captured by a retrospective continuous glucose monitoring system. Endocr. Pract. 2010, 16, 244–248. [Google Scholar] [CrossRef] [PubMed]
- Davis, E.; Keating, B.; Byrne, G.; Russell, M.; Jones, T. Hypoglycemia: Incidence and clinical predictors in a large population-based sample of children and adolescents with IDDM. Diabetes Care 1997, 20, 22–25. [Google Scholar] [CrossRef]
- Riddell, M.C.; Gallen, I.W.; Smart, C.E.; Taplin, C.E.; Adolfsson, P.; Lumb, A.N.; Kowalski, A.; Rabasa-Lhoret, R.; McCrimmon, R.J.; Hume, C.; et al. Exercise management in type 1 diabetes: A consensus statement. Lancet Diabetes Endocrinol. 2017, 5, 377–390. [Google Scholar] [CrossRef]
- Thomas, D.T.; Erdman, K.A.; Burke, L.M. Position of the Academy of Nutrition and Dietetics, Dietitians of Canada, and the American College of Sports Medicine: Nutrition and Athletic Performance. J. Acad. Nutr. Diet. 2016, 116, 501–528. [Google Scholar] [CrossRef] [PubMed]
- Jäger, R.; Kerksick, C.M.; Campbell, B.I.; Cribb, P.J.; Wells, S.D.; Skwiat, T.M.; Purpura, M.; Ziegenfuss, T.N.; Ferrando, A.A.; Arent, S.M.; et al. International Society of Sports Nutrition Position Stand: Protein and exercise. J. Int. Soc. Sports Nutr. 2017, 14. [Google Scholar] [CrossRef]
- Pasiakos, S.M.; McLellan, T.M.; Lieberman, H.R. The effects of protein supplements on muscle mass, strength, and aerobic and anaerobic power in healthy adults: A systematic review. Sports Med. 2015, 45, 111–131. [Google Scholar] [CrossRef]
- Wycherley, T.P.; Moran, L.J.; Clifton, P.M.; Noakes, M.; Brinkworth, G.D. Effects of energy-restricted high-protein, low-fat compared with standard-protein, low-fat diets: A meta-analysis of randomized controlled trials. Am. J. Clin. Nutr. 2012, 96, 1281–1298. [Google Scholar] [CrossRef] [PubMed]
- Phillips, S.M. Dietary protein requirements and adaptive advantages in athletes. Br. J. Nutr. 2012, 108 (Suppl. S2), S158–S167. [Google Scholar] [CrossRef] [PubMed]
- Paterson, M.; Smart, C.; McElduff, P.; Lopez, P.; Morbey, C.; Attia, J.; King, B. Influence of Pure Protein on Postprandial Blood Glucose Levels in Individuals with Type 1 Diabetes Mellitus. Diabetes 2014, 63, A15. [Google Scholar]
- Paterson, M.A.; Smart, C.E.M.; Lopez, P.E.; Howley, P.; McElduff, P.; Attia, J.; Morbey, C.; King, B.R. Increasing the protein quantity in a meal results in dose-dependent effects on postprandial glucose levels in individuals with Type 1 diabetes mellitus. Diabet. Med. 2017, 34, 851–854. [Google Scholar] [CrossRef]
- Smart, C.E.M.; Evans, M.; O’Connell, S.M.; McElduff, P.; Lopez, P.E.; Jones, T.W.; Davis, E.A.; King, B.R. Both Dietary Protein and Fat Increase Postprandial Glucose Excursions in Children with Type 1 Diabetes, and the Effect Is Additive. Diabetes Care 2013, 36, 3897–3902. [Google Scholar] [CrossRef] [PubMed]
- Neu, A.; Behret, F.; Braun, R.; Herrlich, S.; Liebrich, F.; Loesch-Binder, M.; Schneider, A.; Schweizer, R. Higher glucose concentrations following protein- and fat-rich meals—The Tuebingen Grill Study: A pilot study in adolescents with type 1 diabetes. Pediatr. Diabetes 2015, 16, 587–591. [Google Scholar] [CrossRef] [PubMed]
- Dube, M.-C.; Lavoie, C.; Galibois, I.; Weisnagel, J. Nutritional Strategies to Prevent Hypoglycemia at Exercise in Diabetic Adolescents. Med. Sci. Sports Exerc. 2012, 44, 1427–1432. [Google Scholar] [CrossRef]
- Paramalingam, N.; Keating, B.L.; Chetty, T.; Fournier, P.A.; Soon, W.H.K.; O’Dea, J.M.; Roberts, A.G.; Horowitz, M.; Jones, T.W.; Davis, E.A. Protein Ingestion in Reducing the Risk of Late-Onset Post-Exercise Hypoglycemia: A Pilot Study in Adolescents and Youth with Type 1 Diabetes. Nutrients 2023, 15, 543. [Google Scholar] [CrossRef] [PubMed]
- Kichler, J.C.; Seid, M.; Crandell, J.; Maahs, D.M.; Bishop, F.K.; Driscoll, K.A.; Standiford, D.; Hunter, C.M.; Mayer-Davis, E. The Flexible Lifestyle Empowering Change (FLEX) intervention for self-management in adolescents with type 1 diabetes: Trial design and baseline characteristics. Contemp. Clin. Trials 2018, 66, 64–73. [Google Scholar] [CrossRef]
- Mayer-Davis, E.J.; Maahs, D.M.; Seid, M.; Crandell, J.; Bishop, F.K.; Driscoll, K.A.; Hunter, C.M.; Kichler, J.C.; Standiford, D.; Thomas, J.M. Efficacy of the Flexible Lifestyles Empowering Change intervention on metabolic and psychosocial outcomes in adolescents with type 1 diabetes (FLEX): A randomised controlled trial. Lancet Child Adolesc. Health 2018, 2, 635–646. [Google Scholar] [CrossRef] [PubMed]
- Battelino, T.; Danne, T.; Bergenstal, R.M.; Amiel, S.A.; Beck, R.; Biester, T.; Bosi, E.; Buckingham, B.A.; Cefalu, W.T.; Close, K.L.; et al. Clinical Targets for Continuous Glucose Monitoring Data Interpretation: Recommendations From the International Consensus on Time in Range. Diabetes Care 2019, 42, 1593–1603. [Google Scholar] [CrossRef] [PubMed]
- Beaton, G.H.; Milner, J.; Corey, P.; McGuire, V.; Cousins, M.; Stewart, E.; De Ramos, M.; Hewitt, D.; Grambsch, P.; Kassim, N. Sources of variance in 24-h dietary recall data: Implications for nutrition study design and interpretation. Am. J. Clin. Nutr. 1979, 32, 2546–2559. [Google Scholar] [CrossRef] [PubMed]
- Conway, J.M.; Ingwersen, L.A.; Moshfegh, A.J. Accuracy of dietary recall using the USDA five-step multiple-pass method in men: An observational validation study. J. Am. Diet. Assoc. 2004, 104, 595–603. [Google Scholar] [CrossRef]
- Weston, A.T.; Petosa, R.; Pate, R.R. Validation of an instrument for measurement of physical activity in youth. Med. Sci. Sports Exerc. 1997, 29, 138–143. [Google Scholar] [CrossRef]
- Ainsworth, B.E.; Haskell, W.L.; Herrmann, S.D.; Meckes, N.; Bassett, D.R., Jr.; Tudor-Locke, C.; Greer, J.L.; Vezina, J.; Whitt-Glover, M.C.; Leon, A.S. 2011 Compendium of Physical Activities: A second update of codes and MET values. Med. Sci. Sports Exerc. 2011, 43, 1575–1581. [Google Scholar] [CrossRef]
- Stevens, J.; Ou, F.S.; Cai, J.; Heymsfield, S.B.; Truesdale, K.P. Prediction of percent body fat measurements in Americans 8 years and older. Int. J. Obes. 2016, 40, 587–594. [Google Scholar] [CrossRef]
- Yardley, J.E.; Iscoe, K.E.; Sigal, R.J.; Kenny, G.P.; Perkins, B.A.; Riddell, M.C. Insulin pump therapy is associated with less post-exercise hyperglycemia than multiple daily injections: An observational study of physically active type 1 diabetes patients. Diabetes Technol. Ther. 2013, 15, 84–88. [Google Scholar] [CrossRef]
- Katz, M.L.; Mehta, S.; Nansel, T.; Quinn, H.; Lipsky, L.M.; Laffel, L.M. Associations of nutrient intake with glycemic control in youth with type 1 diabetes: Differences by insulin regimen. Diabetes Technol. Ther. 2014, 16, 512–518. [Google Scholar] [CrossRef]
- DuBose, S.N.; Hermann, J.M.; Tamborlane, W.V.; Beck, R.W.; Dost, A.; DiMeglio, L.A.; Schwab, K.O.; Holl, R.W.; Hofer, S.E.; Maahs, D.M.; et al. Obesity in Youth with Type 1 Diabetes in Germany, Austria, and the United States. J. Pediatr. 2015, 167, 627–632.e624. [Google Scholar] [CrossRef]
- James, S.; Perry, L.; Lowe, J.; Harris, M.; Craig, M.E.; ADDN Study Group. Suboptimal glycemic control in adolescents and young adults with type 1 diabetes from 2011 to 2020 across Australia and New Zealand: Data from the Australasian Diabetes Data Network registry. Pediatr. Diabetes 2022, 23, 736–741. [Google Scholar] [CrossRef] [PubMed]
- Brown, T.L.; Maahs, D.M.; Bishop, F.K.; Snell-Bergeon, J.K.; Wadwa, R.P. Influences of gender on cardiovascular disease risk factors in adolescents with and without type 1 diabetes. Int. J. Pediatr. Endocrinol. 2016, 2016, 8. [Google Scholar] [CrossRef] [PubMed]
- Denise, M.-B.; Raimundo, S.; Karen, D.-C.; Jaime, L.; María Teresa, O. Hypoglycemia and glycemic variability of people with type 1 diabetes with lower and higher physical activity loads in free-living conditions using continuous subcutaneous insulin infusion with predictive low-glucose suspend system. BMJ Open. Diabetes Res. Care 2023, 11, e003082. [Google Scholar] [CrossRef]
- Borie-Swinburne, C.; Sola-Gazagnes, A.; Gonfroy-Leymarie, C.; Boillot, J.; Boitard, C.; Larger, E. Effect of dietary protein on post-prandial glucose in patients with type 1 diabetes. J. Hum. Nutr. Diet. 2013, 26, 606–611. [Google Scholar] [CrossRef]
- van der Klaauw, A.A.; Keogh, J.M.; Henning, E.; Trowse, V.M.; Dhillo, W.S.; Ghatei, M.A.; Farooqi, I.S. High protein intake stimulates postprandial GLP1 and PYY release. Obesity 2013, 21, 1602–1607. [Google Scholar] [CrossRef] [PubMed]
- Bodnaruc, A.M.; Prud’homme, D.; Blanchet, R.; Giroux, I. Nutritional modulation of endogenous glucagon-like peptide-1 secretion: A review. Nutr. Metab. 2016, 13, 92. [Google Scholar] [CrossRef] [PubMed]
- Memelink, R.G.; Pasman, W.J.; Bongers, A.; Tump, A.; Van Ginkel, A.; Tromp, W.; Wopereis, S.; Verlaan, S.; De Vogel-Van Den Bosch, J.; Weijs, P.J.M. Effect of an Enriched Protein Drink on Muscle Mass and Glycemic Control during Combined Lifestyle Intervention in Older Adults with Obesity and Type 2 Diabetes: A Double-Blind RCT. Nutrients 2020, 13, 64. [Google Scholar] [CrossRef]
- Zhang, J.; Pivovarova-Ramich, O.; Kabisch, S.; Markova, M.; Hornemann, S.; Sucher, S.; Rohn, S.; Machann, J.; Pfeiffer, A.F.H. High Protein Diets Improve Liver Fat and Insulin Sensitivity by Prandial but Not Fasting Glucagon Secretion in Type 2 Diabetes. Front. Nutr. 2022, 9, 808346. [Google Scholar] [CrossRef]
- Gannon, M.C.; Nuttall, F.Q. Effect of a High-Protein, Low-Carbohydrate Diet on Blood Glucose Control in People with Type 2 Diabetes. Diabetes 2004, 53, 2375–2382. [Google Scholar] [CrossRef]
- Dong, J.Y.; Zhang, Z.L.; Wang, P.Y.; Qin, L.Q. Effects of high-protein diets on body weight, glycaemic control, blood lipids and blood pressure in type 2 diabetes: Meta-analysis of randomised controlled trials. Br. J. Nutr. 2013, 110, 781–789. [Google Scholar] [CrossRef] [PubMed]
- Tagi, V.M.; Chiarelli, F. Obesity and insulin resistance in children. Curr. Opin. Pediatr. 2020, 32, 582–588. [Google Scholar] [CrossRef] [PubMed]
- Tagougui, S.; Goulet-Gelinas, L.; Taleb, N.; Messier, V.; Suppere, C.; Rabasa-Lhoret, R. Association Between Body Composition and Blood Glucose during Exercise and Recovery in Adolescent and Adult Patients with Type 1 Diabetes. Can. J. Diabetes 2020, 44, 192–195. [Google Scholar] [CrossRef] [PubMed]
- Riddell, M.C.; Partington, S.L.; Stupka, N.; Armstrong, D.; Rennie, C.; Tarnopolsky, M.A. Substrate utilization during exercise performed with and without glucose ingestion in female and male endurance trained athletes. Int. J. Sport Nutr. Exerc. Metab. 2003, 13, 407–421. [Google Scholar] [CrossRef]
- Devries, M.C.; Hamadeh, M.J.; Phillips, S.M.; Tarnopolsky, M.A. Menstrual cycle phase and sex influence muscle glycogen utilization and glucose turnover during moderate-intensity endurance exercise. Am. J. Physiol. Regul. Integr. Comp. Physiol. 2006, 291, R1120–R1128. [Google Scholar] [CrossRef]
- Vance, V.A.; Woodruff, S.J.; McCargar, L.J.; Husted, J.; Hanning, R.M. Self-reported dietary energy intake of normal weight, overweight and obese adolescents. Public Health Nutr. 2009, 12, 222–227. [Google Scholar] [CrossRef]
- LeBlanc, A.G.W.; Janssen, I. Difference Between Self-Reported and Accelerometer Measured Moderate-to-Vigorous Physical Activity in Youth. Pediatr. Exerc. Sci. 2010, 22, 523–534. [Google Scholar] [CrossRef]
- Moshfegh, A.J.; Rhodes, D.G.; Baer, D.J.; Murayi, T.; Clemens, J.C.; Rumpler, W.V.; Paul, D.R.; Sebastian, R.S.; Kuczynski, K.J.; Ingwersen, L.A.; et al. The US Department of Agriculture Automated Multiple-Pass Method reduces bias in the collection of energy intakes. Am. J. Clin. Nutr. 2008, 88, 324–332. [Google Scholar] [CrossRef]
- Sallis, J.F. Self-Report Measures of Children’s Physical Activity. J. Sch. Health 1991, 61, 215–219. [Google Scholar] [CrossRef]
- Anderson, C.B.; Hagströmer, M.; Yngve, A. Validation of the PDPAR as an adolescent diary: Effect of accelerometer cut points. Med. Sci. Sports Exerc. 2005, 37, 1224–1230. [Google Scholar] [CrossRef]


| Demographic | Mean ± SD or n (%) |
|---|---|
| Age | 14.5 (13.8, 15.7) |
| Female | 61 (54.0) |
| Male | 52 (46.0) |
| Race/Ethnicity | |
| Non-Hispanic White | 91 (80.5) |
| Non-Hispanic Black | 2 (1.8) |
| Hispanic | 14 (12.4) |
| Multiracial/Other | 6 (5.3) |
| Maximum Education of Parents | |
| High School or Less | 11 (9.8) |
| Some College | 31 (27.7) |
| Four-Year College Degree | 50 (44.6) |
| Graduate Degree | 20 (17.9) |
| Clinical | |
| Diabetes Duration | 5.4 (3.1, 9.0) |
| Insulin Pump User (n = 111) | 81 (72.3) |
| Previous Day Insulin Dose (units/kg) (n = 110) | 1.0 ± 0.3 |
| Anthropometric | |
| Weight (kg) | 58.8 (51.3, 69.2) |
| BMI Z-Score | 0.7 ± 0.9 |
| Estimated Body Fat % | 28.1 (20.1, 33.1) |
| Glycemia | |
| No Personal CGM Use in Past 30 Days (n = 103) | 72 (69.9) |
| Baseline HbA1c (%) | 9.3 (8.6, 9.9) |
| Percent Time in Range (n = 106) | 36.4 ± 13.7 |
| Percent Time Below Range (n = 106) | 2.1 (0.3, 5.6) |
| Percent Time Above Range (n = 106) | 59.7 ± 16.0 |
| Diet | |
| Daily Caloric Intake (kcal) | 1623.3 (1315.6, 2062.0) |
| Percent of Daily Calories from Protein | 16.0 ± 3.5 |
| Percent of Daily Calories from Carbohydrates | 49.0 ± 7.7 |
| Percent of Daily Calories from Fat | 36.2 ± 6.4 |
| Daily Fiber Intake (grams) | 13.4 (10.2, 18.2) |
| Physical Activity (n = 109) | |
| Meet WHO Guidelines of ≥60 min MVPA/day | 101 (92.7) |
| Daily Minutes of MVPA | 165.0 (105.0, 225.0) |
| Daily Minutes of Vigorous Physical Activity | 45.0 (0.0, 90.0) |
| Post-Exercise Protein (Grams) * | Post-Exercise Protein (g/kg) † | |||||
|---|---|---|---|---|---|---|
| Estimate | p-Value | 95% CI | Estimate | p-Value | 95% CI | |
| Unadjusted Models | ||||||
| Percent Time Above Range | 0.5% | 0.52 | (−1.1%, 2.2%) | 0.6% | 0.33 | (−0.6%, 1.9%) |
| Percent Time In Range | −0.4% | 0.58 | (−2.0%, 1.1%) | −0.6% | 0.35 | (−1.7%, 0.6%) |
| Percent Time Below Range | 0.1% | 0.63 | (−0.6%, 0.4%) | −0.1% | 0.77 | (−0.4%, 0.3%) |
| Fully Adjusted Models ‡ | ||||||
| Percent Time Above Range | −0.7% | 0.56 | (−3.0%, 1.6%) | −0.1% | 0.93 | (−1.8%, 1.6%) |
| Percent Time In Range | 0.8% | 0.49 | (−1.4%, 2.9%) | 0.2% | 0.31 | (−1.4%, 1.8%) |
| Percent Time Below Range | 0.1% | 0.79 | (−0.8%, 0.6%) | −0.1% | 0.66 | (−0.7%, 0.4%) |
| Category of Daily Protein Intake | % Time above Range | % Time in Range | %Time below Range | ||||||
|---|---|---|---|---|---|---|---|---|---|
| Estimate | p-Value | 95% CI | Estimate | p-Value | 95% CI | Estimate | p-Value | 95% CI | |
| Unadjusted Models | |||||||||
| <1.2 g Protein/kg Body weight (bouts = 266) | Reference | ||||||||
| >1.2 g Protein/kg Body weight (bouts = 188) | −6.8% | 0.02 | (−12.4%, −1.1%) | 5.3% | 0.05 | (0.0%, 10.6%) | 1.5% | 0.09 | (−0.3%, 3.2%) |
| Fully Adjusted Models * | |||||||||
| <1.2 g Protein/kg Body weight (bouts = 266) | Reference | ||||||||
| >1.2 g Protein/kg Body weight (bouts = 188) | −8.0% | 0.02 | (−14.5%, −1.6%) | 6.9% | 0.03 | (0.9%, 13.0%) | 1.2% | 0.22 | (−0.8%, 3.2%) |
| Interaction Effects * | % Time above Range | % Time in Range | % Time below Range | ||||||
|---|---|---|---|---|---|---|---|---|---|
| Estimate | p-Value | 95% CI | Estimate | p-Value | 95% CI | Estimate | p-Value | 95% CI | |
| Protein Intake Category × Insulin Regimen | Interaction p-Value = 0.08 | Interaction p-Value = 0.03 | Interaction p-Value = 0.60 | ||||||
| Continuous Subcutaneous Insulin Infusion (CSII) | −5.7% | 0.1 | (−12.5%, 1.1%) | 4.2% | 0.19 | (−2.2%, 10.6%) | 0.5% | 0.81 | (−3.4%, 4.4%) |
| Multiple Daily Insulin Injections (MDII) | −17.9% | <0.01 | (−30.5%, −5.3%) | 17.9% | <0.01 | (6.1%, 29.7%) | 1.6% | 0.13 | (−0.55%, 3.8%) |
| Protein Intake Category × Weight Status | Interaction p-Value = 0.08 | Interaction p-Value <0.01 | Interaction p-Value <0.01 | ||||||
| Overweight/Obesity | −15.6% | <0.01 | (−26.2%, −5.1%) | 18.6% | <0.001 | (8.7%, 28.4%) | −2.6% | 0.11 | (−5.8%, 0.6%) |
| No Overweight/Obesity | −4.9% | 0.18 | (−12.0%, 2.3%) | 2.2% | 0.52 | (−4.5%, 8.8%) | 2.7% | 0.01 | (0.6%, 4.9%) |
| Protein Intake Category × Sex | Interaction p-Value <0.01 | Interaction p-Value <0.01 | Interaction p-Value =0.48 | ||||||
| Female | −16.9% | <0.0001 | (−25.3%, −8.5%) | 16.3% | <0.001 | (8.4%, 24.2%) | 0.7% | 0.61 | (−2.0%, 3.4%) |
| Male | 0.6% | 0.88 | (−7.7%, 9.0%) | −2.4% | 0.56 | (−10.3%, 5.5%) | 2.0% | 0.14 | (−0.7%, 4.7%) |
Disclaimer/Publisher’s Note: The statements, opinions and data contained in all publications are solely those of the individual author(s) and contributor(s) and not of MDPI and/or the editor(s). MDPI and/or the editor(s) disclaim responsibility for any injury to people or property resulting from any ideas, methods, instructions or products referred to in the content. |
© 2023 by the authors. Licensee MDPI, Basel, Switzerland. This article is an open access article distributed under the terms and conditions of the Creative Commons Attribution (CC BY) license (https://creativecommons.org/licenses/by/4.0/).
Share and Cite
Muntis, F.R.; Smith-Ryan, A.E.; Crandell, J.; Evenson, K.R.; Maahs, D.M.; Seid, M.; Shaikh, S.R.; Mayer-Davis, E.J. A High Protein Diet Is Associated with Improved Glycemic Control Following Exercise among Adolescents with Type 1 Diabetes. Nutrients 2023, 15, 1981. https://doi.org/10.3390/nu15081981
Muntis FR, Smith-Ryan AE, Crandell J, Evenson KR, Maahs DM, Seid M, Shaikh SR, Mayer-Davis EJ. A High Protein Diet Is Associated with Improved Glycemic Control Following Exercise among Adolescents with Type 1 Diabetes. Nutrients. 2023; 15(8):1981. https://doi.org/10.3390/nu15081981
Chicago/Turabian StyleMuntis, Franklin R., Abbie E. Smith-Ryan, Jamie Crandell, Kelly R. Evenson, David M. Maahs, Michael Seid, Saame R. Shaikh, and Elizabeth J. Mayer-Davis. 2023. "A High Protein Diet Is Associated with Improved Glycemic Control Following Exercise among Adolescents with Type 1 Diabetes" Nutrients 15, no. 8: 1981. https://doi.org/10.3390/nu15081981