
Trends in Diet Quality and Increasing Inadequacies of Micronutrients Vitamin C, Vitamin B12, Iron and Potassium in US Type 2 Diabetic Adults

Abstract
1. Introduction
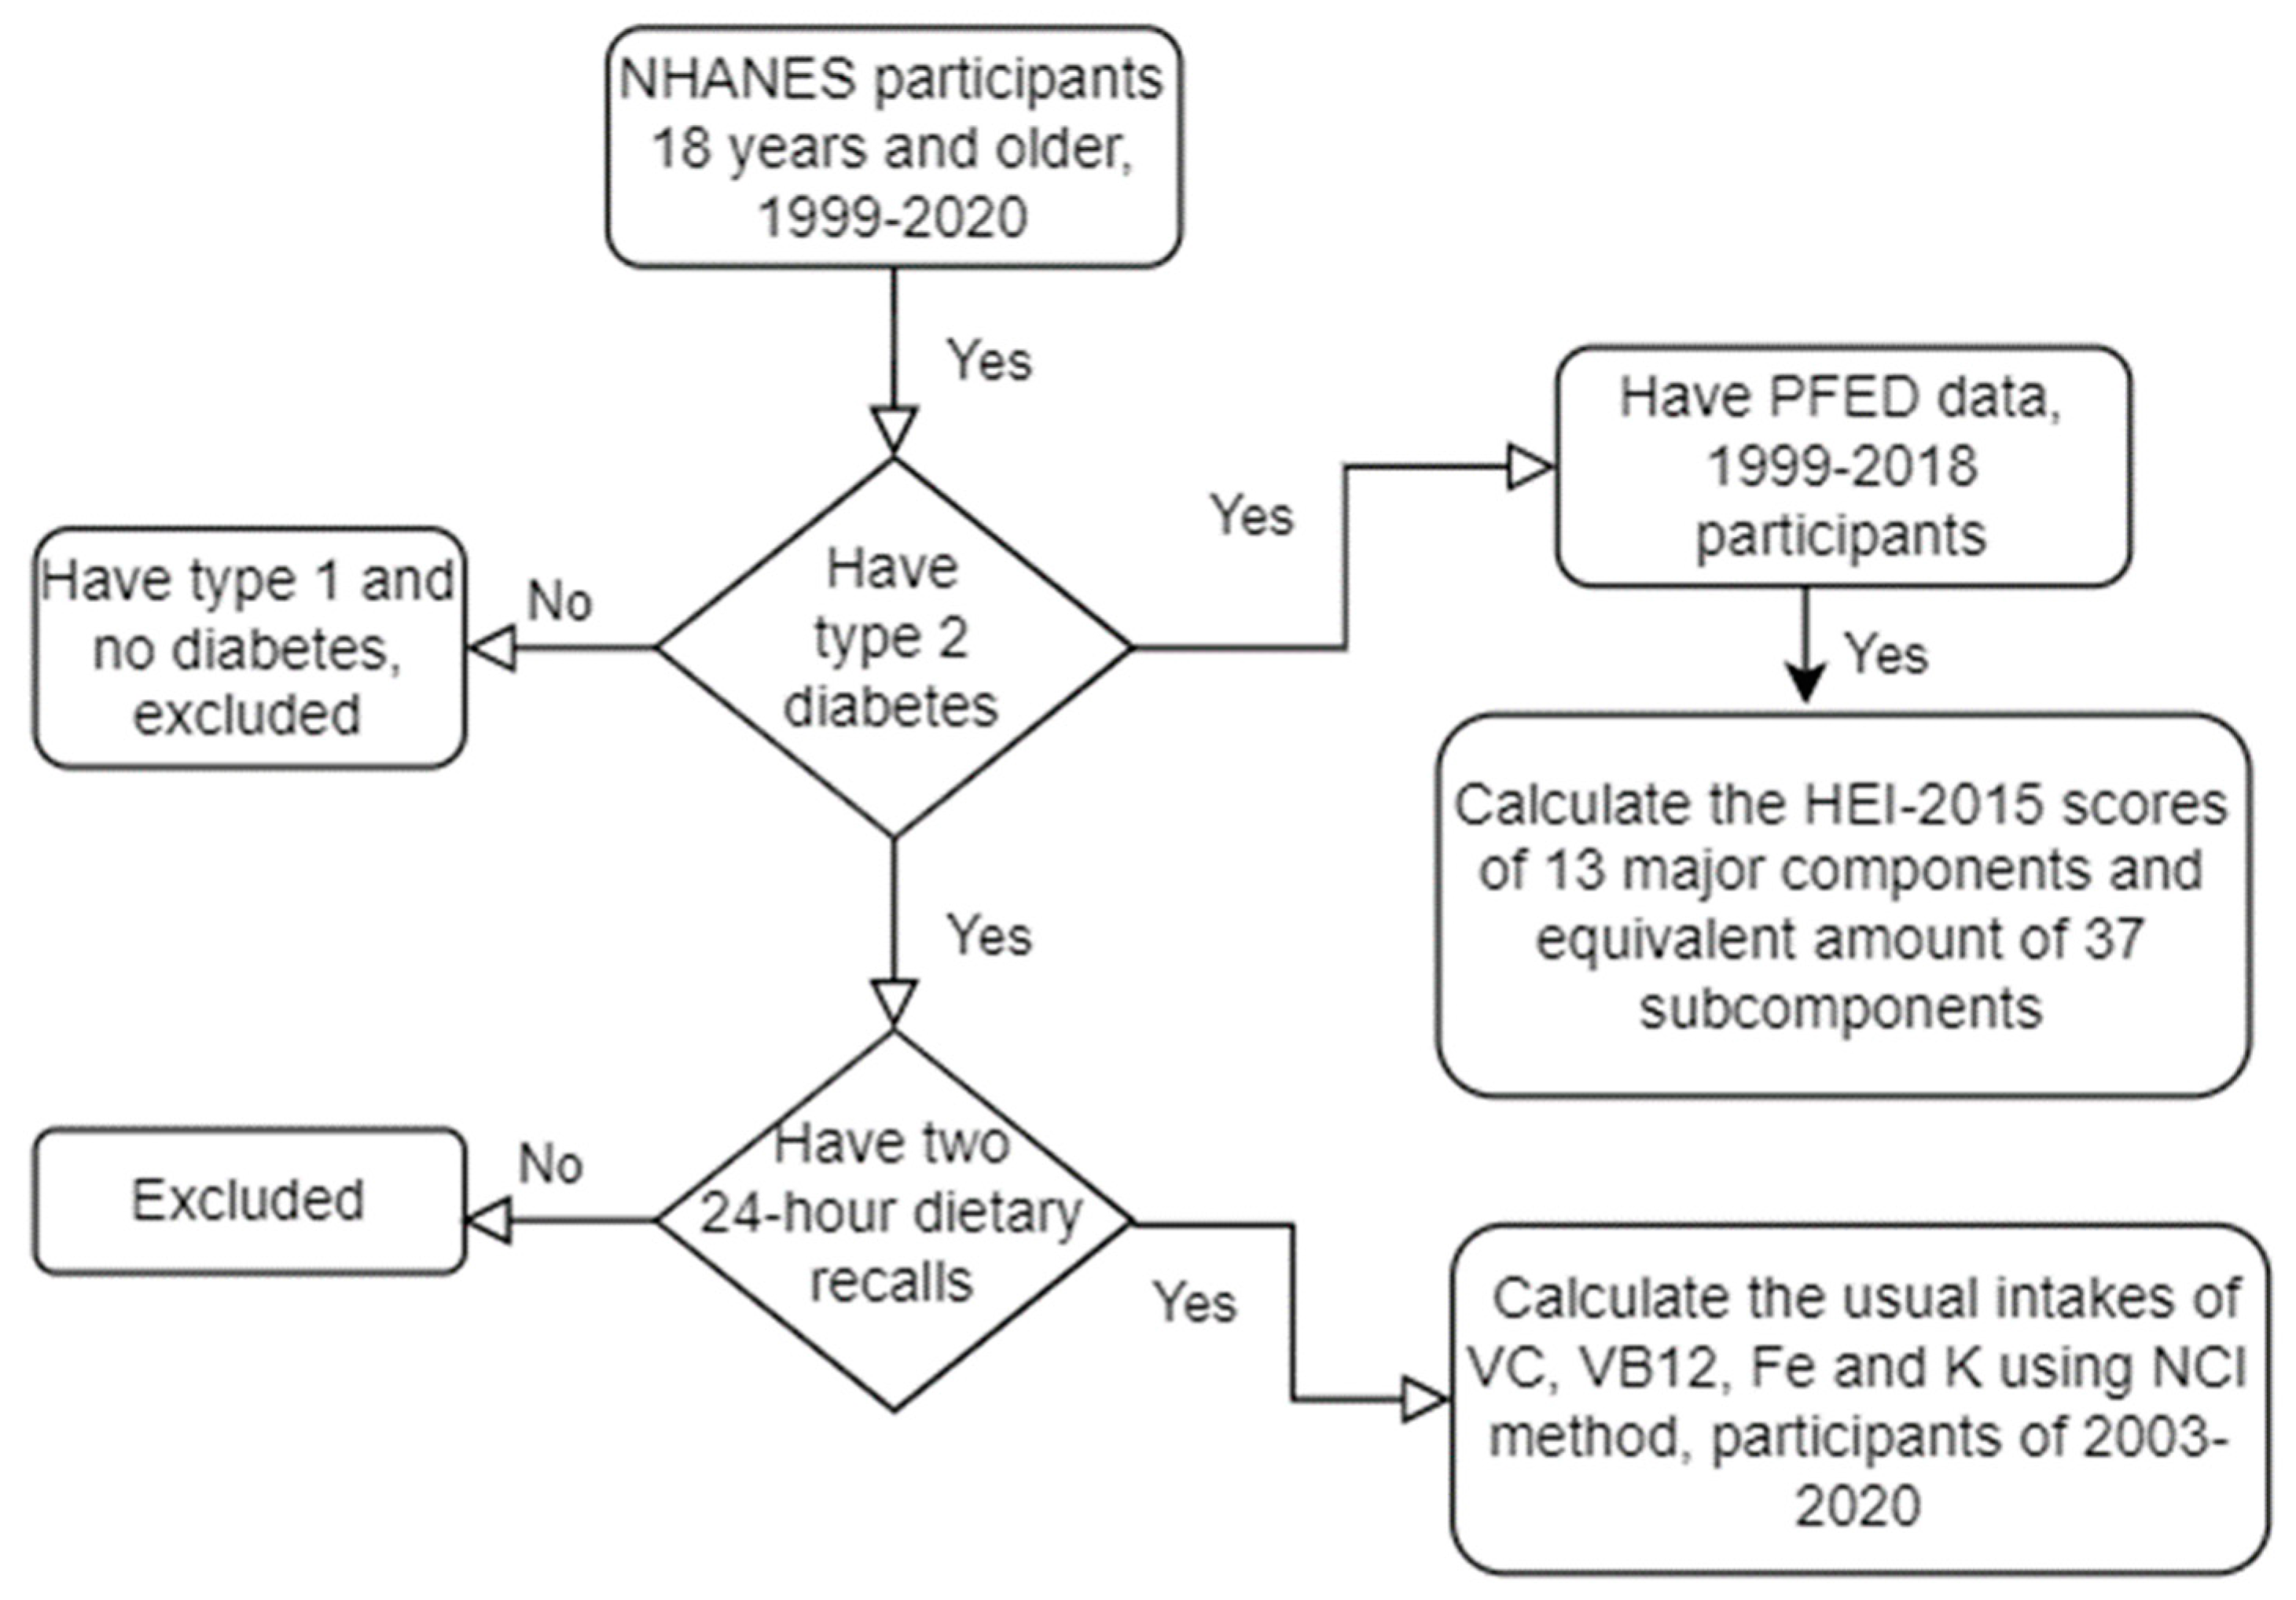
2. Methods
2.1. Study Design and Data
2.2. Dietary Interview and Food Groups
2.3. Outcomes
2.4. Statistical Analysis
3. Results
3.1. Characteristics of Participants
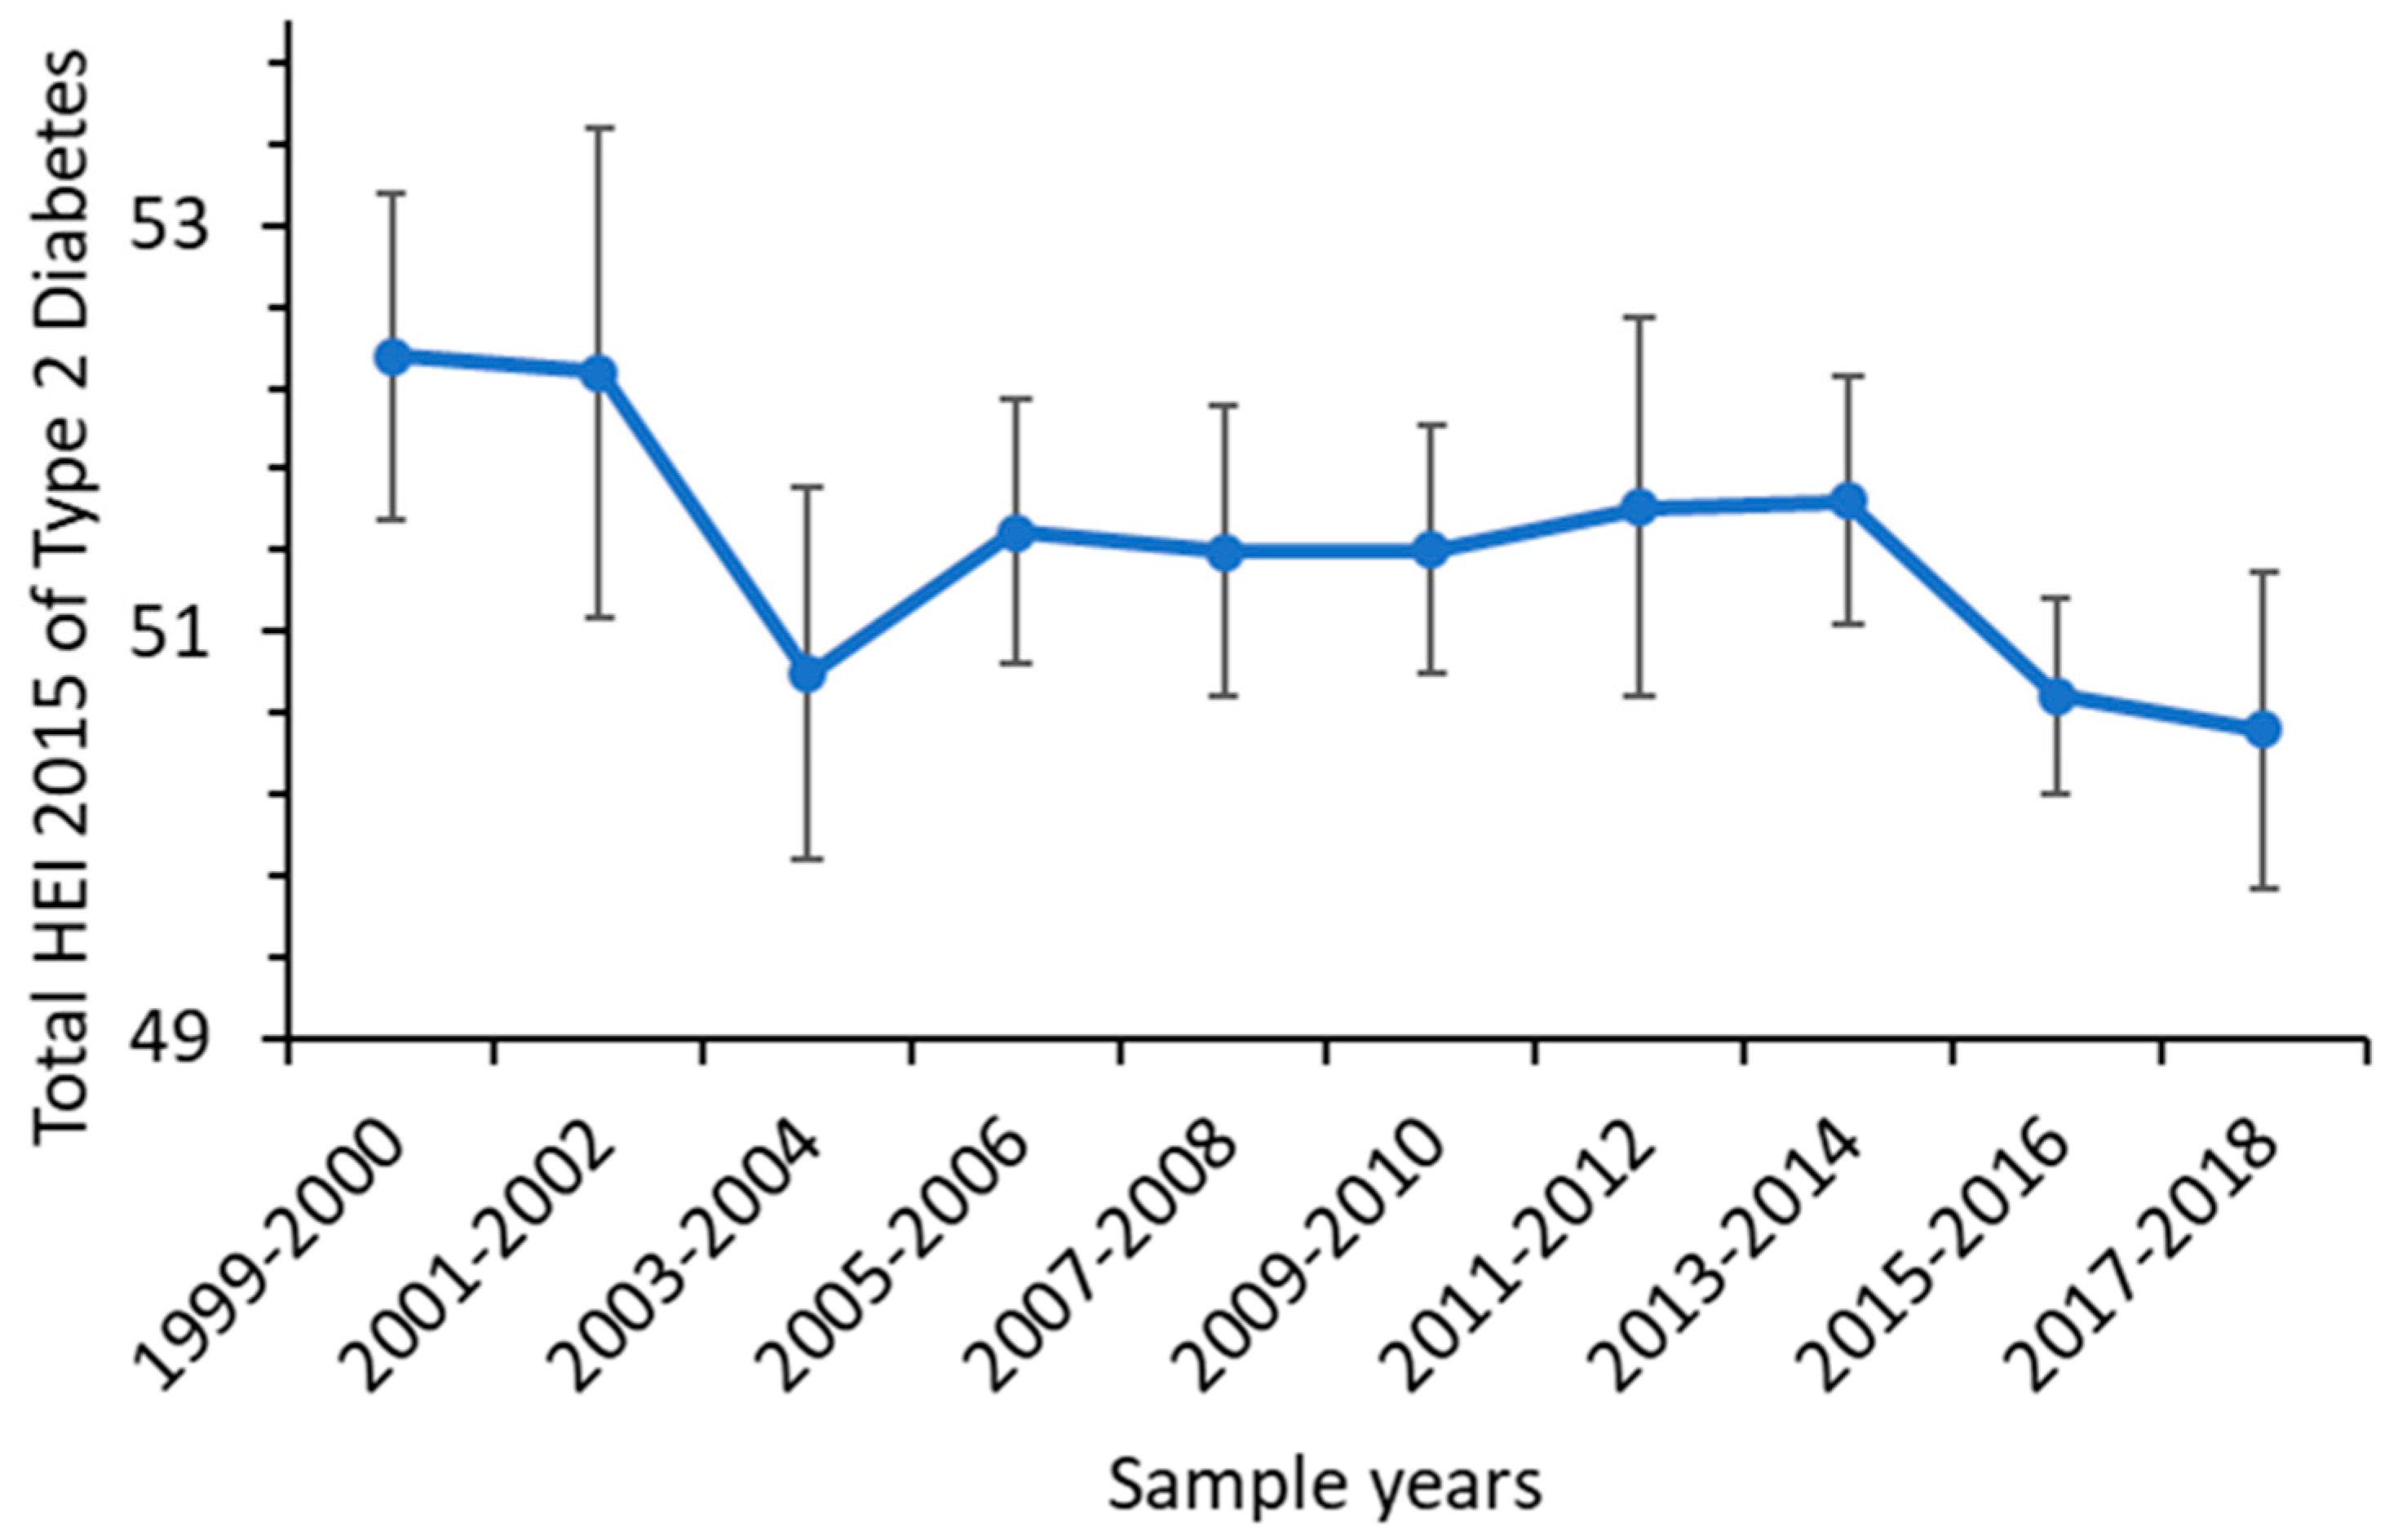
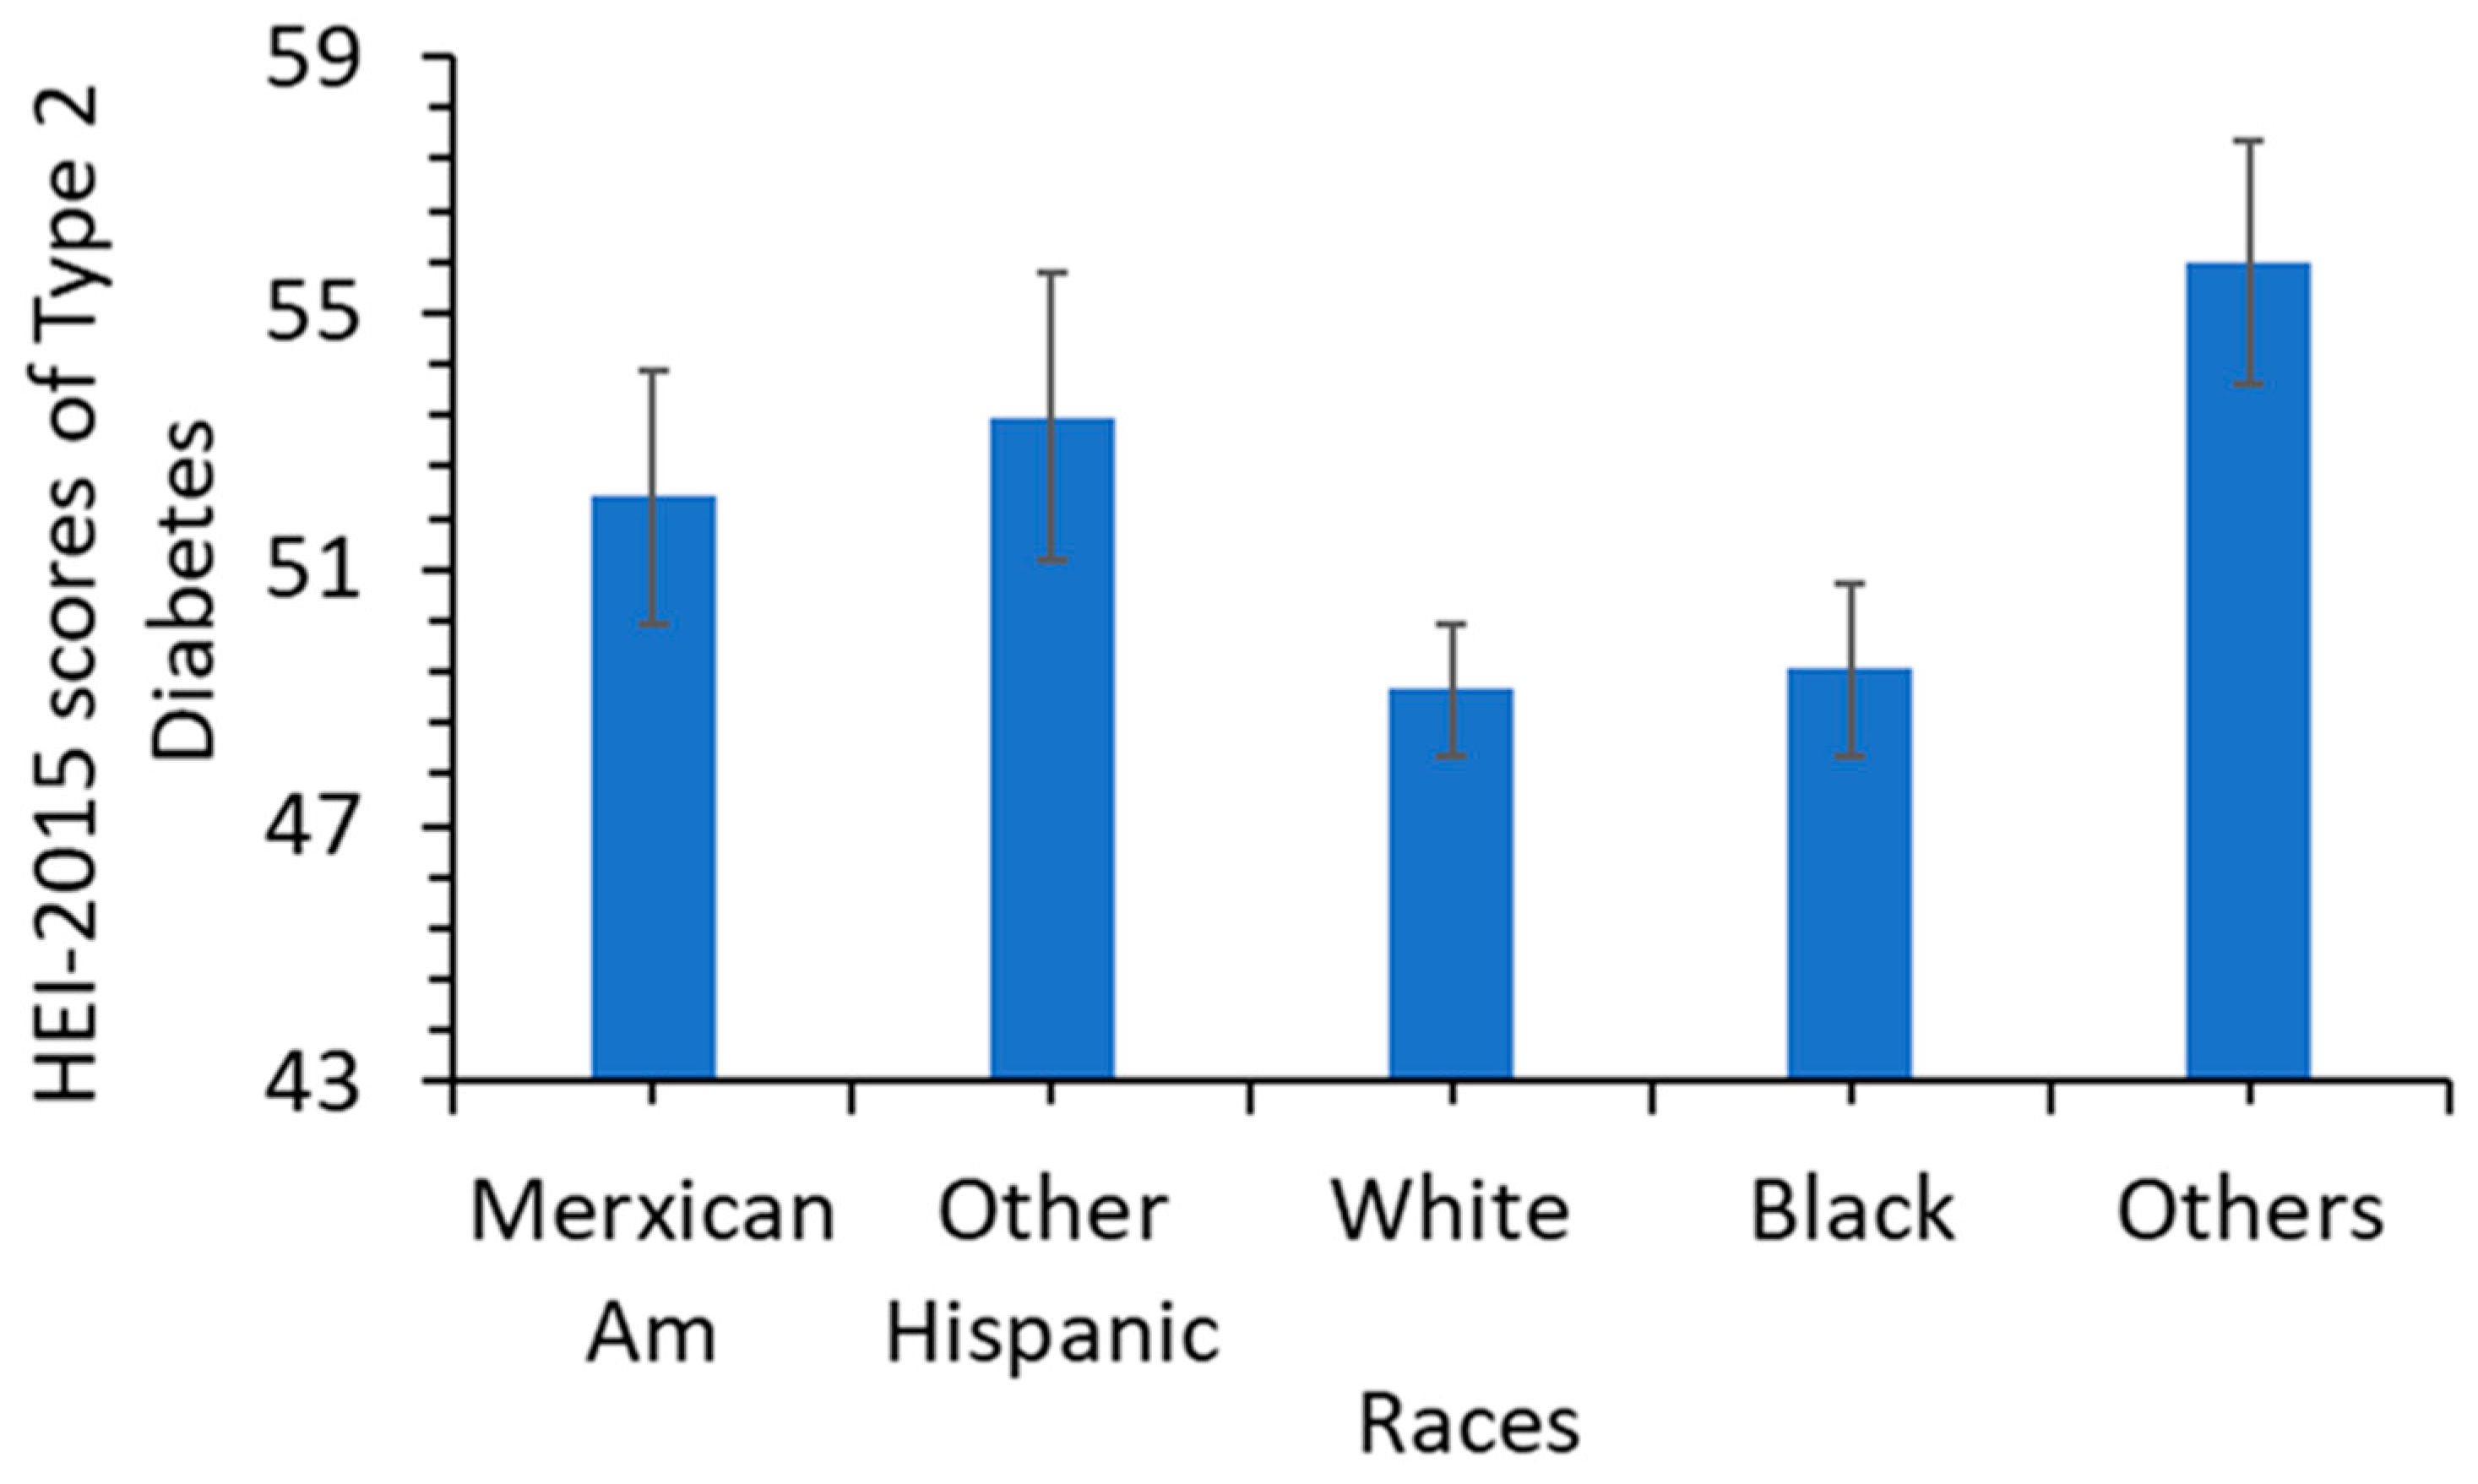
3.2. Trends in Diet Quality
3.2.1. Trends in the 37 Dietary Subcomponents/Categories and Total Energy
3.2.2. Trends of Usual Intakes of VC, VB12, Iron and Potassium
4. Discussion
5. Limitations
6. Conclusions
Supplementary Materials
Author Contributions
Funding
Institutional Review Board Statement
Informed Consent Statement
Data Availability Statement
Conflicts of Interest
References
- Wang, L.; Li, X.; Wang, Z.; Bancks, M.P.; Carnethon, M.R.; Greenland, P.; Feng, Y.Q.; Wang, H.; Zhong, V.W. Trends in prevalence of diabetes and control of risk factors in diabetes among US adults, 1999–2018. JAMA 2021, 326, 704–716. [Google Scholar] [CrossRef] [PubMed]
- US CDC. National and State Diabetes Trends. 2022. Available online: https://www.cdc.gov/diabetes/library/reports/reportcard/national-state-diabetes-trends.html (accessed on 30 March 2023).
- Navarro-Pérez, J.; Orozco-Beltran, D.; Gil-Guillen, V.; Pallares, V.; Valls, F.; Fernandez, A.; Perez-Navarro, A.M.; Sanchis, C.; Dominguez-Lucas, A.; Martin-Moreno, J.M.; et al. Mortality and cardiovascular disease burden of uncontrolled diabetes in a registry-based cohort: The ESCARVAL-risk study. BMC Cardiovasc. Disord. 2018, 18, 180. [Google Scholar] [CrossRef]
- Evert, A.B.; Dennison, M.; Gardner, C.D.; Garvey, W.T.; Lau, K.H.; MacLeod, J.; Mitri, J.; Pereira, R.F.; Rawlings, K.; Robinson, S.; et al. Nutrition therapy for adults with diabetes or prediabetes: A consensus report. Diabetes Care 2019, 42, 731–754. [Google Scholar] [CrossRef] [PubMed]
- Ley, S.H.; Hamdy, O.; Mohan, V.; Hu, F.B. Prevention and management of type 2 diabetes: Dietary components and nutritional strategies. Lancet 2014, 383, 1999–2007. [Google Scholar] [CrossRef] [PubMed]
- Reynolds, A.N.; Akerman, A.P.; Mann, J. Dietary fibre and whole grains in diabetes management: Systematic review and meta-analyses. PLoS Med. 2020, 17, e1003053.9. [Google Scholar] [CrossRef]
- Shan, Z.; Rehm, C.D.; Rogers, G.; Ruan, M.; Wang, D.D.; Hu, F.B.; Mozaffarian, D.; Zhang, F.F.; Bhupathiraju, S.N. Trends in dietary carbohydrate, protein, and fat intake and diet quality among US adults, 1999–2016. JAMA 2019, 322, 1178–1187. [Google Scholar] [CrossRef]
- Long, T.; Zhang, K.; Chen, Y.; Wu, C. Trends in Diet Quality Among Older US Adults From 2001 to 2018. JAMA Netw. Open 2022, 5, e221880. [Google Scholar] [CrossRef]
- Orr, C.J.; Keyserling, T.C.; Ammerman, A.S.; Berkowitz, S.A. Diet quality trends among adults with diabetes by socioeconomic status in the US: 1999–2014. BMC Endocr. Disord. 2019, 19, 54. [Google Scholar] [CrossRef]
- Brauchla, M.; Dekker, M.J.; Rehm, C.D. Trends in vitamin C consumption in the United States: 1999–2018. Nutrients 2021, 13, 420. [Google Scholar] [CrossRef]
- Sun, H.; Weaver, C.M. Decreased iron intake parallels rising iron deficiency anemia and related mortality rates in the US population. J. Nutr. 2021, 151, 1947–1955. [Google Scholar] [CrossRef]
- Sun, H.; Weaver, C.M. Rise in potassium deficiency in the us population linked to agriculture practices and dietary potassium deficits. J. Agric. Food Chem. 2020, 68, 11121–11127. [Google Scholar] [CrossRef]
- Fang, M.; Wang, D.; Coresh, J.; Selvin, E. Trends in diabetes treatment and control in US adults, 1999–2018. N. Engl. J. Med. 2021, 384, 2219–2228. [Google Scholar] [CrossRef]
- Ting, R.Z.; Szeto, C.C.; Chan, M.H.; Ma, K.K.; Chow, K.M. Risk factors of vitamin B12 deficiency in patients receiving metformin. Arch. Intern. Med. 2006, 166, 1975–1979. [Google Scholar] [CrossRef]
- Mason, S.A.; Keske, M.A.; Wadley, G.D. Effects of vitamin C supplementation on glycemic control and cardiovascular risk factors in people with type 2 diabetes: A GRADE-assessed systematic review and meta-analysis of randomized controlled trials. Diabetes Care 2021, 44, 618–630. [Google Scholar] [CrossRef]
- Sun, H.; Karp, J.; Sun, K.M.; Weaver, C.M. Decreasing vitamin C intake, low serum vitamin C level and risk for us adults with diabetes. Nutrients 2022, 14, 3902. [Google Scholar] [CrossRef]
- Soliman, A.T.; De Sanctis, V.; Yassin, M.; Soliman, N. Iron deficiency anemia and glucose metabolism. Acta Biomed. Atenei Parm. 2017, 88, 112. [Google Scholar]
- Ekmekcioglu, C.; Elmadfa, I.; Meyer, A.L.; Moeslinger, T. The role of dietary potassium in hypertension and diabetes. J. Physiol. Biochem. 2016, 72, 93–106. [Google Scholar] [CrossRef]
- Russo, G.T.; Di Benedetto, A.; Magazzù, D.; Giandalia, A.; Giorda, C.B.; Ientile, R.; Previti, M.; Di Cesare, E.; Cucinotta, D. Mild hyperhomocysteinemia, C677T polymorphism on methylenetetrahydrofolate reductase gene and the risk of macroangiopathy in type 2 diabetes: A prospective study. Acta Diabetol. 2011, 48, 95–101. [Google Scholar] [CrossRef] [PubMed]
- Yahia, E.M.; García-Solís, P.; Celis, M.E. Contribution of fruits and vegetables to human nutrition and health. In Postharvest Physiology and Biochemistry of Fruits and Vegetables; Woodhead Publishing: Sawston, UK, 2019; pp. 19–45. [Google Scholar]
- US CDC. National Center for Health Statistics NHANES Comprehensive Data List. Available online: https://wwwn.cdc.gov/nchs/nhanes/search/datapage.aspx (accessed on 30 March 2023).
- US CDC. NHANES 2019–2020 Procedure Manuals. Available online: https://wwwn.cdc.gov/nchs/nhanes/continuousnhanes/manuals.aspx?BeginYear=2019 (accessed on 30 March 2023).
- US CDC; National Center for Health Statistics. National Health and Nutrition Examination 364 Survey NCHS Research Ethics Review Board (ERB) Approval. 365. Available online: https://www.cdc.gov/nchs/nhanes/irba98.htm (accessed on 30 March 2023).
- Berkowitz, S.A.; Baggett, T.P.; Wexler, D.J.; Huskey, K.W.; Wee, C.C. Food insecurity and metabolic control among US adults with diabetes. Diabetes Care 2013, 36, 3093–3099. [Google Scholar] [CrossRef]
- Mosslemi, M.; Park, H.L.; McLaren, C.E.; Wong, N.D. A treatment-based algorithm for identification of diabetes type in the National health and nutrition examination survey. Cardiovasc. Endocrinol. Metab. 2020, 9, 9–16. [Google Scholar] [CrossRef]
- Bullard, K.M.; Cowie, C.C.; Lessem, S.E.; Saydah, S.H.; Menke, A.; Geiss, L.S.; Orchard, T.J.; Rolka, D.B.; Imperatore, G. Prevalence of diagnosed diabetes in adults by diabetes type—United States, 2016. Morb. Mortal. Wkly. Rep. 2018, 67, 359–361. [Google Scholar] [CrossRef] [PubMed]
- Levey, A.S.; Stevens, L.A.; Schmid, C.H.; Zhang, Y.; Castro, I.I.I.A.F.; Feldman, H.I.; Kusek, J.W.; Eggers, P.; Van Lente, F.; Greene, T.; et al. A new equation to estimate glomerular filtration rate. Ann. Intern. Med. 2009, 150, 604–612. [Google Scholar] [CrossRef] [PubMed]
- USDA. FPED Databases. 2023. Available online: https://www.ars.usda.gov/northeast-area/beltsville-md-bhnrc/beltsville-human-nutrition-research-center/food-surveys-research-group/docs/fped-databases/ (accessed on 30 March 2023).
- Carriquiry, A.L. Estimation of usual intake distributions of nutrients and foods. J. Nutri. 2003, 133, 601S–608S. [Google Scholar] [CrossRef]
- USDA. Health Eating Index. 2023. Available online: https://www.fns.usda.gov/healthy-eating-index-hei (accessed on 16 April 2023).
- US Department of Health and Human Services; US Department of Agriculture. 2015–2020 Dietary Guidelines for Americans, 8th ed.; December 2021. Estimation of Usual Intake Distributions of Nutrients and Foods. Available online: https://health.gov/sites/default/files/2019-09/2015-2020_Dietary_Guidelines.pdf (accessed on 19 April 2023).
- National Cancer Institute. Overview & Background of the Healthy Eating Index; 2023. Available online: https://epi.grants.cancer.gov/hei/ (accessed on 30 March 2023).
- Reedy, J.; Lerman, J.L.; Krebs-Smith, S.M.; Kirkpatrick, S.I.; Pannucci, T.E.; Wilson, M.M.; Subar, A.F.; Kahle, L.L.; Tooze, J.A. Evaluation of the healthy eating index-2015. J. Acad. Nutr. Diet. 2018, 118, 1622–1633. [Google Scholar] [CrossRef]
- Bowman, S.A.; Clemens, J.C.; Friday, J.E.; Moshfegh, A.J. Food Patterns Equivalents Database 2017–2018: Methodology and User Guide; Food Surveys Research Group: Beltsville, MD, USA, 2020. [Google Scholar]
- US National Cancer Institute. Usual Dietary Intakes. 2023. Available online: https://epi.grants.cancer.gov/diet/usualintakes/ (accessed on 30 March 2023).
- Luo, H.; Dodd, K.W.; Arnold, C.D.; Engle-Stone, R. Introduction to the SIMPLE macro, a tool to Increase the accessibility of 24-hour dietary recall analysis and modeling. J. Nutr. 2021, 151, 1329–1340. [Google Scholar] [CrossRef]
- Lloyd-Jones, D.M.; Hong, Y.; Labarthe, D.; Mozaffarian, D.; Appel, L.J.; Van Horn, L.; Greenlund, K.; Daniels, S.; Nichol, G.; Tomaselli, G.F.; et al. Defining and setting national goals for cardiovascular health promotion and disease reduction: The American Heart Association’s strategic impact goal through 2020 and beyond. Circulation 2010, 121, 586–613. [Google Scholar] [CrossRef]
- Tao, M.H.; Liu, J.L.; Nguyen, U.S. Trends in diet quality by race/ethnicity among adults in the United States for 2011–2018. Nutrients 2022, 14, 4178. [Google Scholar] [CrossRef]
- Hurrell, R.; Egli, I. Iron bioavailability and dietary reference values. Am. J. Clin. Nutr. 2010, 91, 1461S–1467S. [Google Scholar] [CrossRef]
- Zhong, V.W.; Van Horn, L.; Greenland, P.; Carnethon, M.R.; Ning, H.; Wilkins, J.T.; Lloyd-Jones, D.M.; Allen, N.B. Associations of processed meat, unprocessed red meat, poultry, or fish intake with incident cardiovascular disease and all-cause mortality. JAMA Intern. Med. 2020, 180, 503–512. [Google Scholar] [CrossRef]
- Luo, J.; Brunelli, S.M.; Jensen, D.E.; Yang, A. Association between serum potassium and outcomes in patients with reduced kidney function. Clin. J. Am. Soc. Nephrol. 2016, 11, 90–100. [Google Scholar] [CrossRef]
- US Department of Health and Human Services, CDC. National Diabetes Statistics Report. 2020. Available online: https://www.cdc.gov/diabetes/pdfs/data/statistics/national-diabetes-statistics-report.PDF (accessed on 30 March 2023).


| 1999–2000 | 2001–2002 | 2003–2004 | 2005–2006 | 2007–2008 | 2009–2010 | 2011–2012 | 2013–2014 | 2015–2016 | 2017–2018 | a p for Trend | ||
|---|---|---|---|---|---|---|---|---|---|---|---|---|
| Type 2 diabetes count | Total count | 581 | 648 | 643 | 609 | 970 | 934 | 880 | 881 | 1014 | 1083 | |
| Men | 290 | 331 | 327 | 306 | 485 | 491 | 450 | 446 | 535 | 566 | ||
| Women | 291 | 317 | 316 | 303 | 485 | 443 | 430 | 435 | 479 | 517 | ||
| Mexican A | 190 | 155 | 174 | 142 | 179 | 210 | 99 | 151 | 241 | 163 | ||
| Hispanic | 41 | 31 | 16 | 17 | 107 | 108 | 101 | 84 | 145 | 101 | ||
| NH White | 193 | 279 | 288 | 238 | 383 | 348 | 245 | 308 | 268 | 335 | ||
| NH Black | 136 | 155 | 138 | 190 | 272 | 210 | 299 | 217 | 230 | 265 | ||
| Others | 21 | 28 | 27 | 22 | 29 | 58 | 136 | 121 | 130 | 219 | ||
| Type 2 diabetes | % in total population (95% CI) | 7.1% | 8.0% | 9.0% | 9.0% | 10.6% | 10.5% | 10.9% | 11.4% | 13.2% | 13.5% | <0.001 |
| (6.2–8.2%) | (7.1–8.9%) | (7.8–10.4%) | (7.9–10.2%) | (9.4–12.0%) | (9.5–11.7%) | (9.7–12.1%) | (10.5–12.5%) | (11.6–15.0%) | (12.3–14.8%) | + | ||
| Age (95% CI) | 58.0 | 56.7 | 58.7 | 59.2 | 59.1 | 60.2 | 58.6 | 59.5 | 58.6 | 60.3 | ||
| (56–60.1) | (54.7–58.8) | (56.5–60.8) | (57.3–61.2) | (58–60.2) | (58.5–61.8) | (57.4–59.8) | (58.4–60.6) | (57.9–59.3) | (58.4–62.1) | |||
| b BMI (95% CI) | 32.3 | 32.5 | 32.0 | 33.1 | 33.0 | 33.5 | 33.4 | 33.5 | 32.8 | 33.6 | 0.001 | |
| (31.2–33.5) | (31.2–33.8) | (31.1–32.9) | (32.1–34) | (32.3–33.6) | (32.6–34.4) | (32.6–34.1) | (32.6–34.4) | (32.2–33.4) | (32.4–34.8) | + | ||
| c A1C (95% CI) | 7.8 | 7.3 | 7.1 | 7.0 | 7.1 | 7.1 | 7.4 | 7.3 | 7.2 | 7.2 | 0.098 | |
| (7.5–8) | (7.1–7.6) | (7–7.3) | (6.8–7.3) | (7–7.3) | (6.9–7.3) | (7.2–7.5) | (7.1–7.4) | (7–7.4) | (7–7.3) | + | ||
| d eGFR | 83.8 | 86.4 | 83.7 | 82.1 | 84.1 | 82.0 | 84.0 | 82.2 | 85.4 | 84.1 | 0.001 | |
| (95% CI) | (80.5–87.1) | (84.1–88.7) | (80.6–86.9) | (79.1–85.1) | (82.3–85.9) | (79.9–84.1) | (81.6–86.5) | (80.5–83.8) | (84.1–86.8) | (81.5–86.8) | + |
| 1999–2000 | 2001–2002 | 2003–2004 | 2005–2006 | 2007–2008 | 2009–2010 | 2011–2012 | 2013–2014 | 2015–2016 | 2017–2018 | % Change from 1999–2000 to 2017–2018 | a p | |
|---|---|---|---|---|---|---|---|---|---|---|---|---|
| Total HEI 2015 score | 52.35 | 52.27 | 50.79 | 51.49 | 51.39 | 51.40 | 51.61 | 51.64 | 50.68 | 50.52 | −3.5% | 0.02 |
| 50.8–53.9 | 49.9–54.7 | 49–52.6 | 50.2–52.8 | 50–52.8 | 50.2–52.6 | 49.8–53.4 | 50.4–52.9 | 49.7–51.6 | 49–52.1 | −7.6–0.6% | - | |
| HEI-2015 scores and their 95% CI of adequacy components | ||||||||||||
| Total vegetables (0–5) | 3.35 | 3.28 | 3.07 | 3.43 | 3.29 | 3.08 | 3.30 | 3.15 | 3.22 | 2.98 | −11.0% | 0.017 |
| 3.07–3.62 | 3.01–3.54 | 2.89–3.26 | 3.25–3.6 | 3.13–3.45 | 2.94–3.23 | 3.11–3.48 | 2.99–3.3 | 3.03–3.41 | 2.79–3.16 | −20.1–2.0% | - | |
| Greens and beans (0–5) | 1.40 | 1.16 | 1.14 | 1.25 | 1.46 | 1.46 | 1.26 | 1.49 | 1.60 | 1.48 | 5.8% | 0.038 |
| 1.15–1.65 | 0.97–1.35 | 0.92–1.37 | 1.04–1.47 | 1.22–1.7 | 1.3–1.62 | 1.08–1.45 | 1.25–1.74 | 1.34–1.85 | 1.25–1.72 | −19.3–30.8% | + | |
| Total fruit (0–5) | 2.71 | 2.50 | 2.42 | 2.39 | 2.24 | 2.34 | 2.09 | 2.02 | 2.00 | 2.16 | −20.2% | <0.001 |
| 2.4–3.01 | 2.15–2.86 | 2.1–2.74 | 2.2–2.57 | 2.03–2.45 | 2.12–2.57 | 1.93–2.24 | 1.84–2.2 | 1.8–2.21 | 1.94–2.38 | −32.2–8.2% | - | |
| Whole fruit (0–5) | 3.31 | 2.94 | 2.96 | 2.38 | 2.31 | 2.27 | 2.09 | 2.14 | 2.15 | 2.34 | −29.3% | <0.001 |
| 3.03–3.59 | 2.55–3.34 | 2.62–3.3 | 2.22–2.55 | 2.07–2.56 | 2.04–2.5 | 1.85–2.34 | 1.95–2.33 | 1.89–2.41 | 2.07–2.61 | −39.4–19.1% | - | |
| Whole grains (0–5) | 2.49 | 2.89 | 2.54 | 2.91 | 2.48 | 2.86 | 2.99 | 2.97 | 3.06 | 2.68 | 7.4% | 0.355 |
| 2.05–2.94 | 2.33–3.46 | 2.07–3.01 | 2.48–3.35 | 2.15–2.8 | 2.63–3.09 | 2.48–3.5 | 2.63–3.3 | 2.69–3.44 | 2.25–3.1 | −18.0–32.8% | + | |
| Total dairy (0–10) | 4.66 | 4.64 | 4.49 | 5.11 | 4.89 | 5.19 | 5.00 | 4.97 | 4.97 | 4.36 | −6.6% | 0.899 |
| 4.23–5.09 | 4.2–5.07 | 4.03–4.96 | 4.83–5.39 | 4.48–5.29 | 4.89–5.5 | 4.65–5.34 | 4.64–5.31 | 4.64–5.3 | 3.9–4.82 | −19.5–6.4% | - | |
| Total protein foods (0–5) | 4.23 | 4.13 | 4.24 | 4.36 | 4.43 | 4.41 | 4.30 | 4.24 | 4.28 | 4.18 | −0.9% | 0.9 |
| 4.1–4.34 | 3.87–4.38 | 4.05–4.42 | 4.21–4.51 | 4.36–4.51 | 4.31–4.5 | 4.19–4.4 | 4.13–4.36 | 4.12–4.44 | 4.04–4.33 | −5.3–3.5% | - | |
| Seafood & plant proteins (0–5) | 1.71 | 1.85 | 2.03 | 2.05 | 2.21 | 2.34 | 2.16 | 2.47 | 2.31 | 2.40 | 39.7% | <0.001 |
| 1.45–1.98 | 1.57–2.12 | 1.71–2.36 | 1.74–2.35 | 1.99–2.42 | 2.11–2.57 | 1.92–2.41 | 2.15–2.8 | 2.1–2.52 | 2.06–2.74 | 10.9–68.5% | + | |
| Fatty Acids (0–10) | 5.23 | 5.40 | 5.29 | 4.98 | 5.08 | 4.80 | 5.52 | 5.22 | 4.83 | 5.20 | −0.5% | 0.409 |
| 4.68–5.77 | 4.64–6.16 | 4.74–5.83 | 4.55–5.4 | 4.62–5.54 | 4.48–5.13 | 5.17–5.87 | 4.8–5.64 | 4.4–5.25 | 4.75–5.64 | −13.9–12.8% | - | |
| HEI-2015 scores and their 95% CI of moderation components | ||||||||||||
| Sodium (0–10) | 4.16 | 4.13 | 4.28 | 3.76 | 3.96 | 3.48 | 3.58 | 3.87 | 3.60 | 4.23 | 1.9% | 0.284 |
| 3.44–4.87 | 3.84–4.43 | 4.08–4.48 | 3.39–4.13 | 3.68–4.25 | 3.16–3.8 | 3.26–3.89 | 3.54–4.21 | 3.23–3.97 | 3.91–4.55 | −17.1–21.0% | + | |
| Refined grains (0–10) | 5.46 | 5.50 | 5.22 | 5.83 | 6.00 | 5.86 | 5.84 | 6.06 | 6.08 | 5.84 | 7.0% | <0.001 |
| 4.83–6.09 | 5–6 | 4.84–5.61 | 5.43–6.23 | 5.57–6.42 | 5.51–6.22 | 5.42–6.27 | 5.77–6.34 | 5.75–6.4 | 5.61–6.07 | −6.0–20.0% | + | |
| Saturated fats | 6.06 | 6.50 | 5.56 | 5.32 | 5.61 | 5.80 | 5.85 | 5.72 | 5.26 | 5.41 | −10.6% | 0.001 |
| (0–10) | 5.56–6.56 | 5.86–7.13 | 5.08–6.04 | 4.84–5.8 | 5.16–6.05 | 5.49–6.11 | 5.52–6.17 | 5.35–6.08 | 4.96–5.56 | 4.99–5.84 | −20.8–0.5% | - |
| Added sugars (0–10) | 7.62 | 7.36 | 7.55 | 7.73 | 7.45 | 7.50 | 7.64 | 7.32 | 7.34 | 7.26 | −4.5% | 0.026 |
| 7.1–8.1 | 6.8–7.9 | 7.1–8 | 7.4–8 | 7.1–7.8 | 7.2–7.8 | 7.2–8.1 | 7.1–7.5 | 7–7.7 | 7–7.5 | −12.1–3.1% | - | |
| 1999–2000 | 2001–2002 | 2003–2004 | 2005–2006 | 2007–2008 | 2009–2010 | 2011–2012 | 2013–2014 | 2015–2016 | 2017–2018 | % Change from 1999–2000 to 2017–2018 | a p | |
|---|---|---|---|---|---|---|---|---|---|---|---|---|
| Fruits and vegetables (cup equivalent) | ||||||||||||
| whole fruits | 0.52 | 0.41 | 0.48 | 0.14 | 0.22 | 0.17 | 0.17 | 0.17 | 0.24 | 0.29 | −45.3% | <0.001 |
| 0.35–0.69 | 0.33–0.49 | 0.33–0.63 | 0.1–0.19 | 0.14–0.31 | 0.13–0.21 | 0.14–0.2 | 0.1–0.24 | 0.17–0.31 | 0.19–0.38 | −71.1–19.5% | - | |
| Total fruits | 1.14 | 1.05 | 1.10 | 0.87 | 0.90 | 1.02 | 0.85 | 0.84 | 0.82 | 0.93 | −18.2% | 0.001 |
| 0.92–1.36 | 0.89–1.2 | 0.84–1.37 | 0.75–0.98 | 0.78–1.03 | 0.87–1.17 | 0.77–0.92 | 0.76–0.93 | 0.7–0.94 | 0.81–1.06 | −37.4–0.9% | - | |
| dark vegetables | 0.13 | 0.09 | 0.06 | 0.11 | 0.10 | 0.15 | 0.11 | 0.12 | 0.14 | 0.12 | −10.8% | 0.093 |
| 0.06–0.2 | 0.07–0.1 | 0.04–0.09 | 0.07–0.16 | 0.07–0.13 | 0.1–0.19 | 0.07–0.16 | 0.09–0.15 | 0.1–0.19 | 0.09–0.14 | −63.0–41.3% | - | |
| Tomato & products | 0.28 | 0.29 | 0.30 | 0.30 | 0.27 | 0.25 | 0.35 | 0.27 | 0.30 | 0.26 | −8.0% | 0.593 |
| 0.22–0.35 | 0.25–0.34 | 0.23–0.37 | 0.23–0.38 | 0.24–0.31 | 0.21–0.28 | 0.28–0.41 | 0.24–0.3 | 0.25–0.34 | 0.22–0.3 | −33.8–17.8% | - | |
| Potatoes | 0.38 | 0.46 | 0.43 | 0.36 | 0.35 | 0.35 | 0.44 | 0.36 | 0.36 | 0.36 | −4.3% | 0.172 |
| 0.31–0.44 | 0.38–0.54 | 0.35–0.52 | 0.3–0.42 | 0.3–0.4 | 0.3–0.4 | 0.33–0.55 | 0.3–0.41 | 0.31–0.42 | 0.31–0.41 | −25.6–16.9% | - | |
| total vegetables | 1.64 | 1.64 | 1.52 | 1.63 | 1.48 | 1.46 | 1.74 | 1.47 | 1.51 | 1.42 | −13.7% | 0.077 |
| 1.37–1.91 | 1.45–1.84 | 1.37–1.67 | 1.49–1.76 | 1.38–1.58 | 1.34–1.59 | 1.5–1.97 | 1.37–1.57 | 1.37–1.64 | 1.26–1.57 | −30.7–3.3% | - | |
| Grains, nuts, and seeds (ounce equivalent) | ||||||||||||
| Whole grains | 0.72 | 0.93 | 0.82 | 0.84 | 0.65 | 0.92 | 1.01 | 0.97 | 1.02 | 0.88 | 21.7% | 0.080 |
| 0.58–0.86 | 0.68–1.18 | 0.63–1.01 | 0.69–0.99 | 0.56–0.74 | 0.79–1.06 | 0.75–1.27 | 0.84–1.1 | 0.84–1.19 | 0.69–1.06 | −12.9–56.4% | + | |
| Refined grains | 5.42 | 5.57 | 5.92 | 5.12 | 5.11 | 5.46 | 5.60 | 5.29 | 5.21 | 5.43 | 0.2% | 0.310 |
| 4.86–5.98 | 4.83–6.31 | 5.39–6.44 | 4.75–5.5 | 4.75–5.48 | 5.15–5.77 | 5.07–6.13 | 5.09–5.5 | 4.85–5.58 | 5.01–5.86 | −12.7–13.2% | + | |
| Total grains | 6.14 | 6.50 | 6.73 | 5.96 | 5.76 | 6.39 | 6.61 | 6.26 | 6.23 | 6.31 | 2.7% | 0.818 |
| 5.56–6.72 | 5.56–7.45 | 6.13–7.33 | 5.58–6.35 | 5.39–6.13 | 6.07–6.7 | 6.03–7.19 | 6.01–6.51 | 5.84–6.62 | 5.82–6.79 | −9.7–15.2% | + | |
| Nuts and seeds | 0.39 | 0.46 | 0.71 | 0.51 | 0.60 | 0.54 | 0.63 | 0.71 | 0.63 | 0.77 | 54.4% | 0.001 |
| 0.23–0.54 | 0.31–0.6 | 0.48–0.93 | 0.36–0.65 | 0.46–0.74 | 0.44–0.65 | 0.49–0.77 | 0.57–0.85 | 0.46–0.79 | 0.65–0.89 | 18.8–89.9% | + | |
| Meat and fish (ounce equivalent) | ||||||||||||
| meat | 1.75 | 1.94 | 1.87 | 1.49 | 1.60 | 1.64 | 1.59 | 1.34 | 1.64 | 1.41 | −19.7% | 0.003 |
| 1.52–1.98 | 1.59–2.29 | 1.55–2.18 | 1.23–1.74 | 1.41–1.78 | 1.45–1.84 | 1.27–1.9 | 1.17–1.52 | 1.4–1.89 | 1.15–1.66 | −37.7–1.8% | - | |
| Poultry | 1.50 | 1.14 | 1.14 | 1.39 | 1.46 | 1.36 | 1.42 | 1.36 | 1.14 | 1.53 | 2.0% | 0.409 |
| 1.15–1.85 | 0.9–1.39 | 0.79–1.49 | 1.13–1.64 | 1.21–1.71 | 1.08–1.64 | 1.12–1.72 | 1.17–1.55 | 0.93–1.35 | 1.27–1.78 | −27.1–31.1% | + | |
| seafood | 0.79 | 0.76 | 0.84 | 0.53 | 0.48 | 0.81 | 0.60 | 0.75 | 0.64 | 0.67 | −15.7% | 0.501 |
| 0.43–1.16 | 0.55–0.96 | 0.54–1.13 | 0.35–0.71 | 0.36–0.59 | 0.54–1.07 | 0.36–0.83 | 0.54–0.96 | 0.28–1 | 0.45–0.89 | −63.0–31.5% | - | |
| Total meat | 4.79 | 4.63 | 4.73 | 4.66 | 4.68 | 5.19 | 4.62 | 4.46 | 4.58 | 4.61 | −3.8% | 0.617 |
| 4.32–5.26 | 4.17–5.09 | 4.14–5.32 | 4.16–5.16 | 4.31–5.05 | 4.83–5.54 | 4.21–5.04 | 4.08–4.83 | 3.9–5.27 | 4.16–5.05 | −16.9–9.3% | - | |
| Eggs (Ounce equivalents) and dairy (cups equivalents) | ||||||||||||
| Eggs | 0.54 | 0.58 | 0.56 | 0.59 | 0.54 | 0.54 | 0.66 | 0.57 | 0.64 | 0.64 | 18.0% | 0.180 |
| 0.37–0.71 | 0.46–0.7 | 0.48–0.63 | 0.43–0.76 | 0.47–0.61 | 0.46–0.62 | 0.55–0.77 | 0.43–0.7 | 0.54–0.75 | 0.52–0.76 | −25.5–61.6% | + | |
| Milk | 0.81 | 0.82 | 0.82 | 0.79 | 0.78 | 0.86 | 0.75 | 0.68 | 0.73 | 0.53 | −34.9% | <0.001 |
| 0.68–0.94 | 0.67–0.97 | 0.66–0.98 | 0.69–0.9 | 0.67–0.9 | 0.74–0.98 | 0.58–0.92 | 0.57–0.8 | 0.6–0.87 | 0.44–0.62 | −50.1–19.8% | - | |
| Cheese | 0.41 | 0.44 | 0.52 | 0.50 | 0.48 | 0.61 | 0.68 | 0.71 | 0.60 | 0.61 | 49.9% | <0.001 |
| 0.29–0.53 | 0.34–0.54 | 0.35–0.7 | 0.4–0.6 | 0.38–0.58 | 0.54–0.68 | 0.58–0.78 | 0.62–0.81 | 0.53–0.68 | 0.53–0.69 | 2.7–97.0% | + | |
| Total dairy | 1.24 | 1.31 | 1.36 | 1.35 | 1.33 | 1.53 | 1.51 | 1.48 | 1.43 | 1.21 | −1.9% | 0.295 |
| 1.1–1.3 | 1.1–1.5 | 1.1–1.6 | 1.2–1.5 | 1.2–1.5 | 1.4–1.7 | 1.3–1.7 | 1.3–1.6 | 1.3–1.6 | 1.1–1.4 | −16.1–12.2% | - | |
| Other macronutrients and energy | ||||||||||||
| Oils (grams) | 13.60 | 16.18 | 18.96 | 20.00 | 19.64 | 20.06 | 24.65 | 25.14 | 26.16 | 27.29 | 100.6% | <0.001 |
| 11.2–16 | 13.8–18.6 | 16.3–21.6 | 18.2–21.8 | 17.9–21.4 | 18.1–22 | 22.8–26.5 | 23.6–26.7 | 23.4–28.9 | 25–29.6 | 61.8–139.4% | + | |
| Solid Fats (grams) | 42.53 | 40.02 | 44.61 | 38.47 | 36.24 | 37.57 | 36.84 | 33.24 | 33.60 | 33.90 | −20.3% | <0.001 |
| 38.1–47 | 35.4–44.6 | 40.3–48.9 | 34.2–42.7 | 33.4–39.1 | 35.6–39.5 | 33.9–39.8 | 30.3–36.2 | 31–36.2 | 31.2–36.6 | −30.8–9.8% | - | |
| Added Sugars (tsp. Equivalent) | 13.38 | 13.28 | 12.91 | 11.84 | 13.25 | 13.83 | 12.79 | 13.84 | 14.13 | 14.17 | 5.9% | 0.031 |
| 10.9–15.9 | 11–15.5 | 10.9–14.9 | 10.4–13.3 | 11.5–15 | 12.5–15.2 | 11.3–14.3 | 12.5–15.2 | 12.6–15.7 | 12.6–15.8 | −17.1–28.9% | + | |
| Energy (kcal) | 1837 | 1894 | 1991 | 1844 | 1843 | 1955 | 1987 | 1920 | 1944 | 1943 | 5.7% | 0.058 |
| 1718–1956 | 1786–2002 | 1856–2126 | 1725–1962 | 1757–1929 | 1873–2038 | 1890–2083 | 1855–1985 | 1814–2075 | 1832–2055 | −3.3–14.9% | + | |
| b Sfat/energy percent | 10.8% | 10.4% | 11.6% | 12% | 11.4% | 11.3% | 11.2% | 11.3% | 11.8% | 11.6% | 7.7% | + |
| 10.3–11.3% | 9.6–11.1% | 11–12.1% | 11.4–12.5% | 11–11.9% | 11–11.6% | 10.9–11.4% | 10.8–11.7% | 11.4–12.2% | 11.1–12.1% | 0.7%–14.6% | 0.03 | |
| 2003–2004 | 2005–2006 | 2007–2008 | 2009–2010 | 2011–2012 | 2013–2014 | 2015–2016 | 2017–2018 | 2017–2020 | a p | |
|---|---|---|---|---|---|---|---|---|---|---|
| Estimated median (and standard errors) of usual intake of dietary + supplement intake (mg/24 h) | ||||||||||
| VC | 94.2 (8.3) | 89.9 (3.9) | 85.2 (7) | 87.8 (5) | 88.5 (5.3) | 87.2 (4.8) | 90.7 (6.4) | 87.7 (6.2) | 89.7 (4.2) | <0.01 - |
| VB12 | 5.5 (0.4) | 5.7 (0.4) | 5.5 (0.2) | 6.4 (0.3) | 5.9 (0.5) | 5.2 (0.3) | 5.6 (0.6) | 6 (0.5) | 6.2 (0.3) | <0.01 + |
| Fe | 14.9 (0.7) | 14.9 (0.4) | 14.3 (0.5) | 15.5 (0.6) | 15.1 (0.6) | 14.4 (0.4) | 14.6 (0.6) | 14 (0.5) | 13.5 (0.4) | <0.01 - |
| K | 2614 (76) | 2466 (88) | 2444 (51) | 2547 (74) | 2654 (144) | 2501 (30) | 2517 (79) | 2438 (88) | 2428 (64) | <0.01 - |
| Estimated median (and standard errors) of usual intake of dietary intake only (mg/24 h) | ||||||||||
| VC | 73.4 (7) | 66.2 (2.8) | 63.7 (3.7) | 68.4 (3.2) | 69.6 (4.1) | 59 (2.7) | 60.7 (3.7) | 62.7 (3.9) | 62.3 (3.1) | <0.01 - |
| VB12 | 4.8 (0.14) | 5.2 (0.11) | 4.9 (0.14) | 5 (0.08) | 4.9 (0.1) | 4.6 (0.11) | 4.6 (0.12) | 4.5 (0.12) | 4.3 (0.08) | <0.01 - |
| Fe | 14.1 (0.55) | 14.3 (0.36) | 13.7 (0.43) | 14.4 (0.45) | 14.5 (0.57) | 13.3 (0.29) | 13.6 (0.52) | 12.9 (0.45) | 12.7 (0.32) | <0.01 - |
| K | 2517 (82) | 2428 (89) | 2430 (59) | 2536 (73) | 2650 (136) | 2485 (43) | 2503 (87) | 2450 (94) | 2421 (68) | <0.01 - |
| Percent (%) of inadequate intake (and standard error) with dietary and supplement intake | ||||||||||
| VC | 34.6 (4.4) | 35 (2.6) | 39.6 (3.5) | 37.1 (3.1) | 35.2 (4.2) | 35.8 (3.3) | 37.2 (3.1) | 36.5 (4) | 36.8 (2.3) | <0.01 + |
| VB12 | 2.9 (1.11) | 2.2 (1.75) | 1.5 (0.79) | 1.4 (0.8) | 3.4 (1.16) | 1.5 (0.96) | 2.3 (2.84) | 5.7 (1.35) | 4.4 (0.8) | <0.01 + |
| Fe | 0.8 (0.61) | 0.8 (0.41) | 1.3 (0.52) | 1.5 (0.45) | 1.1 (0.57) | 1.4 (0.85) | 1.9 (0.76) | 2.8 (0.9) | 2.7 (0.61) | <0.01 + |
| K | 64.4 (3.2) | 69.9 (3.2) | 74.3 (2.4) | 70 (2.9) | 65.4 (6.4) | 70.2 (2.2) | 70.1 (3.5) | 73.2 (2.3) | 74.2 (2.2) | <0.01 + |
| Percent (%) of inadequate intake (and standard error) with only dietary intake | ||||||||||
| VC | 44.5 (5.8) | 50.2 (2.8) | 53.7 (3.6) | 49.2 (2.9) | 47.6 (4.3) | 58.9 (2.9) | 56.8 (3.5) | 54.8 (3.6) | 55.1 (3.1) | <0.01 + |
| VB12 | 3 (0.72) | 2.8 (0.53) | 2.6 (0.66) | 1.9 (0.34) | 3.3 (0.73) | 3.8 (0.92) | 4.1 (0.68) | 6 (1.05) | 6.1 (0.78) | <0.01 + |
| Fe | 0.9 (0.65) | 0.8 (0.45) | 1.4 (0.41) | 1.6 (0.48) | 1.3 (0.57) | 2.1 (1) | 2.5 (1.08) | 3.1 (0.87) | 2.9 (0.69) | <0.01 + |
| K | 67.5 (3) | 72.4 (3.4) | 75.6 (2.1) | 70.3 (2.8) | 65.5 (5.7) | 71.2 (1.8) | 71.1 (3.7) | 72.6 (2.9) | 74.4 (2.6) | <0.01 + |
Disclaimer/Publisher’s Note: The statements, opinions and data contained in all publications are solely those of the individual author(s) and contributor(s) and not of MDPI and/or the editor(s). MDPI and/or the editor(s) disclaim responsibility for any injury to people or property resulting from any ideas, methods, instructions or products referred to in the content. |
© 2023 by the authors. Licensee MDPI, Basel, Switzerland. This article is an open access article distributed under the terms and conditions of the Creative Commons Attribution (CC BY) license (https://creativecommons.org/licenses/by/4.0/).
Share and Cite
Sun, H.; Weaver, C.M. Trends in Diet Quality and Increasing Inadequacies of Micronutrients Vitamin C, Vitamin B12, Iron and Potassium in US Type 2 Diabetic Adults. Nutrients 2023, 15, 1980. https://doi.org/10.3390/nu15081980
Sun H, Weaver CM. Trends in Diet Quality and Increasing Inadequacies of Micronutrients Vitamin C, Vitamin B12, Iron and Potassium in US Type 2 Diabetic Adults. Nutrients. 2023; 15(8):1980. https://doi.org/10.3390/nu15081980
Chicago/Turabian StyleSun, Hongbing, and Connie M. Weaver. 2023. "Trends in Diet Quality and Increasing Inadequacies of Micronutrients Vitamin C, Vitamin B12, Iron and Potassium in US Type 2 Diabetic Adults" Nutrients 15, no. 8: 1980. https://doi.org/10.3390/nu15081980
APA StyleSun, H., & Weaver, C. M. (2023). Trends in Diet Quality and Increasing Inadequacies of Micronutrients Vitamin C, Vitamin B12, Iron and Potassium in US Type 2 Diabetic Adults. Nutrients, 15(8), 1980. https://doi.org/10.3390/nu15081980