
Prolonged Egg Supplement Advances Growing Child’s Growth and Gut Microbiota

 , , , , , and
 Highlights
- Whole egg supplementation (10 eggs per week) significantly improved growth parameters, leading to greater increases in weight and height in undernourished children compared to the control and protein substitute groups;
- Whole egg supplementation enhanced nutritional biomarkers, with a notable increase in plasma prealbumin levels, indicating improved protein status;
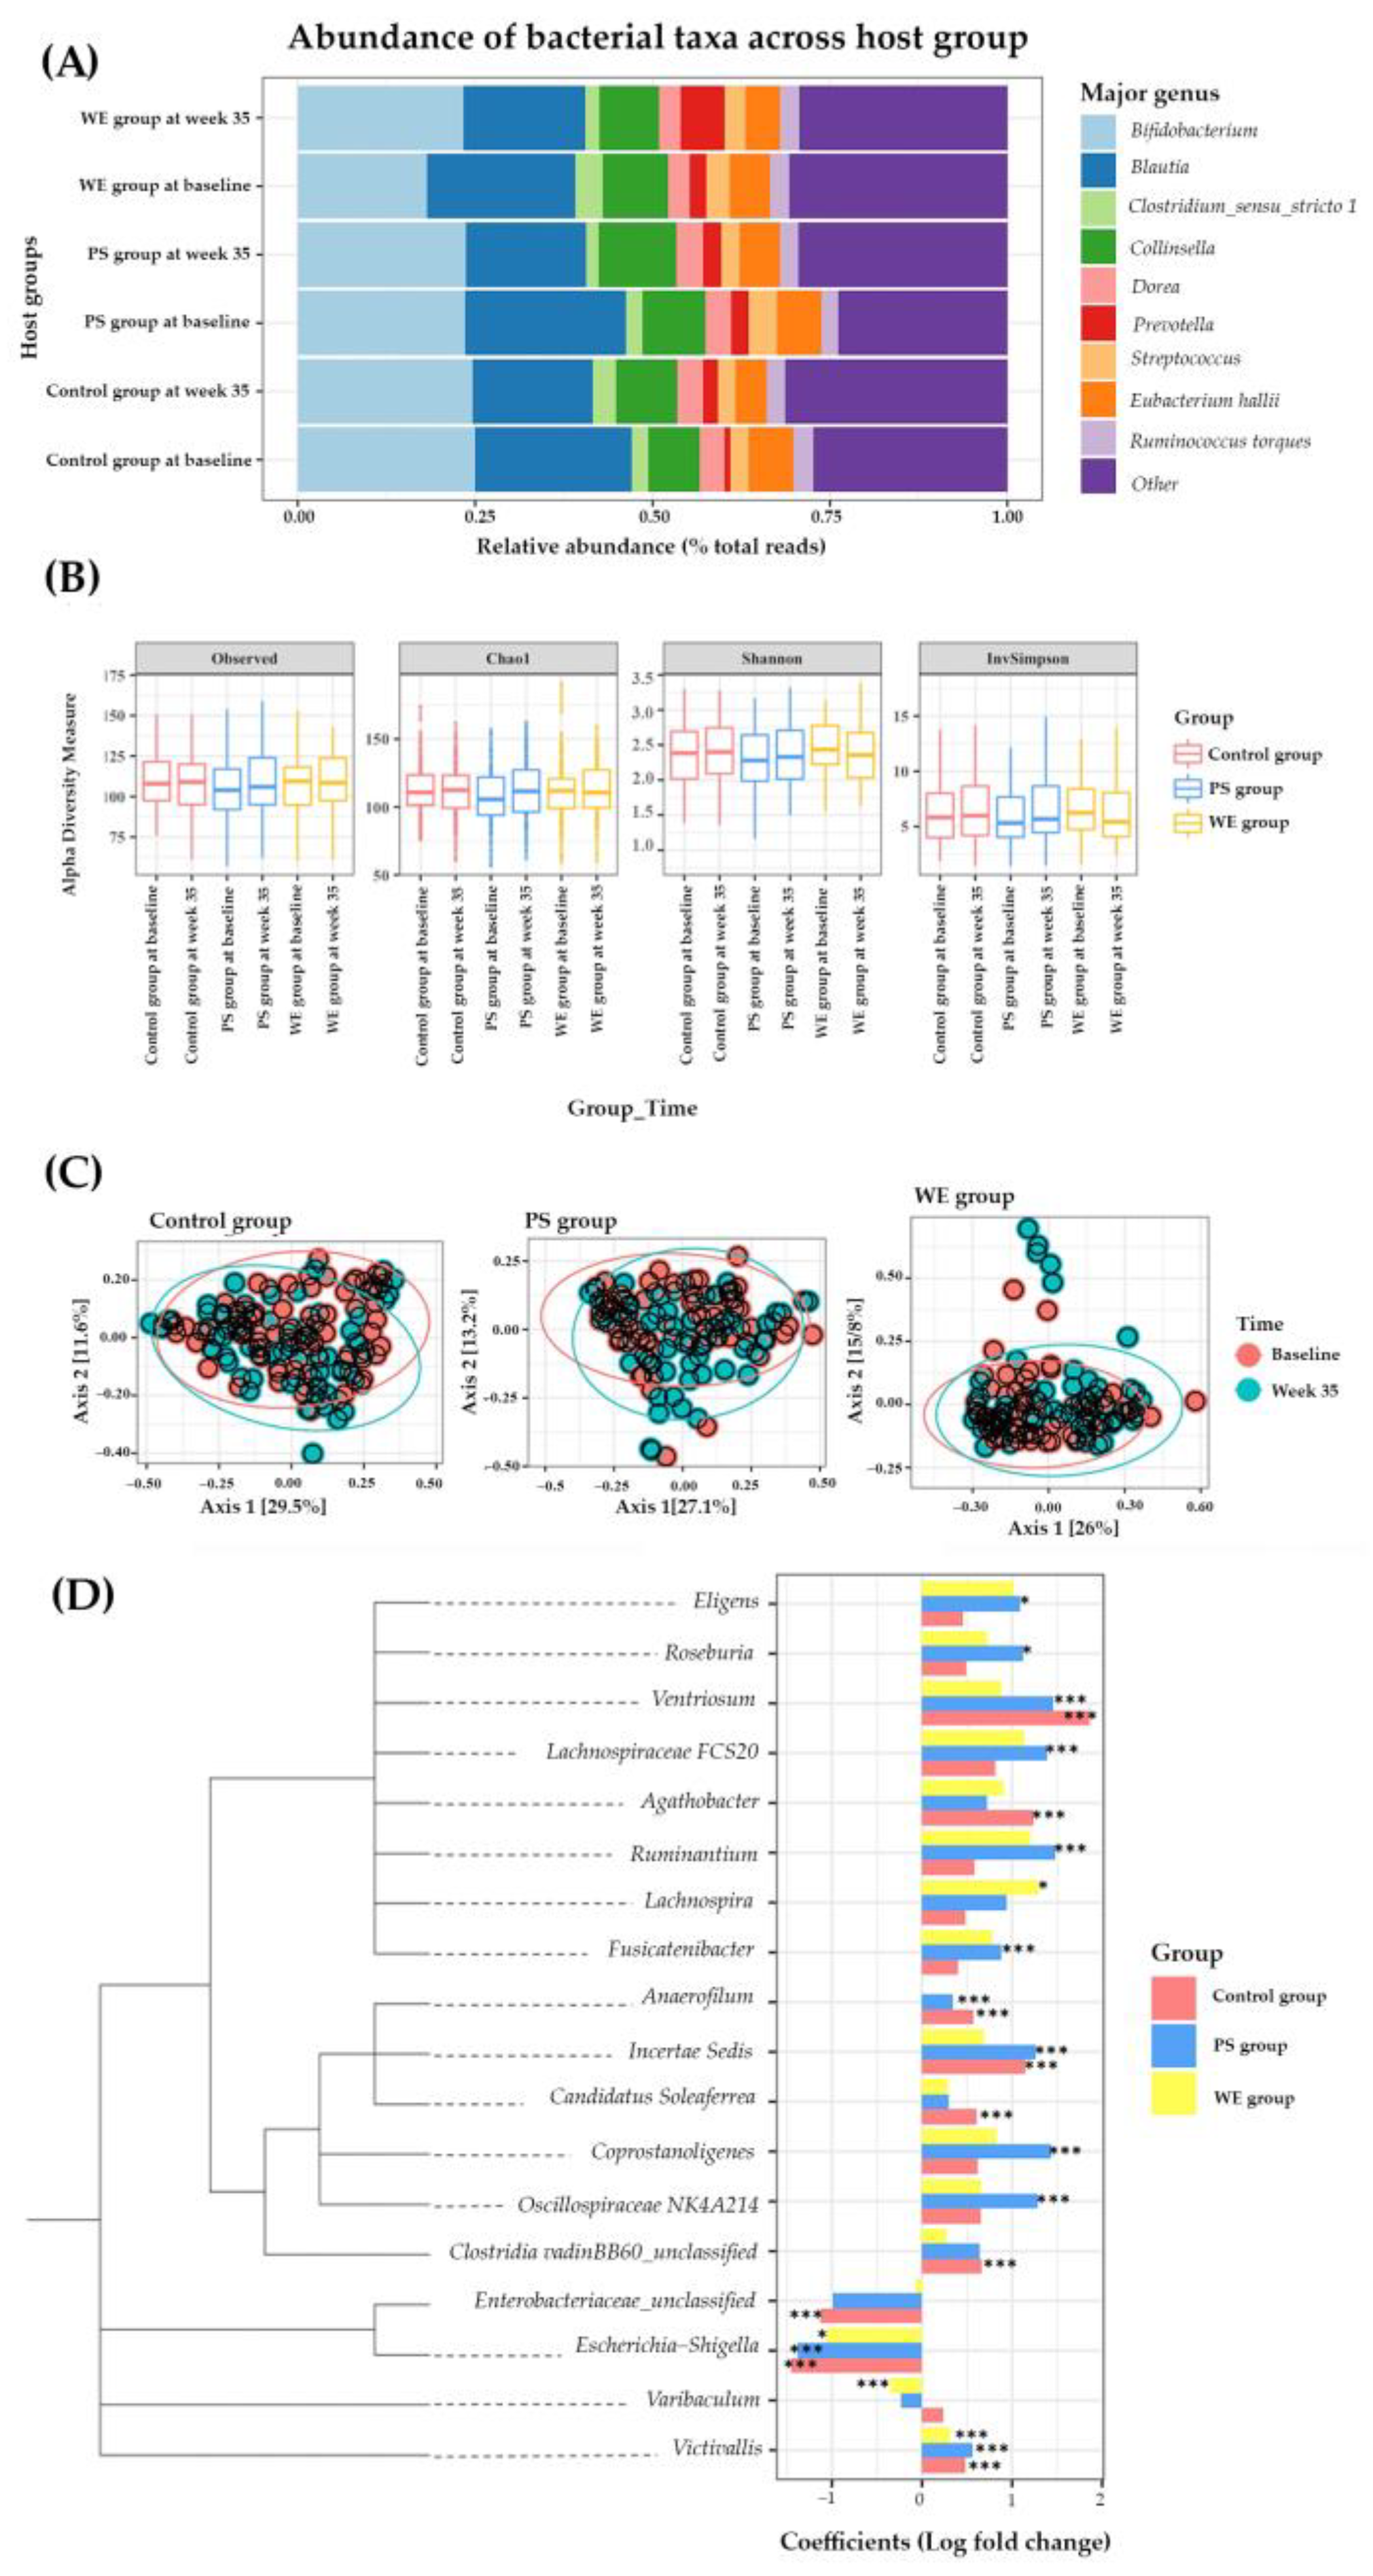
- Whole egg supplementation positively impacted gut microbiota, associated with the increased abundance of Bifidobacterium, which is associated with better health outcomes in malnourished children;
- Prolonged whole egg consumption did not negatively affect blood lipid profiles, and HDL cholesterol levels even increased, suggesting potential cardiovascular benefits.
- Whole egg supplementation could be an effective strategy against malnutrition, addressing stunting, low weight, and wasting in school-aged children;
- Whole eggs offer essential nutrients that boost key biomarkers such as prealbumin, improving overall nutritional health;
- Dietary interventions such as egg supplementation promote a healthy gut microbiome, crucial for child development;
- The findings challenge concerns over egg intake and cardiovascular risk, showing that increased levels of HDL may be potentially beneficial to heart health.
Abstract
1. Introduction
2. Materials and Methods
2.1. Study Design and Setting
2.2. Sample Size Calculation
2.3. Participants and Intervention
2.4. Diet Assessment
2.5. Outcomes
2.5.1. Anthropometric Measurements
2.5.2. Blood Test
2.5.3. Gut Microbiota Analysis
2.6. Statistical Analysis
3. Results
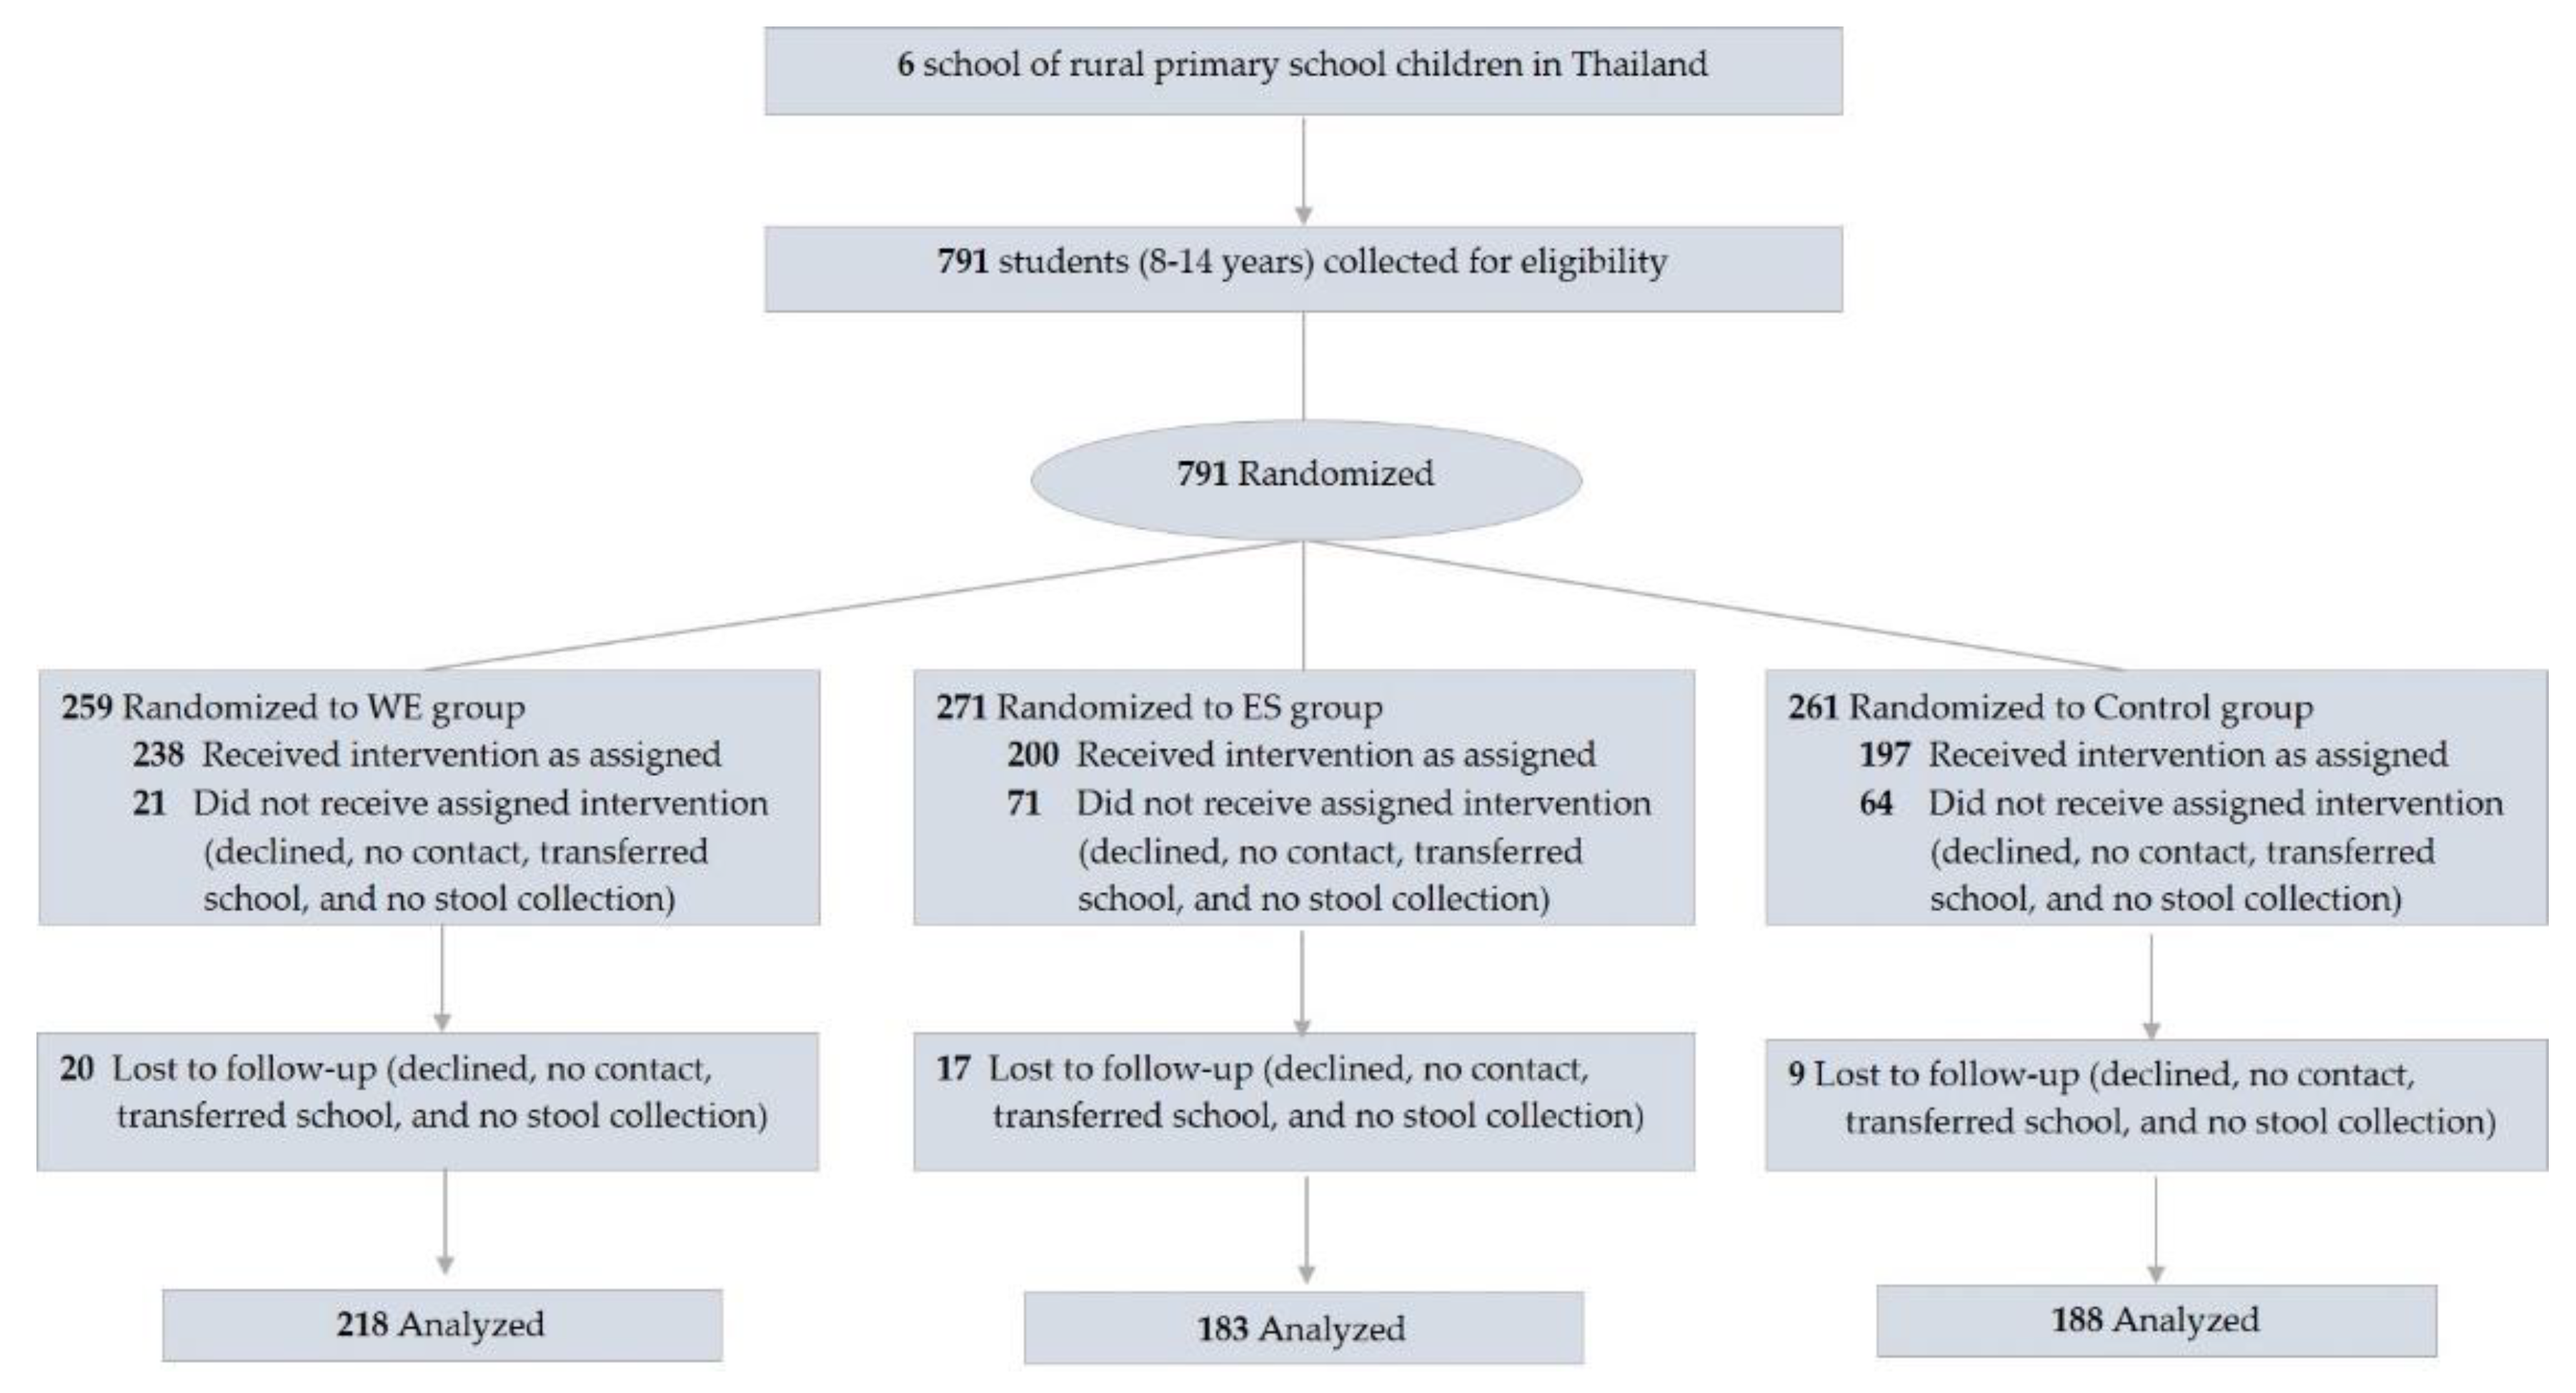
3.1. Participants
3.2. Outcome
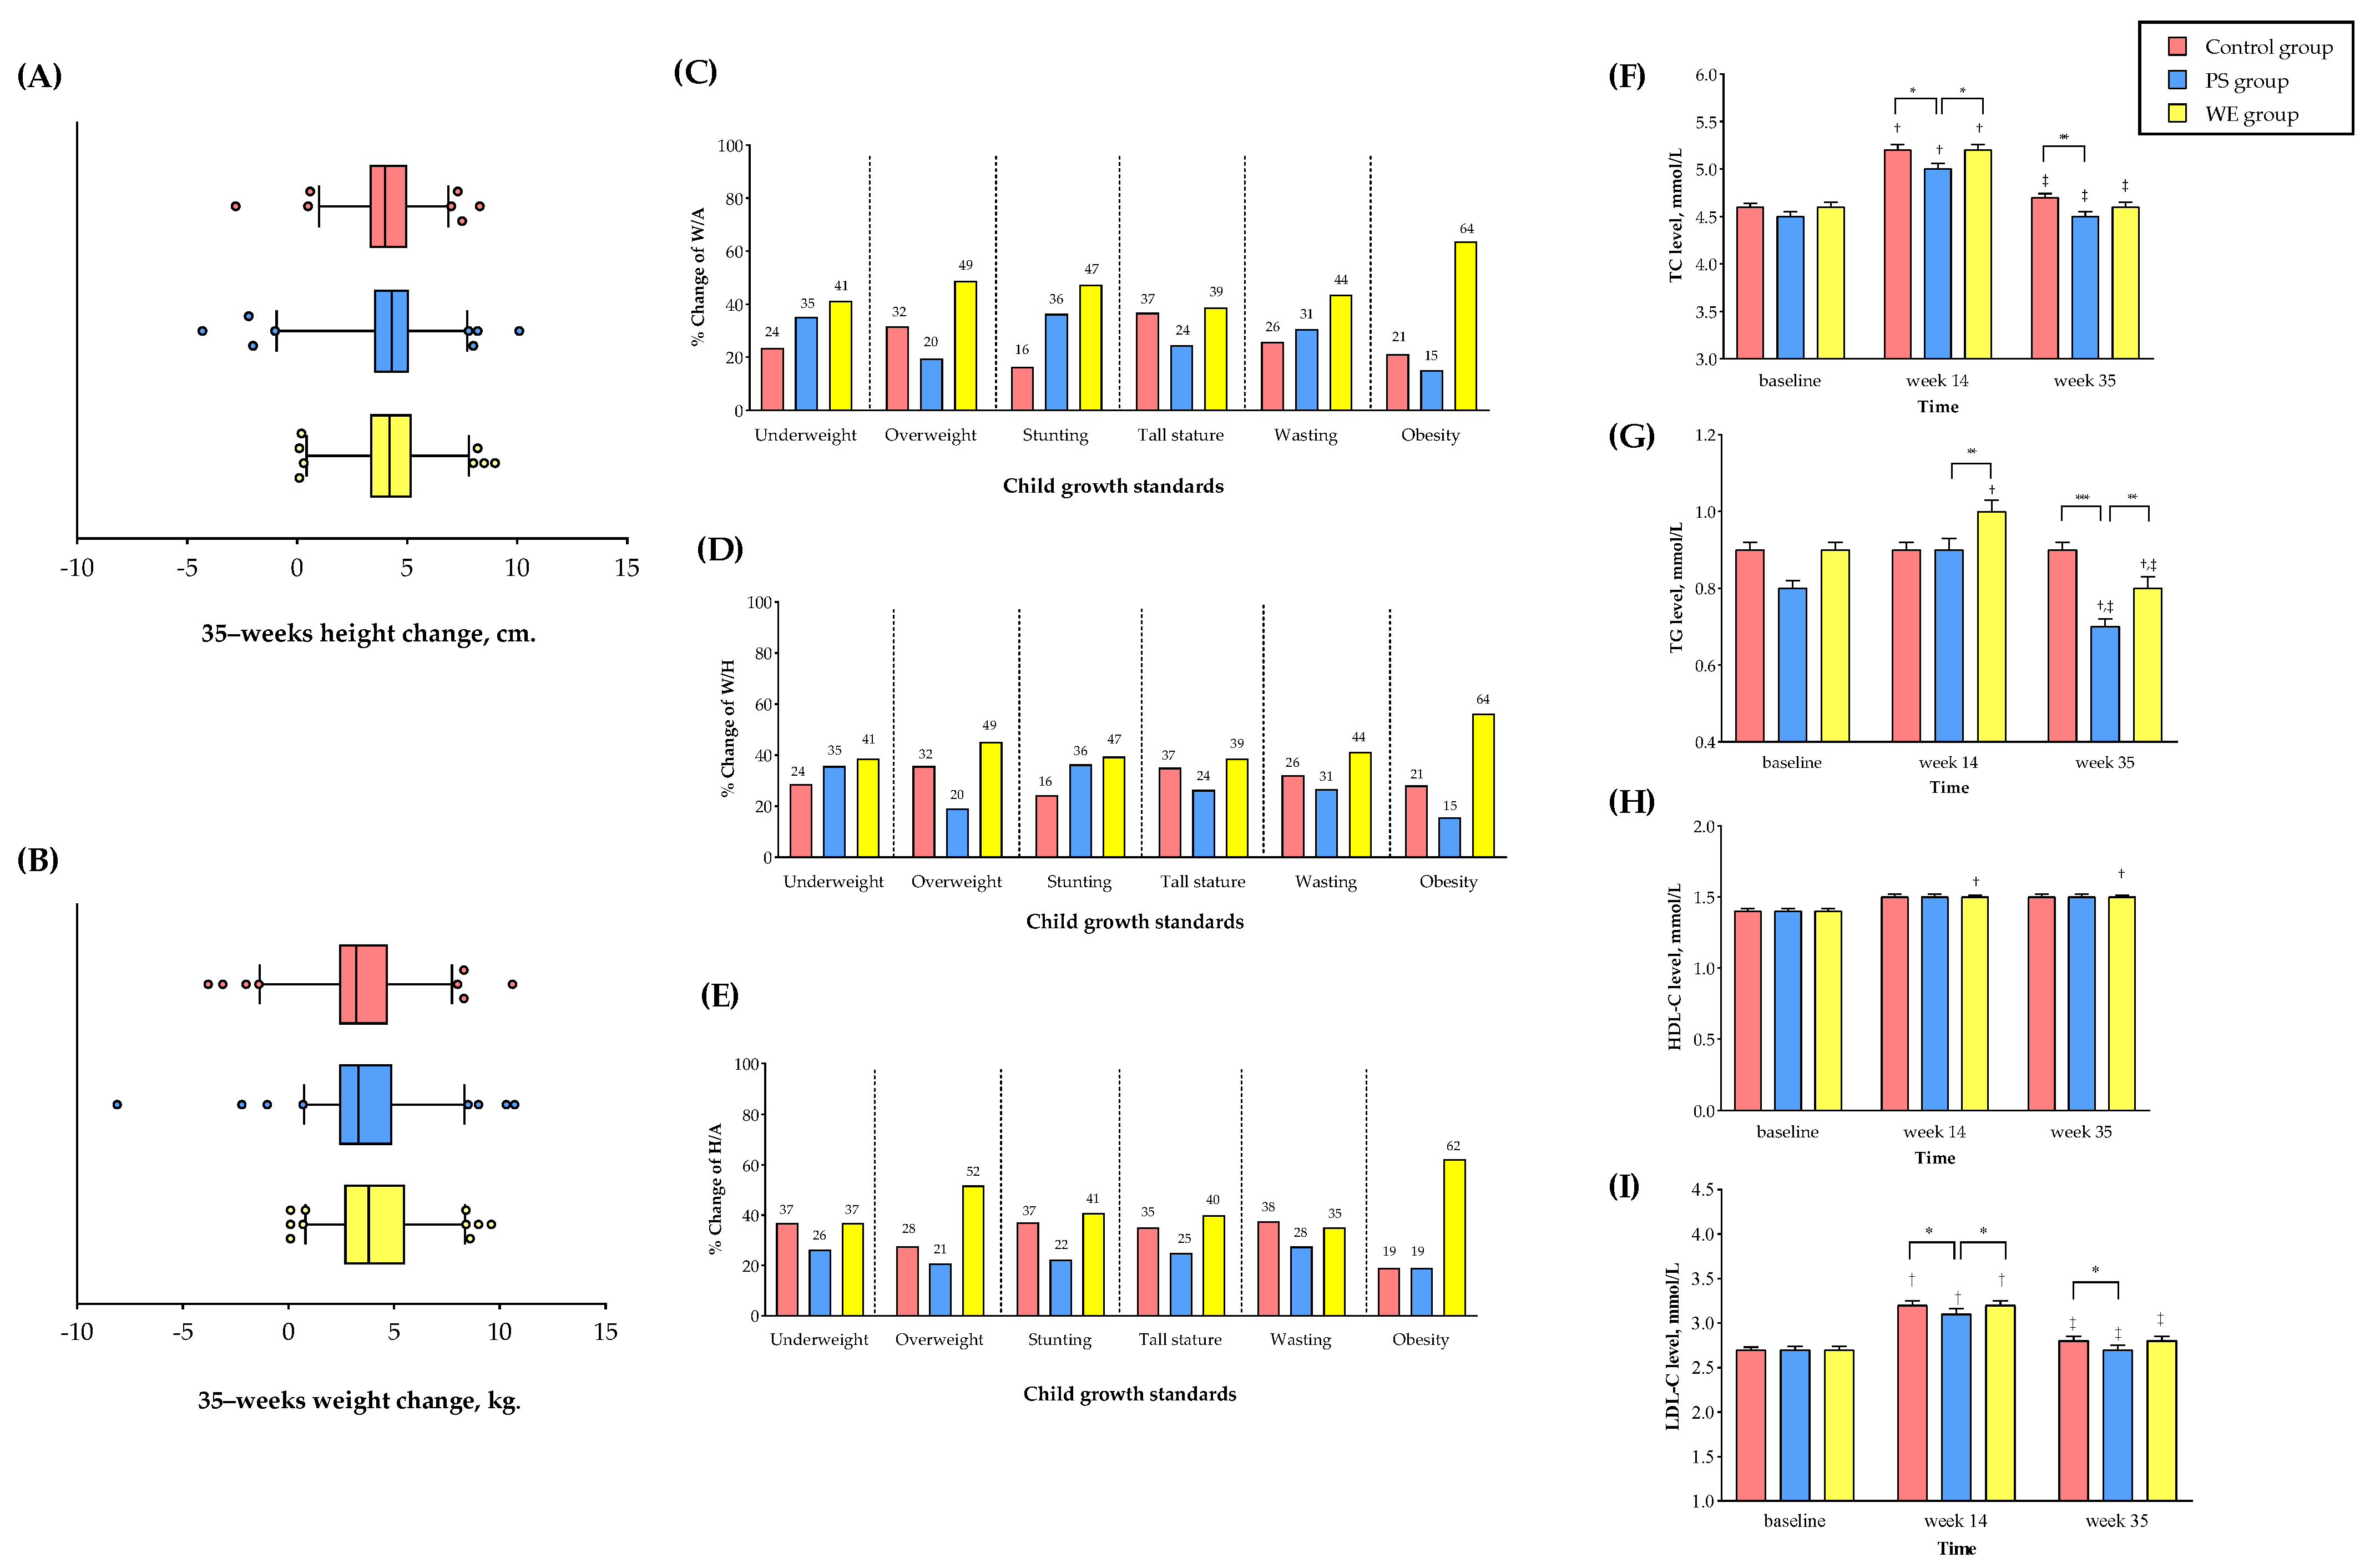
3.2.1. Whole Egg Consumption Improved Growth
3.2.2. Plasma Protein
3.2.3. Cardiometabolic Variables
3.2.4. Gut Microbiota
4. Discussion
5. Conclusions
Supplementary Materials
Author Contributions
Funding
Institutional Review Board Statement
Informed Consent Statement
Data Availability Statement
Acknowledgments
Conflicts of Interest
References
- Winichagoon, P. Scaling up a community-based program for maternal and child nutrition in Thailand. Food Nutr. Bull. 2014, 35, S27–S33. [Google Scholar] [CrossRef]
- Poh, B.K.; Rojroonwasinkul, N.; Le Nyugen, B.K.; Budiman, B.; Ng, L.O.; Soonthorndhada, K.; Xuyen, H.T.; Deurenberg, P.; Parikh, P. Relationship between anthropometric indicators and cognitive performance in Southeast Asian school-aged children. Br. J. Nutr. 2013, 110, S57–S64. [Google Scholar] [CrossRef]
- Padhani, Z.A.; Das, J.K.; Akhtar, S.; Ismail, T.; Bhutta, Z.A. Tackling protein-calorie malnutrition during world crises. Ann. Nutr. Metab. 2022, 78, 27–37. [Google Scholar] [CrossRef] [PubMed]
- Mayurasakorn, K.; Pinsawas, B.; Mongkolsucharitkul, P.; Sranacharoenpong, K.; Damapong, S.N. School closure, COVID-19 and lunch programme: Unprecedented undernutrition crisis in low-middle income countries. J. Paediatr. Child Health 2020, 56, 1013–1017. [Google Scholar] [CrossRef] [PubMed]
- Levels and Trends in Child Malnutrition 2019. Available online: https://www.who.int/publications/i/item/9789240025257 (accessed on 20 July 2022).
- Petchoo, J.; Kaewchutima, N.; Tangsuphoom, N. Nutritional quality of lunch meals and plate waste in school lunch programme in Southern Thailand. J. Nutr. Sci. 2022, 11, E35. [Google Scholar] [CrossRef] [PubMed]
- Shinde, S.; Wang, D.; Fawzi, W.W. School-based interventions targeting double burden of malnutrition and educational outcomes of adolescents in low- and middle-income countries: Protocol for a systematic review. Syst. Rev. 2021, 10, 204. [Google Scholar] [CrossRef] [PubMed]
- Rojroongwasinkul, N.; Kijboonchoo, K.; Wimonpeerapattana, W.; Purttiponthanee, S.; Yamborisut, U.; Boonpraderm, A.; Kunapan, P.; Thasanasuwan, W.; Khouw, I. SEANUTS: The nutritional status and dietary intakes of 0.5–12-year-old Thai children. Br. J. Nutr. 2013, 110, S36–S44. [Google Scholar] [CrossRef]
- Carrera, P.M.; Gao, X.; Tucker, K.L. A study of dietary patterns in the Mexican-American population and their association with obesity. J. Am. Diet. Assoc. 2007, 107, 1735–1742. [Google Scholar] [CrossRef] [PubMed]
- Zeisel, S.H.; Mar, M.H.; Howe, J.C.; Holden, J.M. Concentrations of choline-containing compounds and betaine in common foods. J. Nutr. 2003, 133, 1302–1307. [Google Scholar] [CrossRef]
- Iannotti, L.L.; Lutter, C.K.; Bunn, D.A.; Stewart, C.P. Eggs: The uncracked potential for improving maternal and young child nutrition among the world’s poor. Nutr. Rev. 2014, 72, 355–368. [Google Scholar] [CrossRef]
- Lutter, C.K.; Iannotti, L.L.; Stewart, C.P. Cracking the egg potential during pregnancy and lactation. Sight Life 2016, 30, 74–80. [Google Scholar]
- Iannotti, L.L.; Lutter, C.K.; Stewart, C.P.; Gallegos Riofrío, C.A.; Malo, C.; Reinhart, G.; Palacios, A.; Karp, C.; Chapnick, M.; Cox, K.; et al. Eggs in Early Complementary Feeding and Child Growth: A Randomized Controlled Trial. Pediatrics 2017, 140, e20163459. [Google Scholar] [CrossRef] [PubMed]
- McKune, S.L.; Stark, H.; Sapp, A.C.; Yang, Y.; Slanzi, C.M.; Moore, E.V.; Omer, A.; Wereme N’Diaye, A. Behavior change, egg consumption, and child nutrition: A cluster randomized controlled trial. Pediatrics 2020, 146, e2020007930. [Google Scholar] [CrossRef] [PubMed]
- Kane, A.V.; Dinh, D.M.; Ward, H.D. Childhood malnutrition and the intestinal microbiome. Pediatr. Res. 2015, 77, 256–262. [Google Scholar] [CrossRef] [PubMed]
- Tang, W.W.; Kitai, T.; Hazen, S.L. Gut microbiota in cardiovascular health and disease. Circ. Res. 2017, 120, 1183–1196. [Google Scholar] [CrossRef] [PubMed]
- Iddrisu, I.; Monteagudo-Mera, A.; Poveda, C.; Pyle, S.; Shahzad, M.; Andrews, S.; Walton, G.E. Malnutrition and Gut Microbiota in Children. Nutrients 2021, 13, 2727. [Google Scholar] [CrossRef]
- Thomas, M.S.; DiBella, M.; Blesso, C.N.; Malysheva, O.; Caudill, M.; Sholola, M.; Cooperstone, J.L.; Fernandez, M.L. Comparison between Egg Intake versus Choline Supplementation on Gut Microbiota and Plasma Carotenoids in Subjects with Metabolic Syndrome. Nutrients 2022, 14, 1179. [Google Scholar] [CrossRef]
- Liu, X.; Shao, Y.; Sun, J.; Tu, J.; Wang, Z.; Tao, J.; Chen, J. Egg consumption improves vascular and gut microbiota function without increasing inflammatory, metabolic, and oxidative stress markers. Food Sci. Nutr. 2022, 10, 295–304. [Google Scholar] [CrossRef]
- Schulz, K.F.; Altman, D.G.; Moher, D. CONSORT 2010 statement: Updated guidelines for reporting parallel group randomised trials. BMJ 2010, 340, c332. [Google Scholar] [CrossRef]
- Gibson, R.S. Principles of Nutritional Assessment, 2nd ed.; Oxford University Press: Oxford, UK, 2005; pp. 41–46. [Google Scholar]
- Institute of Nutrition Research Mahidol University (INMU). INMU Thai Growth Program for Nutritional Assessment (Using Weight for Height References from Thai National Survey, Department of Health, Ministry of Public Health); Institute of Nutrition Research: Nakhon Pathom, Thailand, 2002. [Google Scholar]
- Onubi, O.J.; Poobalan, A.S.; Dineen, B.; Marais, D.; McNeill, G. Effects of probiotics on child growth: A systematic review. J. Health Popul. Nutr. 2015, 34, 8. [Google Scholar] [CrossRef]
- Perin, J.; Burrowes, V.; Almeida, M.; Ahmed, S.; Haque, R.; Parvin, T.; Biswas, S.; Azmi, I.J.; Bhuyian, S.I.; Talukder, K.A.; et al. A Retrospective Case–Control Study of the Relationship between the Gut Microbiota, Enteropathy, and Child Growth. Am. J. Trop. Med. Hyg. 2020, 103, 520–527. [Google Scholar] [CrossRef] [PubMed]
- World Health Statistics 2018: Monitoring Health for the SDGs, Sustainable Development Goals: World Health Organization 2018. Available online: https://apps.who.int/iris/bitstream/handle/10665/272596/9789241565585-eng.pdf?sequence=1&isAllowed=y (accessed on 20 July 2022).
- Papanikolaou, Y.; Fulgoni III, V.L. Egg consumption in US children is associated with greater daily nutrient intakes, including protein, lutein+ zeaxanthin, choline, α-linolenic acid, and docosahexanoic acid. Nutrients 2019, 11, 1137. [Google Scholar] [CrossRef] [PubMed]
- Papanikolaou, Y.; Fulgoni III, V.L. Patterns of Egg Consumption Can Help Contribute to Nutrient Recommendations and Are Associated with Diet Quality and Shortfall Nutrient Intakes. Nutrients 2021, 13, 4094. [Google Scholar] [CrossRef] [PubMed]
- Iannotti, L.L.; Chapnick, M.; Nicholas, J.; Gallegos-Riofrio, C.A.; Moreno, P.; Douglas, K.; Habif, D.; Cui, Y.; Stewart, C.; Lutter, C.K.; et al. Egg intervention effect on linear growth no longer present after two years. Matern. Child Nutr. 2020, 16, e12925. [Google Scholar] [CrossRef]
- Mosites, E.; Thumbi, S.M.; Otiang, E.; McElwain, T.F.; Njenga, M.K.; Rabinowitz, P.M.; Rowhani-Rahbar, A.; Neuhouser, M.L.; May, S.; Palmer, G.H.; et al. Relations between household livestock ownership, livestock disease, and young child growth. J. Nutr. 2016, 146, 1118–1124. [Google Scholar] [CrossRef]
- Børsheim, E.; Tipton, K.D.; Wolf, S.E.; Wolfe, R.R. Essential amino acids and muscle protein recovery from resistance exercise. Am. J. Physiol. Endocrinol. Metab. 2002, 283, E648–E657. [Google Scholar] [CrossRef]
- Zeisel, S.H.; Da Costa, K.A. Choline: An essential nutrient for public health. Nutr. Rev. 2009, 67, 615–623. [Google Scholar] [CrossRef]
- Jadavji, N.M.; Deng, L.; Malysheva, O.; Caudill, M.A.; Rozen, R. MTHFR deficiency or reduced intake of folate or choline in pregnant mice results in impaired short-term memory and increased apoptosis in the hippocampus of wild-type offspring. Neurosci 2015, 300, 1–9. [Google Scholar] [CrossRef]
- Korsmo, H.W.; Jiang, X.; Caudill, M.A. Choline: Exploring the growing science on its benefits for moms and babies. Nutrients 2019, 11, 1823. [Google Scholar] [CrossRef]
- Liu, L.; Qiao, S.; Zhuang, L.; Xu, S.; Chen, L.; Lai, Q.; Wang, W. Choline intake correlates with cognitive performance among elder adults in the United States. Behav. Neurol. 2021, 2021, 2962245. [Google Scholar] [CrossRef]
- Lips, P.; Van Schoor, N.M. The effect of vitamin D on bone and osteoporosis. Best Pract Res. Clin. Endocrinol. Metab. 2011, 25, 585–591. [Google Scholar] [CrossRef] [PubMed]
- Papanikolaou, Y.; Fulgoni III, V.L. Increasing egg consumption at breakfast is associated with increased usual nutrient intakes: A modeling analysis using NHANES and the USDA child and adult care food program school breakfast guidelines. Nutrients 2021, 13, 1379. [Google Scholar] [CrossRef] [PubMed]
- Mayurasakorn, K.; Sitphahul, P.; Hongto, P.O. Supplement of three eggs a week improves protein malnutrition in Thai children from rural areas. J. Med. Assoc. Thai. 2011, 93, 301–309. [Google Scholar] [CrossRef]
- Andersen, C.J.; Blesso, C.N.; Lee, J.; Barona, J.; Shah, D.; Thomas, M.J.; Fernandez, M.L. Egg consumption modulates HDL lipid composition and increases the cholesterol-accepting capacity of serum in metabolic syndrome. Lipids 2013, 48, 557–567. [Google Scholar] [CrossRef]
- Fernandez, M.L. Effects of eggs on plasma lipoproteins in healthy populations. Food Funct. 2010, 1, 156–160. [Google Scholar] [CrossRef]
- Qin, C.; Lv, J.; Guo, Y.; Bian, Z.; Si, J.; Yang, L.; Chen, Y.; Zhou, Y.; Zhang, H.; Liu, J.; et al. Associations of egg consumption with cardiovascular disease in a cohort study of 0.5 million Chinese adults. Heart 2018, 104, 1756–1763. [Google Scholar] [CrossRef]
- Drouin-Chartier, J.P.; Chen, S.; Li, Y.; Schwab, A.L.; Stampfer, M.J.; Sacks, F.M.; Rosner, B.; Willett, W.C.; Hu, F.B.; Bhupathiraju, S.N. Egg consumption and risk of cardiovascular disease: Three large prospective US cohort studies, systematic review, and updated meta-analysis. BMJ 2020, 368, m513. [Google Scholar] [CrossRef]
- Ruiz, L.; Delgado, S.; Ruas-Madiedo, P.; Sánchez, B.; Margolles, A. Bifidobacteria and their molecular communication with the immune system. Front. Microbiol. 2017, 8, 2345. [Google Scholar] [CrossRef]
- Wong, C.B.; Odamaki, T.; Xiao, J.Z. Insights into the reason of Human-Residential Bifidobacteria (HRB) being the natural inhabitants of the human gut and their potential health-promoting benefits. FEMS Microbiol. Rev. 2020, 44, 369–385. [Google Scholar] [CrossRef]
- Rodiño-Janeiro, B.K.; Vicario, M.; Alonso-Cotoner, C.; Pascua-García, R.; Santos, J. A review of microbiota and irritable bowel syndrome: Future in therapies. Adv. Ther. 2018, 35, 289–310. [Google Scholar] [CrossRef]
- La-Ongkham, O.; Nakphaichit, M.; Leelavatcharamas, V.; Keawsompong, S.; Nitisinprasert, S. Distinct gut microbiota of healthy children from two different geographic regions of Thailand. Arch. Microbiol. 2015, 197, 561–573. [Google Scholar] [CrossRef] [PubMed]
- Vacca, M.; Celano, G.; Calabrese, F.M.; Portincasa, P.; Gobbetti, M.; De Angelis, M. The controversial role of human gut lachnospiraceae. Microorganisms 2020, 8, 573. [Google Scholar] [CrossRef] [PubMed]
- Myhrstad, M.C.; Tunsjø, H.; Charnock, C.; Telle-Hansen, V.H. Dietary fiber, gut microbiota, and metabolic regulation—Current status in human randomized trials. Nutrients 2020, 12, 859. [Google Scholar] [CrossRef] [PubMed]
- Vanegas, S.M.; Meydani, M.; Barnett, J.B.; Goldin, B.; Kane, A.; Rasmussen, H.; Brown, C.; Vangay, P.; Knights, D.; Jonnalagadda, S.; et al. Substituting whole grains for refined grains in a 6-wk randomized trial has a modest effect on gut microbiota and immune and inflammatory markers of healthy adults. Am. J. Clin. Nutr. 2017, 105, 635–650. [Google Scholar] [CrossRef]
- Kang, G.U.; Jung, D.R.; Lee, Y.H.; Jeon, S.Y.; Han, H.S.; Chong, G.O.; Shin, J.H. Dynamics of Fecal microbiota with and without invasive cervical cancer and its application in early diagnosis. Cancers 2020, 12, 3800. [Google Scholar] [CrossRef]


| Variables | Control [n = 197] | PS [n = 200] | WE [n = 238] |
|---|---|---|---|
| n (%) | n (%) | n (%) | |
| Age, mean (SD), year | 9.2 (0.1) | 9.5 (0.1) | 9.6 (0.3) |
| Sex | |||
| Male | 103 (52) | 97 (49) | 108 (45) |
| Female | 94 (48) | 103 (51) | 130 (55) |
| Career of parents | |||
| Government officials | 5 (3) | 9 (6) | 13 (6) |
| Self-employment | 23 (13) | 27 (16) | 38 (18) |
| Agriculturist | 55 (32) | 45 (27) | 59 (28) |
| Company employee | 10 (6) | 22 (13) | 28 (13) |
| Unemployed | 9 (5) | 12 (7) | 20 (9) |
| Others (i.e., contractor) | 71 (41) | 52 (31) | 55 (26) |
| Weight, mean (SD), kg | 31.6 (9.5) | 31.6 (8.1) | 32.1 (9.4) |
| Height, mean (SD), cm | 137.1 (8.8) | 137.8 (9.3) | 138.7 (9.0) |
| W/A, mean (SD), percentile | 103.7 (27.9) | 100.3 (22.8) | 103.4 (26.7) |
| Underweight | 24 (12) | 42 (21) | 40 (17) |
| Overweight | 19 (10) | 11 (6) | 12 (5) |
| H/A, mean (SD), percentile | 100.1 (4.5) | 100.1 (4.4) | 100.3 (5.2) |
| Stunted | 29 (15) | 44 (22) | 41 (17) |
| W/H, mean (SD), percentile | 102.3 (18.6) | 99.2 (14.7) | 102.2 (19.4) |
| Wasted | 24 (12) | 37 (19) | 21 (9) |
| Obese | 25 (13) | 36 (18) | 17 (7) |
| Blood pressure, mean (SD), mm Hg | |||
| Systolic | 103.2 (9.1) | 103.7 (9.1) | 104.2 (9.8) |
| Diastolic | 69.7 (5.6) | 70.7 (5.4) | 70.6 (5.9) |
| Hemoglobin, mean (SD), mmol/L | 7.9 (0.6) | 8.0 (0.6) | 8.0 (0.7) |
| <7.13 | 21 (11) | 19 (10) | 24 (10) |
| Hematocrit, mean (SD), % | 39.18 (2.9) | 39.50 (2.8) | 39.73 (3.3) |
| <35 | 17 (9) | 20 (10) | 24 (10) |
| MCV, mean (SD), fL | 78.2 (5.6) | 78.5 (4.9) | 78.4 (6.3) |
| <80 | 125 (91) | 126 (63) | 152 (64) |
| Fasting blood sugar, mean (SD), mmol/L | 4.8 (0.5) | 5.0 (0.5) | 4.8 (0.5) |
| Transferrin, mean (SD), g/L | 2.6 (0.3) | 2.6 (0.3) | 2.6 (0.3) |
| Prealbumin, mean (SD), μmol/L | 3.8 (0.6) | 3.9 (0.6) | 3.9 (0.6) |
| <2.91 | 12 (6) | 12 (6) | 13 (6) |
| Albumin, mean (SD), g/L | 43.7 (2.3) | 43.6 (2.1) | 43.9 (2.1) |
| Blood lipid level, mean (SD), mmol/L | |||
| TC | 4.6 (0.6) | 4.5 (0.7) | 4.6 (0.7) |
| TG | 0.9 (0.3) | 0.8 (0.3) | 0.9 (0.3) |
| HDL-C | 1.4 (0.3) | 1.4 (0.3) | 1.4 (0.3) |
| LDL-C | 2.7 (0.5) | 2.7 (0.6) | 2.7 (0.6) |
| Vitamin D, mean (SD), nmol/L | 70.6 (15.7) | 62.2 (18.7) | 65.9 (16.5 |
| <74.88, % (95% CI) | 60 (57.1–63.2) | 75 (71.0–78.0) | 75 (72.0–77.0) |
| 49.92–72.38, % (95% CI) | 58 (54.1–61.2) | 53 (51.9–56.7) | 58 (53.9–60.1) |
| <49.92, % (95% CI) | 2 (1.0–3.3) | 17 (14.8–18.8) | 23 (20.9–25.5) |
| IGF-1, mean (SD), nmol/L | 28.7 (14.5) | 34.7 (16.5) | 36.0 (18.0) |
| Variables | Control [n = 197] | PS [n = 200] | WE [n = 238] | p-Value a |
|---|---|---|---|---|
| Mean within Group Difference (95% CI) b | Mean within Group Difference (95% CI) c | Mean within Group Difference (95% CI) d | ||
| H/A, percentile | ||||
| week 14 | +0.25 (−0.68–1.18) | +0.01 (−0.93–0.95) | +0.33 (−0.51–1.17) | 0.714 |
| week 35 | +0.49 (−0.44–1.41) | +0.18 (−0.76–1.11) | +0.50 (−0.36–1.35) | 0.412 |
| W/A, percentile | ||||
| week 14 | −1.16 (−6.41–4.09) | +0.53 (−4.71–5.77) | +3.01 (−1.82–7.84) | 0.402 |
| week 35 | +2.21 (−3.03–7.46) | +4.53 (−0.73–9.78) | +5.00 (0.13–9.87) | 0.063 |
| W/H, percentile | ||||
| week 14 | −0.45 (−4.01–3.11) | +1.02 (−2.60–4.65) | +0.56 (−2.71–3.82) | 0.685 |
| week 35 | +1.22 (−2.33–4.77) | +2.99 (−0.65–6.62) | +2.98 (−0.31–6.26) | 0.415 |
| Height, cm | ||||
| week 14 | +0.92 (−0.96–2.80) | +1.10 (−0.77–2.97) | +4.07 (2.32–5.83) | <0.001 |
| week 35 | +3.41 (1.53–5.30) | +3.72 (1.84–5.61) | +6.91 (5.16–8.67) | <0.001 |
| Weight, kg | ||||
| week 14 | +0.91 (−0.95–2.77) | +1.02 (−0.83–2.88) | +1.62 (−0.11–3.35) | 0.001 |
| week 35 | +3.58 (1.71–5.44) | +3.62 (1.75–5.49) | +4.39 (2.65–6.13) | <0.001 |
| Subpopulation | ||||
| Underweight | ||||
| Height, cm | ||||
| week 14 | +0.19 (−2.52–2.90) | +0.64 (−2.13–3.38) | +1.62 (−1.33–4.29) | 0.010 |
| week 35 | +1.20 (−1.77–4.18) | +3.87 (1.02–6.69) | +2.61 (−0.61–5.54) | 0.030 |
| Weight, kg | ||||
| week 14 | +0.59 (−0.80–1.97) | +0.21 (−1.22–1.65) | +0.94 (−0.45–2.32) | 0.024 |
| week 35 | +1.49 (−0.04–3.01) | +2.17 (0.69–3.64) | +1.17 (−0.32–2.67) | 0.378 |
| Overweight | ||||
| Height, cm | ||||
| week 14 | +1.56 (−1.57–4.69) | +1.57 (−1.63–4.74) | +5.04 (1.95–7.86) | 0.029 |
| week 35 | +2.08 (−1.04–5.21) | +4.05 (0.89–7.19) | +7.13 (4.06–9.92) | 0.006 |
| Weight, kg | ||||
| week 14 | +0.80 (−3.33–4.94) | +1.20 (1.01–5.41) | +1.61 (1.92–5.14) | 0.015 |
| week 35 | +2.92 (−1.15–6.99) | +4.04 (1.13–8.20) | +4.94 (1.42–8.45) | 0.043 |
| Stunted | ||||
| Height, cm | ||||
| week 14 | +2.67 (−5.81–11.14) | +0.40 (−6.17–6.97) | +3.42 (−4.51–11.35) | 0.022 |
| week 35 | +2.55 (−6.93–12.03) | +2.50 (−4.07–9.07) | +7.63 (0.04–15.21) | 0.010 |
| Weight, kg | ||||
| week 14 | +0.58 (−6.62–7.79) | +0.00 (−5.97–5.97) | +1.20 (−5.13–7.53) | 0.437 |
| week 35 | −0.20 (−8.37–7.97) | +5.66 (−0.31–11.63) | +2.58 (−3.13–8.29) | 0.352 |
| Wasted | ||||
| Height, cm | ||||
| week 14 | +0.61 (−3.43–4.64) | +1.00 (−2.55–4.52) | +5.12 (1.11–8.78) | 0.344 |
| week 35 | +2.31 (−1.90–6.53) | +3.58 (−0.20–7.34) | +7.85 (3.50–11.80) | 0.501 |
| Weight, kg | ||||
| week 14 | +1.54 (−0.92–4.00) | +0.26 (−1.97–2.48) | +1.25 (−0.97–3.47) | 0.661 |
| week 35 | +2.80 (0.22–5.38) | +1.51 (−0.86–3.88) | +2.17 (−0.22–4.55) | 0.489 |
| Obesity | ||||
| Height, cm | ||||
| week 14 | +1.62 (−1.93–5.18) | +0.70 (−2.99–4.36) | +4.06 (0.74–7.08) | 0.041 |
| week 35 | +2.06 (−1.33–5.44) | +3.66 (0.07–7.22) | +6.14 (2.86–9.12) | 0.026 |
| Weight, kg | ||||
| week 14 | +2.42 (−2.78–7.62) | +1.08 (−4.34–6.51) | +1.81 (−2.45–6.07) | 0.009 |
| week 35 | +2.80 (−2.08–7.68) | +3.71 (−1.57–8.98) | +6.13 (1.85–10.40) | 0.032 |
| Transferrin, g/L | ||||
| week 14 | +0.07 (0.01–0.12) | +0.10 (0.04–0.16) | +0.06 (0.01–0.12) | 0.033 |
| week 35 | +0.15 (0.10–0.21) | +0.15 (0.09–0.20) | +0.16 (0.11–0.21) | 0.008 |
| Prealbumin, μmol/L | ||||
| week 14 | +0.02 (−0.10–0.14) | +0.08 (−0.04–0.20) | +0.16 (0.04–0.27) | <0.001 |
| week 35 | +0.05 (−0.08–0.17) | −0.01 (−0.13–0.11) | +0.24 (0.12–0.35) | <0.001 |
| Prealbumin < 2.91 μmol/L (%) | 5.3 (4.8–5.9) | 5.3 (4.1–5.6) | 4.4 (3.9–5.2) | 0.712 |
| Albumin, g/L | ||||
| week 14 | −1.13 (−1.57–0.70) | −0.93 (−1.36–0.50) | −0.34 (−0.76–0.07) | 0.001 |
| week 35 | −0.53 (−0.96–0.10) | −0.37 (−0.81–0.06) | −0.19 (−0.60–0.22) | <0.001 |
| Hemoglobin, mmol/L | ||||
| week 14 | +0.08 (−0.04–0.20) | −0.02 (−0.14–0.10) | +0.11 (0.00–0.22) | 0.042 |
| week 35 | −0.15 (−0.27–0.03) | −0.19 (−0.31–0.06) | −0.10 (−0.21–0.01) | 0.031 |
| Hematocrit, % | ||||
| week 14 | +0.39 (−0.15–0.93) | +0.12 (−0.42–0.66) | +0.60 (0.11–1.10) | 0.037 |
| week 35 | −1.89 (−2.43–1.36) | −2.10 (−2.64–1.56) | −1.79 (−2.29–1.30) | 0.045 |
| MCV, fL | ||||
| week 14 | −0.16 (−1.28–0.96) | −0.04 (−1.17–1.09) | +0.01 (−1.02–1.04) | 0.957 |
| week 35 | −0.29 (−1.42–0.84) | −0.30 (−1.44–0.84) | −0.08 (−1.11–0.95) | 0.780 |
| MCV < 80 fL (%) | 58.4 (56.1–61.6) | 58.0 (53.1–60.8) | 55.3 (51.9–57.5) | 0.485 |
| FBS, mmol/L | ||||
| week 14 | +0.06 (−0.04–0.12) | +0.02 (−0.04–0.06) | +0.12 (0.04–0.19) | 0.648 |
| week 35 | +0.27 (0.19–0.35) | +0.16 (−0.02–0.16) | +0.24 (0.17–0.32) | 0.385 |
| TC, mmol/L | ||||
| week 14 | +0.55 (0.41–0.69) | +0.48 (0.34–0.63) | +0.61 (0.48–0.74) | 0.046 |
| week 35 | +0.11 (−0.03–0.25) | +0.01 (−0.13–0.16) | +0.07 (−0.06–0.20) | 0.049 |
| TG, mmol/L | ||||
| week 14 | +0.04 (−0.02–0.11) | +0.06 (−0.01–0.12) | +0.06 (0.00–0.12) | 0.032 |
| week 35 | −0.02 (−0.08–0.05) | −0.09 (−0.16–0.03) | −0.08 (−0.14–0.02) | 0.046 |
| HDL-C, mmol/L | ||||
| week 14 | +0.03 (−0.02–0.08) | +0.03 (−0.02–0.08) | +0.06 (0.02–0.11) | 0.181 |
| week 35 | +0.03 (−0.02–0.08) | +0.04 (−0.01–0.09) | +0.08 (0.03–0.13) | 0.427 |
| LDL-C, mmol/L | ||||
| week 14 | +0.51 (0.38–0.64) | +0.43 (0.29–0.56) | +0.52 (0.40–0.64) | 0.031 |
| week 35 | +0.12 (−0.01–0.25) | +0.03 (−0.10–0.16) | +0.05 (−0.07–0.17) | 0.010 |
Disclaimer/Publisher’s Note: The statements, opinions and data contained in all publications are solely those of the individual author(s) and contributor(s) and not of MDPI and/or the editor(s). MDPI and/or the editor(s) disclaim responsibility for any injury to people or property resulting from any ideas, methods, instructions or products referred to in the content. |
© 2023 by the authors. Licensee MDPI, Basel, Switzerland. This article is an open access article distributed under the terms and conditions of the Creative Commons Attribution (CC BY) license (https://creativecommons.org/licenses/by/4.0/).
Share and Cite
Suta, S.; Surawit, A.; Mongkolsucharitkul, P.; Pinsawas, B.; Manosan, T.; Ophakas, S.; Pongkunakorn, T.; Pumeiam, S.; Sranacharoenpong, K.; Sutheeworapong, S.; et al. Prolonged Egg Supplement Advances Growing Child’s Growth and Gut Microbiota. Nutrients 2023, 15, 1143. https://doi.org/10.3390/nu15051143
Suta S, Surawit A, Mongkolsucharitkul P, Pinsawas B, Manosan T, Ophakas S, Pongkunakorn T, Pumeiam S, Sranacharoenpong K, Sutheeworapong S, et al. Prolonged Egg Supplement Advances Growing Child’s Growth and Gut Microbiota. Nutrients. 2023; 15(5):1143. https://doi.org/10.3390/nu15051143
Chicago/Turabian StyleSuta, Sophida, Apinya Surawit, Pichanun Mongkolsucharitkul, Bonggochpass Pinsawas, Thamonwan Manosan, Suphawan Ophakas, Tanyaporn Pongkunakorn, Sureeporn Pumeiam, Kitti Sranacharoenpong, Sawannee Sutheeworapong, and et al. 2023. "Prolonged Egg Supplement Advances Growing Child’s Growth and Gut Microbiota" Nutrients 15, no. 5: 1143. https://doi.org/10.3390/nu15051143
APA StyleSuta, S., Surawit, A., Mongkolsucharitkul, P., Pinsawas, B., Manosan, T., Ophakas, S., Pongkunakorn, T., Pumeiam, S., Sranacharoenpong, K., Sutheeworapong, S., Poungsombat, P., Khoomrung, S., Akarasereenont, P., Thaipisuttikul, I., Suktitipat, B., & Mayurasakorn, K. (2023). Prolonged Egg Supplement Advances Growing Child’s Growth and Gut Microbiota. Nutrients, 15(5), 1143. https://doi.org/10.3390/nu15051143