
Effect of Different Dietary Patterns on Macronutrient Composition in Human Breast Milk: A Systematic Review and Meta-Analysis

Abstract
:1. Introduction
2. Materials and Methods
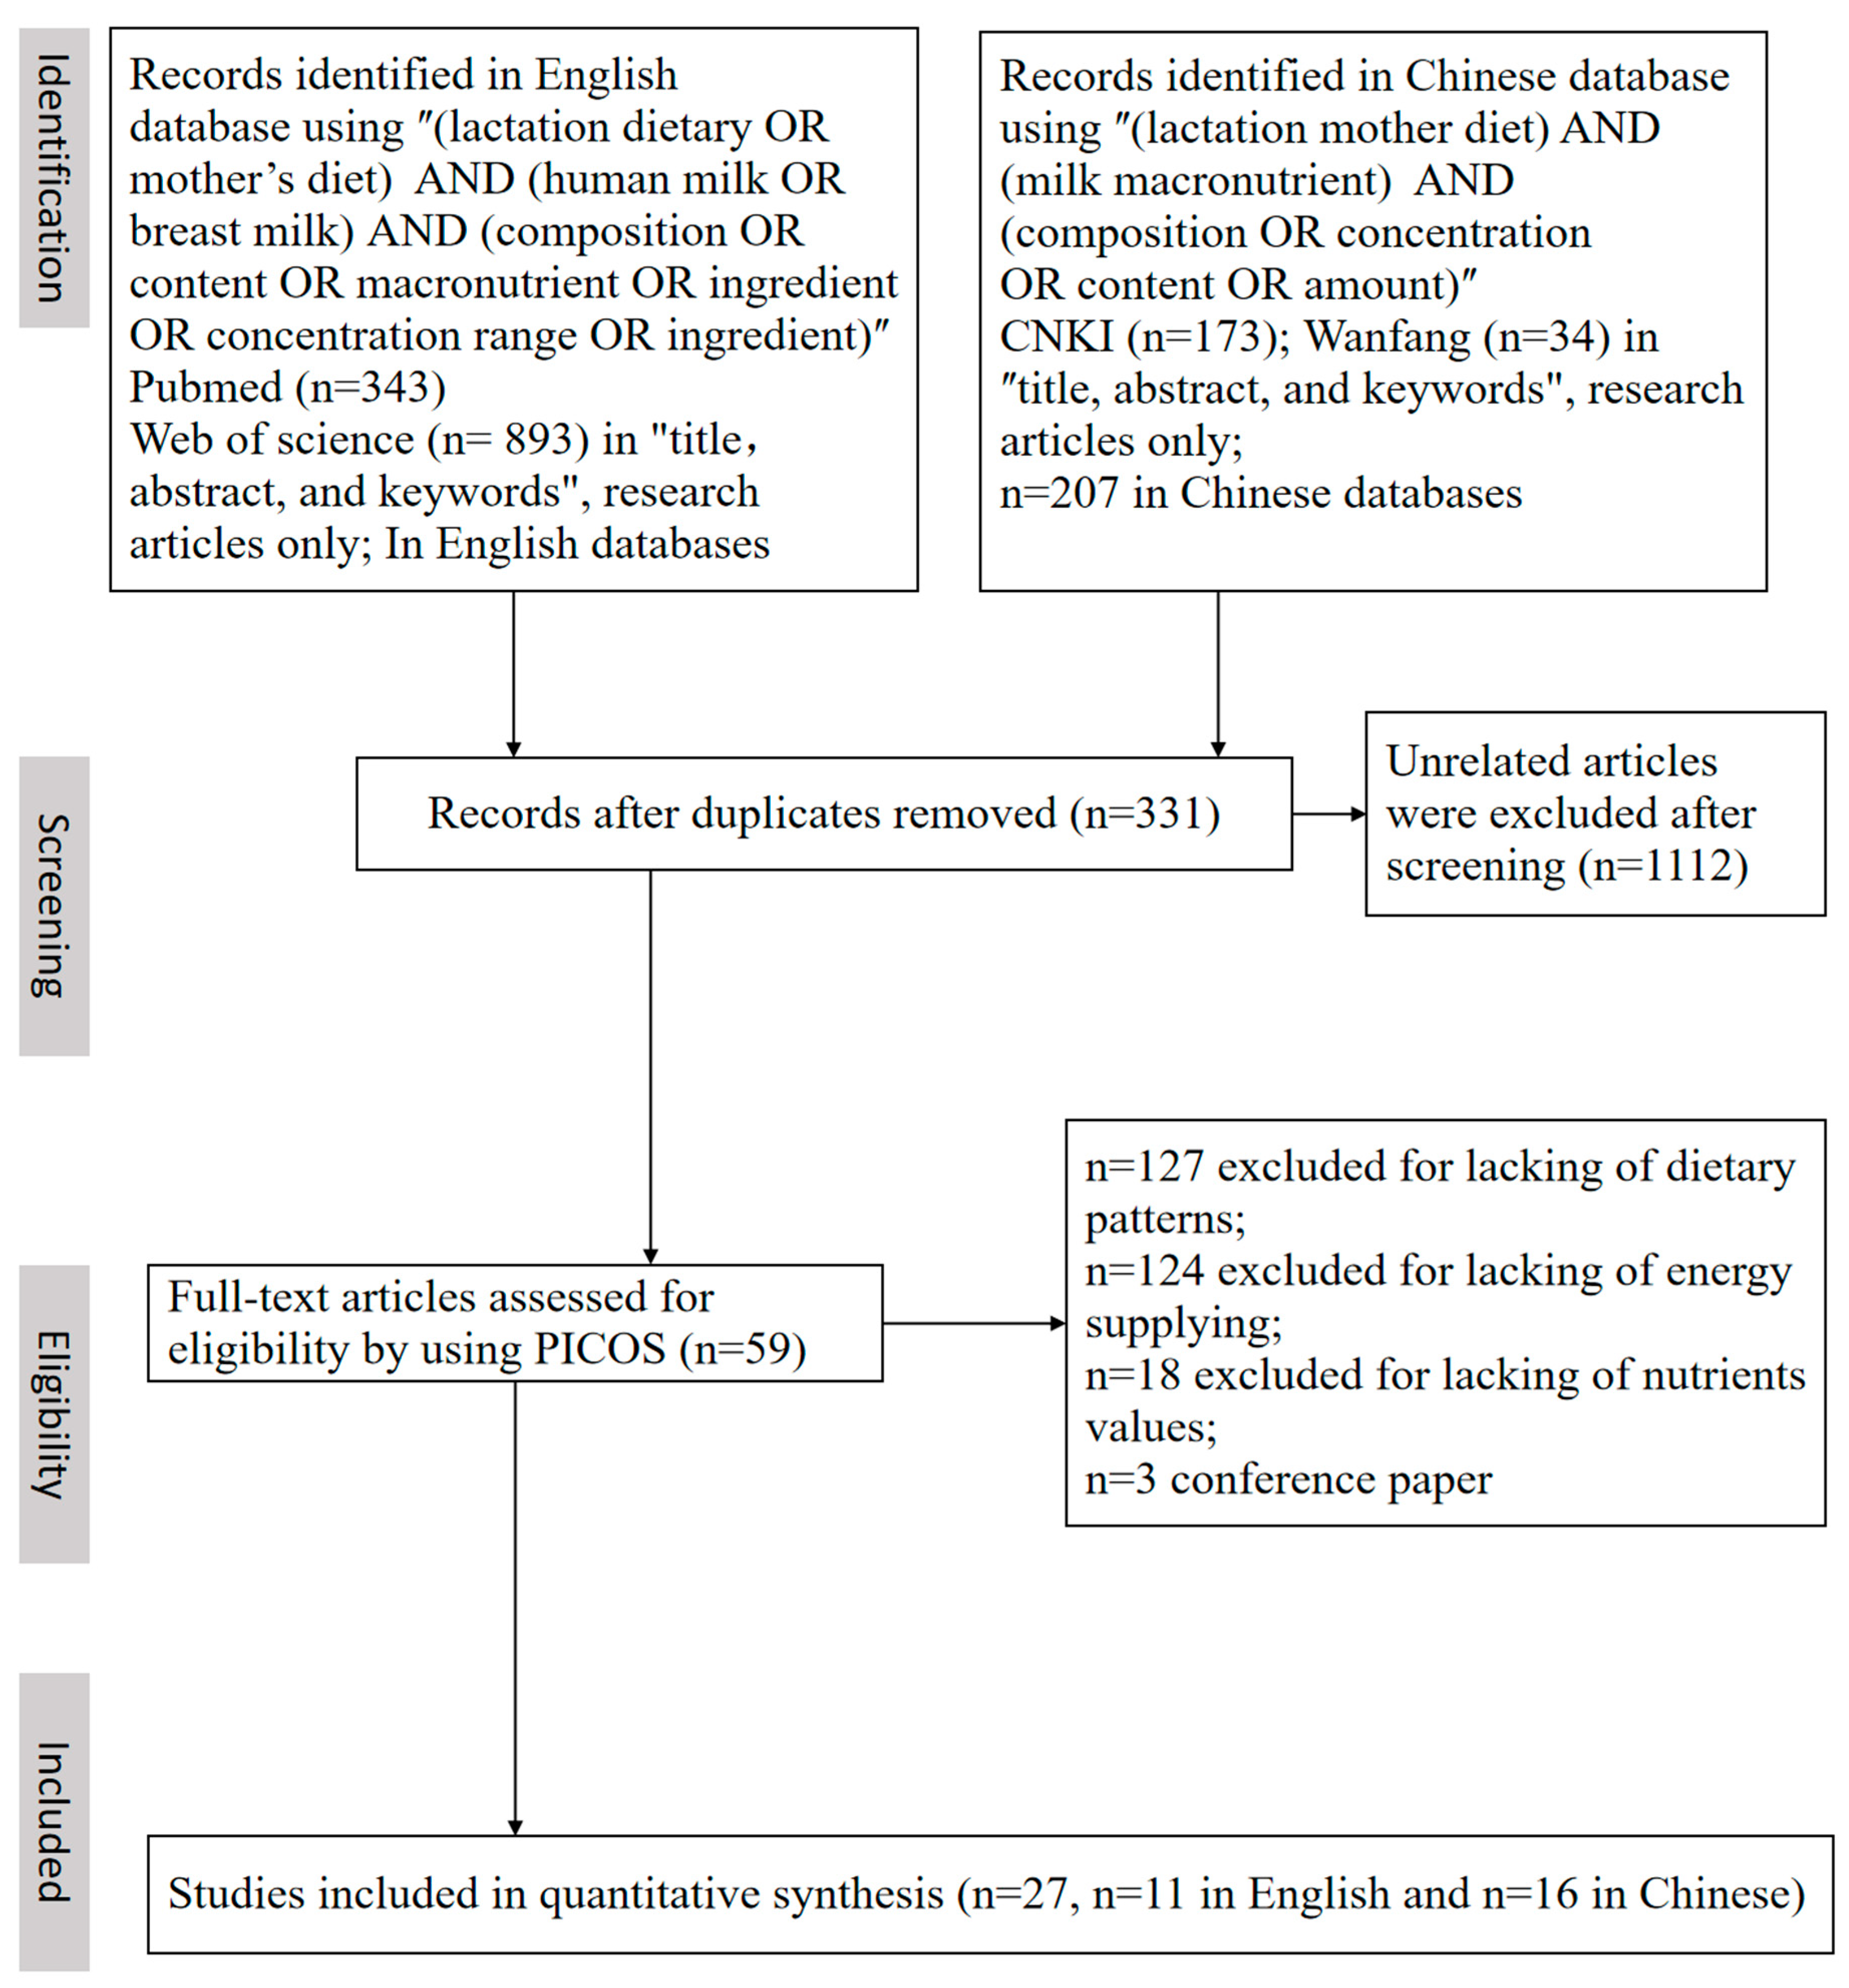
2.1. Data Sources, Search Strategy, and Selection Criteria
2.2. Data Extraction and Processing
2.3. Quality Assessment
2.4. Statistical Analysis
3. Results
3.1. The Characteristics of the Articles
3.2. Meta-Analysis of Macronutrients
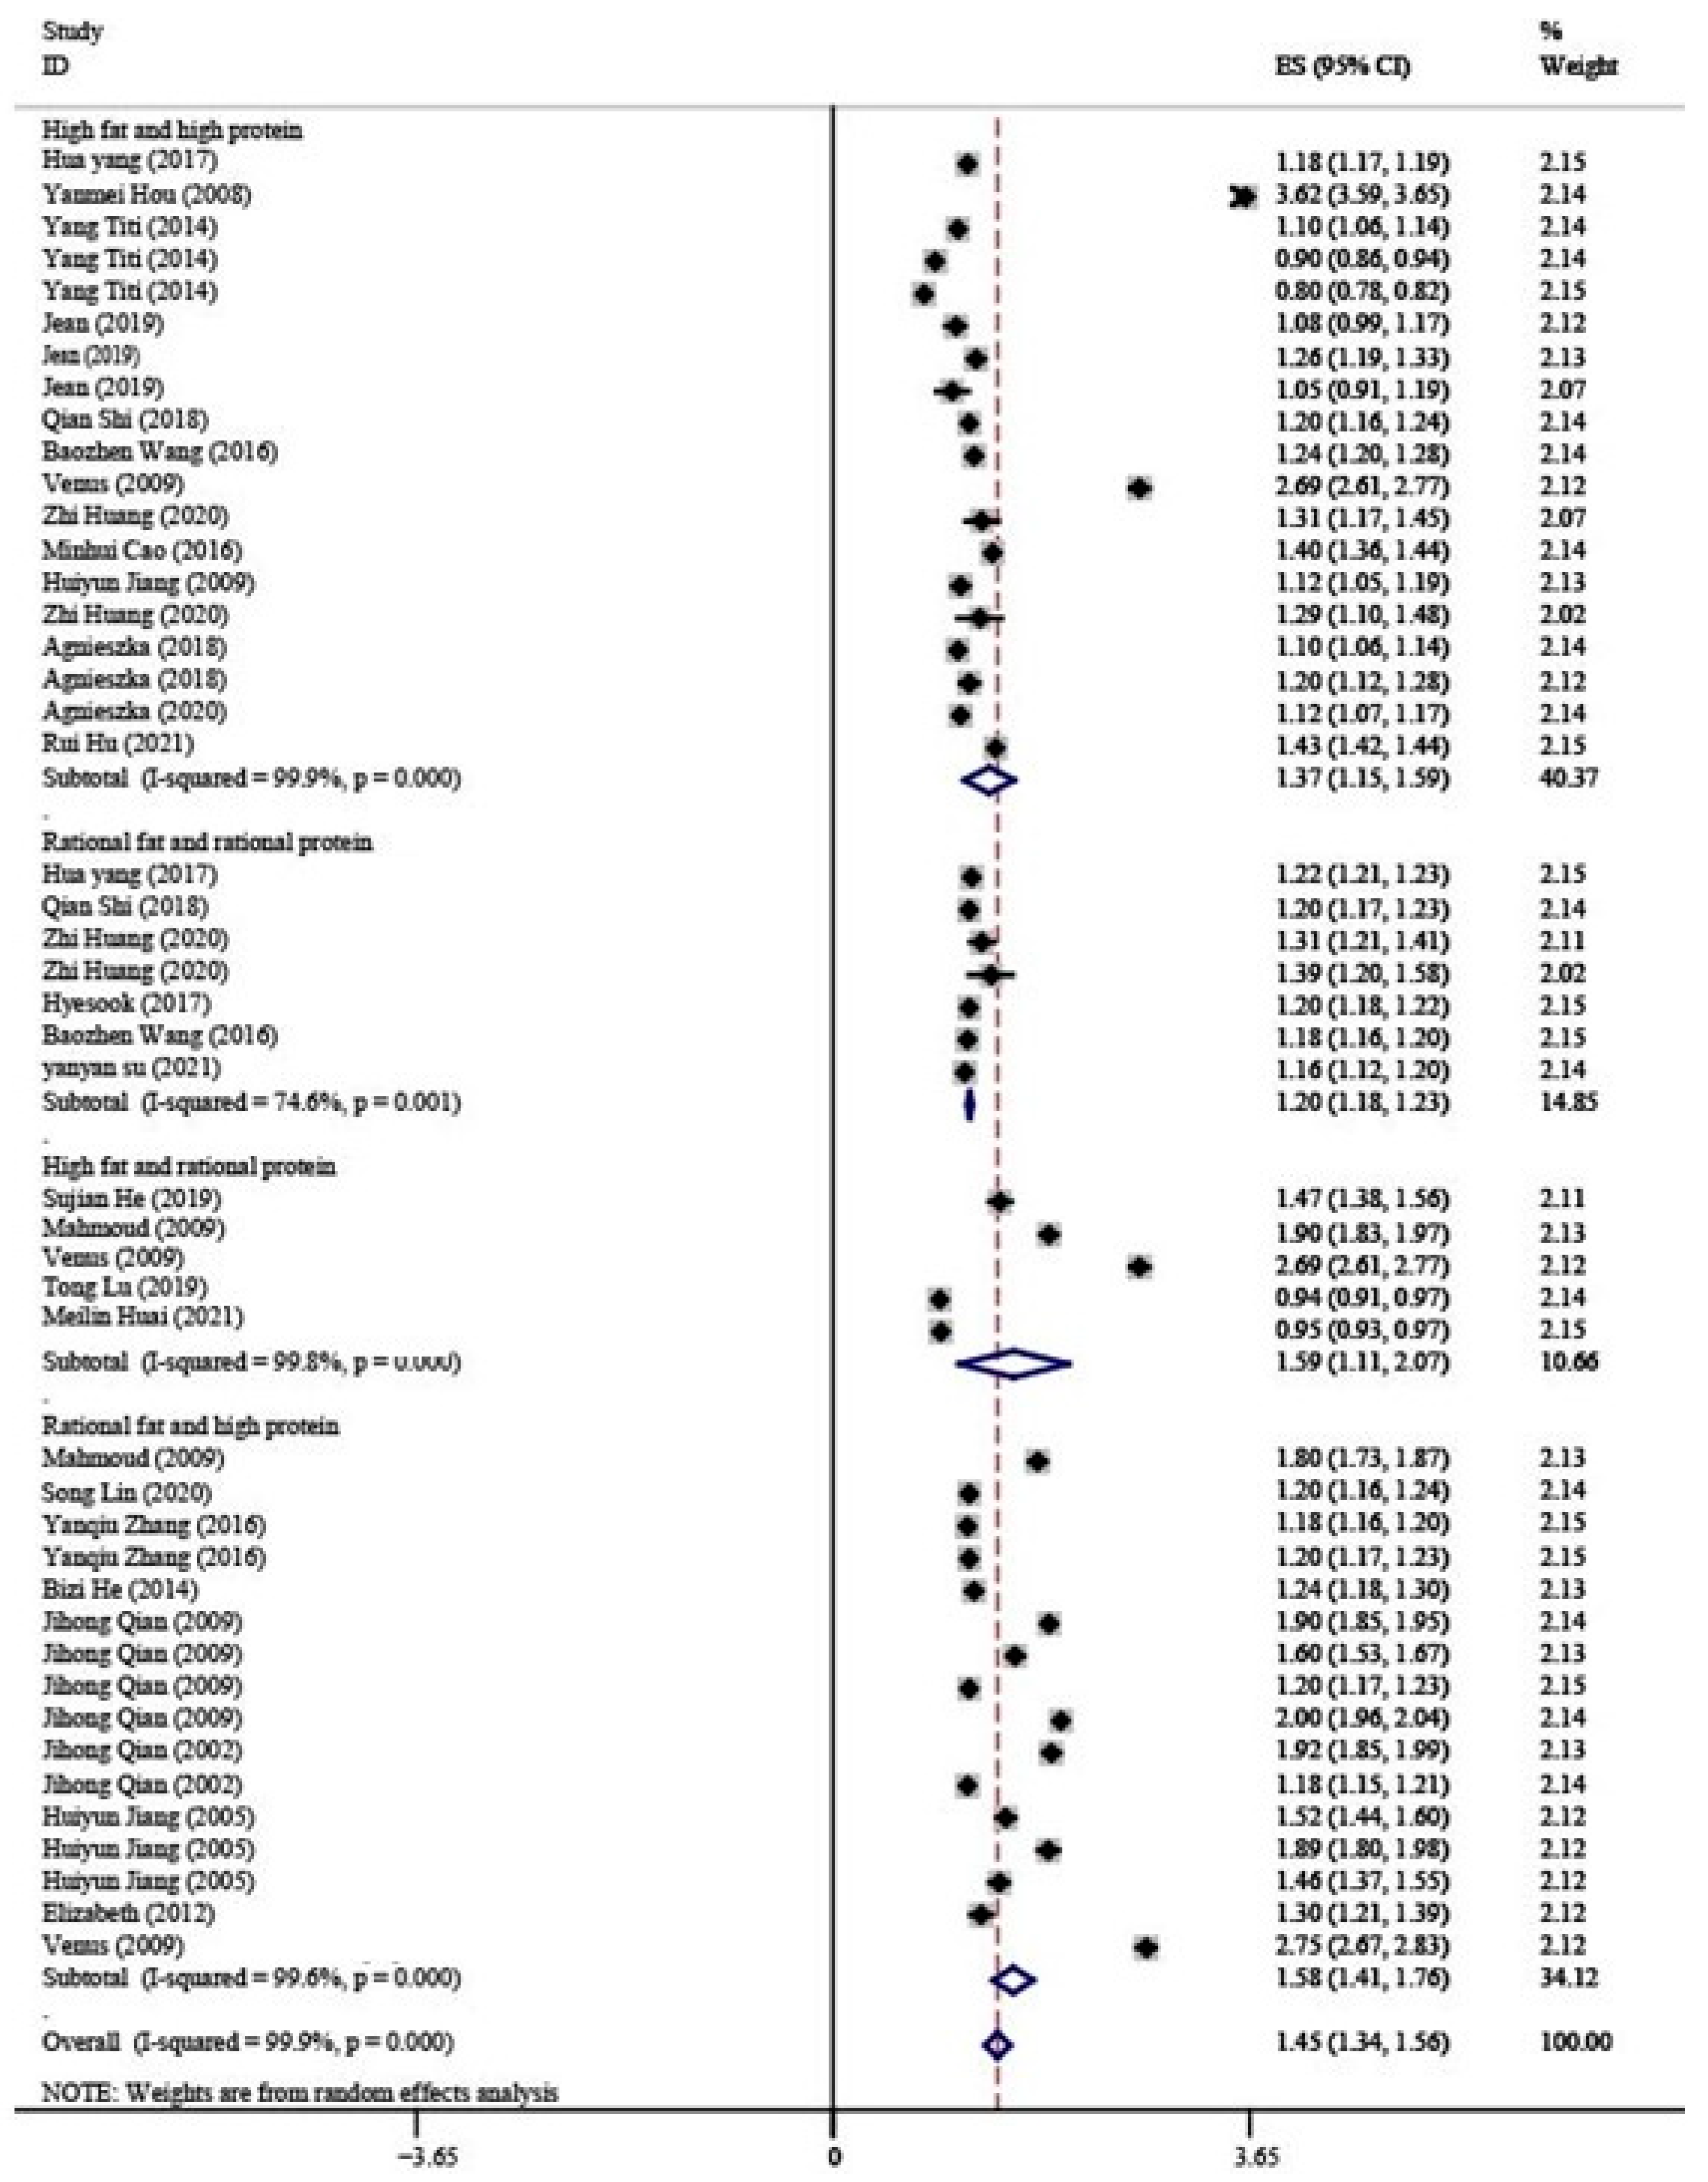
3.2.1. Protein
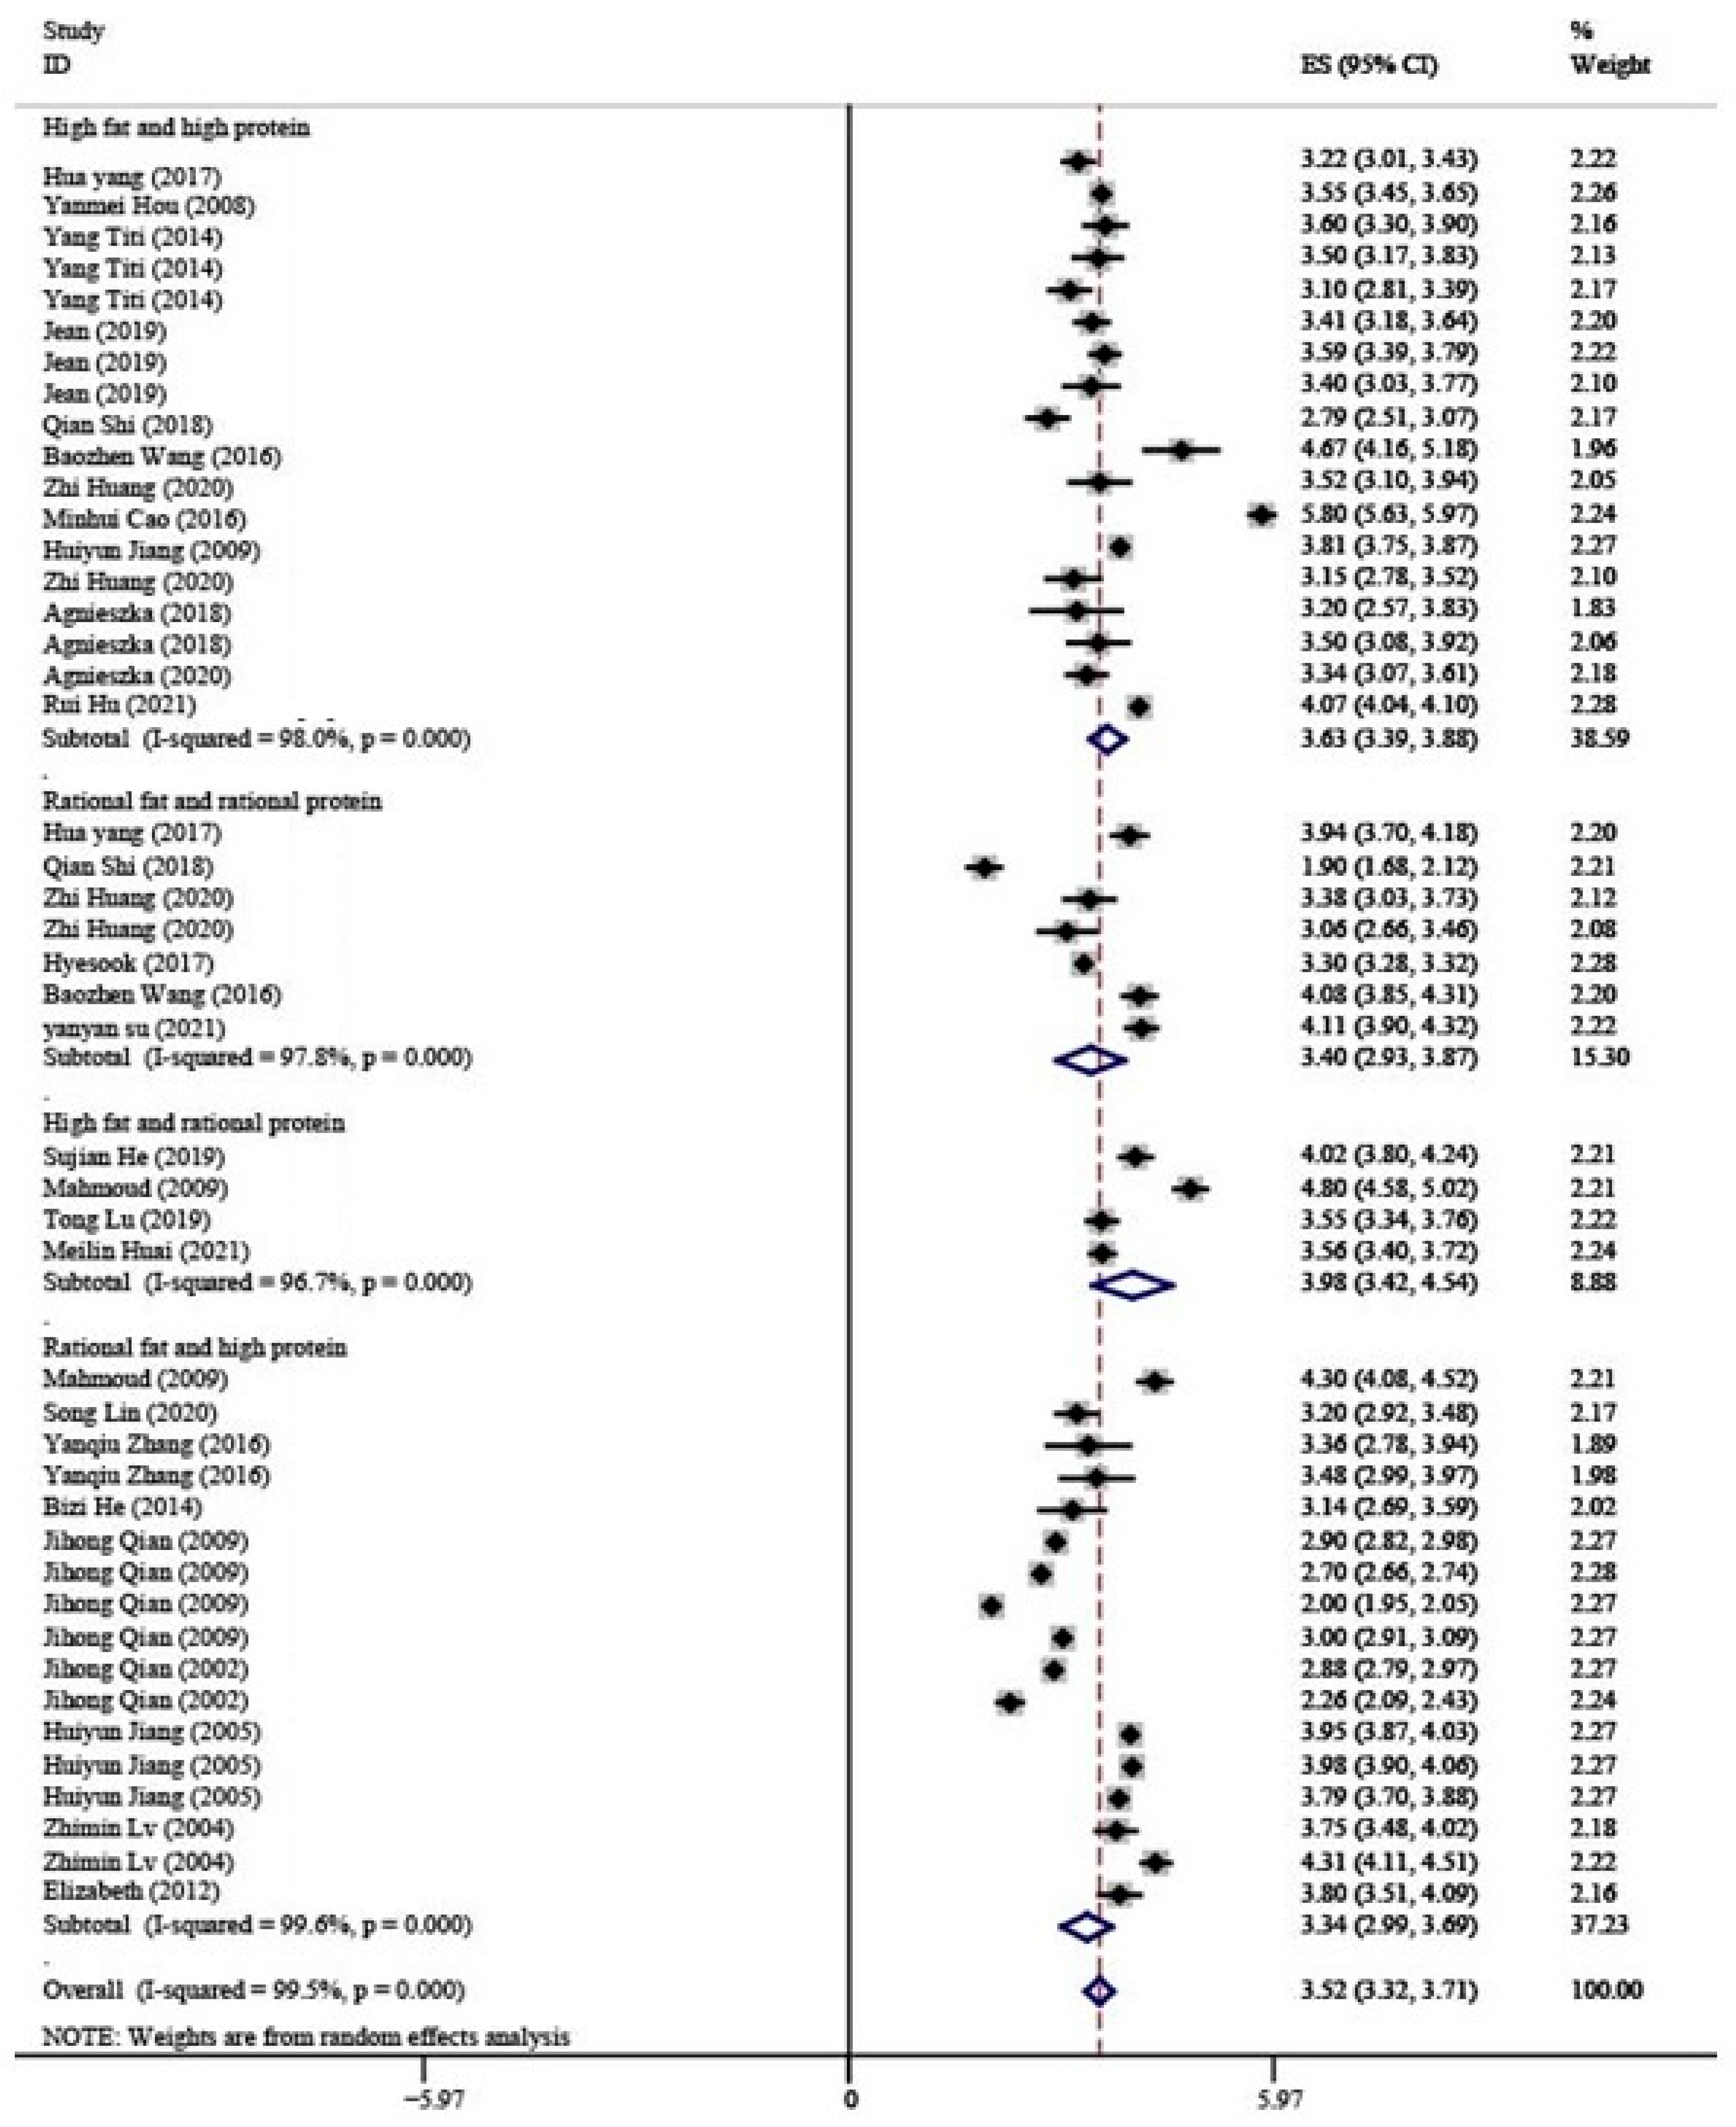
3.2.2. Fat
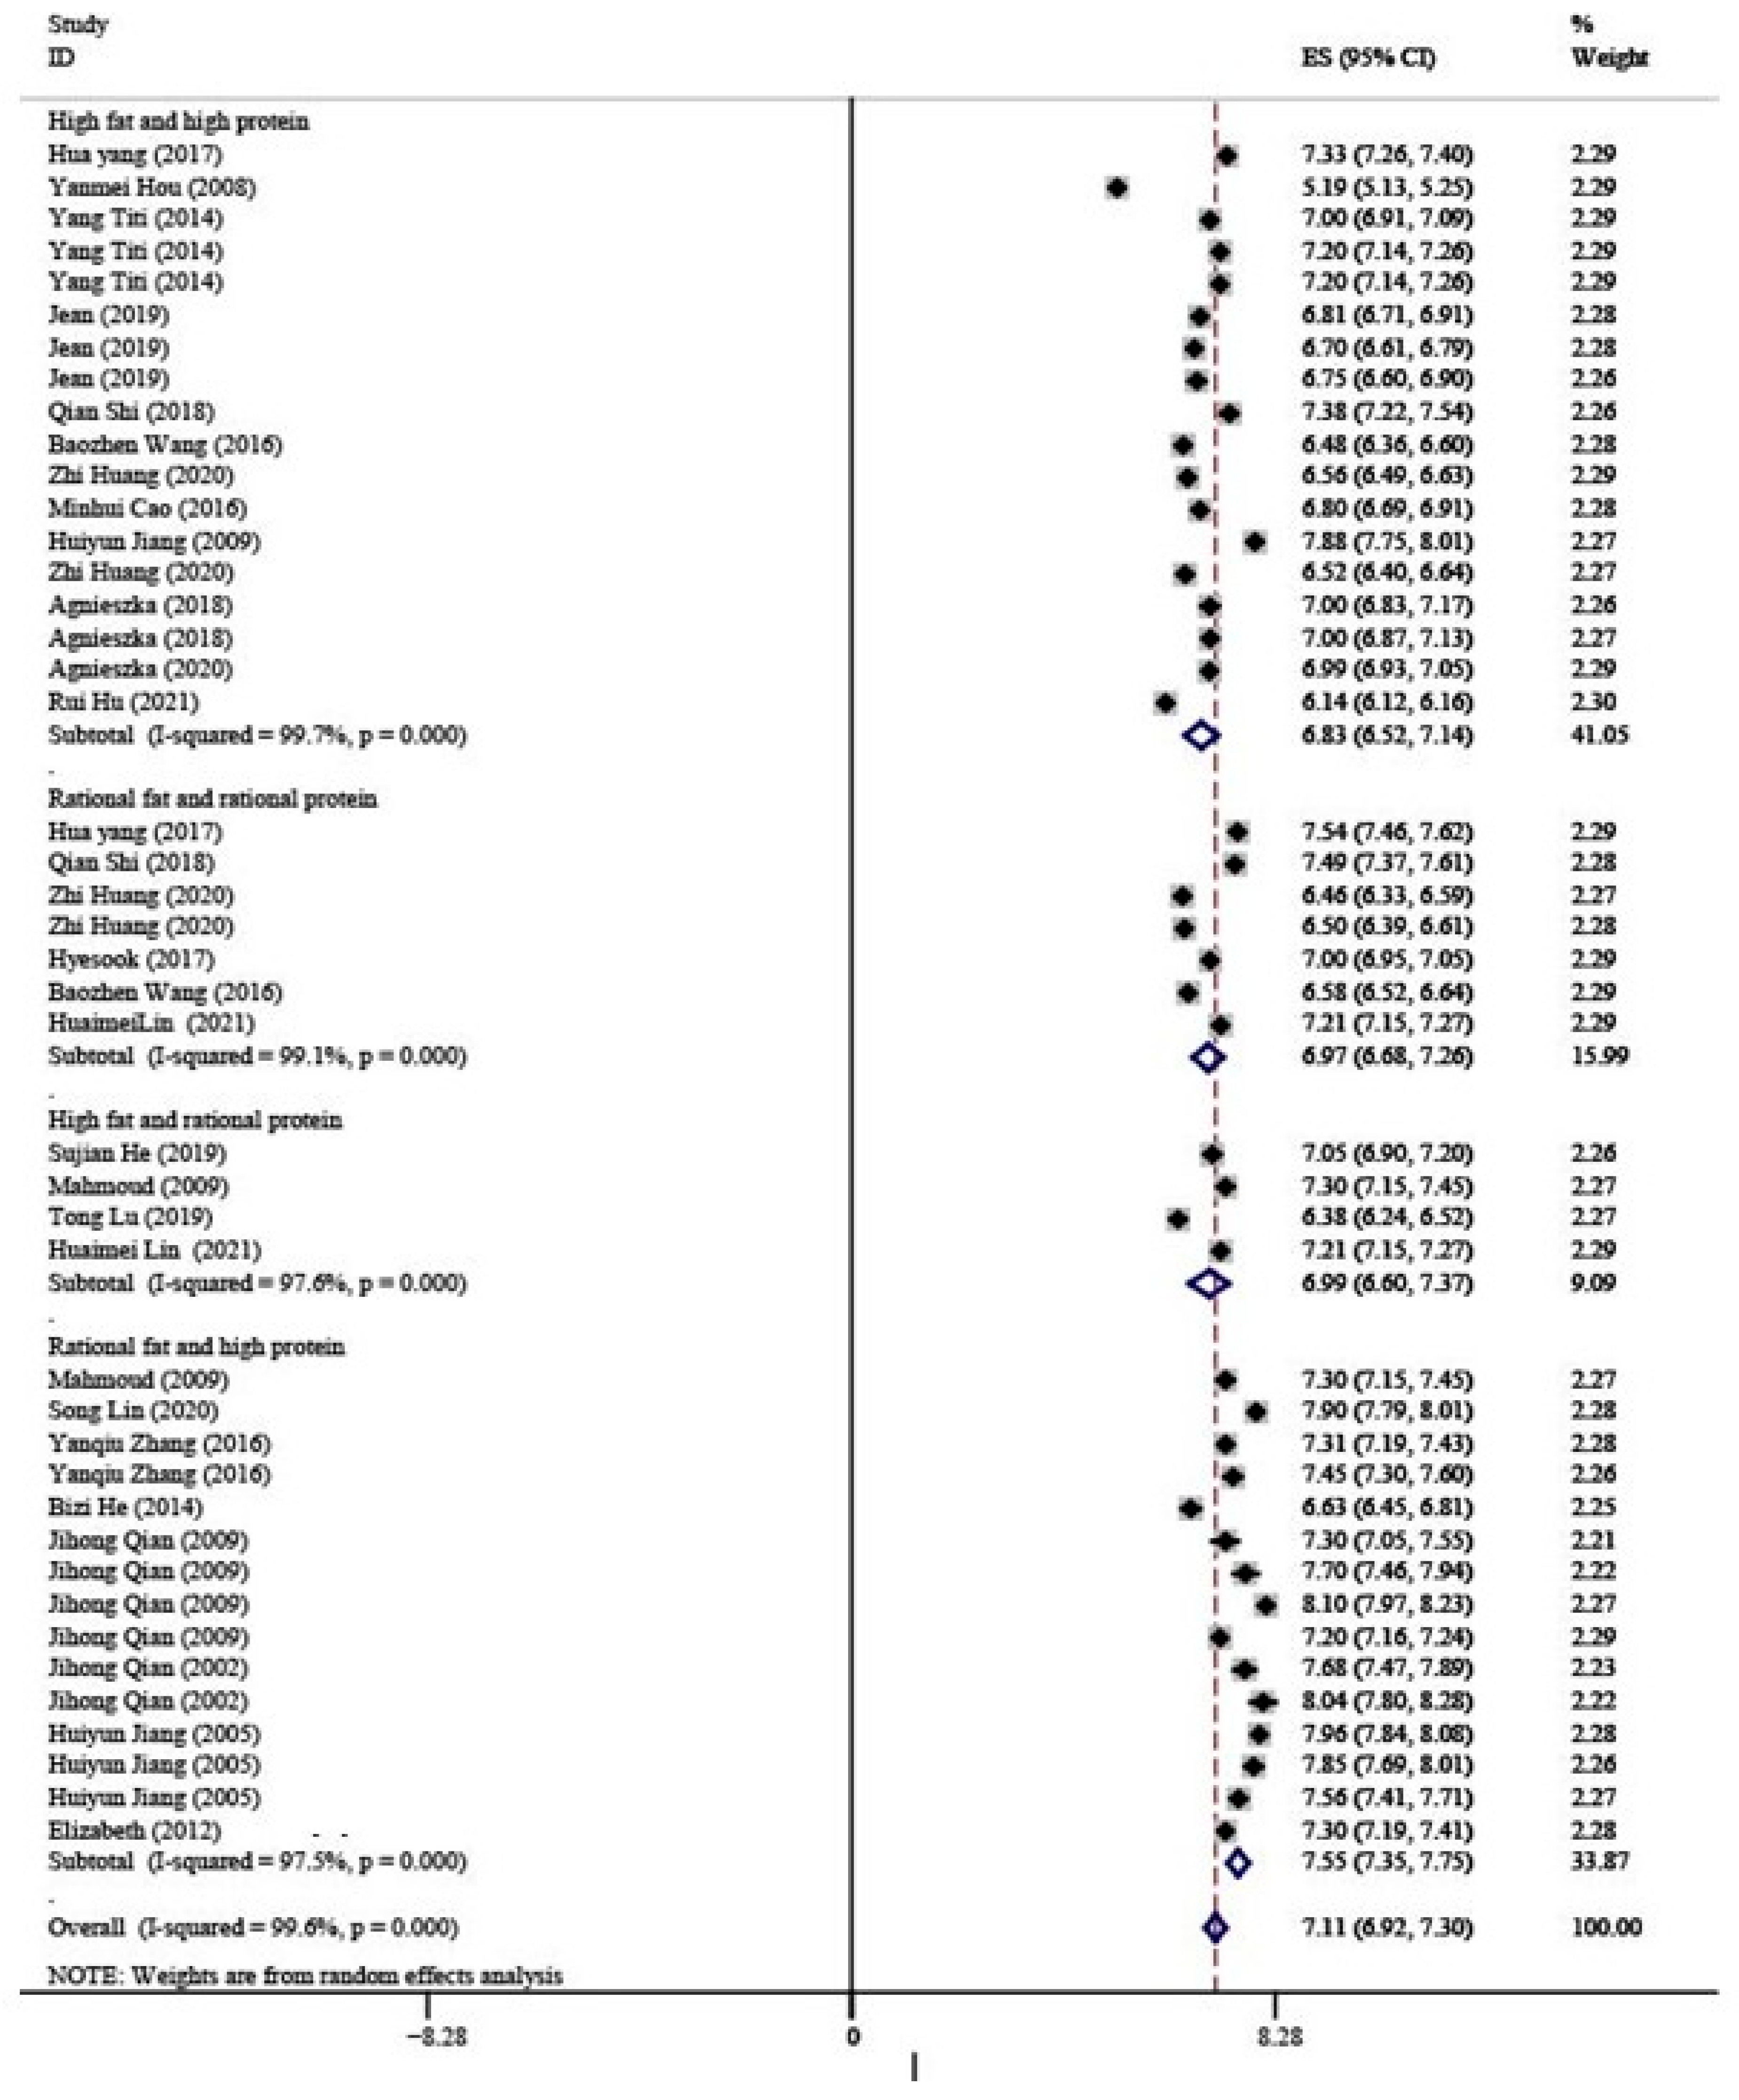
3.2.3. Lactose
3.2.4. Energy Supply
3.3. Subgroup Analysis
3.3.1. Carbohydrates
3.3.2. Analytical Method
3.3.3. Region
3.4. Meta-Regression
3.5. Publication Bias
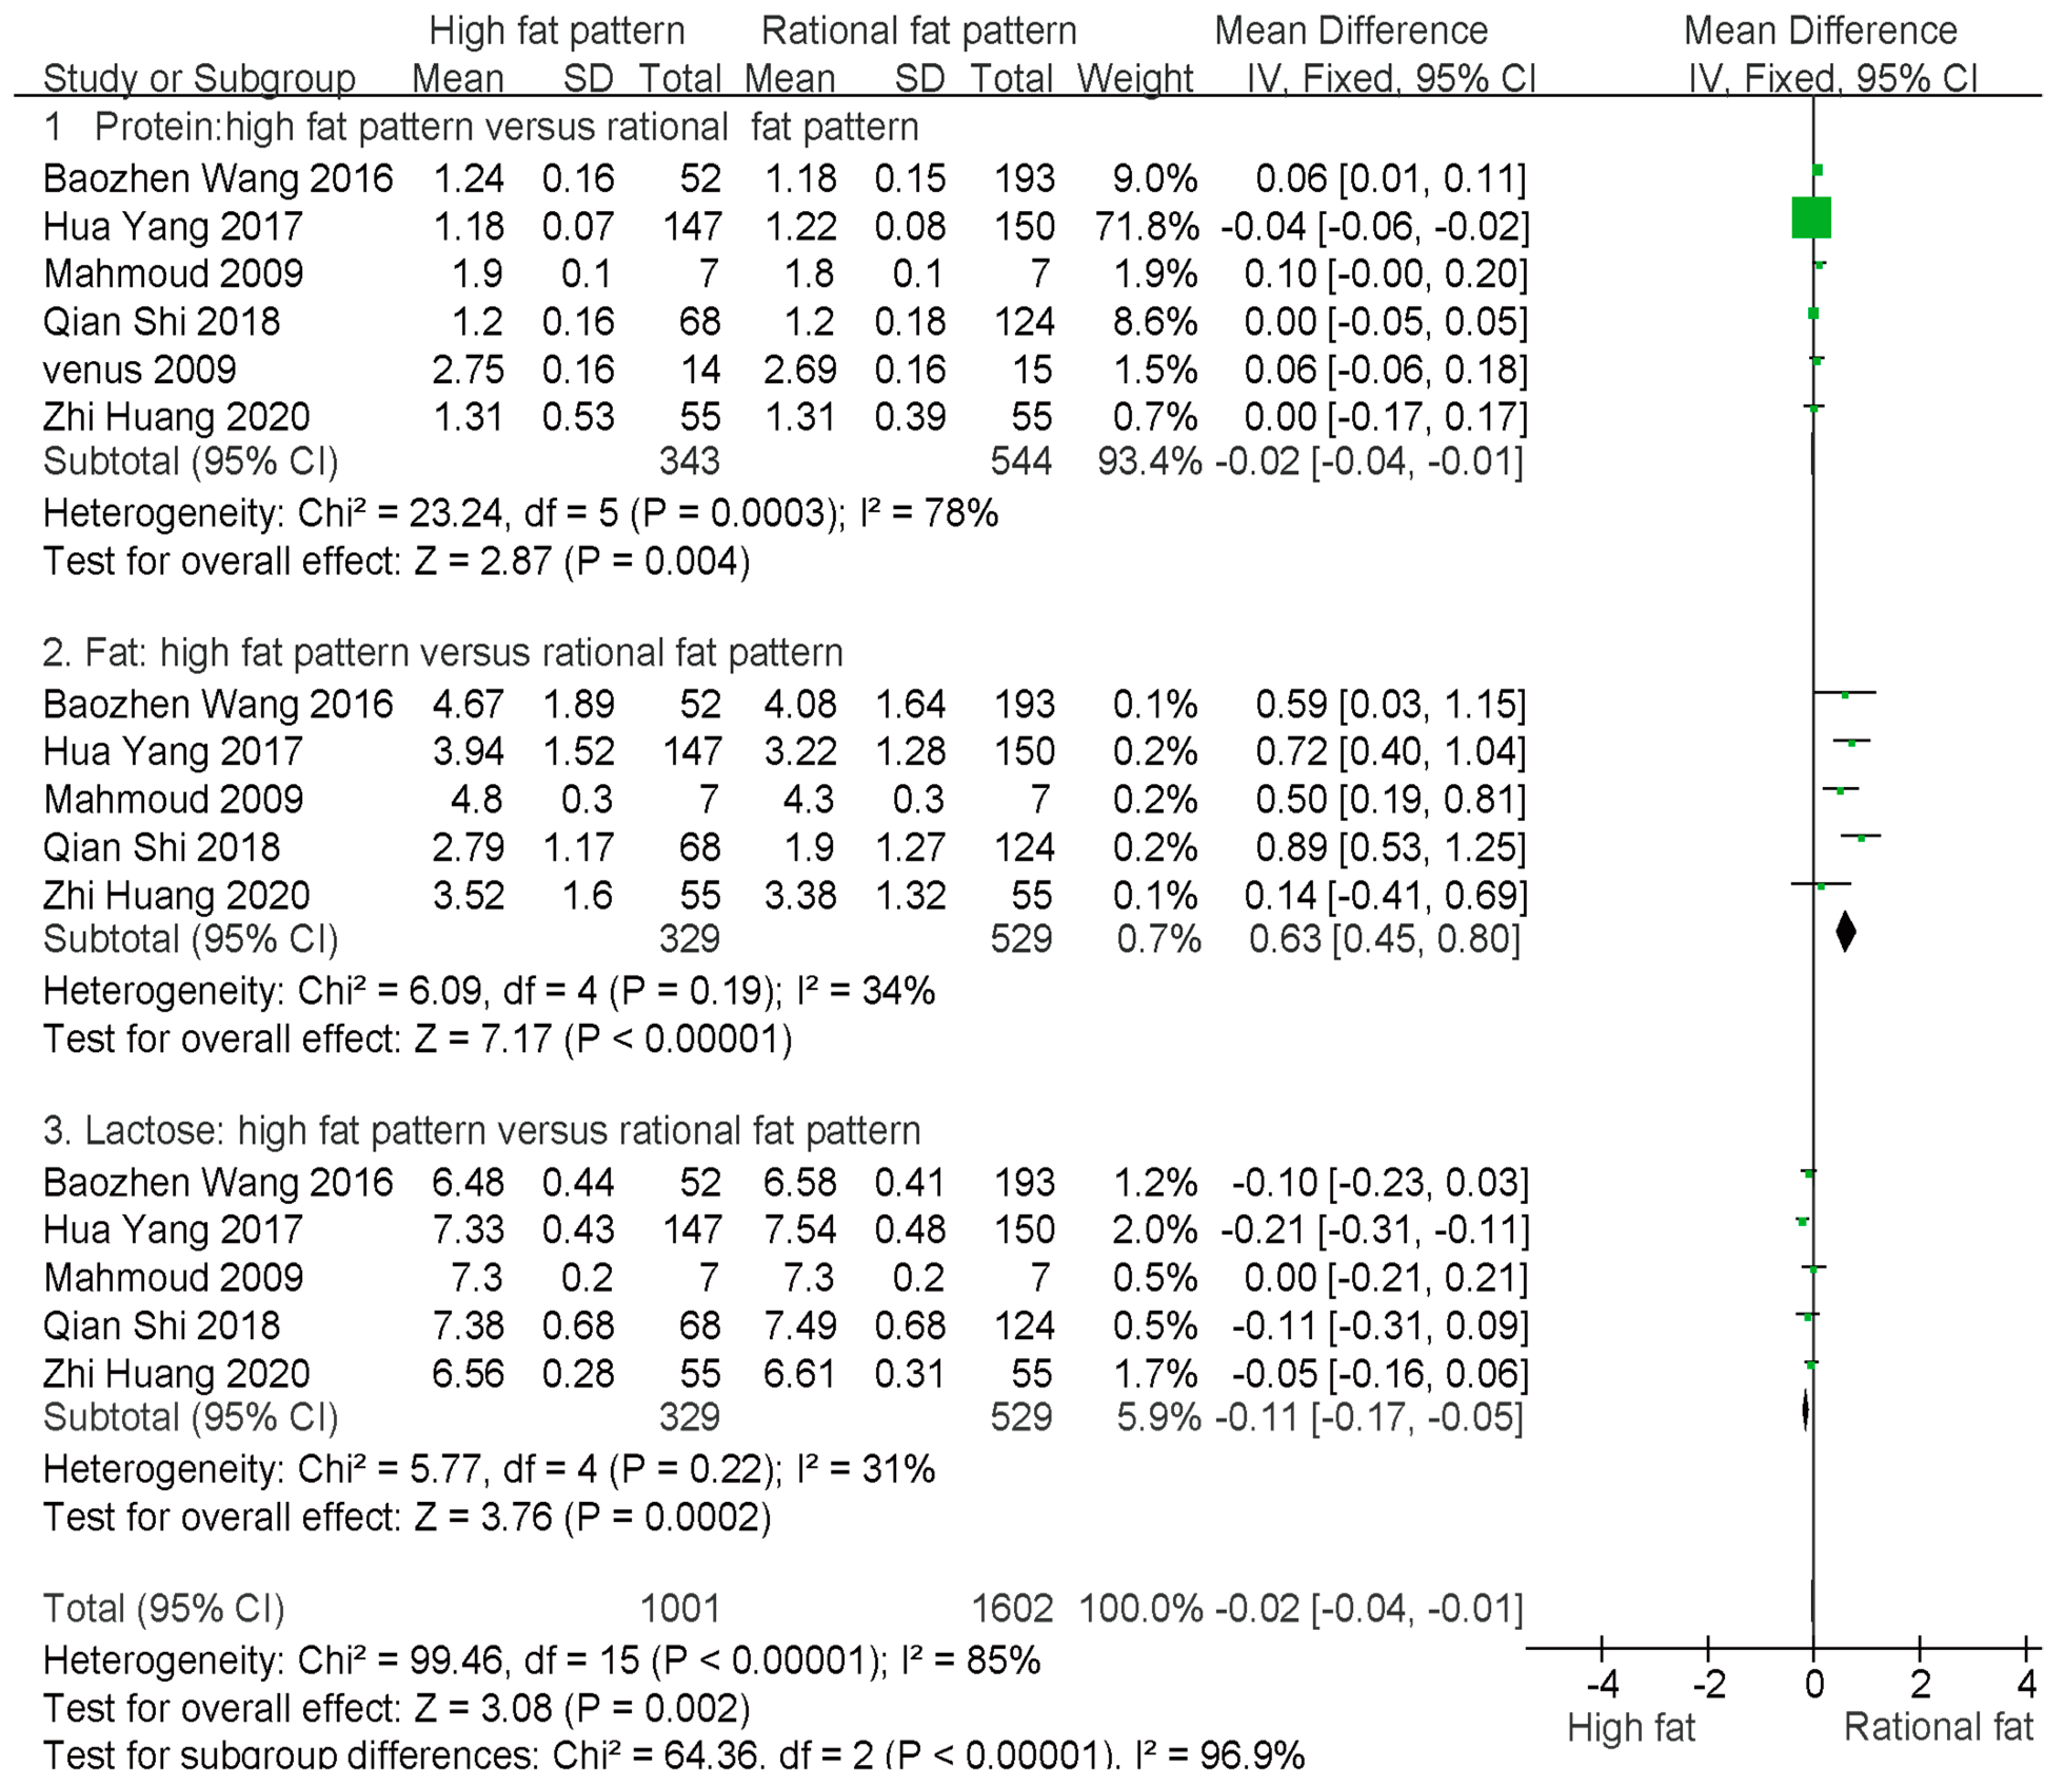
3.6. Comparison of Macronutrient Content between High-Fat and Rational-Fat Patterns
4. Discussion
5. Limitations
6. Conclusions
Supplementary Materials
Author Contributions
Funding
Institutional Review Board Statement
Informed Consent Statement
Data Availability Statement
Conflicts of Interest
References
- Le, H.L.; Blat, S.; Boudry, G.; Breast, V. Formula-feeding: Impacts on the digestive tract and immediate and long-term health effects. Nutr. Res. Rev. 2010, 23, 23–36. [Google Scholar]
- Kramer, M.S.; Chalmers, B.; Hodnett, E.D.; Sevkovskaya, Z.; Dzikovich, I.; Shapiro, S.; Collet, J.P.; Vanilovich, I.; Mezen, I.; Ducruet, T.; et al. Promotion of Breastfeeding Intervention Trial (PROBIT): A randomized trial in the Republic of Belarus. JAMA 2001, 285, 413–420. [Google Scholar] [CrossRef] [PubMed]
- Stam, J.; Saner, P.J.; Boehm, G. Can we define an infant’s need from the composition of human milk? Am. J. Clin. Nutr. 2013, 98, 521S–528S. [Google Scholar] [CrossRef] [Green Version]
- Chung, M.Y. Factors affecting human milk composition. Pediatr. Neonatol. 2014, 55, 421–422. [Google Scholar] [CrossRef] [PubMed]
- Bravi, F.; Wiens, F.; Decarli, A.; Dal Pont, A.; Agostoni, C.; Ferraroni, M. Impact of maternal nutrition on breast-milk composition: A systematic review. Am. J. Clin. Nutr. 2016, 104, 646–662. [Google Scholar] [CrossRef] [Green Version]
- Lin, Y.H.; Hsu, Y.C.; Lin, M.C.; Chen, C.H.; Wang, T.M. The association of macronutrients in human milk with the growth of preterm infants. PLoS ONE 2020, 15, e0230800. [Google Scholar] [CrossRef]
- Chen, J.; Liu, Y.; Zhao, J. Three urban areas of China: A cohort study of maternal-infant factors and HM protein components. Food Funct. 2022, 13, 5202–5214. [Google Scholar] [CrossRef]
- Sabel, K.G.; Lundqvistpersson, C.; Bona, E.; Petzold, M.; Strandvik, B. Fatty acid patterns early after premature birth, simultaneously analyses in mothers’ food, breast milk and serum phospholipids of mothers and infants. Lipids Health Dis. 2009, 8, 20. [Google Scholar] [CrossRef] [Green Version]
- Iranpour, R.; Kelishadi, R.; Babaie, S.; Khosravi-Darani, K.; Farajian, S. Comparison of long chain polyunsaturated fatty acid content in human milk in preterm and term deliveries and its correlation with mothers’ diet. J. Res. Med. Sci. 2013, 18, 1–5. [Google Scholar]
- George, A.D.; Gay, M.C.L.; Wlodek, M.E.; Murray, K.; Geddes, D.T. The Fatty Acid Species and Quantity Consumed by the Breastfed Infant Are Important for Growth and Development. Nutrients 2021, 13, 4183. [Google Scholar] [CrossRef]
- Niwa, S.; Kawabata, T.; Shoji, K.; Ogata, H.; Kagawa, Y.; Nakayama, K.; Yanagisawa, Y.; Iwamoto, S.; Tatsuta, N.; Asato, K.; et al. Investigation of Maternal Diet and FADS1 Polymorphism Associated with Long-Chain Polyunsaturated Fatty Acid Compositions in Human Milk. Nutrients 2022, 14, 2160. [Google Scholar] [CrossRef] [PubMed]
- Aumeistere, L.; Beluško, A.; Ciproviča, I.; Zavadska, D. Trans Fatty Acids in Human Milk in Latvia: Association with Dietary Habits during the Lactation Period. Nutrients 2021, 13, 2967. [Google Scholar] [CrossRef] [PubMed]
- Miliku, K.; Duan, Q.L.; Moraes, T.J.; Becker, A.B.; Mandhane, P.J.; Turvey, S.E.; Lefebvre, D.L.; Sears, M.R.; Subbarao, P.; Field, C.J.; et al. Human milk fatty acid composition is associated with dietary, genetic, sociodemographic, and environmental factors in the CHILD Cohort Study. Am. J. Clin. Nutr. 2019, 110, 1370–1383. [Google Scholar] [CrossRef]
- Guo, Y.H.; Su, M.Y.; Liu, C.P.; Chen, W.L.; Qi, X.Y.; Jia, H.X. Dietary Intake and Nutritional Status of Lactating Mothers in China. J. Dairy Sci. Technol. 2015, 38, 20–22. [Google Scholar]
- Chen, H.; Wang, P.; Han, Y.; Ma, J.; Troy, F.A., 2nd; Wang, B. Evaluation of dietary intake of lactating women in China and its potential impact on the health of mothers and infants. BMC Womens Health 2012, 12, 18. [Google Scholar] [CrossRef] [Green Version]
- Bruce, K.D. Maternal and in utero determinants of type 2 diabetes risk in the young. Curr. Diabetes Rep. 2014, 14, 446. [Google Scholar] [CrossRef]
- Catalano, P.; Demouzon, S.H. Maternal obesity and metabolic risk to the offspring: Why lifestyle interventions may have not achieved the desired outcomes. Int. J. Obes. 2015, 39, 642–649. [Google Scholar] [CrossRef] [Green Version]
- Verduci, E.; Giannì, M.L.; Vizzari, G.; Vizzuso, S.; Cerasani, J.; Mosca, F.; Zuccotti, G.V. The Triad Mother-Breast Milk-Infant as Predictor of Future Health: A Narrative Review. Nutrients 2021, 13, 486. [Google Scholar] [CrossRef]
- Shin, D.; Lee, K.; Song, W. Dietary patterns during pregnancy are associated with risk of gestational diabetes mellitus. Nutrients 2015, 7, 9369–9382. [Google Scholar] [CrossRef] [Green Version]
- Starling, A.P.; Sauder, K.A.; Kaar, J.L. Maternal dietary patterns during pregnancy are associated with newborn body composition. J. Nutr. 2017, 147, 1334–1339. [Google Scholar] [CrossRef] [Green Version]
- Leghi, G.E.; Netting, M.; Muhlhausler, B.S. The short-term impact of dietary fat and sugar intake on breast milk composition: A clinical trial protocol. Nutr. Health 2020, 26, 65–72. [Google Scholar] [CrossRef] [PubMed]
- Dror, D.K.; Allen, L.H. Overview of Nutrients in Human Milk. Adv. Nutr. 2018, 9 (Suppl. S1), 278S–294S. [Google Scholar] [CrossRef] [Green Version]
- Tian, H.M.; Wu, Y.X.; Lin, Y.Q.; Chen, X.Y.; Yu, M.; Lu, T.; Xie, L. Dietary patterns affect maternal macronutrient intake levels and the fatty acid profile of breast milk in lactating Chinese mothers. Nutrition 2019, 58, 83–88. [Google Scholar] [CrossRef] [PubMed]
- Ballard, O.; Morrow, A.L. Human milk composition: Nutrients and bioactive factors. Pediatr. Clin. N. Am. 2013, 60, 49–74. [Google Scholar] [CrossRef] [PubMed] [Green Version]
- Luyan, H.; Danhua, W. Effect of early protein and energy intake on the growth of preterm infants. Chin. J. Contemp. Pediatr. 2012, 14, 247–252. [Google Scholar]
- Bzikowska-Jura, A.; Sobieraj, P.; Szostak-Węgierek, D.; Wesołowska, A. Impact of infant and maternal factors on energy and macronutrient composition of human milk. Nutrients 2020, 12, 2591. [Google Scholar] [CrossRef]
- Bravi, F.; Di, M.M.; Eussen, S.R.B.M.; Agostoni, C.; Salvatori, G.; Profeti, C.; Tonetto, P.; Quitadamo, P.A.; Kazmierska, I.; Vacca, E. Dietary patterns of breastfeeding mothers and human milk composition: Data from the Italian Medidiet study. Nutrients 2021, 13, 1722. [Google Scholar] [CrossRef]
- Bzikowska, J.A.; Czerwonogrodzka, S.A.; Olędzka, G.; Szostak-Węgierek, D.; Weker, H.; Wesołowska, A. Maternal nutrition and body composition during breastfeeding: Association with human milk composition. Nutrients 2018, 10, 1379. [Google Scholar] [CrossRef] [Green Version]
- Liu, J.C.; Dong, X.Y.; Jiang, T.M.; Li, J.T.; Wang, Q.; Chen, L.J. Analysis between correlation factors of neonate and the content of macro nutruents in breast milk. Sci. Technol. Food Ind. 2016, 21, 353–356. [Google Scholar]
- Liu, G.; Ding, Z.; Li, X.; Chen, X.; Wu, Y.; Xie, L. Relationship between polyunsaturated FA levels in maternal diets and human milk in the first month post-partum. J. Hum. Nutr. Diet. 2016, 29, 405–410. [Google Scholar] [CrossRef]
- Leelahakul, V.; Tanaka, F.; Sinsuksai, N.; Vichitsukon, K.; Pinyopasakul, W.; Kido, N.; Inukai, S. Comparison Comparison of the protein composition of breast milk and the nutrient intake between Thai and Japanese mothers. Nurs. Health Sci. 2009, 11, 180–184. [Google Scholar] [CrossRef] [PubMed]
- Burtseva, T.; Solodkova, I.; Savvina, M.; Dranaeva, G.; Shadrin, V.; Avrusin, S.; Sinelnikova, E.; Chasnyk, V. Dietary intakes of energy and macronutrients by lactating women of different ethnic groups living in Yakutia. Int. J. Circumpolar Health 2013, 72, 21519. [Google Scholar] [CrossRef] [PubMed]
- Qian, J.H.; Chen, T.; Lu, W.; Wu, S.; Zhu, J. Breast milk macro- and micronutrient composition in lactating mothers from suburban and urban Shanghai. J Paediatr. Child Health 2010, 46, 115–120. [Google Scholar] [CrossRef] [PubMed]
- Yang, H.; Liming, L. Influence of mother’s diet oil ingredients of breast milk in 297 cases. Chin. J. Matern. Child Health Res. 2017, 28, 897–899. [Google Scholar]
- Gidrewicz, D.A.; Fenton, T.R. A systematic review and meta-analysis of the nutrient content of preterm and term breast milk. BMC Pediatr. 2014, 14, 216–246. [Google Scholar] [CrossRef] [Green Version]
- Gao, X.; Mc Mahon, R.J.; Woo, J.G.; Davidson, B.S.J.; Morrow, A.L.J.; Zhang, Q. Temporal changes in milk proteomes reveal developing milk functions. Proteome Res. 2012, 11, 3897–3907. [Google Scholar] [CrossRef] [PubMed]
- Moher, D.; Liberati, A.; Tetzlaff, J.; Shamseer, L.; Moher, D.; Clarke, M.; Ghersi, D.; Liberati, A.; Petticrew, M.; Shekelle, P.; et al. Preferred reporting items for systematic reviews and meta-analyses: The PRISMA statement. Int. J. Surg. 2010, 8, 336–341. [Google Scholar] [CrossRef] [Green Version]
- Dietary Nutrient Reference Intakes of Chinese Residents; Chinese Nutrition Society: Beijing, China, 2013.
- Fournier, A.K.; Wasserman, M.R.; Jones, C.F.; Beam, E.L.; Gardner, E.E.; Nourjah, P.; Bierman, A.S. Developing AHRQ’s Feasibility Assessment Criteria for Wide-Scale Implementation of Patient-Centered Outcomes Research Findings. J. Gen. Intern Med. 2021, 36, 374–382. [Google Scholar] [CrossRef]
- Wang, B.Z.; Sun, Y.J.; Zhang, H. Investigation of breast milk composition and analysis of influencing factors. Ningxia Med. J. 2016, 38, 758–759. [Google Scholar]
- Shi, Q. Breast Milk Composition and Its Influencing Factors; Soochow University: New Taipei, Taiwan, 2018. [Google Scholar]
- He, S.J.; Liu, X.Q.; Yang, B. The effect of n-3 polysaturated fatty acids content in breast milk of parturients with gestational diabetes mellitus on the early growth and development of infants. Dev. Med. 2019, 7, 274–280. [Google Scholar]
- Lu, T.; Tian, H.; Miao, Y.; Xu, W.H.; Wu, Y.X.; Wang, Y.P.; Lin, Y.Q.; Xie, L. Analysis of the relationship between lactating mother’s diet and milk components and infant growth and development. J. Jilin Univ. 2019, 45, 950–954. [Google Scholar]
- Huang, Z.; Hu, Y.M. Dietary patterns and their association with breast milk macronutrient composition among lactating women. Int. Breastfeed. J. 2020, 15, 52. [Google Scholar] [CrossRef]
- Hou, Y.M.; Yu, S.; Zheng, X.X.; Fu, J.F. Analysis of 240 cases of breast milk composition in Jinan City. Chin. Matern. Child Health Care 2008, 8, 241–243. [Google Scholar]
- Yang, T.T.; Zhang, Y.M.; Ning, Y.B. Breast milk macronutrient composition and the associated factors in urban Chinese mothers. Chin. Med. J. 2014, 127, 1721–1729. [Google Scholar]
- Lv, Z.M.; Ma, H.Q. Influence of nutritional composition on the content of fat in milk. Hebei Med. Sci. 2004, 10, 684–686. [Google Scholar]
- Qian, J.H.; Wu, S.M.; Zhang, W.L.; Ao, L.M.; Yang, H.W. An investigation of nutrients of human milk in Shanghai area. Shanghai Med. 2002, 25, 396–398. [Google Scholar]
- Jiang, H.Y.; Chen, H.H.; Wang, Y.H.; Wang, X.L.; Huang, Y.X.; Yao, Q.; Meng, D.Y. Analysis of nutrient content in breast milk of Nanning City. J. Guangxi Med. Univ. 2005, 5, 42–44. [Google Scholar]
- Jiang, H.Y.; Chen, H.; Wang, Y.; Wang, Y.H. Investigation and analysis of dietary nutrition and milk composition of nursing mothers of Sanjiang Dong ethnic group in Guangxi. South Med. Univ. 2009, 29, 1474–1476. [Google Scholar]
- Zhang, Y.Q. A Survey and Study Dietary of Lactating Women and the Dynamic Changes of Nutritional Components in Breast Milk and the Influence Factors of Infant Growth and Development; Shandong University: Jinan, China, 2016. [Google Scholar]
- Lin, S.; Ye, H.; Zhu, H.N.; Chen, J.D.; Chen, J.; Guo, F.C. Study on the influence of gestational diabetes and dietary intake on milk components 42 days postpartum. Strait J. Prev. Med. 2020, 26, 104–106. [Google Scholar]
- He, B.Z.; Liu, Y.P.; Li, S.S.; Bao, Y.Y.; Sun, X.J.; Wang, D.H. Dietary Intakes of Mothers of Premature Infants and Its Possible Associations with Macronutrients and Energy in Breast Milk. Xiehe Med. J. Peking Union Med. Coll. Hosp. 2014, 5, 376–378. [Google Scholar]
- Hascoët, J.M.; Chauvin, M.; Pierret, C.; Skweres, S.; Egroo, L.V.; Rougé, C.; Franck, P. Impact of Maternal Nutrition and Perinatal Factors on Breast Milk Composition after Premature Delivery. Nutrients 2019, 366, 366. [Google Scholar] [CrossRef] [PubMed] [Green Version]
- Hyesook, K.; Sujeong, K.; Byung, M. Breast milk fatty acid composition and fatty acid intake of lactating mothers in South Korea. Br. J. Nutr. 2017, 117, 556–561. [Google Scholar]
- Mohammad, M.A.; Sunehag, A.L.; Haymond, M.W. Effect of dietary macronutrient composition under moderate hypocaloric intake on maternal adaptation during lactation. Am. J. Clin. Nutr. 2009, 89, 1821–1827. [Google Scholar] [CrossRef] [PubMed] [Green Version]
- Quinn, E.A.; Largado, F.; Power, M.; Kuzawa, C.W. Predictors of Breast Milk Macronutrient Composition in Filipino Mothers. Am. J. Hum. Biol. 2012, 24, 533–540. [Google Scholar] [CrossRef]
- Cao, M.H.; An, Q.; Li, Y. Analysis of breast milk component test results of 4317 cases in Weinan City. Chin. J. Child Health 2016, 24, 739–741. [Google Scholar]
- Hu, R.; Eussen, S.R.B.M.; Sijtsma, F.P.C.; Papi, B.; Stahl, B.; Jin, Y.; Mank, M.; Li, J.; Wang, Z. Maternal dietary patterns are associated with human milk composition in Chinese lactating women. Nutrition 2021, 91–92, 111392. [Google Scholar] [CrossRef] [PubMed]
- Su, Y.Y.; Chen, R.D.; Zhang, Y.H.; Lu, P.T.; Li, N.; Qian, C.L.; Wang, Y. Dietary nutritional status of 102 lactating mothers in the urban area of Lanzhou and its relationship with breast milk composition. South China J. Prev. Med. 2021, 47, 1105–1108. [Google Scholar]
- Lin, H.M.; Chen, S.Y.; Lin, Y.J.; Liu, Y.L. Study on the relationship between breast milk composition analysis and lactating mother’s diet. Prim. Med. Forum. 2021, 29, 4147–4149. [Google Scholar]
- Ding, Y.; Indayati, W.; Basnet, T.B.; Li, F.; Luo, H.; Pan, H.; Wang, Z. Dietary intake in lactating mothers in China 2018: Report of a survey. Nutr. J. 2020, 19, 72. [Google Scholar] [CrossRef]
- Wang, W.Q.; Liu, L.M.; Sun, X.M.; Jia, M.; Acheson, K. Investigation and analysis of diet and milk nutrients of lactating mothers in rural areas of Chengcheng County, Shaanxi. Chin. J. Clin. Nutr. 2006, 14, 171–175. [Google Scholar]
- Iaccarino, I.P.; Scalfi, L.; Valerio, G. Adherence to the Mediterranean Diet in children and adolescents: A systematic review. Nutr. Metab. Cardiovasc. Dis. 2017, 27, 283–299. [Google Scholar] [CrossRef] [PubMed]
- Ding, Y.; Li, F.; Hu, P.; Ye, M.; Xu, F.; Jiang, W.; Yang, Y.; Fu, Y.; Zhu, Y.; Lu, X.; et al. Reproducibility and relative validity of a semi-quantitative food frequency questionnaire for the Chinese lactating mothers. Nutr. J. 2021, 20, 20. [Google Scholar] [CrossRef] [PubMed]
- Wang, Z.; Dang, S.; Xing, Y.; Li, Q.; Yan, H. Dietary patterns and their associations with energy, nutrient intake and socioeconomic factors in rural lactating mothers in Tibet, Asia Pac. J. Clin. Nutr. 2017, 26, 450–456. [Google Scholar]
- Keikha, M.; Bahreynian, M.; Saleki, M.; Kelishadi, R. Macro- and micronutrients of human milk composition: Are they related to maternal diet? A comprehensive systematic review. Breastfeed. Med. 2017, 12, 517–527. [Google Scholar] [CrossRef] [PubMed]
- Ding, Y.; Yang, Y.; Xu, F.; Ye, M.; Hu, P.; Jiang, W.; Li, F.; Fu, Y.; Xie, Z.; Zhu, Y.; et al. Association between dietary fatty acid patterns based on principal component analysis and fatty acid compositions of serum and breast milk in lactating mothers in Nanjing, China. Food Funct. 2021, 12, 8704–8714. [Google Scholar] [CrossRef]
- Wu, W.; Balter, A.; Vodsky, V.; Odetallh, Y.; Ben-Dror, G.; Zhang, Y.; Zhao, A. Chinese Breast Milk Fat Composition and Its Associated Dietary Factors: A Pilot Study on Lactating Mothers in Beijing. Front. Nutr. 2021, 8, 606950. [Google Scholar] [CrossRef]
- Antonakou, A.; Skenderi, K.P.; Chiou, A.; Anastasiou, C.A.; Bakoula, C.; Matalas, A.L. Breast milk fat concentration and FA pattern during the first six months in exclusively breastfeeding Greek women. Eur. J. Nutr. 2013, 52, 963–973. [Google Scholar] [CrossRef]
- Wang, J. Longitudinal Survey of Human Milk Nutritional Components and It’s Influential Factors; Soochow University: New Taipei, Taiwan, 2015. [Google Scholar]
- Liu, C.P. Research Progress on Macro Nutrients of Chinese Breast Milk. J. Anhui Agri. 2013, 41, 12610–12613. [Google Scholar]
- Czosnykowska, L.M.; Królak, O.B.; Orczyk, P.M. Breast Milk Macronutrient Components in Prolonged Lactation. Nutrients 2018, 10, 1893. [Google Scholar] [CrossRef] [Green Version]
- St Jeor, S.T.; Howard, B.V.; Prewitt, T.E.; Bovee, V.; Bazzarre, T.; Eckel, R.H. Dietary protein and weight reduction: A statement for healthcare professionals from the Nutrition Committee of the Council on Nutrition, Physical Activity, and Metabolism of the American Heart Association. Circulation 2001, 104, 1869–1874. [Google Scholar] [CrossRef]

| First Author, Year of Publication | Region | BMI (Mean ± SD) | Age (Mean ± SD) | Sample Size | Dietary Pattern | Breast Milk Composition /Method Analysis | Quality Score |
|---|---|---|---|---|---|---|---|
| Baozhen Wang 2016 [40] | Yinchuan① | -- | -- | 193 | RR① | ①②③/① | 11 |
| Yinchuan① | -- | -- | 52 | HH② | ①②③/① | 11 | |
| Qian Shi 2018 [41] | Beijing② | -- | -- | 68 | HH② | ①②③/① | 11 |
| Beijing② | -- | -- | 124 | RR① | ①②③/① | 11 | |
| Sujian He 2019 [42] | Guangzhou③ | 18.7 ± 2.5 | 27.5 ± 4.4 | 50 | HR④ | ①②③/① | 10 |
| Tong Lu 2019 [43] | Changchun② | -- | -- | 138 | HR④ | ①②③/① | 8 |
| Zhi Huang 2020 [44] | Changsha③ | -- | 18–40 | 55 | HH② | ①②③/① | 10 |
| Changsha③ | -- | 18–40 | 55 | RR① | ①②③/① | 10 | |
| Changsha③ | -- | 18–40 | 55 | RR① | ①②③/① | 10 | |
| Yang Hua 2017 [34] | Xian① | -- | -- | 147 | HH② | ①②③/① | 10 |
| Xian① | -- | -- | 150 | RR① | ①②③/① | 10 | |
| Yanmei Hou 2008 [45] | Jinan② | 27.15 ± 4.3 | 22–35 | 240 | HH② | ①②③/① | 7 |
| Yang Titi 2014 [46] | Beijing② | 23.3 ± 3.1 | 27.2 ± 3.9 | 85 | HH② | ①②③/① | 9 |
| Beijing② | 23.3 ± 3.1 | 27.2 ± 3.9 | 88 | HH② | ①②③/① | 9 | |
| Beijing② | 23.3 ± 3.1 | 27.2 ± 3.9 | 90 | HH② | ①②③/① | 9 | |
| Zhimin Lv 2004 [47] | Qingdao② | -- | -- | 30 | RH③ | ②/② | 11 |
| Qingdao② | -- | -- | 24 | RH③ | ②/② | 11 | |
| Jihong Qian 2009 [33] | Yangpu③ | -- | 26–32 | 30 | RH③ | ①②③/② | 11 |
| Hongkou③ | -- | 25–28 | 30 | RH③ | ①②③/② | 11 | |
| Jingan③ | -- | 26–29 | 30 | RH③ | ①②③/② | 11 | |
| Jihong Qian 2002 [48] | Shanghai③ | -- | 22–36 | 90 | RH③ | ①②③/② | 11 |
| Shanghai③ | -- | 22–36 | 30 | RH③ | ①②③/② | 10 | |
| Huiyun Jiang 2005 [49] | Nanning③ | -- | 20–35 | 120 | RH③ | ①②③/② | 10 |
| Nanning③ | -- | 20–35 | 120 | RH③ | ①②③/② | 10 | |
| Nanning③ | -- | 20–35 | 120 | RH③ | ①②③/② | 10 | |
| Huiyun Jiang 2009 [50] | Nanning③ | - | 20–35 | 120 | HH② | ①②③/② | 10 |
| Yanqiu Zhang 2016 [51] | Jinan② | 20.8 ± 2.8 | 29.4 ± 2.6 | 33 | RH③ | ①②③/① | 10 |
| Song Lin 2020 [52] | Shanghai③ | 20.8 ± 4.1 | 29.0 ± 3.9 | 112 | RH③ | ①②③/① | 8 |
| Bizi He 2014 [53] | Beijing② | 23.3 ± 2.8 | 31.7 ± 3.8 | 31 | RH③ | ①②③/① | 9 |
| Jean 2019 [54] | Nancy④ | 23.2 ± 13.3 | 19–42 | 68 | HH② | ①②③/② | 10 |
| Nancy④ | 23.2 ± 13.3 | 19–42 | 91 | HH② | ①②③/② | 10 | |
| Nancy④ | 23.2 ± 13.3 | 19–42 | 31 | HH② | ①②③/② | 10 | |
| Hyesook 2017 [55] | Seoul② | 22.1 ± 3.1 | 31.6 ± 3.2 | 255 | RR① | ①②③/② | 10 |
| Mahmoud 2009 [56] | TX④ | 23.1 ± 0.5 | 29.3 ± 1.0 | 7 | RH③ | ①②③/② | 9 |
| TX④ | 23.1 ± 0.5 | 29.3 ± 1.0 | 7 | HR④ | ①②③/② | 9 | |
| Venas 2009 [31] | Bangkok③ | 21.1 ± 0.75 | 26 ± 1.4 | 14 | HR④ | ①/② | 9 |
| Yokkaichi③ | 21 ± 0.65 | 30.5 ± 1.3 | 15 | RH③ | ①/② | 9 | |
| Elizabeth 2012 [57] | Cebu③ | 20.4 ± 3.5 | 23.8 ± 0.3 | 102 | RH③ | ①②③/② | 11 |
| Minhui Cao 2016 [58] | Shanxi① | -- | 18–45 | 722 | HH② | ①②③/① | 9 |
| Agnieszka 2018 [28] | Poland④ | 23.0 ± 3.6 | 18–45 | 22 | HH② | ①②③/① | 9 |
| Agnieszka 2020 [26] | Poland④ | 20.4 ± 3.5 | 18–45 | 77 | HH② | ①②③/① | 9 |
| Rui Hu 2021 [59] | Shanghai③ | 29.3 ± 3.4 | -- | 122 | HH② | ①②③/① | 11 |
| Yanyan Su 2021 [60] | Lanzhou② | -- | 21–40 | 102 | RR① | ①②③/① | 11 |
| Huaimei Lin 2021 [61] | Guangdong③ | -- | 23–35 | 210 | HR④ | ①②③/① | 11 |
| Dietary Pattern | Composition Index of Breast Milk | Mean (95% CI) | Heterogeneity Test | Egger’s (p) | Energy Supply (%) | |
|---|---|---|---|---|---|---|
| I2 (%) | p | |||||
| HH | Protein | 1.37 (1.15–1.59) | 99.9 | 0.00 | 0.64 | 8.37 |
| Fat | 3.63 (3.39–3.88) | 98.0 | 0.00 | 0.82 | 49.90 | |
| Lactose | 6.83 (6.52–7.14) | 99.7 | 0.00 | 0.44 | 41.73 | |
| RR | Protein | 1.20 (1.18–1.23) | 74.6 | 0.00 | 0.78 | 7.58 |
| Fat | 3.40 (2.93–3.87) | 97.8 | 0.00 | 0.88 | 48.36 | |
| Lactose | 6.97 (6.68–7.26) | 99.1 | 0.00 | 0.93 | 44.06 | |
| HR | Protein | 1.59 (1.11–2.07) | 99.8 | 0.00 | 0.15 | 9.07 |
| Fat | 3.98 (3.42–4.54) | 96.7 | 0.00 | 0.21 | 51.07 | |
| Lactose | 6.99 (6.60–7.37) | 97.6 | 0.00 | 0.34 | 39.86 | |
| RH | Protein | 1.58 (1.41–1.76) | 99.6 | 0.00 | 0.03 * | 9.49 |
| Fat | 3.34 (2.99–3.69) | 99.6 | 0.00 | 0.09 | 45.15 | |
| Lactose | 7.55 (7.35–7.75) | 97.5 | 0.00 | 0.05 | 45.35 | |
| Patterns | Protein Heterogeneity I2 Value (%) | Fat Heterogeneity I2 Value (%) | Lactose Heterogeneity I2 Value (%) | |||||||||
|---|---|---|---|---|---|---|---|---|---|---|---|---|
| Group | LCD | RCD | HCD | Group | LCD | RCD | HCD | Group | LCD | RCD | HCD | |
| HH | 99.9 | 99.4 | 99.9 | 49.6 * | 98.0 | 78.1 * | 0.0 * | 97.5 | 99.7 | 96.8 | 99.7 | 98.7 |
| RR | 74.8 | -- | 74.8 | -- | 97.8 | -- | 97.8 | -- | 99.1 | -- | 99.1 | -- |
| HR | 99.8 | 98.0 | 99.9 | -- | 96.7 | 95.8 | -- | -- | 97.6 | 81.2 * | -- | -- |
| RH | 99.6 | -- | 99.4 | 99.8 | 99.6 | -- | 99.4 | 98.3 | 97.5 | -- | 97.2 | 97.6 |
| Patterns | Protein Heterogeneity I2 Value (%) | Fat Heterogeneity I2 Value (%) | Lactose Heterogeneity I2 Value (%) | ||||||
|---|---|---|---|---|---|---|---|---|---|
| Group | Analyzer | Manual | Group | Analyzer | Manual | Group | Analyzer | Manual | |
| HH | 99.9 | 99.9 | 85.1 * | 98.0 | 90.3 | 0.0 * | 99.7 | 98.8 | 14.4 * |
| RR | 74.8 | 72.3 | -- | 97.8 | 97.8 | -- | 99.1 | 99.1 | -- |
| HR | 99.8 | 99.1 | 99.8 | 96.7 | 96.9 | -- | 97.6 | 97.7 | -- |
| RH | 99.6 | 24.2 * | 99.6 | 99.6 | 99.7 | 0.0 * | 97.5 | 98.0 | 97.5 |
| Patterns | Protein Heterogeneity I2 Value (%) | Fat Heterogeneity I2 Value (%) | Lactose Heterogeneity I2 Value (%) | ||||||||||||
|---|---|---|---|---|---|---|---|---|---|---|---|---|---|---|---|
| Group | W | N | S | EU | Group | W | N | S | EU | Group | W | N | S | EU | |
| HH | 99.9 | 85.2 * | 99.9 | -- | 97.2 | 98.0 | 97.2 | 83.6 | -- | 99.3 | 99.7 | 99.3 | 99.9 | -- | 14.4 * |
| RR | 74.8 | 90.0 | 0.0 * | 0.0 * | -- | 97.8 | 94.5 | 99.7 | 99.9 | -- | 99.1 | 99.1 | 99.2 | -- | 14.4 * |
| HR | 99.8 | 85.4 * | 100 | -- | 85.1 * | 96.7 | -- | 90.7 | 99.8 | -- | 97.6 | -- | -- | -- | -- |
| RH | 99.6 | -- | 46.2 * | 99.7 | -- | 99.6 | -- | 88.5 * | 99.7 | -- | 97.5 | -- | -- | 96.2 | 97.9 |
Disclaimer/Publisher’s Note: The statements, opinions and data contained in all publications are solely those of the individual author(s) and contributor(s) and not of MDPI and/or the editor(s). MDPI and/or the editor(s) disclaim responsibility for any injury to people or property resulting from any ideas, methods, instructions or products referred to in the content. |
© 2023 by the authors. Licensee MDPI, Basel, Switzerland. This article is an open access article distributed under the terms and conditions of the Creative Commons Attribution (CC BY) license (https://creativecommons.org/licenses/by/4.0/).
Share and Cite
Xi, Q.; Liu, W.; Zeng, T.; Chen, X.; Luo, T.; Deng, Z. Effect of Different Dietary Patterns on Macronutrient Composition in Human Breast Milk: A Systematic Review and Meta-Analysis. Nutrients 2023, 15, 485. https://doi.org/10.3390/nu15030485
Xi Q, Liu W, Zeng T, Chen X, Luo T, Deng Z. Effect of Different Dietary Patterns on Macronutrient Composition in Human Breast Milk: A Systematic Review and Meta-Analysis. Nutrients. 2023; 15(3):485. https://doi.org/10.3390/nu15030485
Chicago/Turabian StyleXi, Qinghua, Weixin Liu, Tianyuan Zeng, Xuan Chen, Ting Luo, and Zeyuan Deng. 2023. "Effect of Different Dietary Patterns on Macronutrient Composition in Human Breast Milk: A Systematic Review and Meta-Analysis" Nutrients 15, no. 3: 485. https://doi.org/10.3390/nu15030485