Abstract
The problem of poor nutrition with impaired growth persists in young children worldwide, including in India, where wasting occurs in 20% of urban children (<5 years). Exacerbating this problem, some children are described by their parent as a picky eater with behaviors such as eating limited food and unwillingness to try new foods. Timely intervention can help prevent nutritional decline and promote growth recovery; oral nutritional supplements (ONS) and dietary counseling (DC) are commonly used. The present study aimed to determine the effects of ONS along with DC on growth in comparison with the effects of DC only. Enrolled children (N = 321) were >24 to ≤48 months old, at malnutrition risk (weight-for-height percentile 3rd to 15th), and described as a picky eater by their parent. Enrollees were randomized to one of the three groups (N = 107 per group): ONS1 + DC; ONS2 + DC; and DC only. From day 1 to day 90, study findings showed significant increases in weight-for-height percentile for ONS1 + DC and for ONS2 + DC interventions, as compared to DC only (p = 0.0086 for both). There was no significant difference between the two ONS groups. Anthropometric measurements (weight and body mass index) also increased significantly over time for the two ONS groups (versus DC only, p < 0.05), while ONS1 + DC significantly improved mid-upper-arm circumference (p < 0.05 versus DC only), as well. ONS groups showed a trend toward greater height gain when compared to DC only group, but the differences were not significant within the study interval. For young Indian children with nutritional risk and picky eating behaviors, our findings showed that a 90-day nutritional intervention with either ONS1 or ONS2, along with DC, promoted catch-up growth more effectively than did DC alone.
1. Introduction
In children, growth is a recognized indicator of nutritional status [1]. The number of children worldwide with poor growth remains alarmingly high today [2,3,4]. Global growth statistics recently showed nearly 50 million children under 5 years old were wasted (low weight-for-height), and 149 million were stunted (low height-for-age)—with Asia and Africa bearing the greatest share [4]. Although such growth markers are improving in India, about 20% of young children (<5 years) were recently reported as wasted and 36% as underweight [5,6,7]. If undernutrition and growth faltering are not addressed in early childhood, some consequences are irreversible and can negatively affect the ability of these children to learn during their school years and to reach their full potential as productive adults [4,8,9].
To facilitate early detection of problems, the World Health Organization has developed growth standards for children by age and sex [1]. Three often-used anthropometric indices are weight-for-age, height-for-age, and weight-for-height, which are expressed in Z-scores (standard deviation values) or as percentiles [1,10]. Other measures—body mass index (BMI)-for-age and arm circumference-for-age-are also used to evaluate growth [1]. A Z-score between −2 and −1 (corresponding approximately to the 3rd to 15th percentile) represents mildly poor growth and corresponding mild undernutrition (also called malnutrition risk), while a Z-score between −3 and −2 indicates moderate undernutrition, and <−3 signifies severe undernutrition [11]. Likewise, wasting is defined by weight-for-height Z-scores (WHZ), stunting by height-for-age Z-scores (HAZ), and underweight by weight-for-age Z-scores (WAZ).
Children may not get sufficient healthful, nutritious foods for normal growth for a variety of reasons—lack of information or education on healthy food supplies, limited access to healthy foods, or cultural preferences of the family [12]. As well, picky eating behaviors put some young children at real nutritional risk [13,14,15,16]. Children described as picky eaters were more likely than non-picky eaters to be underweight [15,17]. Nutritional shortfalls not only increase a child’s risk for compromised growth but also increase vulnerability to infectious pathogens, in turn heightening risk for illnesses [18]. In developing countries, children who were just mildly malnourished (weight-for-height Z scores between −2 and −1) [19] were at greater risk of morbidity and mortality [20].
Around the world, and especially in developing countries, health professionals and parents alike are concerned about poor health outcomes related to undernutrition (wasting, stunting, and underweight) in early childhood [19,21]. Importantly, nutritional intervention for young children with malnutrition risk can help prevent further growth faltering and promote catch-up growth [22]. When a child with evidence of wasting also displays picky eating habits, there is a potential need for nutritional intervention to support adequate growth and to improve health outcomes. This report describes our study in India of young children who were mildly undernourished (defined as weight-for-height Z-score between −2 and −1, i.e., between the 3rd and 15th percentiles) and picky eaters but were otherwise healthy. In this three-arm study, we evaluated the impact of a 90-day intervention with one of two oral nutritional supplement formulations (ONS1 and ONS2) plus dietary counseling (DC) on growth, as compared with the impact of a 90-day intervention of DC only.
2. Materials and Methods
The study protocol, all amendments, and the informed consent form were reviewed and approved by the Independent Ethics Committee/Institutional Review Boards of all 10 study hospitals. Parents or guardians of subjects voluntarily gave written informed consent prior to enrollment. The study was performed in accordance with the protocol, Good Clinical Practice (GCP) guidelines (Vijayananthan and Nawawi 2008), local regulations governing clinical study conduct, and the ethical principles that have their origin in the Declaration of Helsinki. The study was registered at clinicaltrials.gov in the US (Abbott Nutrition 2015) (NCT02523027) and with Clinical Trials Registry India (CTRI/2015/10/006330 (Abbott Nutrition International India 2015).
This multi-center (10 hospitals and clinics in urban or semi-urban India), prospective, randomized, double-blinded study used two parallel treatment groups and one open-labeled control group. The groups were: (i) ONS1 + DC, (ii) ONS2 + DC, and (iii) control DC only. A parent/guardian gave each child the designated ONS and attended DC sessions on feeding his or her child. The study collected data at baseline and four follow-up time points in the 90-day intervention period, i.e., Days 1 (baseline), 7, 30, 60, and 90. At Day 1, the parents/guardians in experimental groups received their respective ONS1 + DC or ONS2 + DC, whereas parents/guardians of children in the control group received only DC. After Day 1, experimental group children were given their respective ONS daily for 90 days. Parents/guardians of children in all groups underwent additional DC sessions at Days 7, 30, and 60.
ONS1 and ONS2 (PediaSure and PediaSure Advance, respectively, Abbott Healthcare Private Limited, Mumbai, India) had similar nutrient compositions, but ONS1 was milk-based, while ONS2 was lactose-free, as detailed in Table S1 (Supplementary Materials). Both formulations contained 3 macronutrients with matching levels of protein (at 12% of energy), 28 vitamins and minerals, and the pre-biotic fiber fructo-oligosaccharide (FOS). The fat energy percent was higher and carbohydrate energy percent was lower in ONS 2 as compared to ONS 1.
For inclusion, study subjects were of either sex, >24 months but ≤48 months of age at day 1, and each had a weight-for-height between the 3rd and 15th percentiles according to the WHO Growth Standards 2006 (WHO 2006, Mehta, Corkins et al. 2013). Included subjects were designated by a parent or guardian as a picky eater when the child met at least two of the following criteria: (a) eats only a limited number of foods, (b) is unwilling to try new foods, (c) refuses to eat vegetables or foods from other food groups, (d) shows strong food likes and dislikes, and (e) has behaviors that disrupt mealtime. Additionally, a child was included only if he or she habitually drank at least 1 glass milk (approx. 200 mL) per day. Each child’s parent or guardian agreed to abstain from giving non-study nutritional supplements (vitamin and mineral supplements, micro-nutrient-fortified beverages, and ONS other than the study products) during the intervention phase.
Subjects were excluded from the study if they had been diagnosed or were known to be: (a) be lactose intolerant and galactosemic; (b) be allergic or intolerant to any ingredient found in the study product; (c) have a current acute or chronic infection including but not restricted to respiratory infection, diarrhea, Hepatitis B or C, HIV infection or tuberculosis; (d) have severe gastrointestinal disorders including celiac disease, short bowel syndrome, pancreatic insufficiency, or cystic fibrosis; (e) have a diagnosis of neoplastic, renal, hepatic or cardiovascular disease, hormonal or metabolic disorders, congenital disease or genetic disorders such as atrial or ventricular wall defects, or Down’s syndrome, infantile anorexia nervosa, developmental disability, including physical disorders such as cerebral palsy, or developmental delay (f) diagnosed with disorders of hemoglobin structure, function or synthesis according to medical records or parent/guardian report, or (g) have had a clinically significant nutritional deficiency requiring specific treatment with another nutritional supplement (other than the study product) or (h) have any other clinically significant medical condition, which, in the investigator’s opinion, made the child unsuitable for inclusion in the study.
We assigned enrolled subjects and randomly allocated each to a treatment group. Randomization schedules were computer-generated using a pseudo-random permuted blocks algorithm. Randomization was stratified by study center. For blinding of treatments, we placed ONS1 and 2 product pouches in a white opaque jar labeled with a seven-character product code. Neither investigators, their staff, members of Abbott Nutrition’s staff, nor families of subjects were informed of the ONS identity during the study period. Study center personnel did not analyze the ingredients of the ONS formulations, nor did they seek to identify the ONS products. The frequency of follow-up and outcome measurements were identical in both treatment groups.
For each study subject, a measuring shaker (calibrated to 200 mL) was provided for reconstitution of ONS powder and for measuring ONS consumption. Compliance was calculated as ONS intake divided by recommended intake over the study period. Subjects in the ONS groups took a minimum of 1 serving/day or a maximum of 2/day for the 90-day intervention interval. Compliance was assessed via diary records kept by the parent/guardian; subjects were considered compliant if they consumed at least 75% of the recommended ONS intake.
The primary outcome measure was change in weight-for-height percentile from Day 1 to Day 90. Other outcomes were changes in anthropometric indices from Day 1 (baseline) to Days 30, 60, and 90. Anthropometric measurements of weight, height, body mass index (BMI), and mid-upper-arm circumference (MUAC) were made on Days 1, 30, 60, and 90 for all three groups; weight was also measured on Day 7. All measurements were performed by study staff who had been trained to use standardized methods. Weight was measured (in minimal clothes, with shoes and jackets removed) using calibrated electronic weighing scales (Phoenix PPS-160) and was recorded to the nearest 0.1 kg. Standing height was measured (shoes, hat removed) using a height stadiometer (Escala) and was recorded to the nearest 0.1 cm. BMI was calculated as BMI = weight (in kg) ÷ height (in m2). MUAC was determined with a non-stretchable measuring tape and was recorded to the nearest millimeter. We expressed these measures as sex–age-specific Z-scores and percentiles based on the WHO Child Growth Standards 2006 (WHO 2006, WHO 2007) for weight-for-height, weight-for-age, BMI-for-age, height-for-age, and MUAC-for-age.
We also assessed the average energy consumption based on the parents’/guardians’ 24 h dietary recall reports. A trained dietitian provided dietary counseling, which included guidelines for consuming a balanced diet and a wide variety of foods from various food groups, improving the quality of the diet, and for meeting the child’s daily nutritional requirements. From each child’s parent or guardian, the dietitian collected one 24 h dietary recall at baseline and at each follow-up time point by an in-person, on-site interview. For consistency, a trained dietitian at the Madras Diabetes Research Foundation (MDRF), Chennai, reviewed the energy consumption report from all study sites. Comparison with the Estimated Average energy Requirement (EAR) 2020 for 1–3-year-olds (1110 Kcal/d) and 4–6-year-olds (1360 Kcal/d) have been made, as subjects in this study were > 2 and ≤ 4 years.
Adverse events (AEs) were reported by parents and caregivers and verified by study physicians. All diagnoses of reported AEs were standardized using the Medical Dictionary of Regulatory Activities (MedRA) version 21.1.
All randomized subjects who consumed any amount of the study product were included in the intention-to-treat (ITT) cohort, and ITT analyses were made on an ITT basis. Continuous variables at baseline and post-intervention were analyzed using parametric tests (analysis of covariance, ANCOVA) unless the distribution of the variable was declared non-normal, in which case a non-parametric test (Wilcoxon rank sum test) was used. Residuals from the parametric analysis were used to check for deviation from normality by a combination of methods (stem-and-leaf plot, normality plot, and Shapiro–Wilk test). All hypothesis testing, except for the tests for interaction and normality, were done using 2-sided, 0.05 level tests of significance. The step-down Bonferroni (Holm) procedure was used to adjust the significance levels for multiple comparisons. For parametric analyses of post-intervention growth variables, the covariates age, study site, and gender were added, and interactions between study site and gender were included. For analyses of baseline variables with ANCOVA, age, gender, and study site were used as covariates. For growth variables, changes-from-baseline in each treatment group were also analyzed using a one-sample paired t-test or a signed rank test (if declared non-normal). Categorical variables were analyzed using Cochran–Mantel–Haenszel, Chi-square, or Fisher’s exact test. Tests for interactions and normality were done using 2-sided, 0.10- and 0.001-levels, respectively. When an interaction was significant, the step-down Bonferroni (Holm) procedure was used to adjust the significance levels for multiple comparisons. Statistical software SAS release 9.3 (SAS Institute Inc., Cary, North Carolina, USA) was used. A p-value < 0.05 was considered statistically significant.
3. Results
A total of 321 eligible children were included in the study; each child was randomly assigned to one of three study groups (N = 107 children per group) as shown in the CONSORT Flow Diagram (Figure 1) (Schulz, Altman et al. 2010). For study eligibility, each subject was between ages 24 and 48 months, was mildly wasted, and was described by a parent–guardian as a picky eater. At the time of recruitment, most subjects met the inclusion criteria. Four subjects were found to be ineligible, as their weight-for-height was not between the 3rd and 15th percentiles on Day 1. Of the ITT subjects, 21 subjects were not evaluable, mainly due to non-compliance with consuming the study product. Data were collected from June 2016 to February 2017; the intervention interval was 90 days for each included subject.
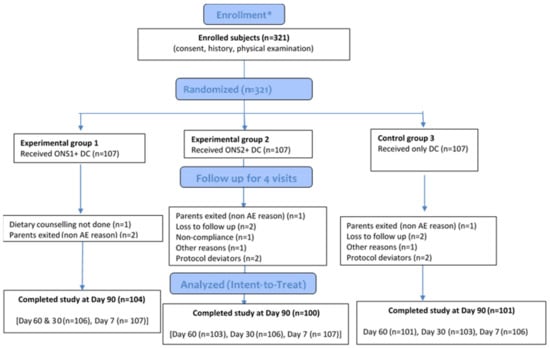
Figure 1.
CONSORT 2010 flow diagram * Enrollment and randomization was at baseline/visit 1. Baseline and demographic characteristics were reported for all randomized subjects. (ONS: Oral Nutritional Supplement; DC: Dietary Counseling; AE: Adverse Event).
3.1. Baseline Socio-Demographic and Anthropometric Characteristics
For baseline socio-economic characteristics, there were no significant between-group differences (ONS1 + DC, ONS2 + DC, and DC only) for gender distribution, age at enrollment, family composition and structure, maternal/paternal mean age, maternal/paternal schooling years, and subjects’ habitual milk drinking. The full study enrolled a higher proportion of boys (60%) than girls (40%); the mean age at enrollment age was 2.93 years (Table 1). Two-adult families were predominant (57%) for all subjects, with the next largest proportion as three- or four-adult families (28%). Most families had one child ≤5 years in the family (63%), and most subjects were from nuclear families (71%) with 64% of mothers voluntarily not working and 98% of fathers employed full time. The mean age of mothers was 28 years, while that of fathers was 32.7 years. Baseline anthropometric characteristics in the study group (N = 321) showed mean values as weight of 11.11 kg, height of 88.78 cm, BMI of 14.06 kg/m2, and MUAC of 14.08 cm. At baseline, there were no significant differences between the three groups for weight, height, BMI, and MUAC after adjusting for the effects of age at enrollment, site, and gender (Table 1).

Table 1.
Baseline characteristics for study population and treatment groups.
There were no significant between-group differences for weight-for-height, weight-for-age, height-for-age, and MUAC-for-age Z-scores and percentiles. However, there was a significant difference between the two ONS groups for the weight-for-height Z-score. Baseline anthropometric characteristics were thus comparable among the three study groups.
3.2. Primary Outcome: Change in Weight-for-Height Percentile
Change in weight-for-height percentile from Day 1 to Day 90 showed significant increases for the ONS1 + DC group and for the ONS2 + DC group, as compared to the group with DC only (p = 0.0086 for both). There was no significant difference between ONS1 and ONS2 treatment groups (p = 0.935) at 90 days (Figure 2).
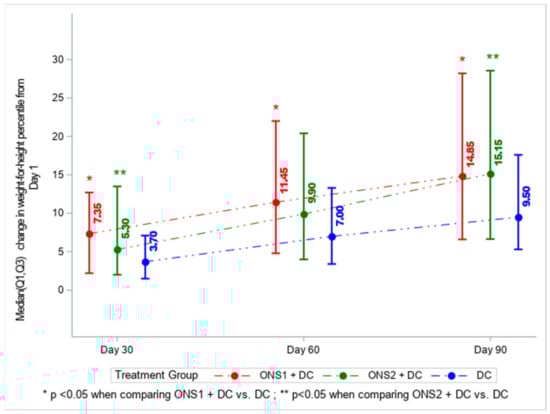
Figure 2.
Change in weight-for-height percentile from Day 1 to Days 30, 60, 90 by intervention group: ONS1 + DC, ONS2 + DC, or DC only. p-values were calculated using the Wilcoxon rank sum test.
3.3. Absolute Change in Weight, Height, BMI, and MUAC across Time Points
In terms of anthropometric outcomes, we determined changes in weight, height, BMI, and MUAC over a 90-day interval with measurements made on days 1, 7, 30, 60, and 90 (Figure 3a–d). For changes in weight (Figure 3a), significant differences were observed between ONS1 + DC versus DC only group from Day 1 to Day 7 (p = 0.0222), Day 30 (p = 0.0015), Day 60 (p = 0.0043), and Day 90 (p = 0.0012). Significant differences were observed between the ONS2 + DC group versus DC only group from Day 1 to Day 30 (p = 0.0140) and Day 90 (p = 0.0012). For changes in height (Figure 3b), between-group differences were not statistically significant over the 90-day time course. However, a trend for both ONS1 + DC and ONS2 + DC showing a higher median change in height (0.9 cm, p = 0.52 and 0.7 cm, p = 0.79, respectively) compared to DC only (0.6 cm) at 90 days was observed. For BMI (Figure 3c), significant differences in changes were observed between ONS1 + DC versus DC only from Day 1 to Day 30 (p = 0.0172), Day 60 (p = 0.0075) and Day 90 (p = 0.0185). Significant BMI differences were observed between ONS2 + DC versus DC only from Day 1 to Day 30 (p = 0.0358) and Day 90 (p = 0.0064). For MUAC, significant differences in changes were observed from Day 1 to Day 60 (p = 0.0230) and Day 90 (p = 0.0418) between ONS1 + DC versus DC only (Figure 3d). For all the anthropometric measurements of weight, height, BMI, and MUAC, there were no significant differences between the two ONS groups. For the full dataset, see Table S2.
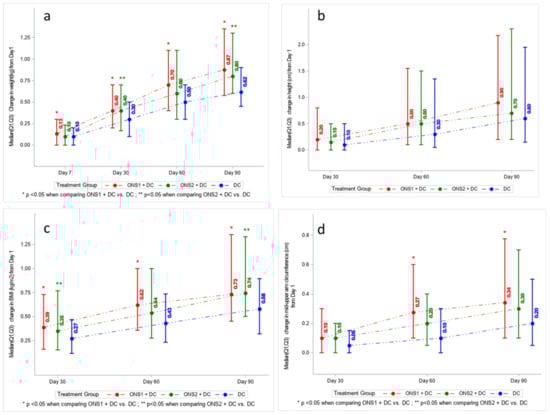
Figure 3.
Change from Day 1 to Days 30, 60, 90 by study group for (a) weight, (b) height, (c) Body Mass Index, and (d) Mid Upper Arm Circumference.
3.4. Changes in Growth Indicators (as Percentiles and Z-Scores) across Time Points
As additional indicators of catch-up growth, we evaluated weight-for-age, BMI-for-age, weight-for-height, height-for-age, and MUAC-for-age percentiles by treatment group (full dataset in Table S3). Expressed as weight-for-age, we observed significant positive changes in percentile values for ONS1 + DC at 30, 60, and 90 days in comparison with the DC only group. For ONS2 + DC, changes in weight-for-age percentiles were significant only at Day 90 (Figure 4a). As BMI-for-age percentiles (Figure 4b), we observed significant positive differences in changes for ONS1 + DC at Days 30, 60, and 90, as compared to DC only. For ONS2 + DC, changes were significantly higher at Day 90. While the absolute height increased over time, we noted that the height-for-age percentile did not show an increase over time. For MUAC-for-age percentiles also, ONS1 + DC reported significant change from Day 1 to Day 90 (p = 0.0241) and Day 1 to Day 60 (p = 0.0342) (graphs not shown).
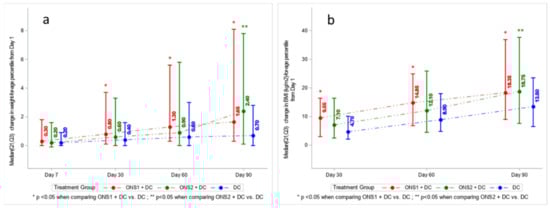
Figure 4.
Changes in growth indicators expressed as percentiles: (a) Weight-for-age, (b) BMI-for-age.
The weight-for-age, weight-for-height, height-for-age, BMI-for-age Z-scores and MUAC-for-age Z-scores were also assessed (Table S4). They showed similar patterns to percentile changes for both treatment groups, as compared to the DC only group.
3.5. Dietary Parameters
Energy intake was assessed based on the parents’/guardians’ 24 h dietary recall reported in interviews with the dietitian at follow-up timepoints. At baseline, energy intake for all groups was lower as compared to the Estimated Average energy Requirements (EAR 2020) [23], with no significant differences between the three groups. We found significant improvement in the average intakes of energy for both ONS1 + DC and ONS2 + DC vs. the control group for all the follow-up timepoints (Figure 5).
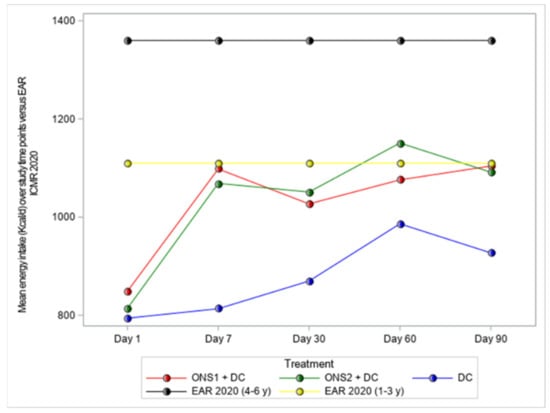
Figure 5.
Mean energy intake (Kcal/d) compared to EAR 2020* at baseline and follow-up timepoints. * EAR for energy is equivalent to the estimated energy requirement (EER).
Compliance was assessed via diary records kept by the parent/guardian; subjects were considered compliant if they consumed at least 75% of the recommended ONS intake. There was high product compliance (approximately 99%) reported for the two experimental groups.
3.6. Adverse Events
Adverse events (AEs) were reported in 26 (24.3%), 33 (30.8%), and 20 (18.7%) children in the ONS1 + DC, the ONS2 + DC and the control groups, respectively. The most frequently reported AEs were respiratory and gastrointestinal tract events. There were no statistically significant differences in the number of AEs related to gastrointestinal or upper respiratory tract between the two ONS groups and between each ONS group and the control group (p > 0.05). Overall, there were no safety concerns associated with the consumption of the two products.
4. Discussion
Children at risk of malnutrition (Z-scores between −2 and −1, corresponding to 3rd to 15th anthropometric percentiles) are at increased risk of growth impairment, morbidities, and mortality; when such children also have picky eating behaviors, they are at even greater risk for poor growth and health outcomes. Timely and effective nutritional interventions are key to preventing further growth faltering and to promoting catch-up growth; ONS can be used to support adequate growth while promoting healthy eating behaviors (Box 1). In our current study on catch-up growth for such children, we examined the impact of two ONS formulas—one milk-based (ONS1) and the other lactose-free (ONS2)—over a 90-day interval. Both ONS formulas contained three macronutrients (with protein as 12% of energy), 28 vitamins and minerals, and the pre-biotic fiber fructo-oligosaccharide.
Findings in our study demonstrated the efficacy of parent- or guardian-guided daily ONS consumption by 2–4-year-old children who were at risk for malnutrition and had picky eating behaviors. With a 90-day ONS intervention, we found significant increases in WHO weight-for-height percentile (the primary outcome measure) from Day 1 to Day 90 for ONS1 + DC vs. DC alone, as well as for ONS2 + DC vs. DC only. We also found significant positive changes in other anthropometric indicators of growth when comparing ONS1 or ONS2 + DC versus DC only—weight and BMI as absolute measures, as well as weight-for-age and BMI-for-age as growth percentiles and as Z-scores. Low weight-for-height percentile indicates an acute malnutrition risk. In a review including 10 prospective studies with more than 53,000 children under 5 years old, mild wasting has been shown to be associated with about 62% greater risk of mortality due to infections when compared to normal children [20]. Hence, promoting catch-up growth in weight in mildly wasted children helps improve health outcomes.
We observed a trend for improvement in height over the 90-day study interval, but changes did not reach statistical significance. While wasting is a measure of an acute malnutrition, stunting is an indicator of chronic malnutrition, which is a result of a slow and cumulative process caused by sustained nutrient inadequacies [24]. Thus, nutritional intervention to promote catch-up growth in height takes longer as compared to catch-up weight. It should be noted that although children were enrolled based on mild wasting, they also had mild stunting. Most studies of nutritional repletion and height gain in stunted children used a time course of 6 months or longer [25].
For experimental groups, we observed high compliance with product intake (99%), which was associated with significant improvement in the average energy intakes. Taken together, our findings confirm and extend prior studies in which ONS, along with dietary counseling, was more effective than dietary counseling alone to promote catch-up growth.
Box 1. Summary: study rationale, key study results, and take-home messages.
- Children at risk of malnutrition (Z-score between −2 and −1) are at increased risk of impaired growth and other morbidities; when these children also have picky eating behaviors, they are at even greater risk for poor growth and health outcomes. For such children, it is important for healthcare providers to offer timely and effective interventions aimed at stopping further growth faltering and promoting catch-up growth.
- Daily ONS consumption, along with dietary counseling (DC) on healthier eating behaviors, can be used to help ensure adequate growth and to lessen risk for morbidities. In this study of catch-up growth, we examined the impact of two ONS formulas—one milk-based (ONS-1) and the other lactose-free (ONS-2)—used over a 90-day interval along with DC.
- Findings showed significant increases in weight-for-height percentile for ONS1 + DC and for ONS2 + DC interventions, as compared to DC only. Anthropometric measurements (weight and body mass index) also increased significantly over time for the two ONS groups.
- Growth parameters were comparable for both groups receiving ONS, suggesting the effects of these ONS formulas are similarly beneficial in promoting growth.
- ONS groups trended toward greater height gain but not full catch-up to WHO growth standards. Previous studies have shown that height improvement was only observed with intervention of longer duration (>6 months
- Findings in this study are consistent with previous studies in which ONS, along with dietary counseling, were more effective than dietary counseling alone in promoting catch-up growth in at-risk children.
4.1. Other Studies on Picky Eating Behaviors and Growth/Health Impairment in Young Children
It is not uncommon for parents around the world to describe their child as a picky eater—reporting behaviors such as limited variety of food the child is willing to eat, resisting new foods, avoiding certain foods, or having strong food preferences [14,26,27,28]. Longitudinal studies find that between 13% and 30% of children are considered picky at any given age, but fewer than half of those remain picky over a course of two years [15,29]. After rapid growth during the first two years of life, it is normal for a child’s growth to slow and for appetite to diminish accordingly [30]. Moreover, some toddlers begin asserting independence by self-feeding and becoming choosy about food. Such changes in eating habits may confuse parents and lead them to worry about their child as a picky eater.
A notable subset of children, however, have strong evidence of growth parameters and eating patterns indicating they are at risk for malnutrition [13,14,17,31]. Such malnutrition is concerning because the consequences of poor nutritional status with continuing growth faltering can be severe. Studies in populations of children in eight low- and middle-income countries [32], Southeast Asia [33], Egypt [34], Cambodia [35], and Tanzania [36] have shown links between malnutrition and growth faltering, which extend to impairment of cognition, communication, and motor development. Victora et al. reported lasting human costs related to the links between poor early nutrition and impaired brain development—decreased cognitive ability, less success in schooling, and lower adult productivity [37]. Malnutrition in children—protein calorie and micro-nutrient deficiencies—is a common underlying reason for increased susceptibility to respiratory and gastrointestinal infections [38] and increased risk of mortality [20]. Vulnerability to infectious pathogens is associated with malnutrition-related deficiencies in function of both innate and adaptive immune systems [18,39]. Studies also found that hospitalized pediatric patients have greater complication rates and higher costs when they are malnourished [40]. Further, a recent study examined people who had been picky eaters in childhood with mildly or transiently impaired growth; as young adults, they had lower intake of fruit, vegetables, and whole grains and more frequent intake of snack foods, sugar-sweetened beverages, and high-fat fast-foods, thus setting themselves up for poor health outcomes later in life [41]. Taken together, these studies provide a rationale to identify and intervene for inadequate nutrient intake, picky eating behaviors, and growth attenuation in young children. Insufficient or inadequate nutrition is the most common cause of growth attenuation in children. When food is replenished, spontaneous catch-up growth usually occurs, which brings the child back to his or her original growth trajectory [42]. For children who are underweight or short-for-age and poor eaters, intervention with oral nutrition supplements has been shown previously to improve outcomes. In a foundational study by Alarcon et al. [43], children who received nutritional supplements and whose parents underwent dietary counseling over a 90-day interval had significantly greater increases in weight and height than did those who received dietary counseling only. A recent study in India by Ghosh et al. showed that 90-day ONS + DC was effective for improving weight and reducing the incidence of respiratory tract infections in nutritionally at-risk, picky eating children with acute respiratory tract infection episodes [44]. Other studies of ONS for children with malnutrition likewise reported growth, health, and cost benefits [45,46,47]).
4.2. Strengths and Limitations of This Study
The design of this study in Indian children was strong because it was randomized, controlled, and blinded for ONS products used. Furthermore, the study design was broader than prior studies, as it was a three-arm design: dietary counseling plus one of two different ONS supplements versus dietary counseling alone. A high rate of compliance, completeness of dietary recall data, and a low number of subjects lost in follow-up are also strengths of this study.
Results showed that a milk-based ONS and a lactose-free ONS were each more effective for promoting catch-up growth than was dietary counseling alone. As a limitation, the 3-month study interval was sufficient to observe catch-up growth in weight; however, the intervention interval should be longer, e.g., 6 months or more, to promote and observe catch-up growth in height.
Findings for this population of children in India may not be fully generalizable to all countries around the world because of the prominence of malnutrition as undernutrition in India. Nevertheless, shortfalls in growth of all undernourished young children have serious consequences and remain a concern worldwide.
5. Conclusions
Results of this randomized, controlled study showed that daily oral nutritional supplements can be used as an effective way to promote catch-up growth in young children who were at risk for malnutrition, including those who also have picky eating behaviors. In our study of catch-up growth, we examined the impact of two different pediatric ONS formulas—one milk-based and the other lactose-free—over a 90-day interval. Parents/guardians of children drinking ONS also underwent multiple sessions of dietary counseling; parents/guardians of a control group of children received dietary counseling only. The improved growth was similar for the two ONS formula groups, suggesting that both were similarly effective for promoting growth. Taken together, our findings confirm and extend prior studies in which ONS, along with dietary counseling, was more effective than dietary counseling alone to promote catch-up growth. We therefore see room for improvement worldwide in adopting and following health policies that recommend routine nutritional screening for all children; we also encourage enhanced training of professionals for identification and treatment of malnutrition [21,48].
Supplementary Materials
The following are available online at https://www.mdpi.com/article/10.3390/nu13103590/s1, Table S1: Composition of Oral Nutritional Supplements ONS1 and 2, Table S2: Changes in weight (kg), height (cm), BMI (kg/m2) and MUAC (cm) across all time points, Table S3: Changes in weight-for-age, height-for-age, BMI-for-age, MUAC-for-age, and weight-for-height percentiles across all time points, Table S4: Changes in weight-for-age, height-for-age, BMI-for-age, MUAC-for-age, and weight-for-height Z-scores across all time points.
Author Contributions
D.T.T.H. and D.K. were mainly involved in the design of the study, and D.K., S.B., A.G., P.J., A.V.K., B.K., A.K.P., P.D.P., R.D.M., S.S. and A.S. were involved in its conduct and data collection. M.Y. was responsible for analyses of results, and P.V.S. for data checking and graph generation. D.K. created a detailed study report that informed an early draft of the manuscript. D.K. and D.T.T.H. led the manuscript revision for important intellectual content. The final version of the manuscript was carefully reviewed and approved by all authors. All authors have read and agreed to the published version of the manuscript.
Funding
This research was funded by Abbott Nutrition.
Institutional Review Board Statement
The study protocol, all amendments, and the informed consent form were reviewed and approved by the Independent Ethics Committee/Institutional Review Boards of all 10 study hospitals (list of hospitals in author list). Independent Ethics Committee/Institutional Review Boards of Institutional Ethics Committee for Ajanta Hospital & IVF Centre (ECR/611/Inst/UP/2014), Institute of Child Health (ECR/359/Inst/WB/2013), Theresa’s Hospital (ECR/230/Inst/AP/2013/RR-19), Institutional Ethics Committee Praveen Cardiac Centre (ECR/336/Inst/AP/2013), Noble Hospital Institutional Ethics Committee, Sterling Hospital Institutional Ethics Committee (ECR/259/Inst/MH/2013/RR-19), Sangini Hospital Ethics Committee (ECR/542/Inst/MH/2014/RR-20), Ethics Committee Jehangir Clinical Development Centre Pvt. Ltd. (ECR/147/Inst/GJ/2013/RR-16), Penta-Med Ethics Committee (ECR/352/Inst/MH/2013), JSS Medical College & Hospital Institutional Ethics Committee (ECR/357/Inst/MH/2013/RR-20). The study was performed in accordance with the protocol, Good Clinical Practice (GCP) guidelines [49], local regulations governing clinical study conduct, and the ethical principles that have their origin in the Declaration of Helsinki. The study was registered at clinicaltrials.gov in the US [50] (NCT02523027) and with Clinical Trials Registry India (CTRI/2015/10/006330) [51].
Informed Consent Statement
The informed consent form were reviewed and approved by the Independent Ethics Committee/Institutional Review Boards of all 10 study hospitals. Parents or guardians of subjects voluntarily gave written informed consent prior to enrollment.
Data Availability Statement
Ethical restrictions imposed by the IRB prevents public sharing of the data for this study in children. The data used in this publication is owned by Abbott Nutrition. Data access request will be evaluated by Abbott Nutrition in consideration of IRB requirements. Interested researchers will need to sign a research collaboration agreement with Abbott. Requests can be sent to deepti.khanna@abbott.com.
Acknowledgments
The authors thank Cecilia Hofmann, (C. Hofmann & Associates, Western Springs, IL, USA) for her assistance with bibliography management and with manuscript writing and editing. We also thank Geraldine E. Baggs (Abbott Nutrition, Columbus, OH, USA) for reviewing and providing statistical guidance throughout the study.
Conflicts of Interest
D.K. and D.T.T.H. declare potential conflicts of interest as employees of Abbott, the study sponsor. M.Y. and P.V.S. are employees of Cognizant Technology Solutions, the company responsible for statistical data analyses. All other authors declared no potential conflict of interest.
References
- WHO. The WHO Child Growth Standards. Available online: https://www.who.int/childgrowth/standards/en/ (accessed on 21 December 2020).
- De Onis, M.; Branca, F. Childhood stunting: A global perspective. Matern. Child Nutr. 2016, 12 (Suppl. S1), 12–26. [Google Scholar] [CrossRef]
- Mwangome, M.; Prentice, A.M. Tackling the triple threats of childhood malnutrition. BMC Med. 2019, 17, 210. [Google Scholar] [CrossRef] [PubMed]
- UNICEF-WHO-World Bank. Levels and Trends in Child Malnutrition: Key Findings of the 2019 Edition of the Joint Child Malnutrition Estimates; United Nations Children’s Fund (UNICEF): New York, NY, USA; World Health Organization: Geneva, Switzerland; International Bank for Reconstruction and Development/The World Bank: Washington, DC, USA, 2019. [Google Scholar]
- International Institute for Population Sciences (IIPS) and ICF. National Family Health Survey (NFHS-4), 2015–2016; International Institute for Population Sciences (IIPS): Mumbai, India, 2017; Available online: http://rchiips.org/NFHS/NFHS-4Reports/India.pdf (accessed on 12 October 2021).
- Murarkar, S.; Gothankar, J.; Doke, P.; Pore, P.; Lalwani, S.; Dhumale, G.; Quraishi, S.; Patil, R.; Waghachavare, V.; Dhobale, R.; et al. Prevalence and determinants of undernutrition among under-five children residing in urban slums and rural area, Maharashtra, India: A community-based cross-sectional study. BMC Public Health 2020, 20, 1559. [Google Scholar] [CrossRef] [PubMed]
- Karlsson, O.; Kim, R.; Sarwal, R.; James, K.; Subramanian, S. Trends in underweight, stunting, and wasting prevalence and inequality among children under three in Indian states, 1993–2016. Sci. Rep. 2021, 11, 1413. [Google Scholar] [CrossRef] [PubMed]
- Independent Evaluation Group (IEG). What Can We Learn from Nutrition Impact Evaluations? Lessons from a Review of Interventions to Reduce Childhood Malnutrition in Developing Countries; The International Bank for Reconstruction and Development/The World Bank: Washington, DC, USA, 2010. [Google Scholar]
- United Nations Children’s Fund (UNICEF). Progress for Children: A Report Card on Nutrition. Available online: https://www.unicef.org/progressforchildren/2006n4/index_undernutrition.html (accessed on 14 November 2020).
- World Health Organization (WHO). The Z-Score or Standard Deviation Classification System. Available online: https://www.who.int/nutgrowthdb/about/introduction/en/index4.html (accessed on 23 April 2021).
- Mehta, N.M.; Corkins, M.R.; Lyman, B.; Malone, A.; Goday, P.S.; Carney, L.N.; Monczka, J.L.; Plogsted, S.W.; Schwenk, W.F. American Society for Parenteral Enteral Nutrition Board of Directors. Defining pediatric malnutrition: A paradigm shift toward etiology-related definitions. J. Parenter. Enter. Nutr. 2013, 37, 460–481. [Google Scholar] [CrossRef] [PubMed] [Green Version]
- United Nations Children’s Fund (UNICEF). The State of the World’s Children 2019. Children, Food and Nutrition: Growing Well in a Changing World. Available online: https://www.unicef.org/reports/state-of-worlds-children-2019 (accessed on 21 March 2021).
- Taylor, C.M.; Emmett, P.M. Picky eating in children: Causes and consequences. Proc. Nutr. Soc. 2019, 78, 161–169. [Google Scholar] [CrossRef] [Green Version]
- Volger, S.; Sheng, X.; Tong, L.M.; Zhao, D.; Fan, T.; Zhang, F.; Ge, J.; Ho, W.M.; Hays, N.P.; Yao, M.P. Nutrient intake and dietary patterns in children 2.5–5 years of age with picky eating behaviours and low weight-for-height. Asia Pac. J. Clin. Nutr. 2017, 26, 104–109. [Google Scholar] [CrossRef] [PubMed]
- Dubois, L.; Farmer, A.; Girard, M.; Peterson, K.; Tatone-Tokuda, F. Problem eating behaviors related to social factors and body weight in preschool children: A longitudinal study. Int. J. Behav. Nutr. Phys. Act. 2007, 4, 9. [Google Scholar] [CrossRef] [Green Version]
- Xue, Y.; Lee, E.; Ning, K.; Zheng, Y.; Ma, D.; Gao, H.; Yang, B.; Bai, Y.; Wang, P.; Zhang, Y. Prevalence of picky eating behaviour in Chinese school-age children and associations with anthropometric parameters and intelligence quotient. A cross-sectional study. Appetite 2015, 91, 248–255. [Google Scholar] [CrossRef] [Green Version]
- Antoniou, E.E.; Roefs, A.; Kremers, S.P.; Jansen, A.; Gubbels, J.S.; Sleddens, E.F.; Thijs, C. Picky eating and child weight status development: A longitudinal study. J. Hum. Nutr. Diet. 2016, 29, 298–307. [Google Scholar] [CrossRef]
- Ibrahim, M.K.; Zambruni, M.; Melby, C.L.; Melby, P.C. Impact of childhood malnutrition on host defense and infection. Clin. Microbiol. Rev. 2017, 30, 919–971. [Google Scholar] [CrossRef] [PubMed] [Green Version]
- Bouma, S. Diagnosing pediatric malnutrition. Nutr. Clin. Pract. 2017, 32, 52–67. [Google Scholar] [CrossRef] [PubMed] [Green Version]
- Olofin, I.; McDonald, C.M.; Ezzati, M.; Flaxman, S.; Black, R.E.; Fawzi, W.W.; Caulfield, L.E.; Danaei, G. Nutrition Impact Model Study. Associations of suboptimal growth with all-cause and cause-specific mortality in children under five years: A pooled analysis of ten prospective studies. PLoS ONE 2013, 8, e64636. [Google Scholar] [CrossRef] [PubMed] [Green Version]
- Murray, R.; Kerr, K.; Brunton, C.; Williams, J.; DeWitt, T.; Wulf, K. A first step towards eliminating malnutrition: A proposal for universal nutrition screening in pediatric practice. Nutr. Diet. Suppl. 2021, 13, 17–24. [Google Scholar] [CrossRef]
- Shim, J.O.; Kim, S.; Choe, B.H.; Seo, J.H.; Yang, H.R. Effect of nutritional supplement formula on catch-up growth in young children with nonorganic faltering growth: A prospective multicenter study. Nutr. Res. Pract. 2020, 14, 230–241. [Google Scholar] [CrossRef]
- Indian Council of Medical Research. ICMR-NIN Expert Group on Nutrient Requirement for Indians, Recommended Dietary Allowances (RDA) and Estimated Average Requirements (EAR)—2020; ICMR-National Institute of Nutrition: Telangana, India, 2020. [Google Scholar]
- Mayneris-Perxachs, J.; Swann, J.R. Metabolic phenotyping of malnutrition during the first 1000 days of life. Eur. J. Nutr. 2019, 58, 909–930. [Google Scholar] [CrossRef] [Green Version]
- Roberts, J.L.; Stein, A.D. The impact of nutritional interventions beyond the first 2 years of life on linear growth: A systematic review and meta-analysis. Adv. Nutr. 2017, 8, 323–336. [Google Scholar] [CrossRef] [Green Version]
- Carruth, B.R.; Skinner, J.; Houck, K.; Moran, J., 3rd; Coletta, F.; Ott, D. The phenomenon of ‘‘picky eater’’: A behavioral marker in eating patterns of toddlers. J. Am. Coll. Nutr. 1998, 17, 180–186. [Google Scholar] [CrossRef]
- Jacobi, C.; Schmitz, G.; Agras, W.S. Is picky eating an eating disorder? Int. J. Eat. Disord. 2008, 41, 626–634. [Google Scholar] [CrossRef]
- Brown, C.L.; Vander Schaaf, E.B.; Cohen, G.M.; Irby, M.B.; Skelton, J.A. Association of picky eating and food neophobia with weight: A systematic review. Child. Obes. 2016, 12, 247–262. [Google Scholar] [CrossRef] [Green Version]
- Mascola, A.J.; Bryson, S.W.; Agras, W.S. Picky eating during childhood: A longitudinal study to age 11 years. Eat. Behav. 2010, 11, 253–257. [Google Scholar] [CrossRef] [PubMed] [Green Version]
- Leung, A.K.; Marchand, V.; Sauve, R.S.; Canadian Paediatric Society Nutrition; Gastroenterology Committee. The ‘picky eater’: The toddler or preschooler who does not eat. Paediatr. Child Health 2012, 17, 455–460. [Google Scholar] [CrossRef]
- Taylor, C.M.; Steer, C.D.; Hays, N.P.; Emmett, P.M. Growth and body composition in children who are picky eaters: A longitudinal view. Eur. J. Clin. Nutr. 2019, 73, 869–878. [Google Scholar] [CrossRef] [PubMed]
- Scharf, R.J.; Rogawski, E.T.; Murray-Kolb, L.E.; Maphula, A.; Svensen, E.; Tofail, F.; Rasheed, M.; Abreu, C.; Vasquez, A.O.; Shrestha, R.; et al. Early childhood growth and cognitive outcomes: Findings from the MAL-ED study. Matern. Child Nutr. 2018, 14, e12584. [Google Scholar] [CrossRef] [PubMed] [Green Version]
- Poh, B.K.; Rojroonwasinkul, N.; Le Nyugen, B.K.; Budiman, B.; Ng, L.O.; Soonthorndhada, K.; Xuyen, H.T.; Deurenberg, P.; Parikh, P. Relationship between anthropometric indicators and cognitive performance in Southeast Asian school-aged children. Br. J. Nutr. 2013, 110 (Suppl. S3), S57–S64. [Google Scholar] [CrossRef]
- Nassar, M.F.; Shaaban, S.Y.; Nassar, J.F.; Younis, N.T.; Abdel-Mobdy, A.E. Language skills and intelligence quotient of protein energy malnutrition survivors. J. Trop. Pediatr. 2012, 58, 226–230. [Google Scholar] [CrossRef] [PubMed] [Green Version]
- Perignon, M.; Fiorentino, M.; Kuong, K.; Burja, K.; Parker, M.; Sisokhom, S.; Chamnan, C.; Berger, J.; Wieringa, F.T. Stunting, poor iron status and parasite infection are significant risk factors for lower cognitive performance in Cambodian school-aged children. PLoS ONE 2014, 9, e112605. [Google Scholar] [CrossRef] [PubMed] [Green Version]
- Sudfeld, C.R.; McCoy, D.C.; Fink, G.; Muhihi, A.; Bellinger, D.C.; Masanja, H.; Smith, E.R.; Danaei, G.; Ezzati, M.; Fawzi, W.W. Malnutrition and its determinants are associated with suboptimal cognitive, communication, and motor development in Tanzanian children. J. Nutr. 2015, 145, 2705–2714. [Google Scholar] [CrossRef] [PubMed] [Green Version]
- Victora, C.G.; Adair, L.; Fall, C.; Hallal, P.C.; Martorell, R.; Richter, L.; Sachdev, H.S.; Maternal and Child Undernutrition Study Group. Maternal and child undernutrition: Consequences for adult health and human capital. Lancet 2008, 371, 340–357. [Google Scholar] [CrossRef] [Green Version]
- Rodriguez, L.; Cervantes, E.; Ortiz, R. Malnutrition and gastrointestinal and respiratory infections in children: A public health problem. Int. J. Environ. Res. Public Health 2011, 8, 1174–1205. [Google Scholar] [CrossRef] [Green Version]
- Gwela, A.; Mupere, E.; Berkley, J.A.; Lancioni, C. Undernutrition, host immunity and vulnerability to infection among young children. Pediatr. Infect. Dis. J. 2019, 38, e175–e177. [Google Scholar] [CrossRef]
- Gambra-Arzoz, M.; Alonso-Cadenas, J.A.; Jimenez-Legido, M.; Lopez-Gimenez, M.R.; Martin-Rivada, A.; de Los Angeles Martinez-Ibeas, M.; Canedo-Villarroya, E.; Pedron-Giner, C. Nutrition risk in hospitalized pediatric patients: Higher complication rate and higher costs related to malnutrition. Nutr. Clin. Pract. 2020, 35, 157–163. [Google Scholar] [CrossRef] [Green Version]
- Pesch, M.H.; Bauer, K.W.; Christoph, M.J.; Larson, N.; Neumark-Sztainer, D. Young adult nutrition and weight correlates of picky eating during childhood. Public Health Nutr. 2020, 23, 987–995. [Google Scholar] [CrossRef] [PubMed]
- Gat-Yablonski, G.; Phillip, M. Nutritionally-induced catch-up growth. Nutrients 2015, 7, 517–551. [Google Scholar] [CrossRef] [PubMed] [Green Version]
- Alarcon, P.A.; Lin, L.H.; Noche, M., Jr.; Hernandez, V.C.; Cimafranca, L.; Lam, W.; Comer, G.M. Effect of oral supplementation on catch-up growth in picky eaters. Clin. Pediatr. 2003, 42, 209–217. [Google Scholar] [CrossRef] [PubMed]
- Ghosh, A.K.; Kishore, B.; Shaikh, I.; Satyavrat, V.; Kumar, A.; Shah, T.; Pote, P.; Shinde, S.; Berde, Y.; Low, Y.L.; et al. Effect of oral nutritional supplementation on growth and recurrent upper respiratory tract infections in picky eating children at nutritional risk: A randomized, controlled trial. J. Int. Med. Res. 2018, 48, 2186–2201. [Google Scholar] [CrossRef] [PubMed]
- Dempster, R.; Burdo-Hartman, W.; Halpin, E.; Williams, C. Estimated cost-effectiveness of intensive interdisciplinary behavioral treatment for increasing oral intake in children with feeding difficulties. J. Pediatr. Psychol. 2016, 41, 857–866. [Google Scholar] [CrossRef] [PubMed] [Green Version]
- Lakdawalla, D.N.; Mascarenhas, M.; Jena, A.B.; Vanderpuye-Orgle, J.; LaVallee, C.; Linthicum, M.T.; Snider, J.T. Impact of oral nutrition supplements on hospital outcomes in pediatric patients. JPEN J. Parenter. Enter. Nutr. 2014, 38, 42S–49S. [Google Scholar] [CrossRef]
- Mehndiratta, C.; Bhasin, J.; Khadilkar, V.; Kochar, I.; Pai, U.; Mittal, G.; Sanskar, P.; Agrawal, T. Effectiveness of nutritional supplement in growth and development of children aged 2–12 years. Matern. Pediatr. Nutr. 2021, 4, nr126. [Google Scholar]
- Phillips, C.A.; Bailer, J.; Foster, E.; Li, Y.; Dogan, P.; Smith, E.; Reilly, A.; Freedman, J. Evaluation of an automated pediatric malnutrition screen using anthropometric measurements in the electronic health record: A quality improvement initiative. Supportive Care Cancer 2020, 28, 1659–1666. [Google Scholar] [CrossRef]
- Vijayananthan, A.; Nawawi, O. The importance of Good Clinical Practice guidelines and its role in clinical trials. Biomed. Imaging Interv. J. 2008, 4, e5. [Google Scholar] [CrossRef] [PubMed]
- Abbott Nutrition. Oral Nutritional Supplementation in Picky Eating Children: NCT02523027 14/8/2015. Available online: https://clinicaltrials.gov/ct2/show/NCT02523027?term=oral+nutritional+supplementation&cntry=IN&draw=2&rank=2 (accessed on 6 March 2021).
- Abbott Nutrition International India. A Study of an Oral Nutritional Supplementation in Picky Eating Children: CTRI/2015/10/006330, 29/10/2015. Available online: http://ctri.nic.in/Clinicaltrials/pdf_generate.php?trialid=12708&EncHid=&modid=&compid=%27,%2712708det%27 (accessed on 6 March 2021).
Publisher’s Note: MDPI stays neutral with regard to jurisdictional claims in published maps and institutional affiliations. |
© 2021 by the authors. Licensee MDPI, Basel, Switzerland. This article is an open access article distributed under the terms and conditions of the Creative Commons Attribution (CC BY) license (https://creativecommons.org/licenses/by/4.0/).