
The Effects of a Macronutrient-Based Diet and Time-Restricted Feeding (16:8) on Body Composition in Physically Active Individuals—A 14-Week Randomised Controlled Trial

Abstract
:1. Introduction
2. Methods
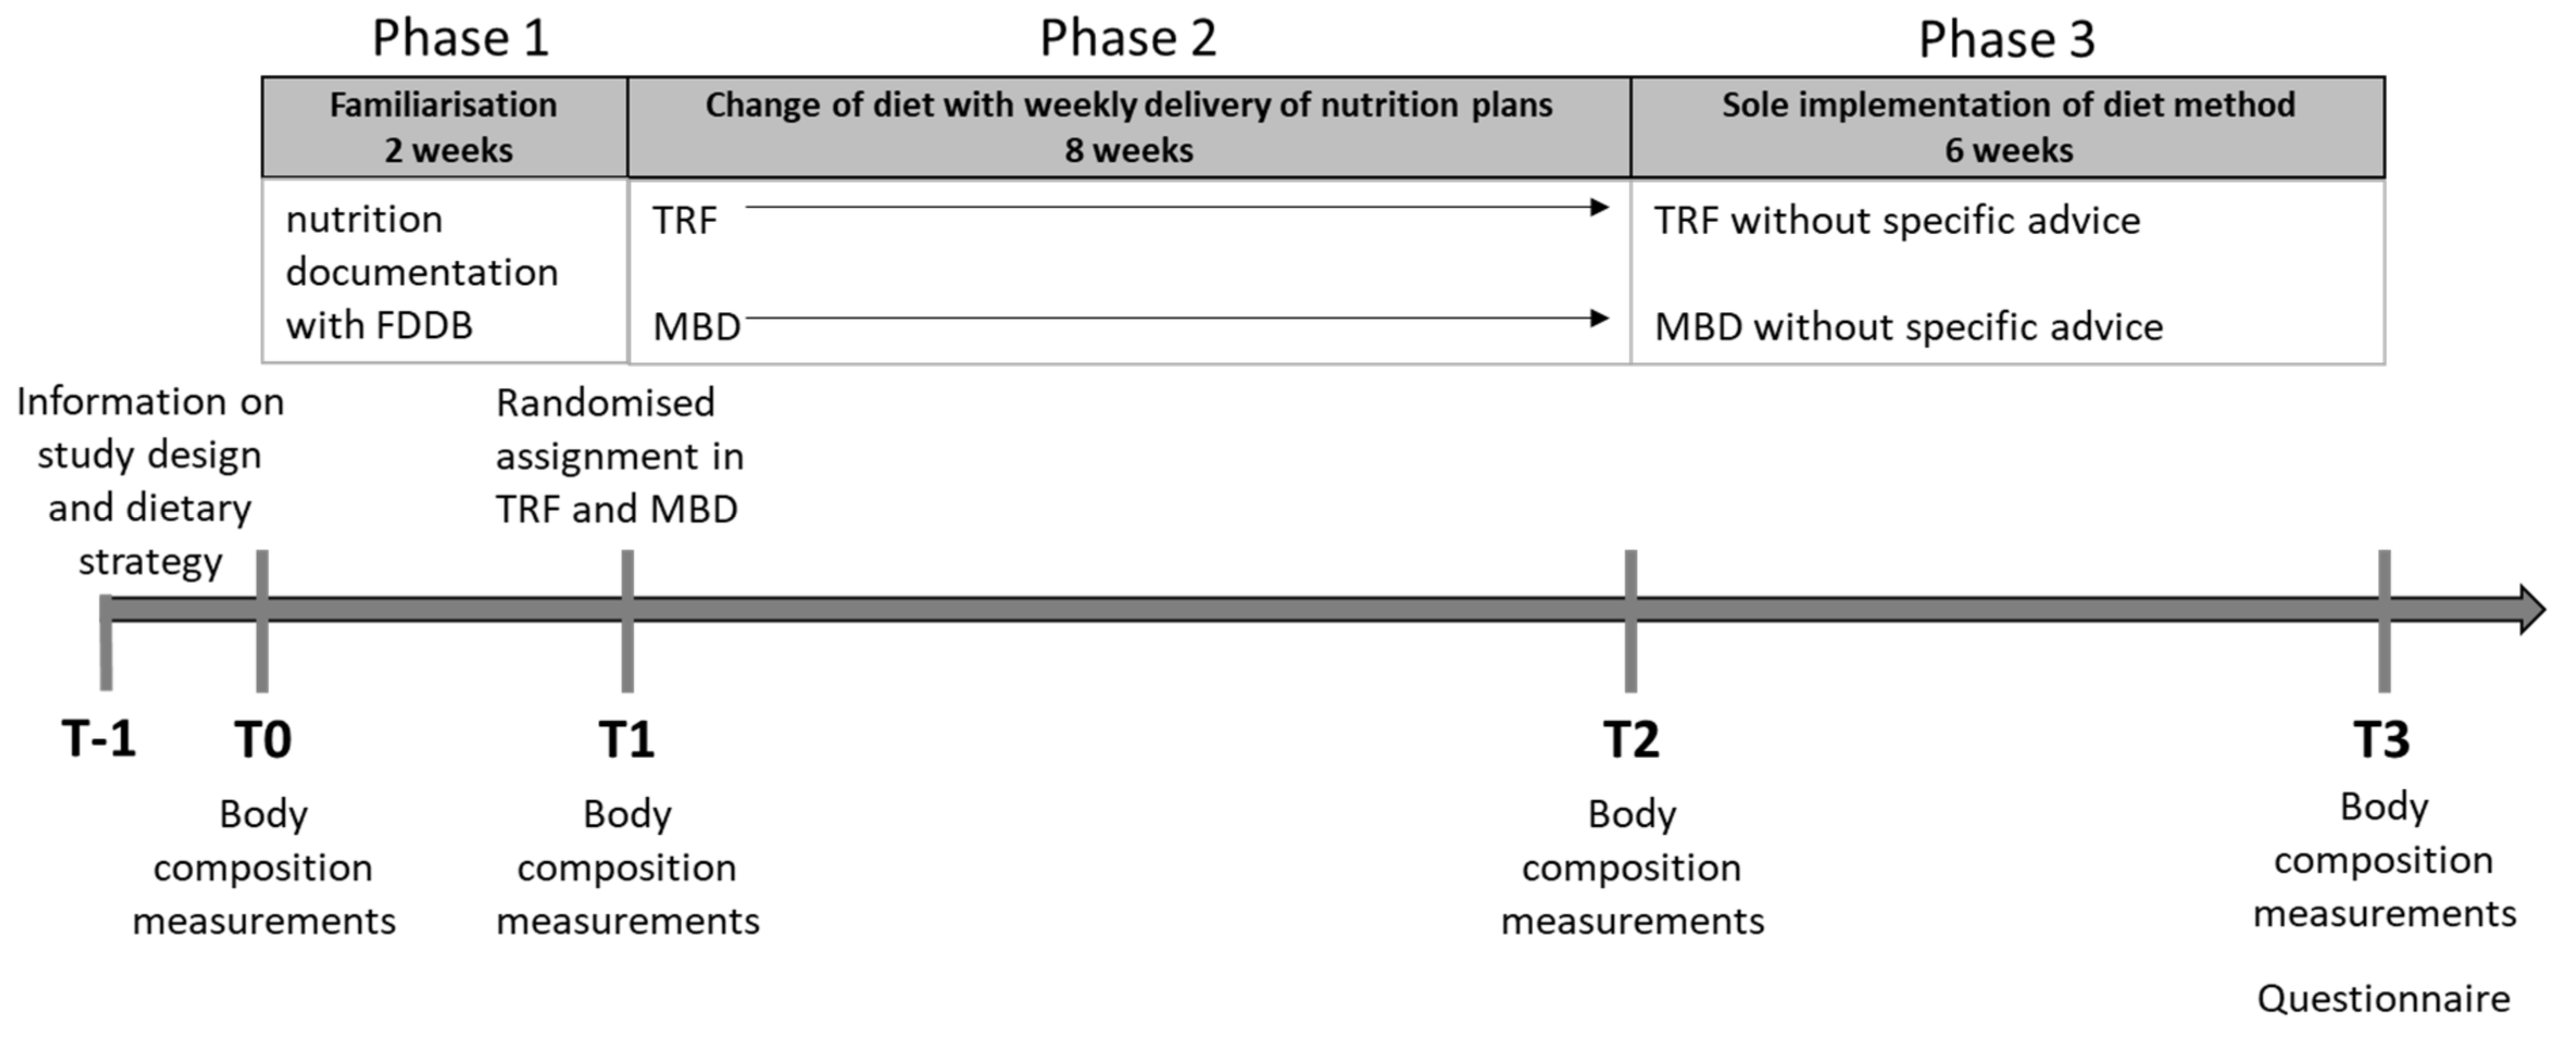
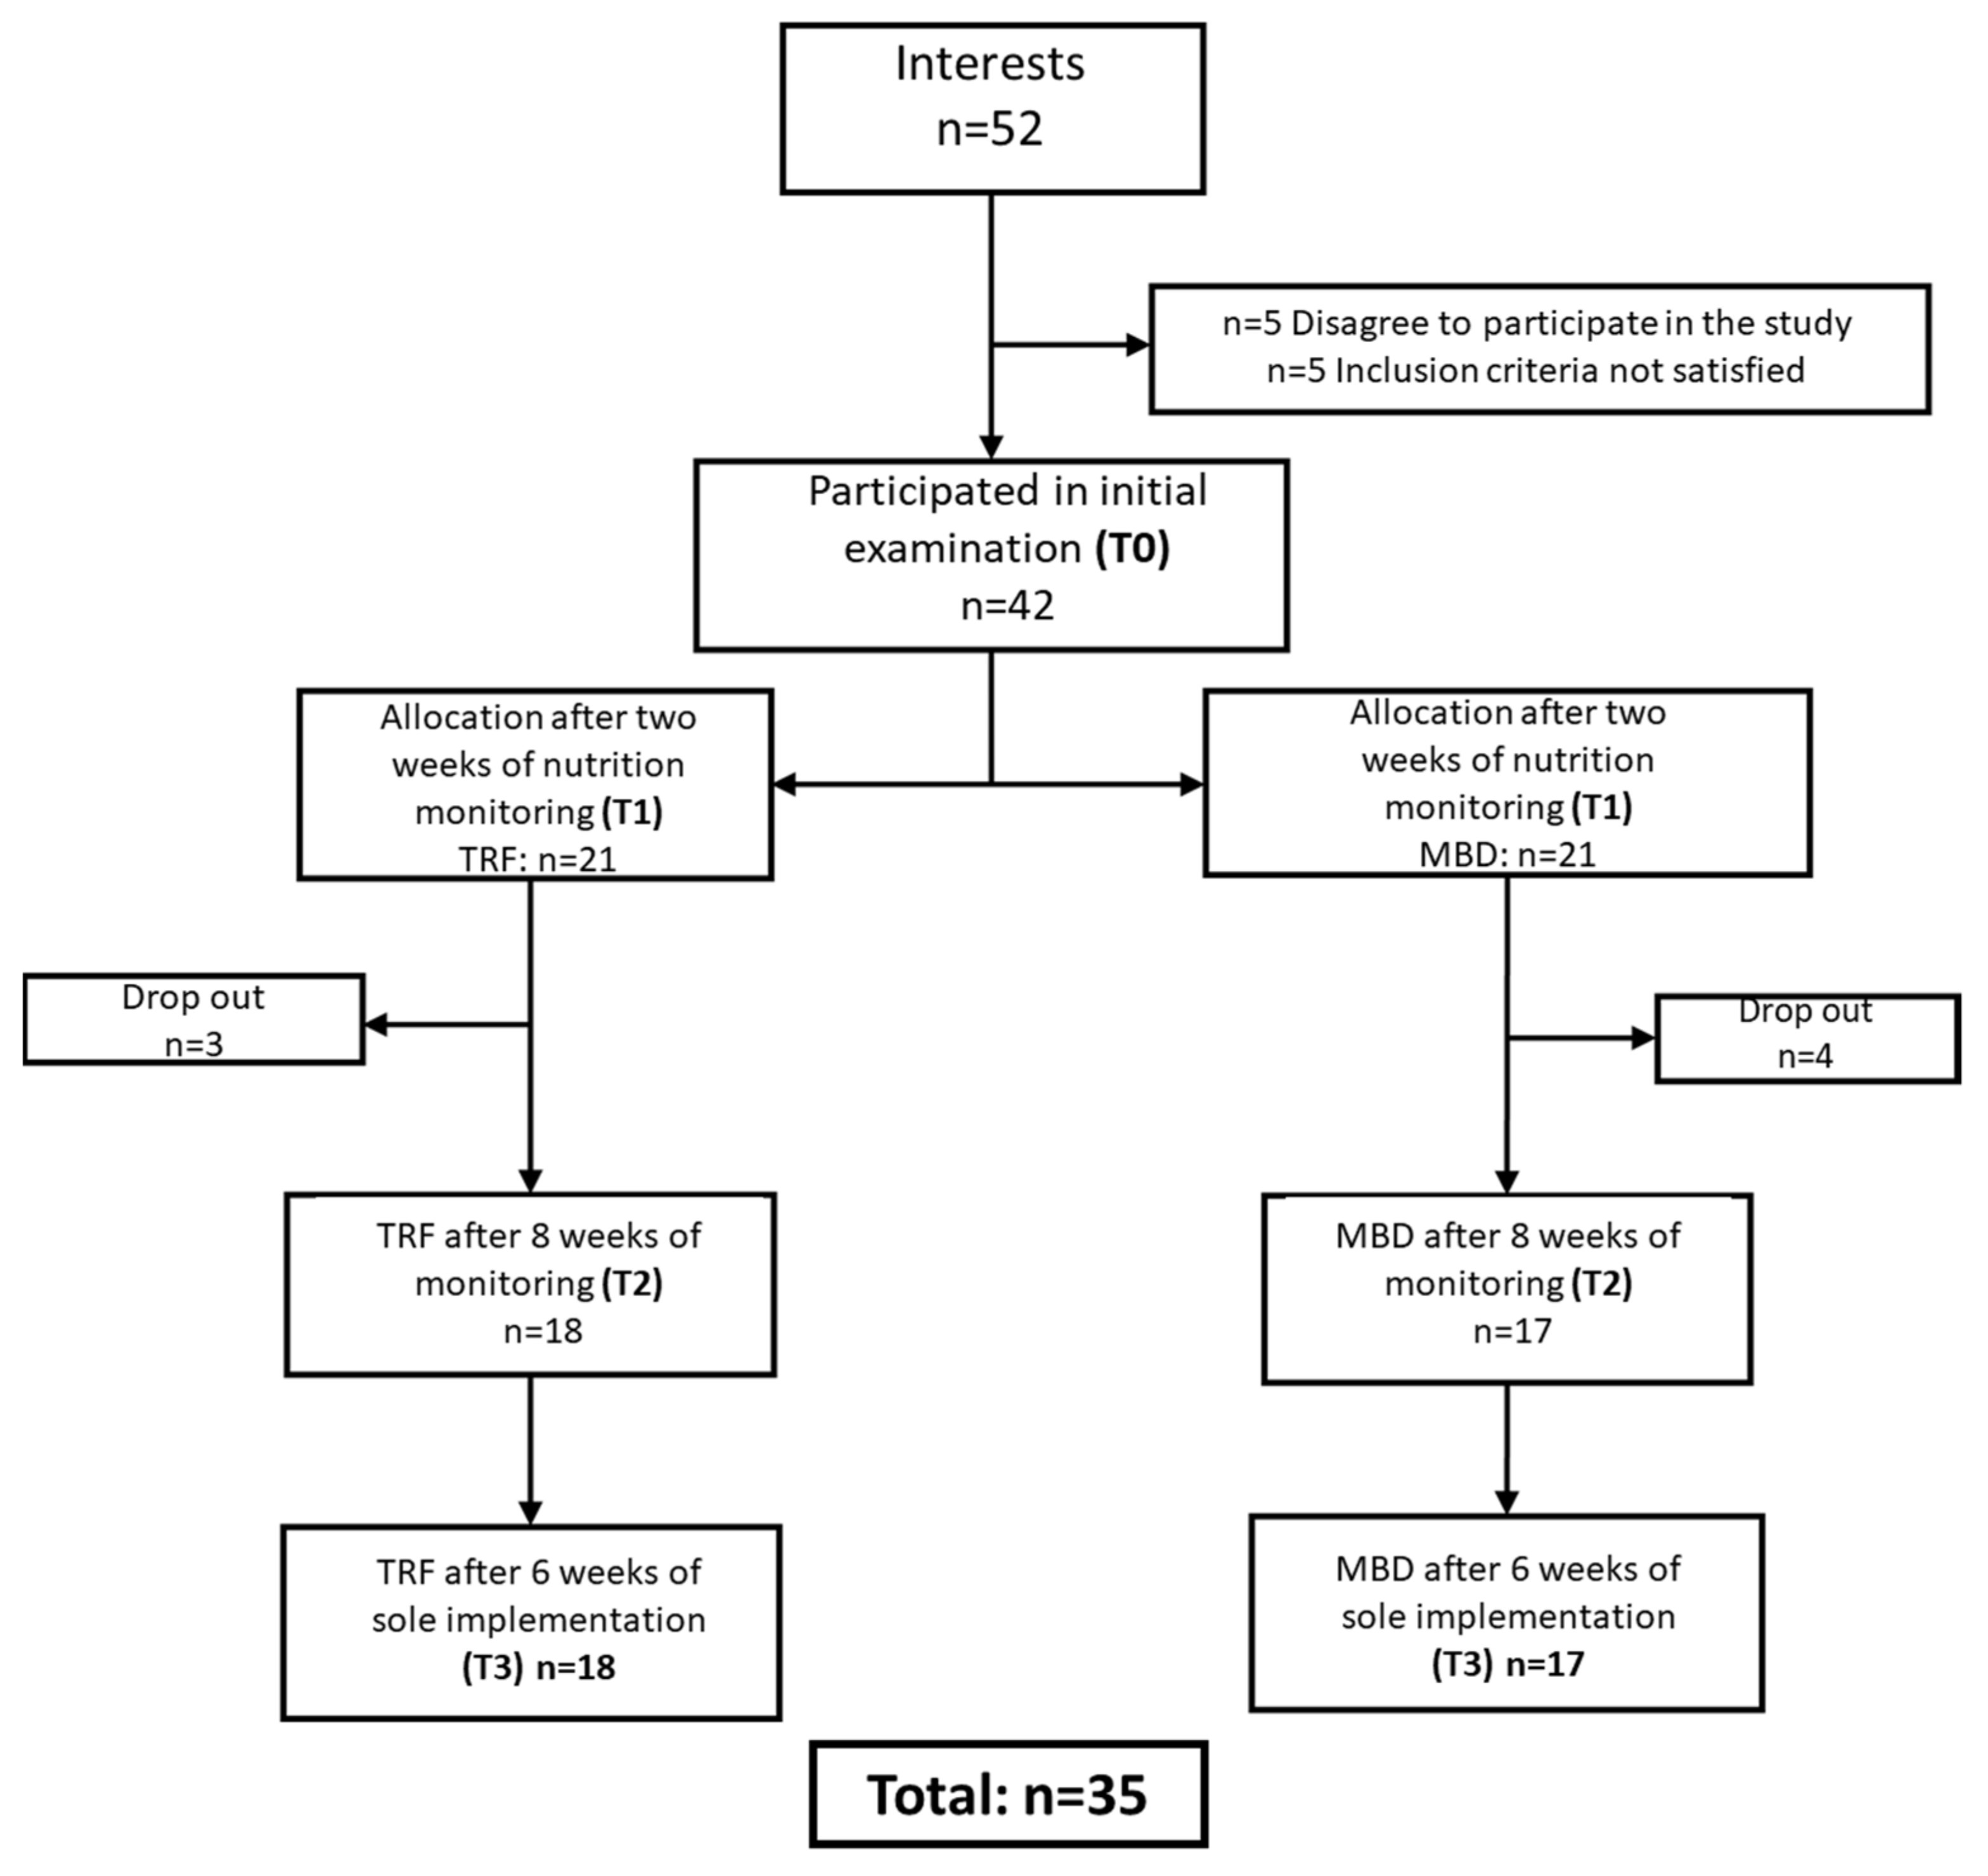
2.1. Experimental Procedure
2.2. Dietary Strategies
2.2.1. Time-Restricted Feeding (TRF)
2.2.2. Macronutrient-Based Diet (MBD)
2.3. Participants
2.4. Training
2.5. Measurements
2.5.1. Primary Parameters
2.5.2. Secondary Parameters
2.6. Statistical Analyses
3. Results
3.1. General Data and Training Frequencies
3.2. Calorie Intake
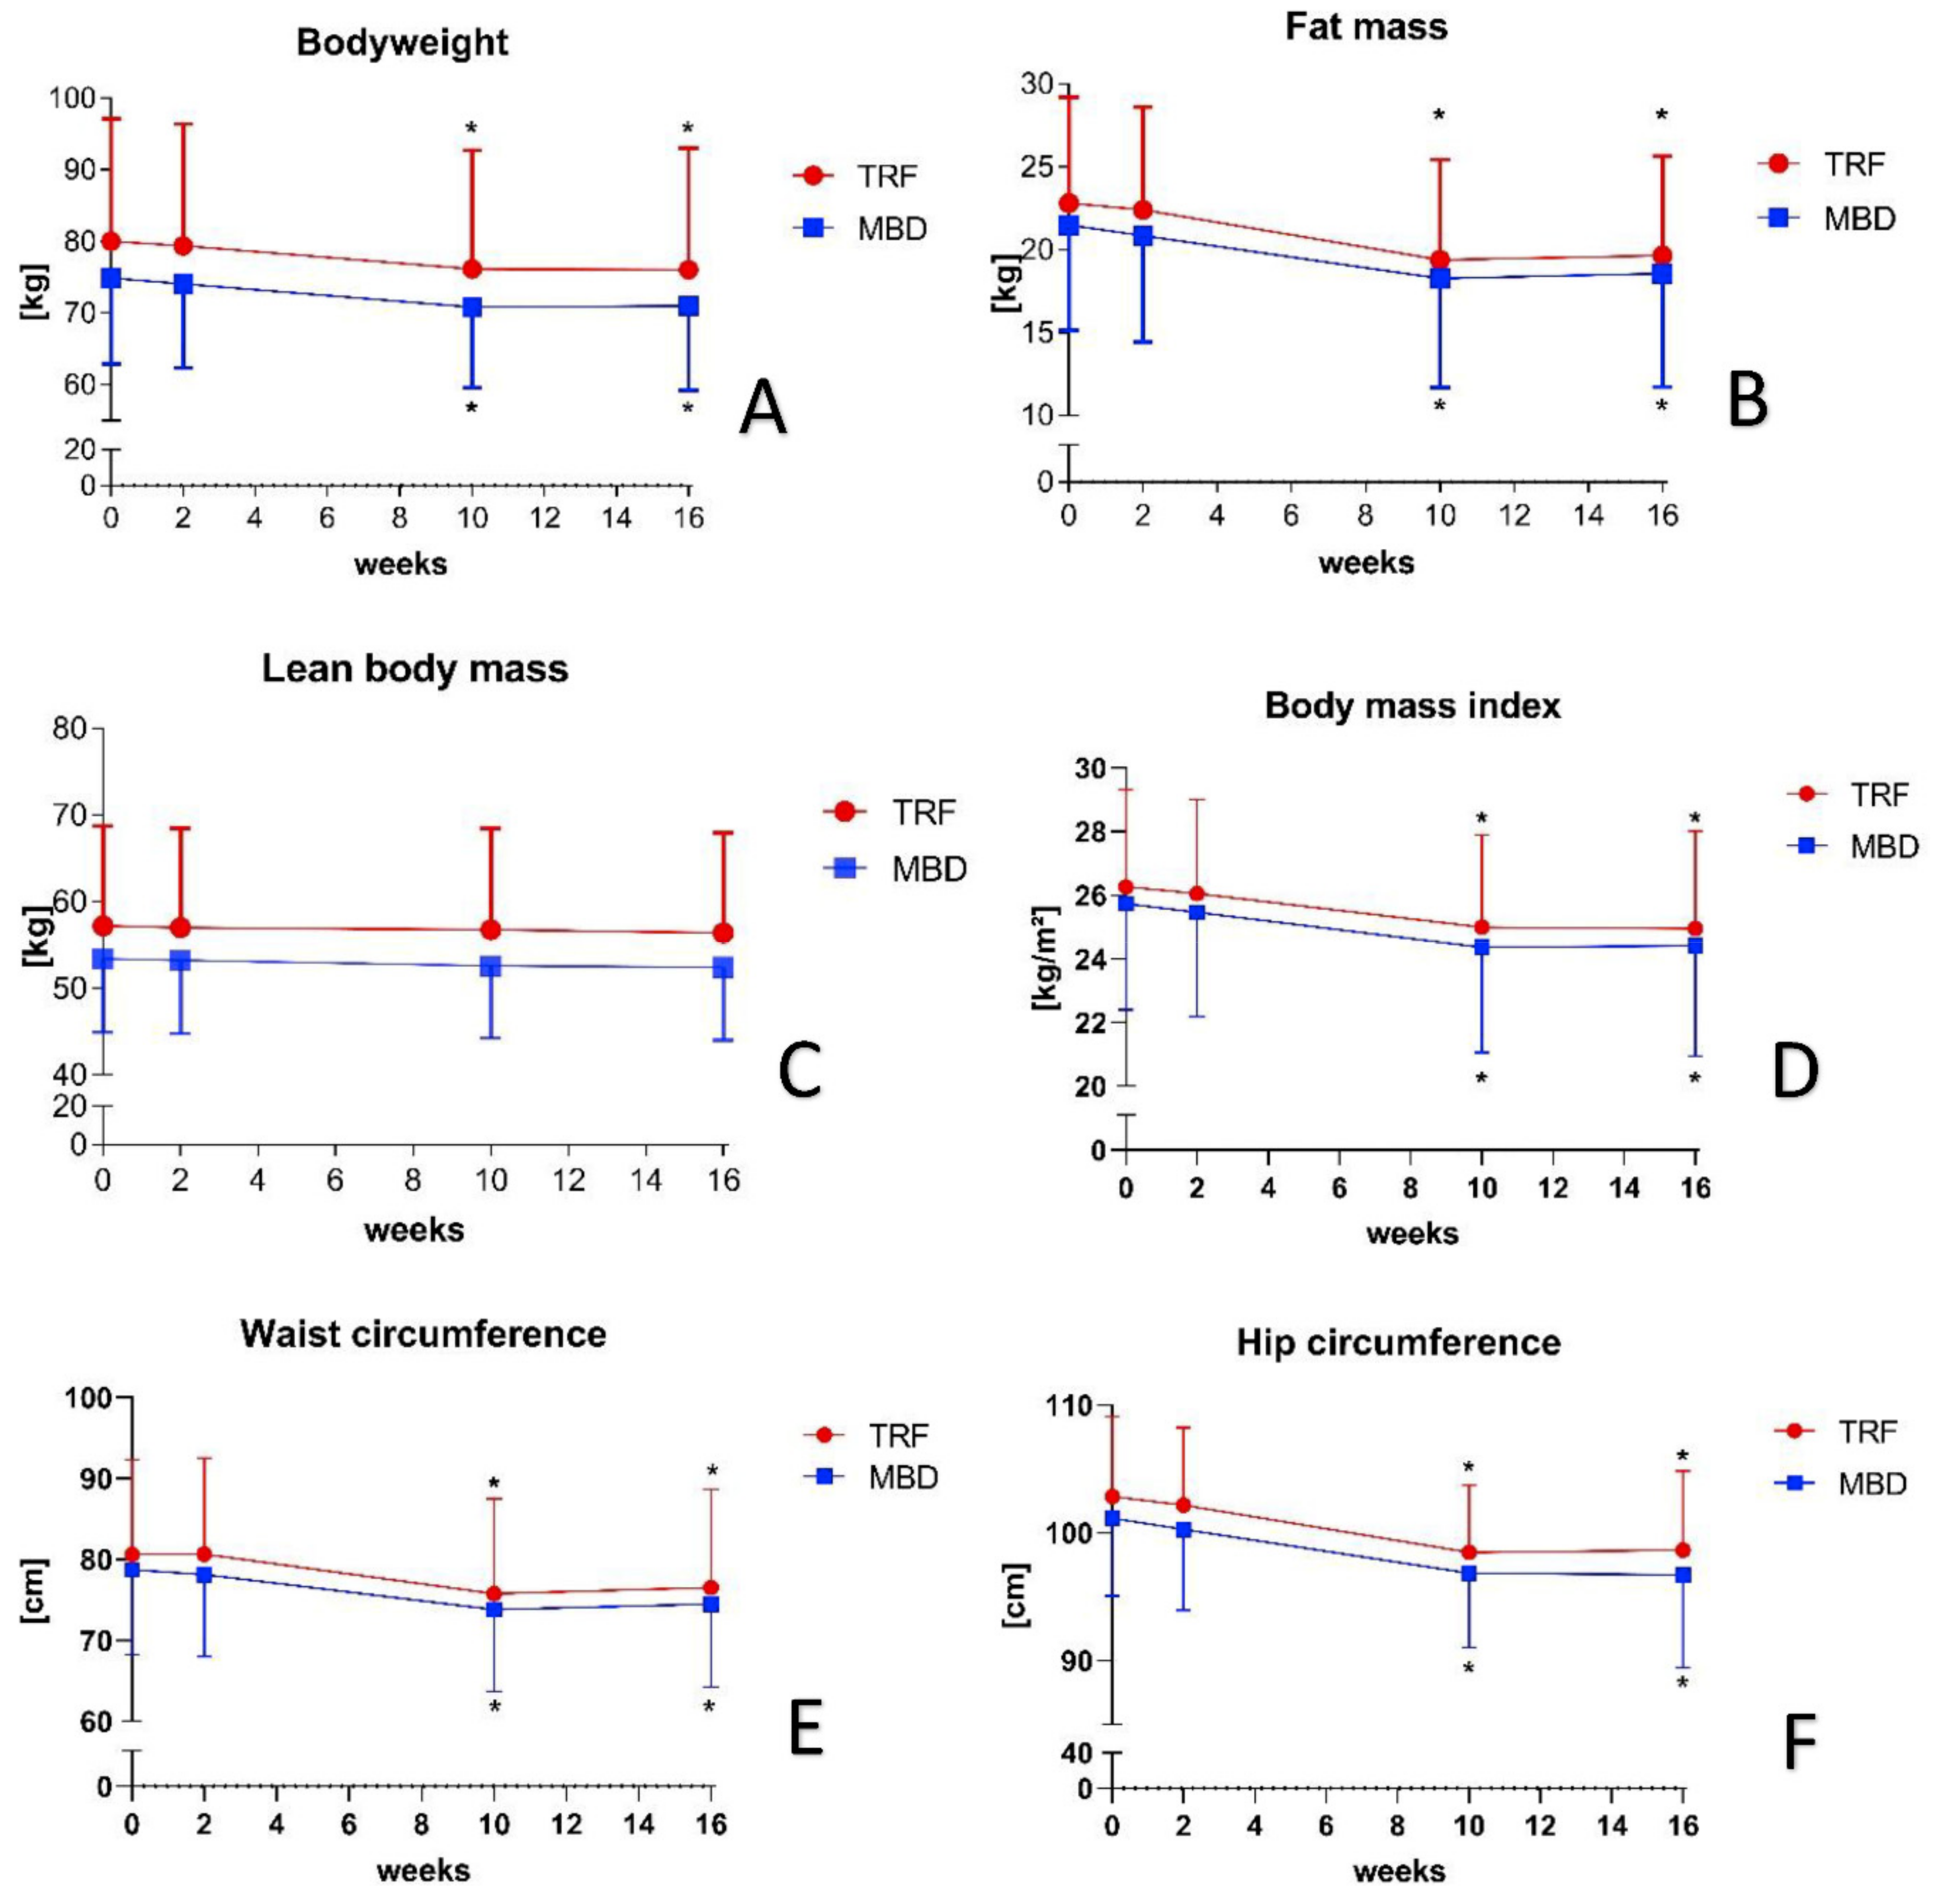
3.3. Primary Parameters
3.4. Secondary Parameters
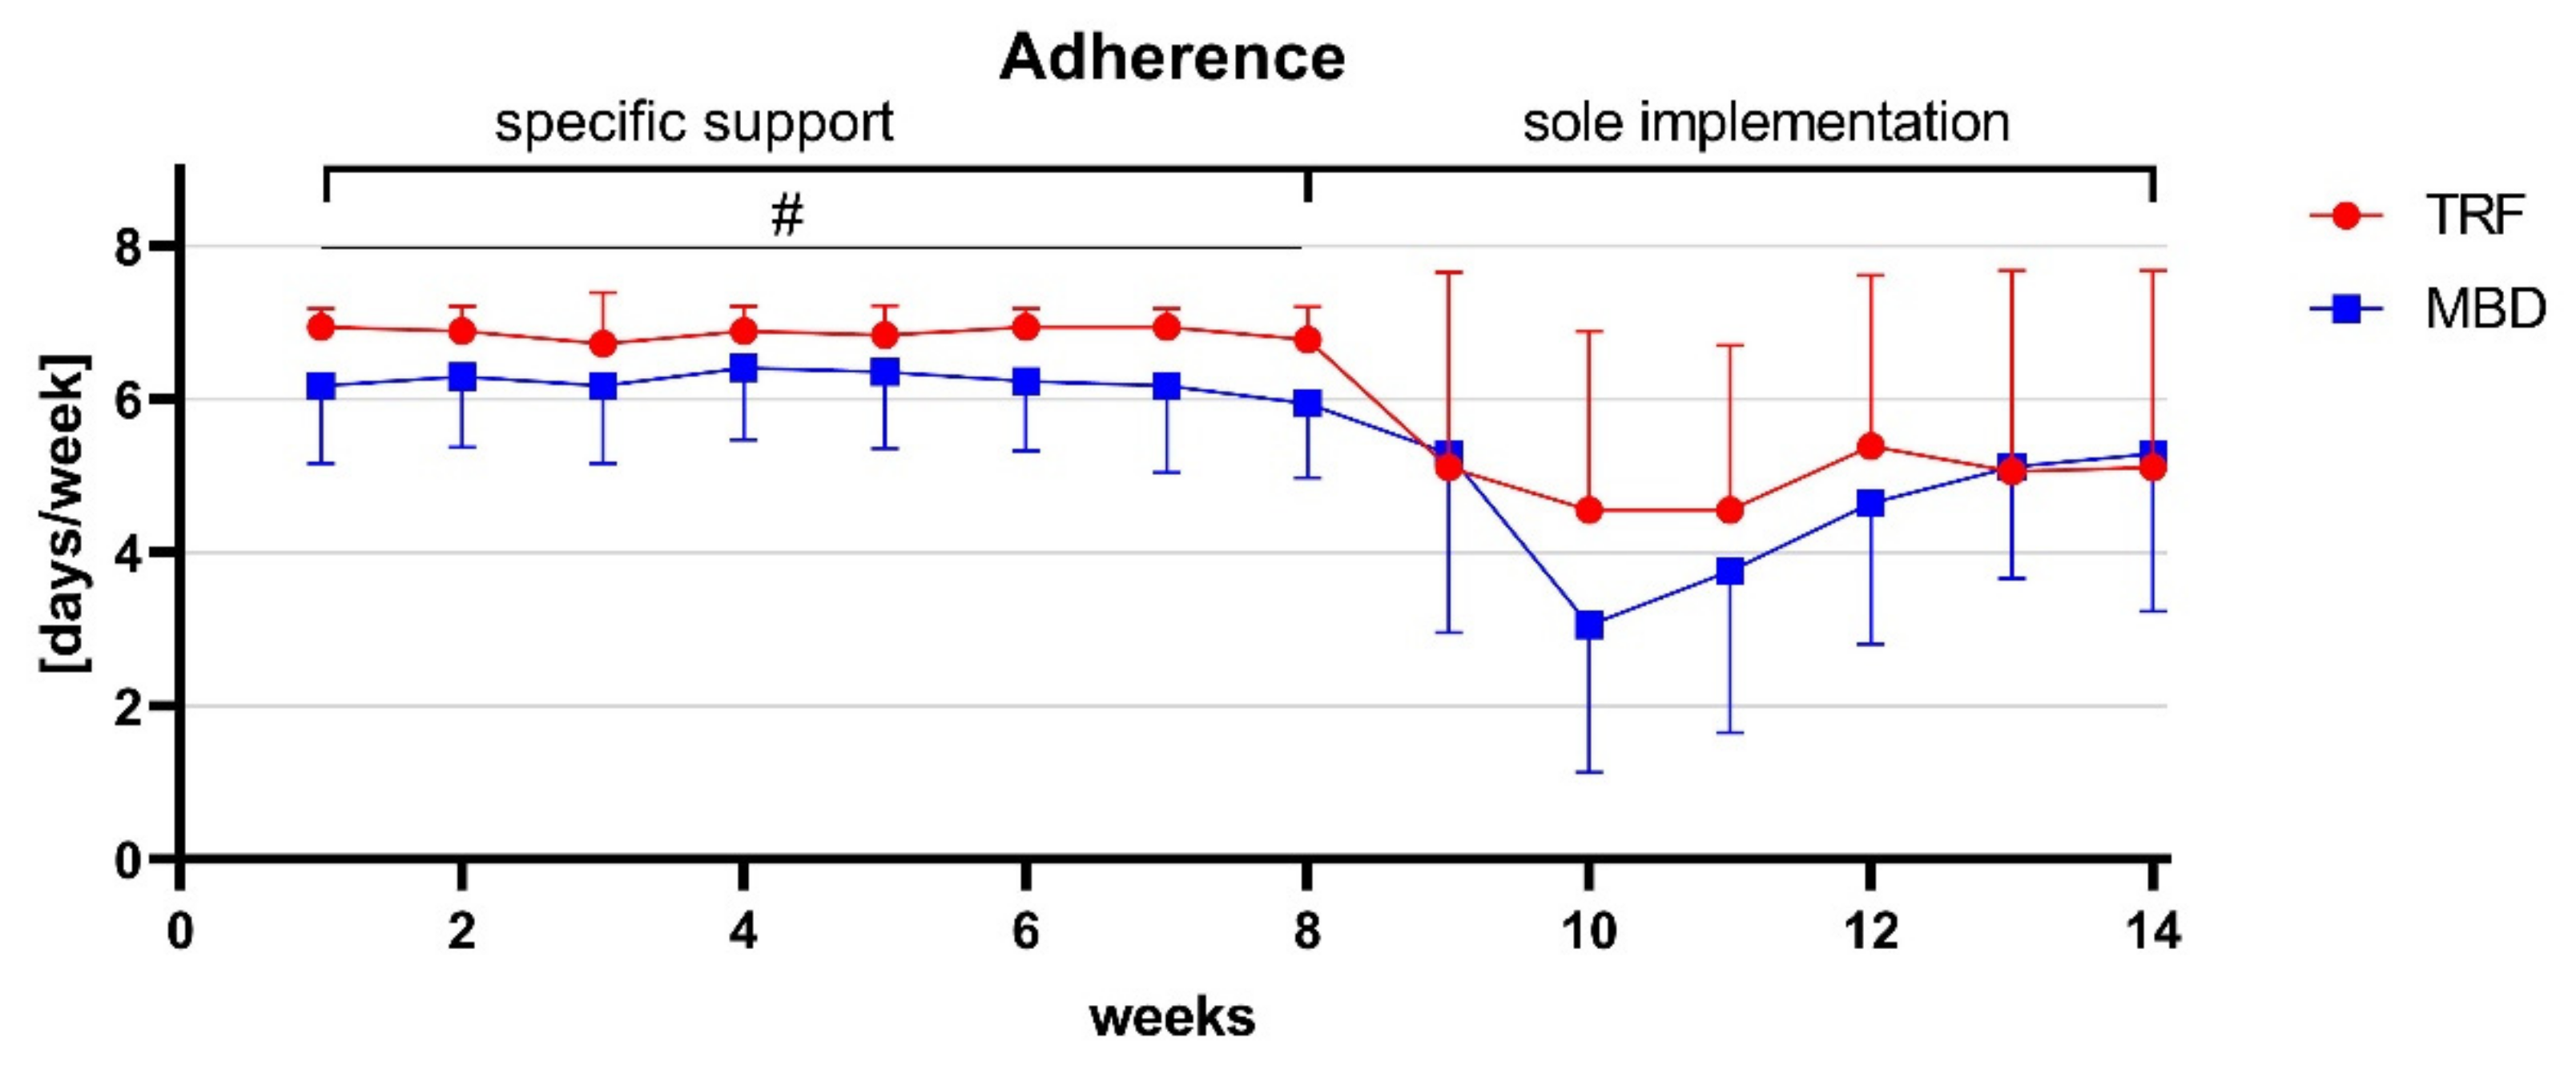
Adherence
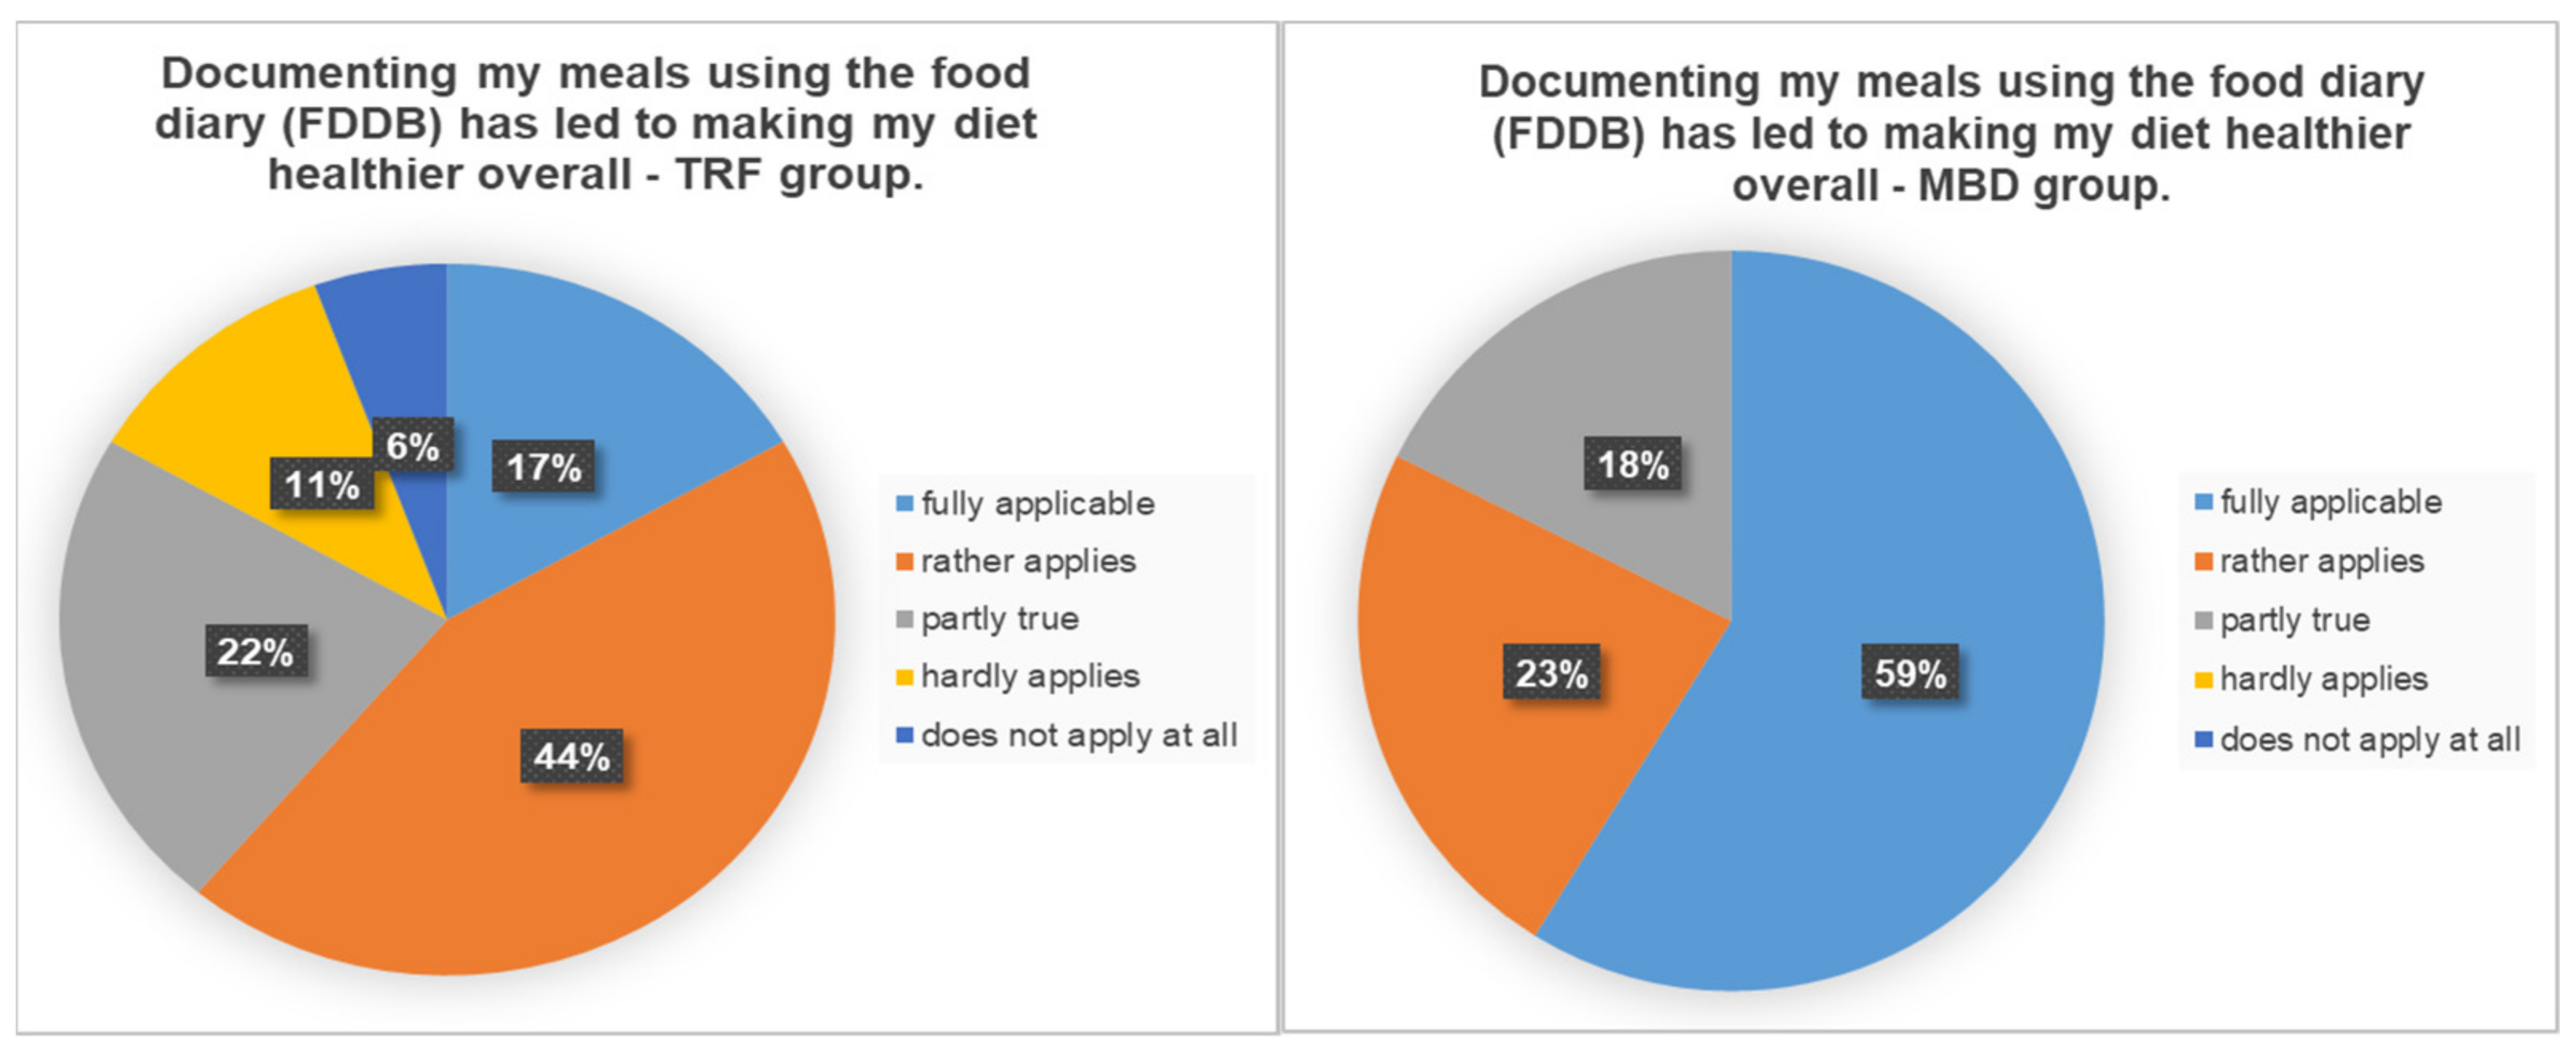
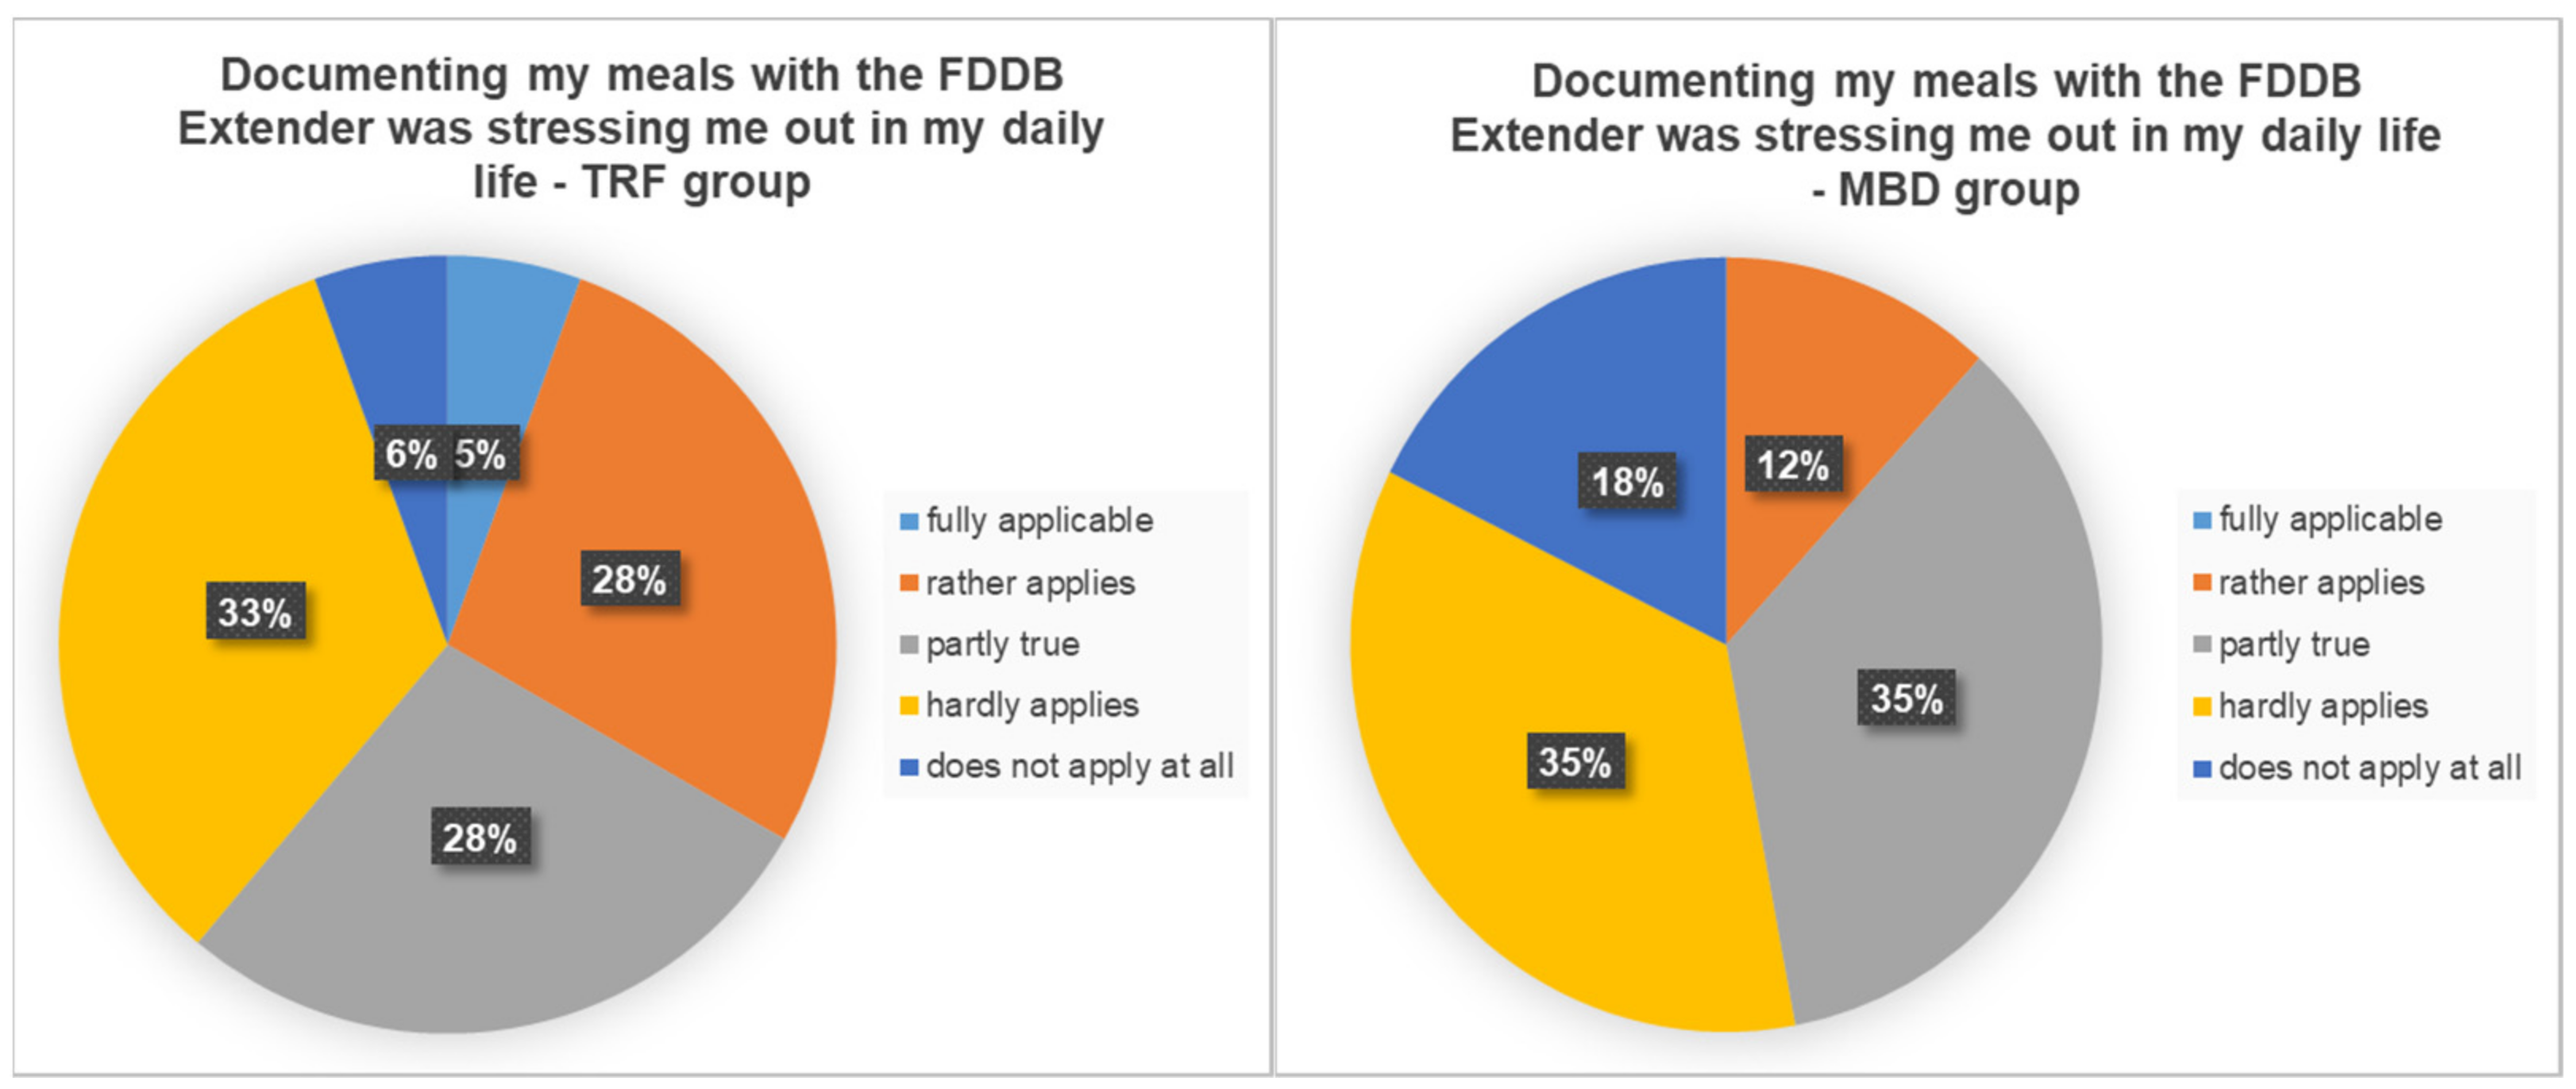
3.5. Questionnaire
4. Discussion
5. Limitations
6. Conclusions
Supplementary Materials
Author Contributions
Funding
Institutional Review Board Statement
Informed Consent Statement
Data Availability Statement
Acknowledgments
Conflicts of Interest
Abbreviations
| BMI | body mass index |
| BW | body weight |
| BF% | body fat percentage |
| CER | continuous energy restriction |
| FM | fat mass |
| HC | hip circumference |
| LBM | lean body mass |
| MBD | macronutrient based diet |
| OECD | Organisation for Economic Co-operation and Development |
| TRF | time-restricted feeding |
| WC | waist circumference |
References
- Loerke, S. Obesity and the Economics of Prevention; OECD: Paris, France, 2010. [Google Scholar]
- Shai, I.; Schwarzfuchs, D.; Henkin, Y.; Shahar, D.R.; Witkow, S.; Greenberg, I.; Golan, R.; Fraser, D.; Bolotin, A.; Vardi, H.; et al. Weight Loss with a Low-Carbohydrate, Mediterranean, or Low-Fat Diet. N. Engl. J. Med. 2008, 359, 229–241. [Google Scholar] [CrossRef] [Green Version]
- Mancini, J.G.; Filion, K.B.; Atallah, R.; Eisenberg, M.J. Systematic Review of the Mediterranean Diet for Long-Term Weight Loss. Am. J. Med. 2016, 129, 407–415. [Google Scholar] [CrossRef] [Green Version]
- Soenen, S.; Bonomi, A.G.; Lemmens, S.G.; Scholte, J.; Thijssen, M.A.; van Berkum, F.; Westerterp-Plantenga, M.S. Relatively high-protein or ‘low-carb’ energy-restricted diets for body weight loss and body weight maintenance? Physiol. Behav. 2012, 107, 374–380. [Google Scholar] [CrossRef] [PubMed]
- Gardner, C.D.; Trepanowski, J.F.; Del Gobbo, L.C.; Hauser, M.E.; Rigdon, J.; Ioannidis, J.P.; Desai, M.; King, A.C. Effect of Low-Fat vs Low-Carbohydrate Diet on 12-Month Weight Loss in Overweight Adults and the Association With Genotype Pattern or Insulin Secretion: The DIETFITS Randomized Clinical Trial. JAMA 2018, 319, 667–679. [Google Scholar] [CrossRef] [PubMed]
- Bueno, N.B.; De Melo, I.S.V.; De Oliveira, S.L.; da Rocha Ataide, T. Very-low-carbohydrate ketogenic diet v. low-fat diet for long-term weight loss: A meta-analysis of randomised controlled trials. Br. J. Nutr. 2013, 110, 1178–1187. [Google Scholar] [CrossRef] [PubMed] [Green Version]
- Aragon, A.A.; Schoenfeld, B.J.; Wildman, R.; Kleiner, S.; VanDusseldorp, T.; Taylor, L.; Earnest, C.P.; Arciero, P.J.; Wilborn, C.; Kalman, D.S.; et al. International society of sports nutrition position stand: Diets and body composition. J. Int. Soc. Sports Nutr. 2017, 14, 16. [Google Scholar] [CrossRef] [Green Version]
- Jensen, M.D.; Ryan, D.H.; Apovian, C.M.; Jamy, D.; Comuzzie, A.G.; Donato, K.A.; Hu, F.B.; Hubbard, V.S.; Jakicic, J.M.; Kushner, R.F.; et al. 2013 AHA/ACC/TOS Guideline for the Management of Overweight and Obesity in Adults. Circulation 2014, 129 (Suppl. 2), S102–S138. [Google Scholar] [CrossRef] [Green Version]
- Ismaeel, A.; Weems, S.; Willoughby, D.S. A Comparison of the Nutrient Intakes of Macronutrient-Based Dieting and Strict Dieting Bodybuilders. Int. J. Sport Nutr. Exerc. Metab. 2018, 28, 502–508. [Google Scholar] [CrossRef]
- Rynders, C.A.; Thomas, E.A.; Zaman, A.; Pan, Z.; Catenacci, V.A.; Melanson, E.L. Effectiveness of Intermittent Fasting and Time-Restricted Feeding Compared to Continuous Energy Restriction for Weight Loss. Nutrients 2019, 11, 2442. [Google Scholar] [CrossRef] [Green Version]
- Antoni, R.; Robertson, T.M.; Robertson, M.D.; Johnston, J. A pilot feasibility study exploring the effects of a moderate time-restricted feeding intervention on energy intake, adiposity and metabolic physiology in free-living human subjects. J. Nutr. Sci. 2018, 7, 1–6. [Google Scholar] [CrossRef] [Green Version]
- Chow, L.S.; Manoogian, E.N.C.; Alvear, A.; Fleischer, J.; Thor, H.; Dietsche, K.; Wang, Q.; Hodges, J.S.; Esch, N.; Malaeb, S.; et al. Time-Restricted Eating Effects on Body Composition and Metabolic Measures in Humans who are Overweight: A Feasibility Study. Obesity 2020, 28, 860–869. [Google Scholar] [CrossRef]
- Cienfuegos, S.; Gabel, K.; Kalam, F.; Ezpeleta, M.; Wiseman, E.; Pavlou, V.; Lin, S.; Oliveira, M.L.; Varady, K.A. Effects of 4- and 6-h Time-Restricted Feeding on Weight and Cardiometabolic Health: A Randomized Controlled Trial in Adults with Obesity. Cell Metab. 2020, 32, 366–378.e3. [Google Scholar] [CrossRef] [PubMed]
- Gabel, K.; Hoddy, K.K.; Haggerty, N.; Song, J.; Kroeger, C.M.; Trepanowski, J.F.; Panda, S.; Varady, A.K. Effects of 8-hour time restricted feeding on body weight and metabolic disease risk factors in obese adults: A pilot study. Nutr. Healthy Aging 2018, 4, 345–353. [Google Scholar] [CrossRef]
- Gill, S.; Panda, S. A Smartphone App Reveals Erratic Diurnal Eating Patterns in Humans that Can Be Modulated for Health Benefits. Cell Metab. 2015, 22, 789–798. [Google Scholar] [CrossRef] [PubMed] [Green Version]
- Schroder, J.D.; Falqueto, H.; Mânica, A.; Zanini, D.; de Oliveira, T.; de Sá, C.A.; Cardoso, A.M.; Manfredi, L.H. Effects of time-restricted feeding in weight loss, metabolic syndrome and cardiovascular risk in obese women. J. Transl. Med. 2021, 19, 1–11. [Google Scholar] [CrossRef] [PubMed]
- Wilkinson, M.J.; Manoogian, E.N.; Zadourian, A.; Lo, H.; Fakhouri, S.; Shoghi, A.; Wang, X.; Fleischer, J.G.; Navlakha, S.; Panda, S.; et al. Ten-hour time-restricted eating reduces weight, blood pressure, and atherogenic lipids in patients with metabolic syndrome. Cell Metab. 2020, 31, 92–104.e5. [Google Scholar] [CrossRef] [PubMed]
- Stratton, M.T.; Tinsley, G.M.; Alesi, M.G.; Hester, G.M.; Olmos, A.A.; Serafini, P.R.; Modjeski, A.S.; Mangine, G.T.; King, K.; Savage, S.N.; et al. Four Weeks of Time-Restricted Feeding Combined with Resistance Training Does Not Differentially Influence Measures of Body Composition, Muscle Performance, Resting Energy Expenditure, and Blood Biomarkers. Nutrients 2020, 12, 1126. [Google Scholar] [CrossRef]
- Moro, T.; Tinsley, G.; Bianco, A.; Marcolin, G.; Pacelli, Q.F.; Battaglia, G.; Palma, A.; Gentil, P.; Neri, M.; Paoli, A. Effects of eight weeks of time-restricted feeding (16/8) on basal metabolism, maximal strength, body composition, inflammation, and cardiovascular risk factors in resistance-trained males. J. Transl. Med. 2016, 14, 1–10. [Google Scholar] [CrossRef]
- Tinsley, G.; Forsse, J.S.; Butler, N.K.; Paoli, A.; Bane, A.A.; La Bounty, P.M.; Morgan, G.B.; Grandjean, P.W. Time-restricted feeding in young men performing resistance training: A randomized controlled trial. Eur. J. Sport Sci. 2017, 17, 200–207. [Google Scholar] [CrossRef]
- Tinsley, G.M.; Moore, M.; Graybeal, A.; Paoli, A.; Kim, Y.; Gonzales, J.U.; Harry, J.R.; VanDusseldorp, T.A.; Kennedy, D.N.; Cruz, M.R. Time-restricted feeding plus resistance training in active females: A randomized trial. Am. J. Clin. Nutr. 2019, 110, 628–640. [Google Scholar] [CrossRef] [Green Version]
- Manore, M.M. Exercise and the Institute of Medicine Recommendations for Nutrition. Curr. Sports Med. Rep. 2005, 4, 193–198. [Google Scholar] [CrossRef] [PubMed]
- Chantal, J.; Hercberg, S.; World Health Organization. Development of a new front-of-pack nutrition label in France: The five-colour Nutri-Score. Public Health Panor. 2017, 3, 712–725. [Google Scholar]
- Egnell, M.; Talati, Z.; Galan, P.; Andreeva, V.A.; Vandevijvere, S.; Gombaud, M.; Dréano-Trécant, L.; Hercberg, S.; Pettigrew, S.; Julia, C. Objective understanding of the Nutri-score front-of-pack label by European consumers and its effect on food choices: An online experimental study. Int. J. Behav. Nutr. Phys. Act. 2020, 17, 146. [Google Scholar] [CrossRef]
- Egnell, M.; Talati, Z.; Hercberg, S.; Pettigrew, S.; Julia, C. Objective Understanding of Front-of-Package Nutrition Labels: An International Comparative Experimental Study across 12 Countries. Nutrients 2018, 10, 1542. [Google Scholar] [CrossRef] [PubMed] [Green Version]
- Egnell, M.; Talati, Z.; Pettigrew, S.; Galan, P.; Hercberg, S.; Julia, C. Comparison of front-of-pack labels to help German consumers understand the nutritional quality of food products. Color-coded labels outperform all other systems. Ernahr. Umsch. 2019, 66, 76–84. [Google Scholar] [CrossRef]
- Harris, J.A.; Benedict, F.G. A Biometric Study of Human Basal Metabolism. Proc. Natl. Acad. Sci. USA 1918, 4, 370–373. [Google Scholar] [CrossRef] [Green Version]
- Helms, E.R.; Aragon, A.A.; Fitschen, P.J. Evidence-based recommendations for natural bodybuilding contest preparation: Nutrition and supplementation. J. Int. Soc. Sports Nutr. 2014, 11, 20. [Google Scholar] [CrossRef] [Green Version]
- Garthe, I.; Raastad, T.; Refsnes, P.E.; Koivisto-Mørk, A.E.; Sundgot-Borgen, J. Effect of Two Different Weight-Loss Rates on Body Composition and Strength and Power-Related Performance in Elite Athletes. Int. J. Sport Nutr. Exerc. Metab. 2011, 21, 97–104. [Google Scholar] [CrossRef]
- Jäger, R.; Kerksick, C.M.; Campbell, B.I.; Cribb, P.J.; Wells, S.D.; Skwiat, T.M.; Purpura, M.; Ziegenfuss, T.N.; Ferrando, A.A.; Arent, S.M.; et al. International Society of Sports Nutrition Position Stand: Protein and exercise. J. Int. Soc. Sports Nutr. 2017, 14, 20. [Google Scholar] [CrossRef] [Green Version]
- Kerksick, C.M.; Wilborn, C.D.; Roberts, M.D.; Smith-Ryan, A.; Kleiner, S.M.; Jäger, R.; Collins, R.; Cooke, M.; Davis, J.N.; Galvan, E.; et al. ISSN exercise & sports nutrition review update: Research & recommendations. J. Int. Soc. Sports Nutr. 2018, 15, 38. [Google Scholar] [CrossRef] [Green Version]
- RKI. Gesundheitsfördernde Körperliche Aktivität in der Freizeit bei Erwachsenen in Deutschland; RKI-Bib1 (Robert Koch-Institute): Berlin, Germany, 2017. [Google Scholar]
- Statistisches Bundesamt. Body-Mass-Index (im Durchschnitt und Verteilung der Bevölkerung auf Body-Mass-Index-Gruppen (in Prozent)): Gliederungsmerkmale: Jahre, Deutschland, Alter, Geschlecht, Body-Mass-Index. Available online: https://www.gbe-bund.de/gbe/pkg_isgbe5.prc_menu_olap?p_uid=gastd&p_aid=94975934&p_sprache=D&p_help=0&p_indnr=434&p_indsp=4057&p_ityp=H&p_fid= (accessed on 4 May 2021).
- Böhm, A.; Heitmann, B.L. The use of bioelectrical impedance analysis for body composition in epidemiological studies. Eur. J. Clin. Nutr. 2013, 67 (Suppl. 1), S79–S85. [Google Scholar] [CrossRef] [PubMed]
- Bosy-Westphal, A.; Jensen, B.; Braun, W.; Pourhassan, M.; Gallagher, D.; Müller, M.J. Quantification of whole-body and segmental skeletal muscle mass using phase-sensitive 8-electrode medical bioelectrical impedance devices. Eur. J. Clin. Nutr. 2017, 71, 1061–1067. [Google Scholar] [CrossRef] [PubMed]
- Frisard, M.I.; Greenway, F.L.; Delany, J.P. Comparison of Methods to Assess Body Composition Changes during a Period of Weight Loss. Obes. Res. 2005, 13, 845–854. [Google Scholar] [CrossRef] [PubMed] [Green Version]
- Kuriyan, R. Body composition techniques. Indian J. Med Res. 2018, 148, 648–658. [Google Scholar] [CrossRef] [PubMed]
- Lemos, T.; Gallagher, D. Current body composition measurement techniques. Curr. Opin. Endocrinol. Diabetes Obes. 2017, 24, 310–314. [Google Scholar] [CrossRef]


| Parameter | TRF (n = 18) | MBD (n = 17) | p-Value |
|---|---|---|---|
| Participants | 18 | 17 | |
| Male | 8 | 6 | |
| Female | 10 | 11 | |
| Age (years) | 27.9 ± 5.3 | 27.4 ± 5.8 | 0.754 |
| Height (cm) | 173.5 ± 10.2 | 170.4 ± 8.1 | 0.329 |
| Body weight (kg) | 80.0 ± 17.1 | 74.9 ± 12.0 | 0.314 |
| Body mass index (kg/m2) | 26.3 ± 3.0 | 25.7 ± 3.3 | 0.628 |
| Fat mass (kg) | 22.8 ± 6.4 | 21.5 ± 6.4 | 0.549 |
| Fat mass (%) | 28.2 ± 3.4 | 28.5 ± 5.5 | 0.862 |
| Lean body mass (kg) | 57.2 ± 11.5 | 53.4 ± 8.4 | 0.272 |
| Waist circumference (cm) | 80.6 ± 11.8 | 78.7 ± 10.5 | 0.626 |
| Hip circumference (cm) | 102.8 ± 6.3 | 101.1 ± 6.1 | 0.423 |
| Resistance training (days/week) | 2.2 ± 1.0 | 2.2 ± 1.3 | 0.766 |
| Endurance training (days/week) | 0.6 ± 0.9 | 1.2 ± 1.6 | 0.198 |
| Classes (days/week) | 1.1 ± 1.2 | 0.8 ± 1.1 | 0.520 |
| Total training frequencies (days/week) | 3.7 ± 1.5 | 4.2 ± 1.6 | 0.386 |
| Macronutrient | TRF | MBD | p-Value |
|---|---|---|---|
| Kilocalories (kcal/day) | 1801.0 ± 421.5 | 1736.0 ± 419.2 | 0.562 |
| Carbohydrate (kcal/day) | 819.0 ± 185.4 (45.5 ± 3.4%) | 818.0 ± 226.6 (47.1 ± 4.5%) | 0.990 |
| Fat (kcal/day) | 558.0 ± 172.7 (30.9 ± 4.6%) | 484.0 ± 118.6 (27.9 ± 3.9%) | 0.154 |
| Protein (kcal/day) | 423.0 ± 122.7 (23.5 ± 3.7%) | 433.0 ± 124.5 (24.8 ± 2.9%) | 0.881 |
Publisher’s Note: MDPI stays neutral with regard to jurisdictional claims in published maps and institutional affiliations. |
© 2021 by the authors. Licensee MDPI, Basel, Switzerland. This article is an open access article distributed under the terms and conditions of the Creative Commons Attribution (CC BY) license (https://creativecommons.org/licenses/by/4.0/).
Share and Cite
Isenmann, E.; Dissemond, J.; Geisler, S. The Effects of a Macronutrient-Based Diet and Time-Restricted Feeding (16:8) on Body Composition in Physically Active Individuals—A 14-Week Randomised Controlled Trial. Nutrients 2021, 13, 3122. https://doi.org/10.3390/nu13093122
Isenmann E, Dissemond J, Geisler S. The Effects of a Macronutrient-Based Diet and Time-Restricted Feeding (16:8) on Body Composition in Physically Active Individuals—A 14-Week Randomised Controlled Trial. Nutrients. 2021; 13(9):3122. https://doi.org/10.3390/nu13093122
Chicago/Turabian StyleIsenmann, Eduard, Joshua Dissemond, and Stephan Geisler. 2021. "The Effects of a Macronutrient-Based Diet and Time-Restricted Feeding (16:8) on Body Composition in Physically Active Individuals—A 14-Week Randomised Controlled Trial" Nutrients 13, no. 9: 3122. https://doi.org/10.3390/nu13093122
APA StyleIsenmann, E., Dissemond, J., & Geisler, S. (2021). The Effects of a Macronutrient-Based Diet and Time-Restricted Feeding (16:8) on Body Composition in Physically Active Individuals—A 14-Week Randomised Controlled Trial. Nutrients, 13(9), 3122. https://doi.org/10.3390/nu13093122